
Validation of a clinical blood-based decision aid to guide immunotherapy treatment in patients with non-small cell lung cancer
Abstract
BACKGROUND:
The widespread introduction of immunotherapy in patients with advanced non-small cell lung cancer (NSCLC) has led to durable responses but still many patients fail and are treated beyond progression.
OBJECTIVE:
This study investigated whether readily available blood-based tumor biomarkers allow accurate detection of early non-responsiveness, allowing a timely switch of therapy and cost reduction.
METHODS:
In a prospective, observational study in patients with NSCLC treated with nivolumab or pembrolizumab, five serum tumor markers were measured at baseline and every other week. Six months disease control as determined by RECIST was used as a measure of clinical response. Patients with a disease control < 6 months were deemed non-responsive. For every separate tumor marker a criterion for predicting of non-response was developed. Each marker test was defined as positive (predictive of non-response) if the value of that tumor marker increased at least 50% from the value at baseline and above a marker dependent minimum value to be determined. Also, tests based on combination of multiple markers were designed. Specificity and sensitivity for predicting non-response was calculated and results were validated in an independent cohort. The target specificity of the test for detecting non-response was set at > 95%, in order to allow its safe use for treatment decisions.
RESULTS:
A total of 376 patients (training cohort: 180, validation cohort: 196) were included in our analysis. Results for the specificity of the single marker tests in the validation set were CEA: 98·3% (95% CI: 90·9–100%), NSE: 96·5% (95% CI: 87·9–99·6%), SCC: 96·5% (95% CI: 88·1–99·6%), Cyfra21·1 : 91.8% (95% CI: 81·9–97·3%), and CA125 : 86·0% (95% CI: 74·2–93·7%). A test based on the combination of Cyfra21.1, CEA and NSE accurately predicted non-response in 32.3% (95% CI 22.6–43.1%) of patients 6 weeks after start of immunotherapy. Survival analysis showed a significant difference between predicted responders (Median PFS: 237 days (95% CI 184–289 days)) and non-responders (Median PFS: 58 days (95% CI 46–70 days)) (p < 0.001).
CONCLUSIONS:
Serum tumor marker based tests can be used for accurate detection of non-response in NSCLC, thereby allowing early and safe discontinuation of immunotherapy in a significant subset of patients.
1Introduction
Immune checkpoint based therapies for lung cancer have changed the therapeutic landscape of and survival from non-small cell lung cancer (NSCLC) [1–3]. Unfortunately, still a limited number of patients respond to immune checkpoint based treatment and non-responsiveness remains a clinical challenge [1, 4]. Therefore, treatment monitoring in order to detect non-responsiveness is of key importance and rapid detection of non-responsiveness potentially allows a prompt next in line treatment initiation avoiding unnecessary side effects and costs.
For NSCLC follow-up several circulating tumor biomarker are available [5–7]. Most biomarkers available in clinical practice have not been validated as monitoring tools [6, 8]. Tumor markers readily available at medical laboratories and potentially useful to monitor NSCLC treatment response include CA125, carcinoembryonic antigen (CEA), cytokeratin 19 fragments (Cyfra 21·1), neuron-specific enolase (NSE), and squamous cell carcinoma antigen (SCC) [9–11]. Though evidence supports the clinical application of some of these tumor biomarkers for lung cancer, no clear guidance is available [5, 7, 9, 12, 13]. The interpretation of these tumor biomarkers, when used for monitoring a specific cancer treatment, is therefore generally based on expert opinion and personal experience.
Recently, a method and software package, called ReMarker, was developed to assess the applicability of tumor marker changes after start of treatment in the response assessment [14]. We used this application to design and validate biomarker-response based tests that allow an accurate and early detection of non-responsiveness to immunotherapy for patients with NSCLC. This would allow early discontinuation of ineffective therapy and provide a window of opportunity for initation of subsequent other treatment opportunities. Besides, it would reduce potential side effects and costs. Our aim was to define and clinically validate an early response tool that accurately predicts non-response and can be easily applied in daily clinical practice based on changes in tumor markers during therapy.
2Methods
2.1Study population
In a prospective, observational study, patients with NSCLC treated with nivolumab or pembrolizumab were included. Serum tumor markers CA125, CEA, Cyfra 21·1, NSE, and SCC were measured. Using the data on clinical outcome a test for every separate tumor marker was designed: our aim was to design and optimize a test that identifies non-responders (as determined by RECIST at six months) as early as six weeks after starting treatment based on their serum marker values. Each such test was defined as positive if the value of that tumor marker met two criteria: (i) elevation of 50% compared to baseline and (ii) above a minimum value. A training cohort was used to determine the optimal minimum value for each tumor marker. An independent validation cohort was used to validate the resulting tumor marker tests. Also the performance of combining the results of the individual tumor marker tests were evaluated.
In this single-center study all patients with NSCLC who started their treatment between March 2013 and September 2018 in The Netherlands Cancer Institute were included. Follow-up was available until January 2019. All consecutive patients receiving immunotherapy in a variety of settings, such as routine care, early access, compassionate use program, and clinical trials, were treated according to corresponding protocols. Patient criteria for receiving nivolumab treatment were previously described [4] and can also be found in the supplemental material, as are the pembrolizumab criteria. If a patient had received immunotherapy in two different treatment lines, the initial treatment line was taken. Tumor markers were measured at baseline and prior to each consecutive cycle together with other routine blood assessment tests as standard of care. The monitoring of response was done with a CT scan before start of treatment, and after 6 weeks, 3 months and every 3 months thereafter. Response Evaluation Criteria in Solid Tumors (RECIST) 1.1 were used, accordingly progressive disease (PD), stable disease (SD), and partial response (PR) [15]. Patients who were progressive before the endpoint of six months, were classified as having no clinical benefit (NCB), as previous described in Rizvi et al. [16]). Our study was approved by the local medical ethical committee(PTC NKI-AvL, NL45524.031.13), patient privacy committee and performed according to the institutional patient privacy protocols.
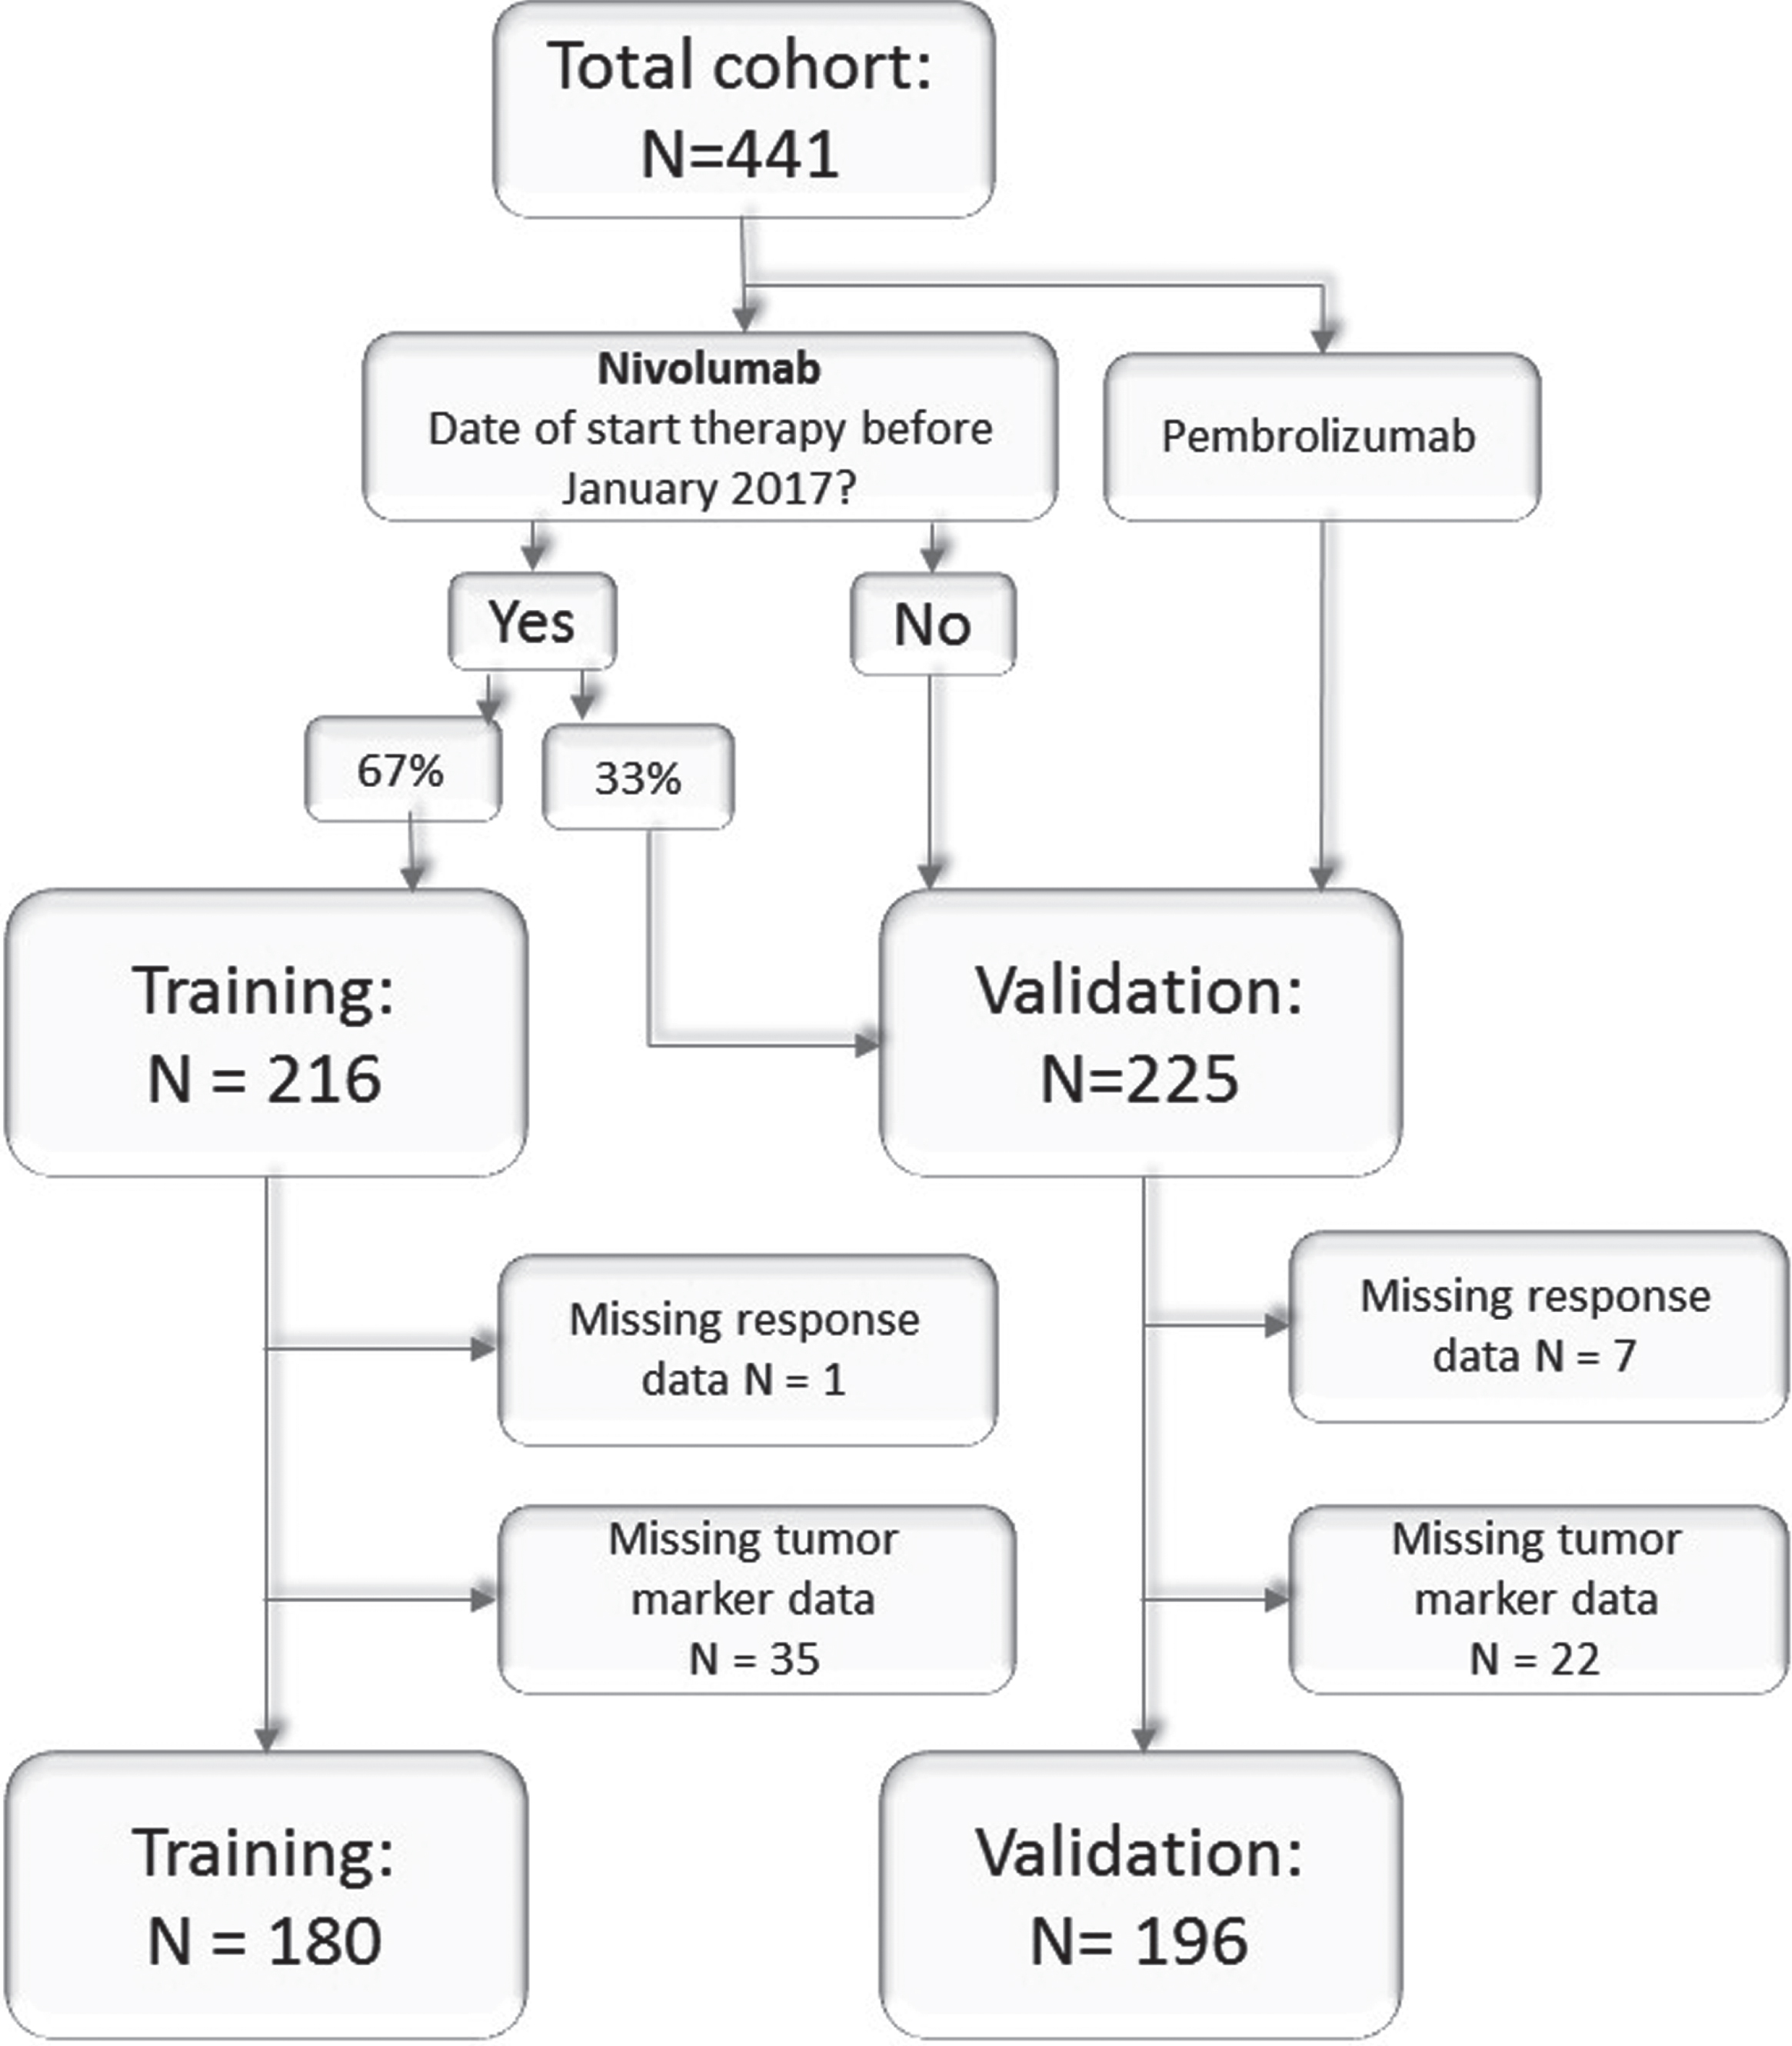
In January 2017 all patients who had been treated with nivolumab at that time were randomly assigned to the training or validation cohort in a 2:1 ratio (Fig. 1), as described in the sample size calculation (supplemental material). The training cohort was used to make and refine the ReMarker application (see below). After this randomization, no more patients were added to or removed from this training cohort. The validation cohort consisted of patients who were initially randomized to the validation cohort, and those who started their nivolumab treatment after January 2017 or who were treated with pembrolizumab, up to a 1:1 ratio.
Fig. 1
Consort chart. All patients treated with immunotherapy as second or higher line in the training and validation cohort.
2.2Design of tumor marker test
Analysis of the obtained serum samples were performed on a daily (CA125,CEA, Cyfra 21·1, and NSE) or twice weekly (SCC) basis. CA125, CEA, Cyfra 21·1, and NSE were measured using a Cobas 6000 system (Roche diagnostics) and SCC was measured on a Kryptor system (Thermo Fisher), both according to the manufacturer’s instructions. The applied reference ranges for the tumor markers were < 20 U/ml for CA125 (< 35 U/ml for premenopausal females), < 6μg/L for CEA, < 1·9μg/L for Cyfra 21·1, < 12·5μg/L for NSE and < 2·0μg/L and < 1·5μg/L for SCC for males and females, respectively.
The application ReMarker was used to study multiple time points and multiple cut-offs. The correlation to clinical response was visualized in Biomarker Response Characteristic plots (BReC plots) (Fig. S1) [14].
The baseline measurement was defined as minus 3 weeks until 0 weeks before start of treatment. A follow-up time point of 6 weeks was designated as primary optimization follow-up time, since in our practice this is the first clinical evaluation moment for response evaluation. This follow-up time point was defined as a measurement 5 or 6 weeks (±3 days) after start of treatment. If there was more than one measurement in one of these periods, the latest measurement was taken. The training set was used to optimize the test per single tumor marker for the prediction of non-response, which was defined as PD, NCB or deceased after six months of immunotherapy treatment. The other patients were classified as responders.
The following factors were taken into consideration for the design (and are also explained in Table S1): (I + II) In order to obtain an easy-to-calculate test, we defined our test as positive (i.e. predictive for non-response) when the marker increased with 50% from baseline and was above the marker dependent minimum value (Fig. S1); (III) The minimum value criterion was applied to exclude patients with small biomarker increases at low concentrations that results in large relative increases thereby reducing the effect of (pre-) analytical and biological “noise”; (IV) The optimal minimum value per marker was determined by calculating the specificity and sensitivity (Fig. S2); (V) Minimum values yielding a specificity of≥97·5% in the training set per individual markers were considered a good cut-off; (VI) Minimum values yielding a sensitivity of > 20% were considered a good cut-off. An overview of the considerations can be found in Table S1.
For each tumor marker we chose a minimum value satisfying the criteria in the training cohort (Fig. S2). Then, in the validation cohort, the sensitivity, specificity, positive predicted value (PPV) and negative predicted value (NPV), all with a 95% confidence interval, were calculated for the resulting test per tumor marker.
After the best test per single tumor marker had been determined, the combination of tumor markers was tested in the training cohort (Table S2). A test was considered positive if at least one of the tumor markers increased with 50% above baseline. Only the tests in the training cohort that fulfilled abovementioned criteria were validated in the validation cohort, again in terms of sensitivity, specificity, NPV, and PPV, all with a 95% confidence interval.
The performance of the tests was also investigated from week 2 until week 20, with biweekly tests, for both the training cohort and validation cohort in order to allow a more general application.
Survival analyses and cox-regression analyses were performed assessing the predictive value of the tests for overall survival (OS) and progression free survival (PFS). OS was defined as the number of days between the day of start of treatment and date of death, PFS as the number days between the day of start of treatment and date of progression or death, whichever came first.
SPSS (v25; SPSS, Chicago, USA) was used for the descriptive statistics. Descriptive statistics were expressed as mean±SD if data were normally distributed and as median (interquartile range) if data were non-normally distributed. Between group comparisons were performed using Mann-Whitney U tests, two sample unpaired t-tests or Chi-Squared tests. From all the patients with a false-positive result the medical record was checked for possible confounders. Furthermore, a small cohort with patients who were treated with pembrolizumab in first line(rather than second line) was also available for analysis.
3Results
3.1Patients
A total of 441 patients were included in our study, 216 in the training set and 225 in the validation set (Table 1). From these patients, 389 patients were treated with nivolumab and 52 with pembrolizumab. A total of 65 patients were excluded from our analysis due to missing data (Fig. 1). The training cohort consisted of who 53 responders and 127 non-responders. (Table S3). The validation cohort consisted of 69 responders and 127 non-responders. There was a significant difference between the responders and non-responders with regard to the PD-L1 status (p < 0·001).
Table 1
Patient characteristics of the full cohort All patients described have at least one baseline measurement and one follow-up measurement between week 2–20
| TRAINING | VALIDATION | |||||||
| Non-responders | Responders | Non-responders | Responders | Total | ||||
| (PD) | (PR &SD) | (PD) | (PR &SD) | |||||
| N = 127 | N = 53 | p-value | N = 127 | N = 69 | p-value | N = 376 | p-value | |
| Patient | ||||||||
| Male sex –no. (%) | 75(59·1) | 27(50·9) | 0·317 | 65(51·1) | 35(50·7) | 0·951 | 202(53·7) | 0·273 |
| Age (years) –mean (SD) | 62·8(SD: 10·727) | 64·3(SD: 8·190) | 0·375 | 62·9(SD: 8·9) | 62·1(SD: 8·9) | 0·513 | 62·9(SD: 9·5) | 0·542 |
| Smoking –no. (%) | 25(19·7) | 3(5·7) | 0·010 | 17(13·4) | 4(5·8) | 0·249 | 49(13·0) | 0·384 |
| Pack years –mean (SD) | 31·6(SD: 18·85) | 35·5(SD: 19·3) | 0·256 | 36·3(SD: 19·5) | 34·2(SD: 17·5) | 0·486 | 34·3(SD: 18·9) | 0·240 |
| WHO≥2–no.(%) | 20(15·7) | 3(5·7) | 0·047 | 13(10·2) | 3(4·3) | 0·156 | 39(10·4) | 0·148 |
| Tumor characteristics | ||||||||
| Pathology–no.(%) | ||||||||
| Adenocarcinoma | 94(74·0) | 33(62·3) | 84(66·1) | 39(56·5) | 0·285 | 250(66·5) | 0·176 | |
| Squamous | 22(17·3) | 13(24·5) | 0·2 86 | 24(18·9) | 18(26·0) | 77(20·5) | ||
| Other | 11(8·7) | 7(13·2) | 19 | 12(17·4) | 49(13·0) | |||
| Mutations–no.(%) | 2(2·0) | |||||||
| EGFR positive | 4(3·1) | 0 | 0·182 | 7(15·0) | 2(2.0) | 0·297 | 13(3·5) | 0·192 |
| KRAS positive | 37(29·1) | 15(28·3) | 0·827 | 41(32.3) | 25(36·2) | 0·923 | 118(31·4) | 0·020 |
| BRAF | 5(3·9) | 2(1·6) | 0·813 | 4(3.1) | 1(1·4) | 0·440 | 12(3·2) | 0·405 |
| ALK | 0 | 0 | - | 2(1.6) | 1(1·4) | 0·898 | 3(0·8) | 0·053 |
| PD-L1 –no.(%) 1 | ||||||||
| Unknown | 65(51·2) | 20(37·7) | 55(43·3) | 28(40·6) | 167(44·4) | |||
| PD-L1 < 1% | 38(61·3) | 17(51·5) | 0·358 | 40(55·6) | 14(33·3) | 0·022 | 109(52·2) | 0·129 |
| PD-L1 > 1% | 24(38·7) | 16(48·5) | 32(44·4) | 28(66·7) | 100(47·8) | |||
| PD-L1 > 50% | 8(12·9) | 10(18·9) | 0·025 | 17(23·6) | 24(57·1) | < 0·001 | 59(28·2) | < 0·001 |
| Brain Metastasis –no.(%) | 26(20·5) | 12(22·6) | 0·745 | 25(19·7) | 11(15·9) | 0·578 | 74(19·6) | 0·536 |
| Treatment | ||||||||
| Nivolumab | 127(100) | 53(100) | - | 104(81·9) | 51(73·9) | 0·190 | 335(89·1) | < 0·0 |
| Pembrolizumab | 0 | 0 | 0·465 | 23(18·1) | 18(26·1) | 0·400 | 41(10·9) | 01 |
| Line of treatment – | ||||||||
| no.(%) | 3(2·4) | 0 | 2(1·6) | 3(4·3) | 8(2·1) | |||
| 1st line | 90(70·9) | 40(75·5) | 99(78·0) | 54(78·3) | 283(75·3) | 0·304 | ||
| 2nd line | 33(26·9) | 12(22·6) | 26(20·5) | 11(15·9) | 82(21·8) | |||
| ≥2nd line | 74(58·3) | 0 | 59(46·5) | 0 | 133(35·4) | 0·026 | ||
| Deceased after 6 months | ||||||||
| Comorbidities | ||||||||
| Auto Immune Disease –no.(%) | 6(4·7) | 0 | 0·106 | 8(6·3) | 6(8·7) | 0·538 | 20(5·3) | 0·119 |
1Percentages shown are based on total known PD-L1 scores. Abbreviations: N: Number of patients; SD: Standard Deviation; no.: Number of patients, ECOG performance-status score: European Cooperative Oncology Group performance status score, this is a score ranging from 0 to 5, where 0 indicates no symptom, 1 indicates mild symptoms and above 1 indicates greater disability; EGFR: Epidermal Growth Factor Receptor; KRAS: Kirsten rat sarcoma viral oncogene; BRAF: v-raf murine sarcoma viral oncogene homolog B; ALK: Anaplastic Lymphoma Kinase; PD-L1: Programmed death ligand 1.
3.2Test design
The following test optimization minimum values were established for a test at 6 weeks: CA125 : 65 U/ml, CEA: 6μg/L, Cyfra 21·1 : 4μg/L, NSE: 20μg/L, and SCC: 3·5μg/L (Fig. S2). In the validation set, the specificity of CEA, NSE, SCC, Cyfra 21·1, and CA125 was 98·3% (95% CI: 90·9–100%), 96·5% (95% CI: 87·9–99·6%), 96·5% (95% CI: 88·1–99·6%), 91·8% (95% CI: 81·9–97·3%), and CA125 86·0% (95% CI: 74·2–93·7%) respectively (Table 2). Only the markers NSE and SCC showed a sensitivity below 20%. For SCC however, a small subset of patients with a squamous cell carcinoma showed an increase in the sensitivity of our test, without loss of specificity, from 6% (3·0–11·1%) to 15·4% (6·4 –31·2%) (Table S6). The test accuracy for tumor marker to predict non-response was comparable between week 2 and 20 (Fig. 2).
Table 2
Results of the training cohort and the tests validated in the validation cohort
| Test | Minimum value | Results training | Results validation | ||||
| Sensitivity | Specificity | PPV | Sensitivity | Specificity | PPV | ||
| Single marker test | |||||||
| CA125 | 65 U/ml | 21·7% | 97·9% | 94·7% | 25·0% | 86·0% | 71·4% |
| (13·4–32·1%) | (88·7–100%) | (74·0–99·9%) | (16·0–35·9%) | (74·2–93·7%) | (51·3–86·8%) | ||
| CEA | 6μg/L | 19·8% | 100% | 100% | 20·7% | 98·3% | 94·4% |
| (12·0–29·8%) | (92·8–100%) | (80·5–100%) | (12·6–31·1%) | (90·9–100%) | (72·7–99·9%) | ||
| 12μg/L | 15·1% | 100% | 100% | 16·1% | 98·4% | 93·3% | |
| (8·3–24·5%) | (92·8–100%) | (75·3–100%) | (9·1–25·5%) | (91·2–100%) | (68·1–99·8%) | ||
| Cyfra 21.1 | 4μg/L | 31·8% | 100% | 100% | 34·5% | 91·8% | 85·7% |
| (22·1–42·8%) | (92·8–100%) | (87·2–100%) | (24·6–45·5%) | (81·9–97·3%) | (69·7–95·2%) | ||
| 8μg/L | 23·5% | 100% | 100% | 25·3% | 95·1% | 88·0% | |
| (15·0–34·0%) | (92·8–100%) | (83·2–100%) | (16·6–35·8%) | (86·3–99·0%) | (68·8–97·5%) | ||
| NSE | 20μg/L | 13·3% | 100% | 100% | 12·7% | 96·5% | 83·3% |
| (6·8–22·5%) | (92·1–100%) | (71·5–100%) | (6·2–22·1%) | (87·9–99·6%) | (51·6–97·9%) | ||
| 40μg/L | 4·8% | 100% | 100% | 8·9% | 96·5% | 77·8% | |
| (1·3–11·9%) | (92·1–100%) | (39·8–100%) | (3·6–17·4%) | (88·0–99·6%) | (40·0–97·2%) | ||
| SCC | 3·5μg/L | 9·6% | 97·9% | 88·9 | 2·4% | 96·5% | 50% |
| (4·3–18·1%) | (88·9–100%) | (51·8–99·7%) | (0·3–8·5%) | (88·1–99·6%) | (6·7–93%) | ||
| Combinations | |||||||
| Cyfra 21·1 OR | Cyfra: 4μg/L | 38·4% | 100% | 100% | 40·2% | 91·8% | 81·8% |
| CEA | CEA: 6μg/L | (28·1–49·5%) | (92·8–100%) | (89·4–100%) | (29·9–51·3%) | (81·9–97·3%) | (64·5–93·0%) |
| Cyfra 21·1 OR | Cyfra: 4μg/L | 38·4% | 100% | 100% | 43·7% | 91·9% | 82·7% |
| CEA OR NSE | CEA: 6μg/L | (28·1–49·5%) | (92·8–100%) | (89·4–100%) | (33·1–54·7%) | (82·2–97·3%) | (66·3–93·4%) |
| NSE: 20μg/L | |||||||
| Cyfra 21·1 OR | Cyfra: 8μg/L | 30·2% | 100% | 100% | 28·7% | 95·1% | 89·3% |
| CEA | CEA: 12μg/L | (20·8–41·1%) | (92·8–100%) | (86·8–100%) | (19·5–39·43%) | (86·3–99·0%) | (71·8–97·8%) |
| Cyfra 21·1 OR | Cyfra: 8μg/L | 30·2% | 100% | 100% | 32·2% | 95·2% | 90·3% |
| CEA OR NSE | CEA: 12μg/L | (20·8–41·1%) | (92·8–100%) | (86·8–100%) | (22·6–43·1%) | (86·5–99·0%) | (40·7–59·3%) |
| NSE: 40μg/L | |||||||
Each marker test was defined as positive for the prediction of non-response if the value of that tumor marker met two criteria: (i) elevation of 50% compared to baseline and (ii) above a minimum value(second column in the table). All results, such as sensitivity, are given as a percentage (95% confidence interval). PVV: positive predicted value. μg/L: microgram per liter; U/ml: Units per milliliter.
Fig. 2
Test characteristics for week 2–20 in the validation cohort, shown as sensitivity and specificity per week. The horizontal as indicates the tests done every other week. Every time point displayed is that week and the week before (i.e. the time period for week 2 is week 1-2). If there was more than one measurement in this time period, the latest measurement was taken. The combination of markers were considered positive if at least one of the tumor markers had a positive test result. The two, straight lines indicate 20% and 95% respectively and are choosen for improved visibility. μg/L: microgram per liter; U/ml: Units per milliliter.
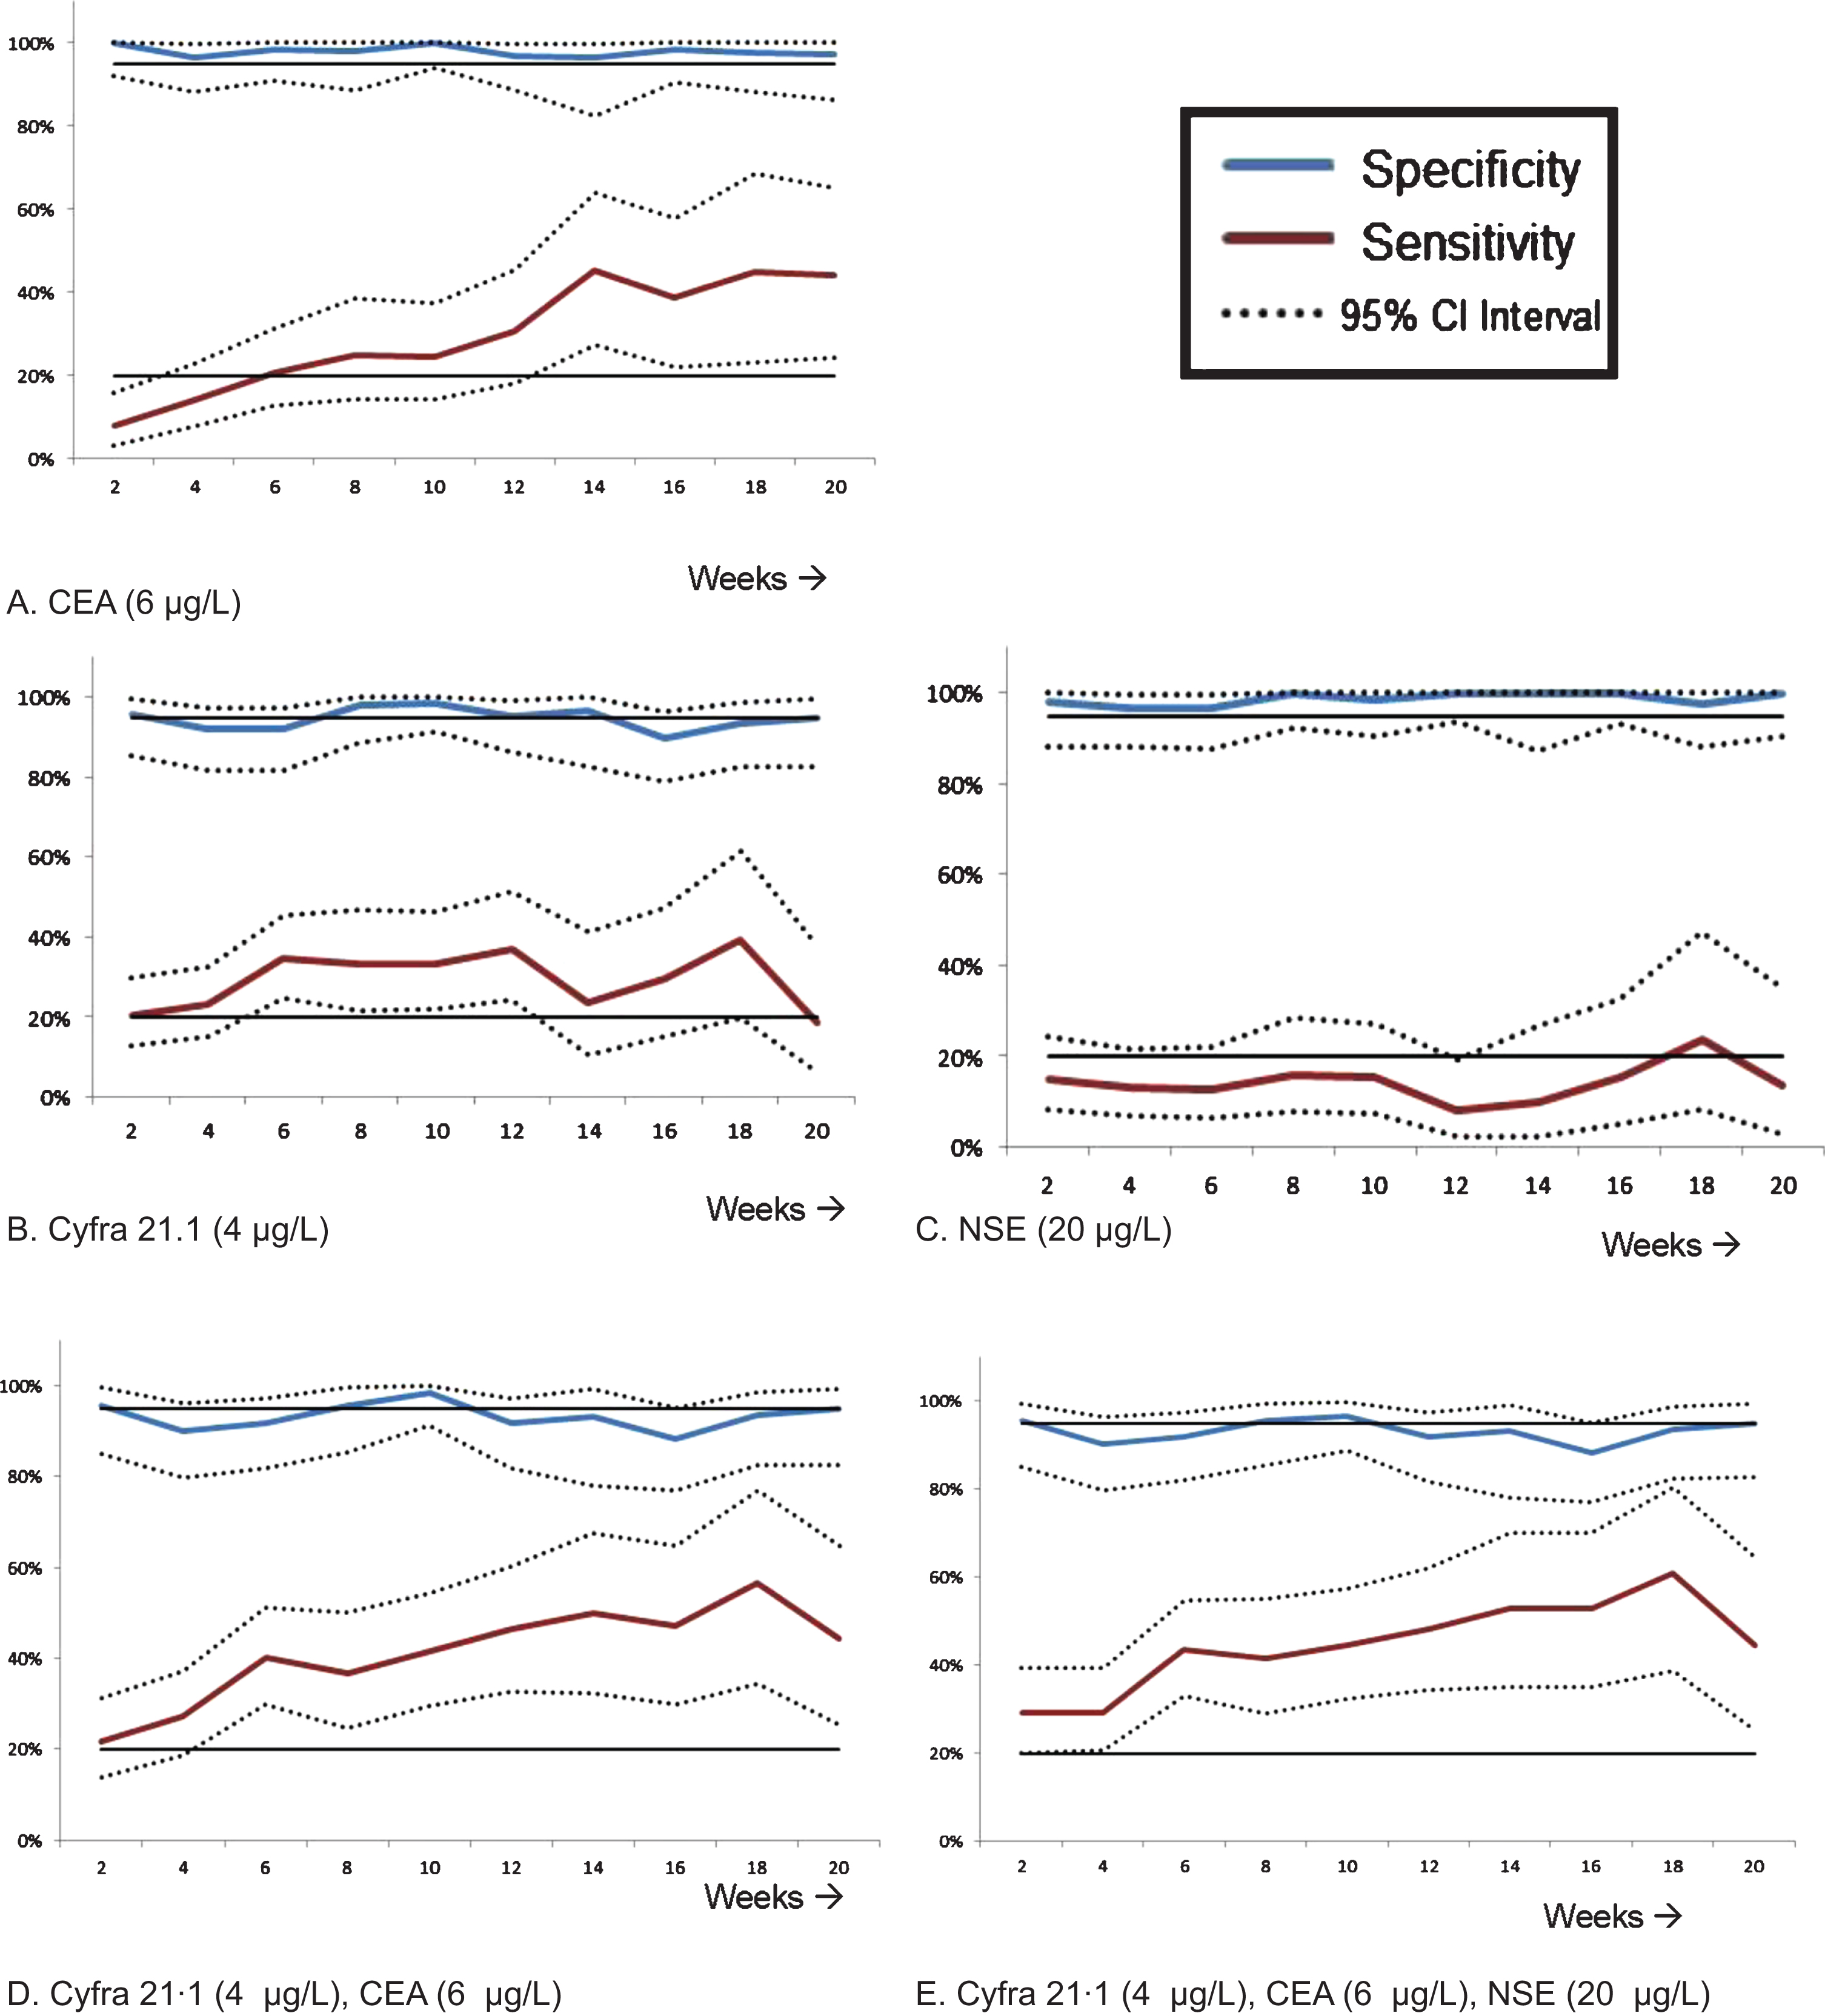
In the validation set the combination of Cyfra 21·1, CEA with or without NSE showed a specificity of 91·9% and 91·8% respectively and a sensitivity of 40·2–43·7% (Table 2). With these results, we decided to also validate a more stringent test by doubling the minimum value (Table S2). The specificity increased to 95·1% (86·3–99%) with NSE and 95·2% (86·5–99·0%) without NSE at the cost of a lower sensitivity (28·7–32·2%). The results of the 23 performed tests in the training set with different markers can be found in the supplemental material (Table S2 and Fig. S5). Also for the combination tests, we studied the same minimum value in other serial time points during treatment (week 2–week 20). The diagnostic performance of combined tumor biomarker tests for different follow-up are presented in Fig. 2.
3.3False positive analysis
With the test at 6 weeks there were in total 13 patients(3.5% of the total cohort) with a false-positive result (Table S5). In the total cohort, 9 patients showed a false-positive result for CA125. In five out of these 13 patients Cyfra 21·1 showed a false-positive result. Two out of these five patients had a PR at 6 months from which one patient actually had a pseudo progression at 6 weeks, as was confirmed with a CT-scan. The other patient had an active hyperthyroidism at the start of treatment, which might explain the increases of the tumor markers (up to 7012% for SCC). For the other two patients, no specific explanation was found (Table S5).
3.4Survival outcome
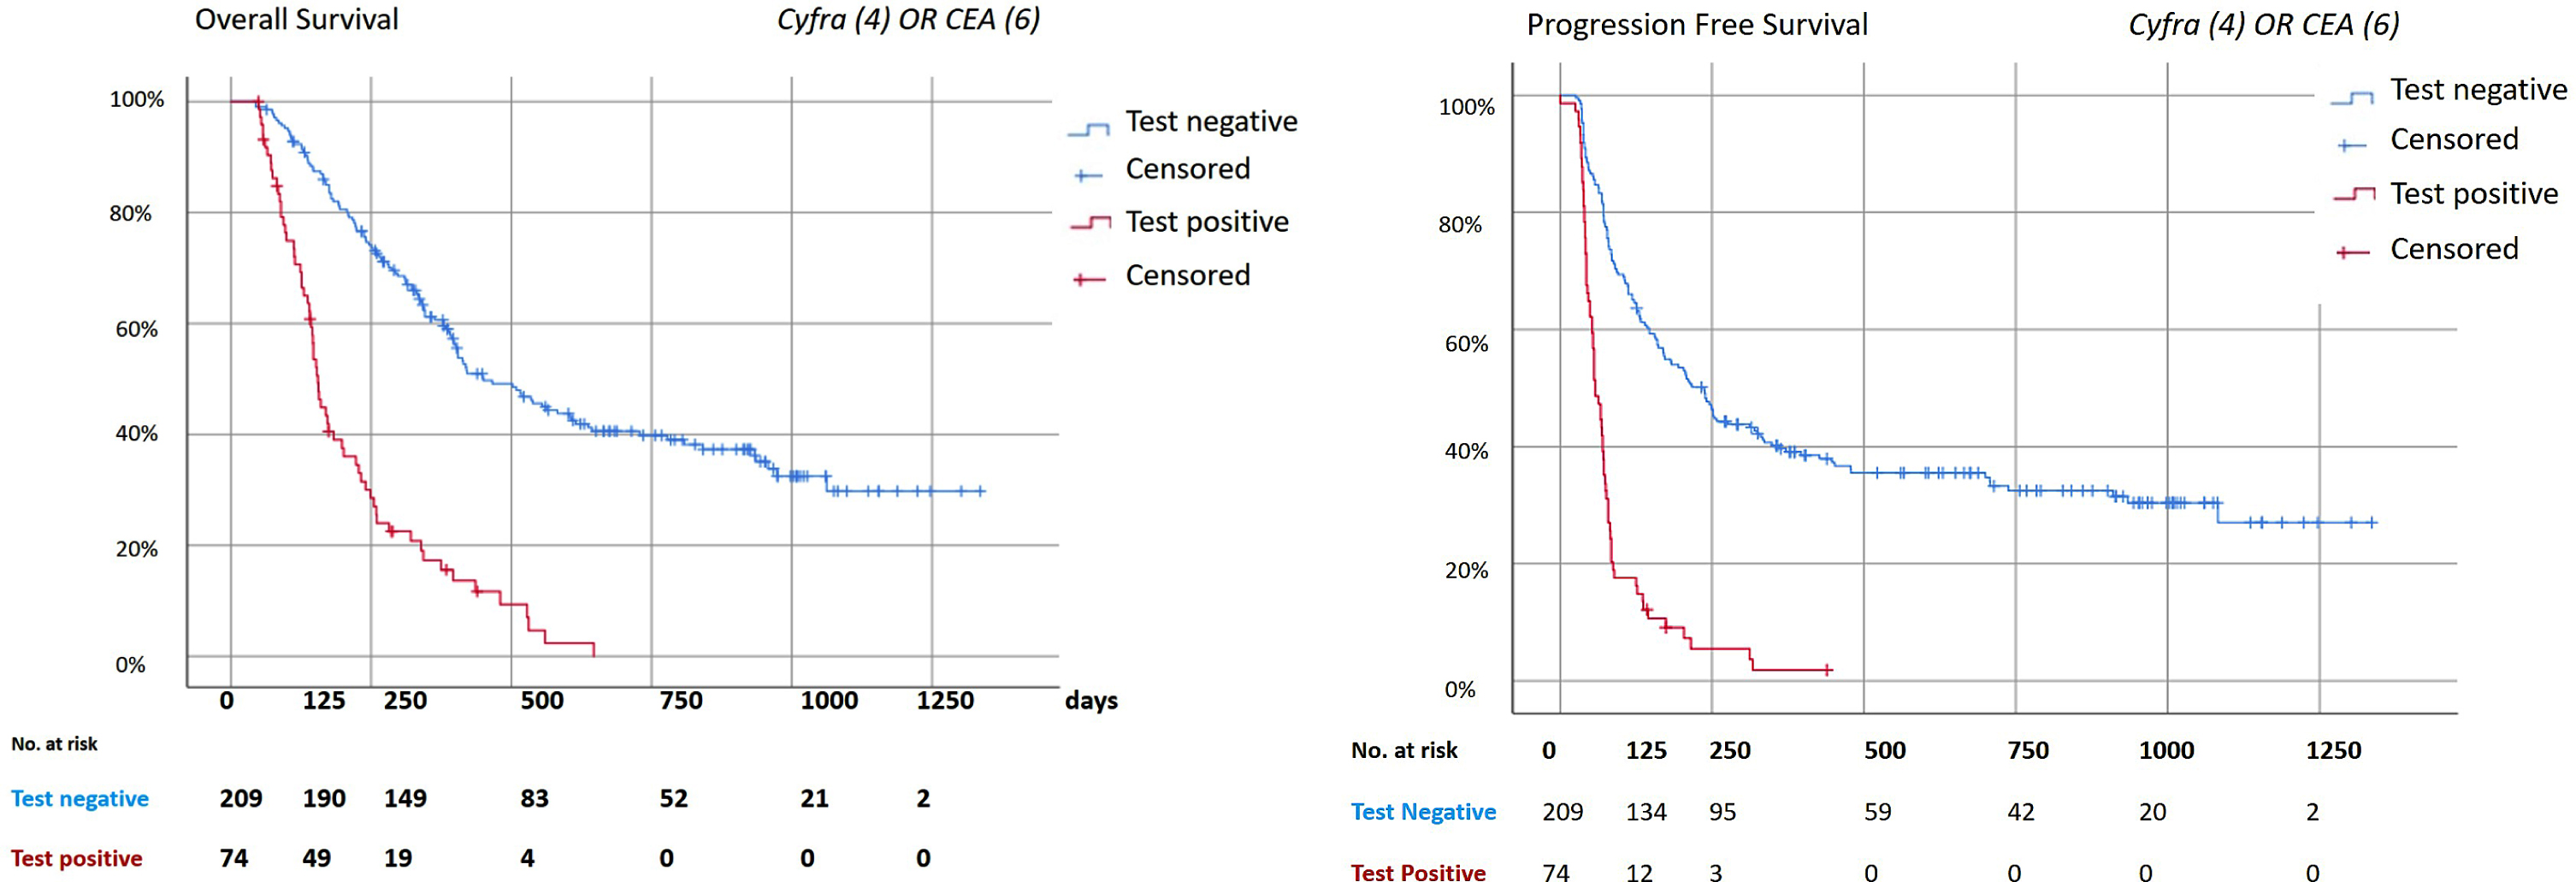
The median OS and PFS for the patients in the validation set were 363 days (95% CI 317–409 days) and 130 days (95% CI 98–162 days) respectively (Fig. 3). The median OS and PFS of patients depicted as non-responsive versus responsive were 153 days (95% CI 139–167) and 58 days (95% CI 46–70 days) versus 450 days (95% CI 347–553 days) and 237 days (95% CI 185–289) respectively (p < 0·001).
Fig. 3
Survival analysis. Kaplan Meier analysis for the combination of Cyfra (4μg/L) and CEA (6μg/L). The combination of markers were considered positive if at least one of the tumor markers had a positive test result. All the analysis were done with the patients who had a test at week 6, as described in table S3. The median follow-up time was 322 days (IQR: 157–606 days). Date of last follow-up was 28th of January, 2019. A: Overall Survival. Median overall survival: 363 days (95% CI 317–409 days). Median OS negative test: 450 days (95% CI 347–553 days); Positive test: 153 days (95% CI 139–167 days). Log Rank (Mantel-Cox): p < 0·001. B: Progression Free Survival. Median progression free survival (PFS) 130 days (95% CI 98–162days). Median PFS negative test: 237 days (95% CI 185–289). Median PFS positive test: 58 days (95% CI 46–70 days). Log rank (Mantel-Cox) p < 0·001.
3.5Pembrolizumab first line
In a small cohort of 31 patients who received pembrolizumab as first line treatment, an analysis was done. Results were comparable (Table S7 and S8).
4Discussion
With the introduction of immunotherapy for metastasized NSCLC and its limited efficacy more tailored treatment strategies are needed. As far as we know, this is the first study that describes how to use liquid biopsy data for early treatment decisions in patients without clinical benefit from immunotherapy. In this prospective, observational study cohort a serum tumor markers panel was clinically validated as an early response tool that accurately predicts non-response to immunotherapy. These results indicate that serum tumor markers can be used to identify patients in which treatment can be discontinued early safely because it is ineffective. This potentially results in lower risk of side effect, lower costs, and allows alternative treatment options, while the patient is still in a good condition.
A commonly used and investigated liquid biopsy biomarker is ctDNA, which derives from normal physiological tissue remodeling events, necrosis and/or apoptosis of cancer cells. [17–19] The study of Goldberg et al. [20] showed the dynamics of ctDNA during immunotherapy treatment. In this study all patients with confirmed PR showed a ctDNA drop of > 50%, suggesting this is a helpful tool for monitoring response during treatment, although the dynamics of ctDNA in patients with progressive disease were more dynamic. Also, the strictly individual patterns of mutations complicate implementation in general practice of ctDNA-based response assessment and moreover a technical standardization for ctDNA is not yet available [19]. On the contrary, tumor markers are widely used, measured and implemented in clinical practice for years, making them a good alternative as a potential liquid biopsy. There is some literature about the role of serum tumor markers to assess efficacy of systemic treatment of NSCLC. Noonan et al. [21] showed in their study in patients with a targetable driver mutation in a smaller analysis that 59% of these patients, mostly responders, showed an increase right after start of their treatment. In the majority of patients marker concentration in plasma normalized to the baseline value during treatment. This shows the possible relation between tumor response and the measured markers. Furthermore, in the recent article of Dal Bello et al. [13], they measured CEA, Cyfra 21·1, and NSE at multiple time points. Their aim was to use these tumor markers for the monitoring of response (PR and SD). With their designed test, a decrease of 20%, identified responders. Interestingly enough, they also found that their test yielded similar results in the first and the fourth cycle of nivolumab. However, the study did not provide a tool to use these markers in optimizing treatment strategies, neither did other studies [7]. Therefore, our dataset with more than 400 patients and serial tumor marker data is contributing to the development of a clinical tool.
The requirements of a tumor marker test for early treatment decisions are depending on the clinical application. The current standard of care is to treat all patients with immunotherapy with or without chemotherapy, depending on the PD-L1 status [22]. A high specificity is required to prevent discontinuation of treatment in patients with a potential benefit. This approach, was also advocated in a study on the usage of an electronic nose. De Vries et al. [23] were able to identify 24% of the non-responders at baseline by exhaled breath analysis. On the other hand, the test should have an added value. Therefore the percentage of patients who will not respond and have a positive test, in other words sensitivity, must be contributing to current standards (e.g. radiological response and clinical assessment). In this study, we aimed to find the right balance of these factors per individual and in combination of different tumor markers. Although not all individual markers showed a sufficient sensitivity (NSE and SCC), combining markers increases the sensitivity thereby optimizing its clinical utility.
Decisions during treatment are depending on radiological assessment and clinical performance; often treatment is continued despite the fact that the condition of the patient is deteriorating. In our cohort, the specificity of the CT-scan was 96·8% [4], but the therapy is only discontinued following confirmed radiological progression or in case of clinical deterioration. Besides, often no measurable lesions are available for radiological response assessment. Having established tumor markers as robust tool to establish non-responsiveness, we postulate that tumor markers can improve early treatment decision making. In the future, combining radiology and tumor markers, together with assessment of the clinical condition, will likely improve overall test accuracy.
Spikes are a well-known phenomenon seen in liquid biomarker research in patients with response [24, 25], which is also shown for immunotherapy [20]. However, in our study, spikes were not common (Fig. S6). Nevertheless, there were patients with a false-positive result. Renal failure, liver failure or (other) lung diseases are known causes for multiple different elevated tumor markers [26]. We did not see this in our cohorts, maybe due to the selection criteria of immunotherapy. What is more commonly known is the lack of accuracy of CA125. False positive results are often present in case of a serositis [27]. There was one patient with an active thyroiditis (Table S5A, Patient A) with extremely elevated tumor marker levels. We are not aware of data supporting the correlation of thyroiditis with tumor marker elevation. Our findings suggest that tumor marker tests should be treated with caution in case of an active thyroiditis.
A strength of this study is the homogeneous patient population with mainly≥2nd line NSCLC patients treated with single agent immune checkpoint inhibitors and the use of independent training and validation cohort, which makes it an robust analysis. However, there are a few limitations of our study to be considered. Firstly, therapeutic options are rapidly changing and patients are currently treated with immunotherapy as their first line of treatment [21]. We included a small analysis with first-line pembrolizumab patients, in order to assess the utility of the tests in the current standard of treatment. Mature data of a small cohort (n = 23) of patients, treated with first line pembrolizumab, was available and results were comparable. However, larger validation studies are warranted. Secondly, there training cohort consisted of patients who were treated with nivolumab only. We are uncertain if this might cause bias. Pembrolizumab and nivolumab are both PD-1 inhibitors and the validation results in the pembrolizumab cohort were comparable. Thirdly, in our study, we validated a minimum value instead of a percentage. These minimum values and reference values differ between different hospitals. However, all of the chosen minimum values are more or less multiplied by a round number between one and three (Fig. S2), allowing a relatively easy validation of these tests in other hospitals.
All in all, in this study we designed and validated tests with single and multiple serum based tumor markers for the early prediction of non-response. Based on our results, serum tumor marker based response monitoring can be used for clinical decision making in NSCLC treated with immunotherapy. Future studies are required to determine the added value in clinical practice.
Acknowledgments
This study was conducted without any external funding.
Author contributions
CONCEPTION: MM, VvdN, CMK, DvdB, JJvH, HHvR and MMvdH
DATA CURATION: MM, RH, RM, VvdN, ML, DvdB, HHvR and MMvdH
ANALYSIS OF DATA: MM, RH, RM, VvdN, ML, DvdB, JJvH, HHvR and MMvdH
PREPARATION OF THE MANUSCRIPT: MM, RH, RM, VvdN, CMK, HHvR and MMvdH
REVISION FOR IMPORTANT INTELLECTUAL CONTENT: MM, VvdN, CMK, DvdB, PB, HHvR and MMvdH
SUPERVISION: CMK, DvdB, JJvH, PB, HHvR and MMvdH
Conflict of interest
MM has no conflict of interest to report; RH has no conflict of interest to report; RM has no conflict of interest to report; VvdN has no conflict of interest to report; ML has no conflict of interest to report; CMK has no conflict of interest to report; DvdB has received various grants for research, while not being the PI, outside the submitted work; JJtH has no conflict of interest to report; PB reports grants from BMS, grants from MSD, grants from Pfizer, grants from Roche, other from BI, outside the submitted work; HvR reports other from Huvaros, outside the submitted work; MMvdH has no conflict of interest to report.
Supplementary material
[1] The supplementary material is available in the electronic version of this article: https://dx.doi.org/10.3233/TUB-211504.
References
[1] | Brahmer J. , Reckamp K.L. , Baas P. , Crino L. , Eberhardt W.E. , Poddubskaya E. , et al., Nivolumab versus Docetaxel in Advanced Squamous-Cell Non-Small-Cell Lung Cancer, The New England Journal of Medicine 373: (2) ((2015) ), 123–135. |
[2] | Borghaei H. , Paz-Ares L. , Horn L. , Spigel D.R. , Steins M. , Ready N.E. , et al., Nivolumab versus Docetaxel in Advanced Nonsquamous Non-Small-Cell Lung Cancer, The New England Journal of Medicine 373: (17) ((2015) ), 1627–1639. |
[3] | Reck M. , Rodriguez-Abreu D. , Robinson A.G. , Hui R. , Csoszi T. , Fulop A. , et al., Pembrolizumab versus Chemotherapy for PD-L1-Positive Non-Small-Cell Lung Cancer, The New England Journal of Medicine 375: (19) ((2016) ), 1823–1833. |
[4] | Schouten R.D. , Muller M. , de Gooijer C.J. , Baas P. and van den Heuvel M. , Real life experience with nivolumab for the treatment of non-small cell lung carcinoma: Data from the expanded access program and routine clinical care in a tertiary cancer centre—The Netherlands Cancer Institute, Lung Cancer 126: ((2018) ), 210–216. |
[5] | Gion M. , Trevisiol C. , Rutjes A.W.S. , Rainato G. and Fabricio A.S.C. , Circulating tumor markers: a guide to their appropriate clinical use Comparative summary of recommendations from clinical practice guidelines (PART 3), The International Journal of Biological Markers 32: (2) ((2017) ), e147–e81. |
[6] | Isaksson S. , Jonsson P. , Monsef N. , Brunnstrom H. , Bendahl P.O. , Jonsson M. , et al., CA 19-9 and CA 125 as potential predictors of disease recurrence in resectable lung adenocarcinoma, PloS one 12: (10) ((2017) ), e0186284. |
[7] | Holdenrieder S. , Wehnl B. , Hettwer K. , Simon K. , Uhlig S. and Dayyani F. , Carcinoembryonic antigen and cytokeratin-19 fragments for assessment of therapy response in non-small cell lung cancer: a systematic review and meta-analysis, British Journal of Cancer 116: (8) ((2017) ), 1037–1045. |
[8] | Shirasu H. , Ono A. , Omae K. , Nakashima K. , Omori S. , Wakuda K. , et al., CYFRA 21-1 predicts the efficacy of nivolumab in patients with advanced lung adenocarcinoma, Tumour biology: the journal of the International Society for Oncodevelopmental Biology and Medicine 40: (2) ((2018) ), 1010428318760420. |
[9] | Holdenrieder S. , Biomarkers along the continuum of care in lung cancer,S, Scandinavian Journal of Clinical and Laboratory Investigation Supplementum 245: ((2016) ), 40–5. |
[10] | Harmsma M. , Schutte B. and Ramaekers F.C. , Serum markers in small cell lung cancer: opportunities for improvement, Biochimica et biophysica acta 1836: (2) ((2013) ), 255–272. |
[11] | Li X. , Asmitananda T. , Gao L. , Gai D. , Song Z. , Zhang Y. , et al., Biomarkers in the lung cancer diagnosis: a clinical perspective, Neoplasma 59: (5) ((2012) ), 500–507. |
[12] | Holdenrieder S. , Pagliaro L. , Morgenstern D. and Dayyani F. , Clinically Meaningful Use of Blood Tumor Markers in Oncology, BioMed Research International 2016: ((2016) ), 9795269. |
[13] | Dal Bello M.G. , Filiberti R.A. , Alama A. , Orengo A.M. , Mussap M. , Coco S. , et al., The role of CEA, CYFRA21-1 and NSE in monitoring tumor response to Nivolumab in advanced non-small cell lung cancer (NSCLC) patients, Journal of Translational Medicine 17: (1) ((2019) ), 74. |
[14] | Moritz R. , Muller M. , Korse C.M. , van den Broek D. , Baas P. , van den Noort V. , et al., Diagnostic validation and interpretation of longitudinal circulating biomarkers using a biomarker response characteristic plot, Clinica chimica acta; International Journal of Clinical Chemistry 487: ((2018) ), 6–14. |
[15] | Eisenhauer E.A. , Therasse P. , Bogaerts J. , Schwartz L.H. , Sargent D. , Ford R. , et al., New response evaluation criteria in solid tumours: revised RECIST guideline (version 1.1), European Journal of Cancer (Oxford, England: : 1990) 45: (2) ((2009) ), 228–2247. |
[16] | Rizvi N.A. , Hellmann M.D. , Snyder A. , Kvistborg P. , Makarov V. , Havel J.J. , et al., Mutational landscape determines sensitivity to PD-1 blockade in non–small cell lung cancer, 348: (6230) ((2015) ), 124–128. |
[17] | Corcoran R.B. and Chabner B.A. , Application of Cell-free DNA Analysis to Cancer Treatment, The New England Journal of Medicine 379: (18) ((2018) ), 1754–1765. |
[18] | Wan J.C.M. , Massie C. , Garcia-Corbacho J. , Mouliere F. , Brenton J.D. , Caldas C. , et al., Liquid biopsies come of age: towards implementation of circulating tumour DNA, Nat Rev Cancer 17: (4) ((2017) ), 223–238. |
[19] | Brozos-Vazquez E.M. , Diaz-Pena R. , Garcia-Gonzalez J. , Leon-Mateos L. , Mondelo-Macia P. , Pena-Chilet M. , et al., Immunotherapy in nonsmall-cell lung cancer: current status and future prospects for liquid biopsy, Cancer Immunol Immunother 2020. |
[20] | Goldberg S.B. , Narayan A. , Kole A.J. , Decker R.H. , Teysir J. , Carriero N.J. , et al., Early Assessment of Lung Cancer Immunotherapy Response via Circulating Tumor DNA, Clinical cancer research: an official journal of the American Association for Cancer Research 24: (8) ((2018) ), 1872–1880. |
[21] | Noonan S.A. , Patil T. , Gao D. , King G.G. , Thibault J.R. , Lu X. , et al., Baseline and On-Treatment Characteristics of Serum Tumor Markers in Stage IV Oncogene-Addicted Adenocarcinoma of the Lung, Journal of thoracic oncology: official publication of the International Association for the Study of Lung Cancer 13: (1) ((2018) ), 134–138. |
[22] | Planchard D. , Popat S. , Kerr K. , Novello S. , Smit E.F. , Faivre-Finn C. , et al., Metastatic non-small cell lung cancer: ESMO Clinical Practice Guidelines for diagnosis, treatment and follow-up, Annals of oncology: official journal of the European Society for Medical Oncology 30: (5) ((2019) ), 863–870. |
[23] | de Vries R. , Muller M. , van der Noort V. , Theelen W. , Schouten R.D. , Hummelink K. , et al., Prediction of response to anti-PD-1 therapy in patients with non-small-cell lung cancer by electronic nose analysis of exhaled breath, Annals of oncology : official journal of the European Society for Medical Oncology. 2019. |
[24] | Husain H. , Melnikova V.O. , Kosco K. , Woodward B. , More S. , Pingle S.C. , et al., Monitoring Daily Dynamics of Early Tumor Response to Targeted Therapy by Detecting Circulating Tumor DNA in Urine, Clinical cancer research: an official journal of the American Association for Cancer Research 23: (16) ((2017) ), 4716–4723. |
[25] | Phallen J. , Leal A. , Woodward B.D. , Forde P.M. , Naidoo J. , Marrone K.A. , et al., Early Noninvasive Detection of Response to Targeted Therapy in Non-Small Cell Lung Cancer, Cancer research 79: (6) ((2019) ), 1204–1213. |
[26] | Trape J. , Filella X. , Alsina-Donadeu M. , Juan-Pereira L. , Bosch-Ferrer A. and Rigo-Bonnin R. , Increased plasma concentrations of tumour markers in the absence of neoplasia, Clinical Chemistry and Laboratory Medicine 49: (10) ((2011) ), 1605–1620. |
[27] | Sevinc A. , Camci C. , Turk H.M. and Buyukberber S. , How to interpret serum CA 125 levels in patients with serosal involvement? A clinical dilemma, Oncology 65: (1) ((2003) ), 1–6. |


