
CA125: A superior prognostic biomarker for colorectal cancer compared to CEA, CA19-9 or CA242
Abstract
OBJECTIVES:
The tumor stage represents the single most important prognostic factor for colorectal cancer (CRC), although more accurate prognostics remain much needed. Previously, we identified CA125 as an independent significant prognostic factor, which we have further validated along with CEA, CA19-9, and CA242 in a large cohort of CRC patients.
METHODS:
Using enzyme-linked immunosorbent assays, we analyzed preoperative serum samples in 322 CRC patients operated on between 1998 and 2003.
RESULTS:
Using the Spearman’s rho model, we calculated the correlation between our previous findings on MUC16 and CA125, for which the correlation coefficient was 0.808 (p < 0.001). The Cox regression analysis of the linear and logarithmic values of CEA, CA125, CA242, and CA19-9 identified only CA125 (hazard ratio [HR] 1.03; 95% confidence interval [95% CI] 1.02−1.04; p < 0.001) as significant when using the linear values. Survival among CRC patients with a high CA125 level was poor compared with CRC patients with a low CA125 level (HR 2.48; 95% CI 1.68–3.65; p < 0.001). In subgroup analyses, patients with high CA125 levels and aged ≤67 or >67, with stage I–II or III–IV, and both colon and rectal cancer exhibited poor prognoses. In the multivariate analysis, we used clinical pathological variables in the model, where age, gender, and stage served as the background characteristics. We dichotomized CA125 using the Youden maximal cutoff point, and the median values for CEA, CA19-9, and CA242. CA125 emerged as the only marker remaining significant and independent together with stage, location, and age (HR 1.91; 95% CI 1.24–2.95; p 0.003).
CONCLUSIONS:
CA125 represents a significant and independent prognostic factor in CRC patients, superior to CEA. Furthermore, CA242 served as a better prognostic marker than both CEA and CA19-9. We recommend including both CA125 and CA242 in prognostic clinical trials among CRC patients.
1Introduction
To date, colorectal cancer (CRC) is the third most common cancer and the second most fatal cancer worldwide [1]. Treatment involves surgery, with some patients benefitting from radiation or chemotherapy. The clinicopathological TNM classification is widely used today, such that the TNM stage represents the single most important prognostic factor in CRC. Other prognostic factors include age, tumor location, and biomarkers such as carcinoembryonic antigen (CEA), carbohydrate antigen 125 (CA125), and interleukin 8 (IL-8) [2, 3].
Although CEA is widely used today and stands as the biomarker recommended for CRC patient prognostics, its value remains limited. Researchers continue to frantically search for other biomarkers that could outperform or be used alongside CEA. In our previous study, we measured 72 biomarkers in 138 colon cancer patients using a proximity extension assay (PEA) and quantitative real-time polymerase chain reaction (qPCR), identifying Mucin 16 (MUC-16) as a significant and independent prognostic factor, whereby MUC-16 represents the glycoprotein core of CA125 [4]. Furthermore, we previously examined carbohydrate antigen 242 (CA242), assessing its value as a prognostic biomarker for different gastrointestinal cancers [5, 6]. Carbohydrate antigen 19-9 (CA19-9) serves as a follow-up marker in pancreatic cancer [7], studied in CRC yielding conflicting results [8].
The results of our previous screening study of a large number of biomarkers led to the hypothesis that CA125, while clinically thus far primarily used as a marker for gynecological cancers, might prove useful as a prognostic biomarker in CRC patients. One limitation of our previous study was that the commercial panel lacked the clinically used markers CEA and CA 19-9. Additionally, our previous study comprised only colon cancer. Here, we compare the prognostic value of CA125 with CEA, CA19-9, and CA242 in a larger cohort comprising both colon and rectum cancer.
2Patients and methods
2.1Patients
Our cohort consisted of 322 CRC patients with a mean age of 66.3 (range 31.7–92.7), operated on between 1998 and 2003 at Helsinki University Hospital. In this cohort, 155 patients were female and 167 male (Supplementary Table 1) with a median age of 67. The surgery date was defined as the diagnosis date. According to the American Joint Committee on Cancer (AJPCC) stage classification, 55 patients had stage I, 97 patients stage II, 110 patients stage III, and 60 patients stage IV disease. The Finnish Digital and Population Data Service Agency provided the cause-of-death information. This patient cohort overlaps with a colon cancer cohort described previously [4].
2.2Serum samples
Serum samples were drawn before surgery (median 2 days, range 0–30), aliquoted, and stored at –80°C until they were all assayed.
2.3Protein analysis
We used commercially available ELISA kits to analyze the CEA, CA125, CA242, and CA19-9 (Fujirebio Diagnostics, Gothenburg, Sweden) levels (Supplementary Table 2). We used the following reference values based on 97.5% percentiles defined from 100−210 healthy donors: 5μg/L for CEA, 39 U/mL for CA125, 29 U/mL for CA242, and 25 U/mL for CA19-9.
2.4Statistics
For the Cox regression analyses, we used the logarithmic value of the biomarkers as continuous variables. The endpoint for all survival analyses was disease-specific survival (DSS), which we defined as the time from surgery to death from CRC. For the time-dependent receiver operating characteristic curves (ROCs) and area under the curves (AUCs), we used the TimeROC package in R, and the integrated AUC over time from 6 to 48 months.
We continued with a nonlinearity analysis, in which we examined the linearity of the hazard ratios (HRs) over the continuous biomarker concentration by changing the concentrations to restricted cubic splines and analyzing the nonlinearity in R. Furthermore, we used the Mann-Whitney U test and Kruskal-Wallis test to analyze the distributions among continuous variables, and estimated survival times using the Kaplan-Meier method based on dichotomized biomarker levels at the maximum point of the Youden index. The correlation analyses for the MUC-16 (CA125) values from our previous study and the CA125 levels measured here were calculated using the Spearman’s rho model.
All p values were calculated as two-sided, and we considered p < 0.05 as statistically significant. All statistical analyses were performed using IBM’s SPSS Statistics, version 25 (International Business Machines Corp., NY, USA) and R, version 3.4.3 (R: A Language and Environment for Statistical Computing, R Core Team, R Foundation for Statistical Computing, Vienna, Austria 2019).
2.5Ethical approval
The Ethics Committee at the University of Helsinki and Helsinki University Hospital approved the study protocol (226/E6/2006, extension 17 April 2013). The National Supervisory Authority of Health and Welfare approved the retrospective study design (Valvira Dnro 10041/06.01.03.01/2012). Patients provided their written informed consent upon inclusion to the study, and this study was carried out in accordance with the Declaration of Helsinki.
3Results
3.1Correlation analyses
We correlated the findings for MUC-16 on 148 patients from our previous study with CA125 in this study, as the patient demographics do overlap. The correlation analysis was calculated using the Spearman’s rho model, resulting in a correlation coefficient of 0.808 (p < 0.001).
We calculated the Spearman’s correlation between the linear CEA, CA125, CA242, and CA19-9 values, whereby all of these biomarkers correlated with each other (rc = 0.496; p < 0.001; Table 1).
Table 1
Correlation analysis of biomarkers with Spearman’s rank correlation
| Biomarker | Rs | p |
| CEA | ||
| CA125 | 0,176 | 0,002 |
| CA242 | 0,448 | <0.001 |
| CA19-9 | 0,498 | <0.001 |
| CA125 | ||
| CA242 | 0,161 | 0,004 |
| CA19-9 | 0,287 | <0.001 |
| CA242 | ||
| CA19-9 | 0,712 | <0.001 |
Abbreviations: Rs = Spearman’s correlation coefficient, CEA = carcinoembryonic antigen, CA125 = cancer antigen 125, CA242 = carbohydrate antigen 242, CA19-9 = carbohydrate antigen 19-9.
3.2Association analysis
The CEA levels varied significantly between patients with right-sided colon cancer, left-sided colon cancer, and rectal cancer (Kruskall-Wallis test, p = 0.034; Table 2) and between stages I, II, III, and IV (Kruskall-Wallis test, p < 0.001; Table 2). The CA125 levels differed significantly in patients with right- or left-sided colon cancer or rectum cancer (Kruskall-Wallis test, p = 0.007; Table 2). For stages I, II, III, and IV, the level of CA125 (Kruskall-Wallis test, p = 0.013; Table 2) and CA242 (Kruskall-Wallis test, p < 0.001, Table 2) differed significantly. The CA19-9 levels varied significantly among stages I, II, III, and IV (Kruskall-Wallis test, p < 0.001; Table 2).
Table 2
Association analyses for CEA, CA125, CA242, and CA19-9 (Mann-Whitney U or Kruskall-Wallis test)
| CEA | CA125 | CA242 | CA19-9 | |||||||||
| Median | IQR | p value | Median | IQR | p value | Median | IQR | p value | Median | IQR | p value | |
| (pg/ml) | (U/ml) | (U/ml) | (U/ml) | |||||||||
| Gender1 | ||||||||||||
| Female | 3,05 | 1.40–8.00 | 0,171 | 6,49 | 4.09–11.1 | 0,979 | 9,00 | 5.06–27.8 | 0,619 | 2,81 | 2.31–3.62 | 0,980 |
| Male | 3,40 | 1.50–16.0 | 6,21 | 3.95–10.3 | 8,85 | 3.65–30.2 | 2,82 | 2.24–3.72 | ||||
| Age1 | ||||||||||||
| ≤67 | 2,95 | 1.20–9.25 | 0,124 | 5,92 | 3.69–5.92 | 0,982 | 8,77 | 4.64–26.7 | 0,178 | 2,67 | 2.22–3.61 | 0,257 |
| >67 | 3,40 | 1.70–10.7 | 6,56 | 4.37–11.0 | 9,00 | 3.45–31.1 | 2,90 | 2.35–3.73 | ||||
| Stage2 | ||||||||||||
| I | 1,80 | 0.80–3.40 | <0.001 | 5,92 | 4.02–8.62 | 0,013 | 5,22 | 2.17–7.88 | <0.001 | 2,40 | 2.05–2.84 | <0.001 |
| II | 2,30 | 1.20–4.45 | 5,93 | 4.01–9.82 | 7,58 | 3.43–17.1 | 2,60 | 2.19–3.01 | ||||
| III | 3,80 | 1.50–10.6 | 6,07 | 3.77–10.1 | 12,1 | 4.27–30.2 | 2,92 | 2.24–3.79 | ||||
| IV | 16,2 | 5.90–101 | 9,10 | 4.77–17.4 | 44,0 | 10.6–135 | 4,21 | 3.03–5.63 | ||||
| Histology1 | ||||||||||||
| Non-mucinous | 3,40 | 1.50–10.4 | 0,086 | 6,21 | 3.99–10.3 | 0,131 | 8,65 | 3.59–28.2 | 0,213 | 2,81 | 2.29–3.66 | 0,994 |
| Mucinous | 1,95 | 1.08–5.58 | 7,77 | 4.63–13.6 | 12,6 | 5.61–34.1 | 2,89 | 2.13–3.64 | ||||
| Location2 | ||||||||||||
| Right colon | 2,50 | 1.18–7.55 | 0,034 | 7,41 | 4.19–14.2 | 0,007 | 13,3 | 2.98–33.9 | 0,555 | 2,89 | 2.41–3.73 | 0,565 |
| Left colon | 3,05 | 1.52–5.25 | 8,92 | 5.23–15.4 | 8,15 | 4.39–12.4 | 2,76 | 2.34–3.43 | ||||
| Rectum | 3,90 | 1.53–18.8 | 5,79 | 3.76–8.59 | 8,34 | 3.68–30.2 | 2,74 | 2.22–3.73 | ||||
1p value for the Mann-Whitney U test. 2p value for the Kruskall-Wallis test. Abbreviations: IQR = interquartile range, CEA = carcinoembryonic antigen, CA125 = cancer antigen 125, CA242 = carbohydrate antigen 242, CA19-9 = carbohydrate antigen 19-9.
3.3Univariate analysis
We performed a Cox regression analysis on the linear and logarithmic values of CEA, CA125, CA242, and CA19-9, whereby only CA125 (HR 1.03; 95% confidence interval [95% CI] 1.02–1.04; p < 0.001) emerged as significant when the linear values were used. Using the logarithmic values, CEA (HR 2.28; 95% CI 1.77–2.95; p < 0.001), CA242 (HR 2.78; 95% CI 2.13–3.63; p < 0.001), and CA19-9 (HR 1.79; 95% CI 1.56–2.04; p < 0.001) were significant prognostic factors. We dichotomized CEA, CA242, and CA19-9 for the Kaplan-Meier analyses based on their median values and CA125 using the Youden maximum value, since it lacked a linear distribution in the linearity analysis. Patients with a high CEA level exhibited a poor prognosis compared with patients with a low CEA level (HR 2.32; 95% CI 1.56–3.45; p < 0.001; Table 3; Fig. 1A). Survival among CRC patients with a high CA125 level was poor compared with CRC patients with a low CA125 level (HR 2.48; 95% CI 1.68–3.65; p < 0.001; Table 3; Fig. 1B). Patients with a high CA242 level also exhibited a poor prognosis compared with patients with a low CA242 level (HR 3.23; 95% CI 2.13–4.91; p < 0.001; Table 3; Fig. 1C), and patients with a high CA19-9 level exhibited a poor prognosis compared with patients with a low CA19-9 level (HR 2.58; 95% CI 1.68−3.81; p < 0.001; Table 3; Fig. 1D).
Table 3
Cox regression analyses on subgroups of CEA, CA125, CA242, and CA19-9
| log CEA | log CA125 | log CA242 | log CA19-9 | |||||||||
| HR | 95% CI | p value | HR | 95% CI | p value | HR | 95% CI | p value | HR | 95% CI | p value | |
| 2,3 | 1.56–3.45 | <0.001 | 2,5 | 1.68–3.65 | <0.001 | 3,2 | 2.13–4.91 | <0.001 | 2,6 | 1.68–3.81 | <0.001 | |
| Age | ||||||||||||
| ≤67 | 2,4 | 1.69–3.52 | <0.001 | 2,0 | 1.10–3.62 | 0,023 | 2,8 | 1.52–5.31 | 0,001 | 2,8 | 1.48–5.19 | 0,001 |
| >67 | 2,2 | 1.51–3.23 | <0.001 | 3,0 | 1.79–5.00 | <0.001 | 3,9 | 2.19–6.78 | <0.001 | 2,3 | 1.31–3.90 | 0,003 |
| Location | ||||||||||||
| Right colon | 1,2 | 0.53–2.78 | 0,639 | 4,3 | 1.87–9.90 | 0,001 | 2,2 | 0.89–5.18 | 0,089 | 2,0 | 1.44–2.69 | <0.001 |
| Left colon | 1,9 | 0.85–4.31 | 0,119 | 2,5 | 1.11–5.54 | 0,027 | 5,8 | 2.17–15.7 | <0.001 | 1,8 | 1.35–2.46 | <0.001 |
| Rectum | 2,4 | 1.76–3.30 | <0.001 | 2,1 | 1.14–3.69 | 0,016 | 3,4 | 1.94–5.79 | <0.001 | 2,6 | 1.52–4.55 | 0,001 |
| Histological type | ||||||||||||
| Non-mucinous adenocarcinoma | 2,6 | 1.68–3.94 | <0.001 | 2,3 | 1.52–3.42 | <0.001 | 3,0 | 1.97–4.62 | <0.001 | 1,8 | 1.55–2.08 | <0.001 |
| Mucinous adenocarcinoma | 1,0 | 0.25–4.02 | 0,999 | 4,2 | 1.10–15.9 | 0,036 | 46 | 0.17–12000 | 0,179 | 1,8 | 1.21–2.52 | 0,003 |
| Stage group | ||||||||||||
| Stage I | 0,3 | 0.00–2510 | 0,550 | 1,8 | 0.16–19.7 | 0,637 | 2,0 | 0.18–22.5 | 0,563 | 3,3 | 0.73–15.0 | 0,118 |
| Stage II | 0,9 | 0.32–2.71 | 0,891 | 2,7 | 0.96–7.59 | 0,060 | 1,5 | 0.53–4.09 | 0,448 | 1,3 | 0.56–3.11 | 0,522 |
| Stage III | 1,3 | 0.75–2.36 | 0,323 | 1,9 | 1.05–3.45 | 0,034 | 1,9 | 1.05–3.45 | 0,034 | 1,5 | 1.21–1.96 | <0.001 |
| Stage IV | 1,5 | 0.58–3.87 | 0,400 | 2,1 | 1.13–4.00 | 0,019 | 2,1 | 0.82–5.44 | 0,122 | 1,3 | 1.01–1.55 | 0,039 |
| TNM | ||||||||||||
| Tumor | 2,0 | 1.50–2.60 | <0.001 | 1,4 | 0.94–2.10 | 0,094 | 2,4 | 1.78–3.11 | <0.001 | 1,7 | 1.44–1.90 | <0.001 |
| Node | 1,8 | 1.37–2.34 | <0.001 | 1,4 | 0.94–2.16 | 0,094 | 2,2 | 1.70–2.91 | <0.001 | 1,6 | 1.36–1.80 | <0.001 |
| Metastasis | 1,5 | 1.16–2.06 | 0,003 | 1,2 | 0.82–1.86 | 0,306 | 2,0 | 1.48–2.60 | <0.001 | 1,5 | 1.26–1.73 | <0.001 |
Abbreviations: log = logarithm with base 10, CEA = carcinoembryonic antigen, CA125 = cancer antigen 125, CA 242 = carbohydrate antigen 242, CA19-9 = carbohydrate antigen 19-9, HR = hazard ratio, 95% CI = 95% confidence interval.
Fig. 1
(A) Disease-specific survival (DSS) according to the CEA levels based on the Kaplan-Meier log-rank test. The cohort was dichotomized using the median CEA values. (B) DSS according to the CA125 levels based on the Kaplan-Meier log-rank test. The cohort was dichotomized using the maximum Youden values for CA125. (C) DSS according to the CA242 levels based on the Kaplan-Meier log-rank test. The cohort was dichotomized using the median values for CA242. (D) DSS according to the CA19-9 levels based on the Kaplan-Meier log-rank test. Dichotomization of the cohort was based on the median value of CA19-9.
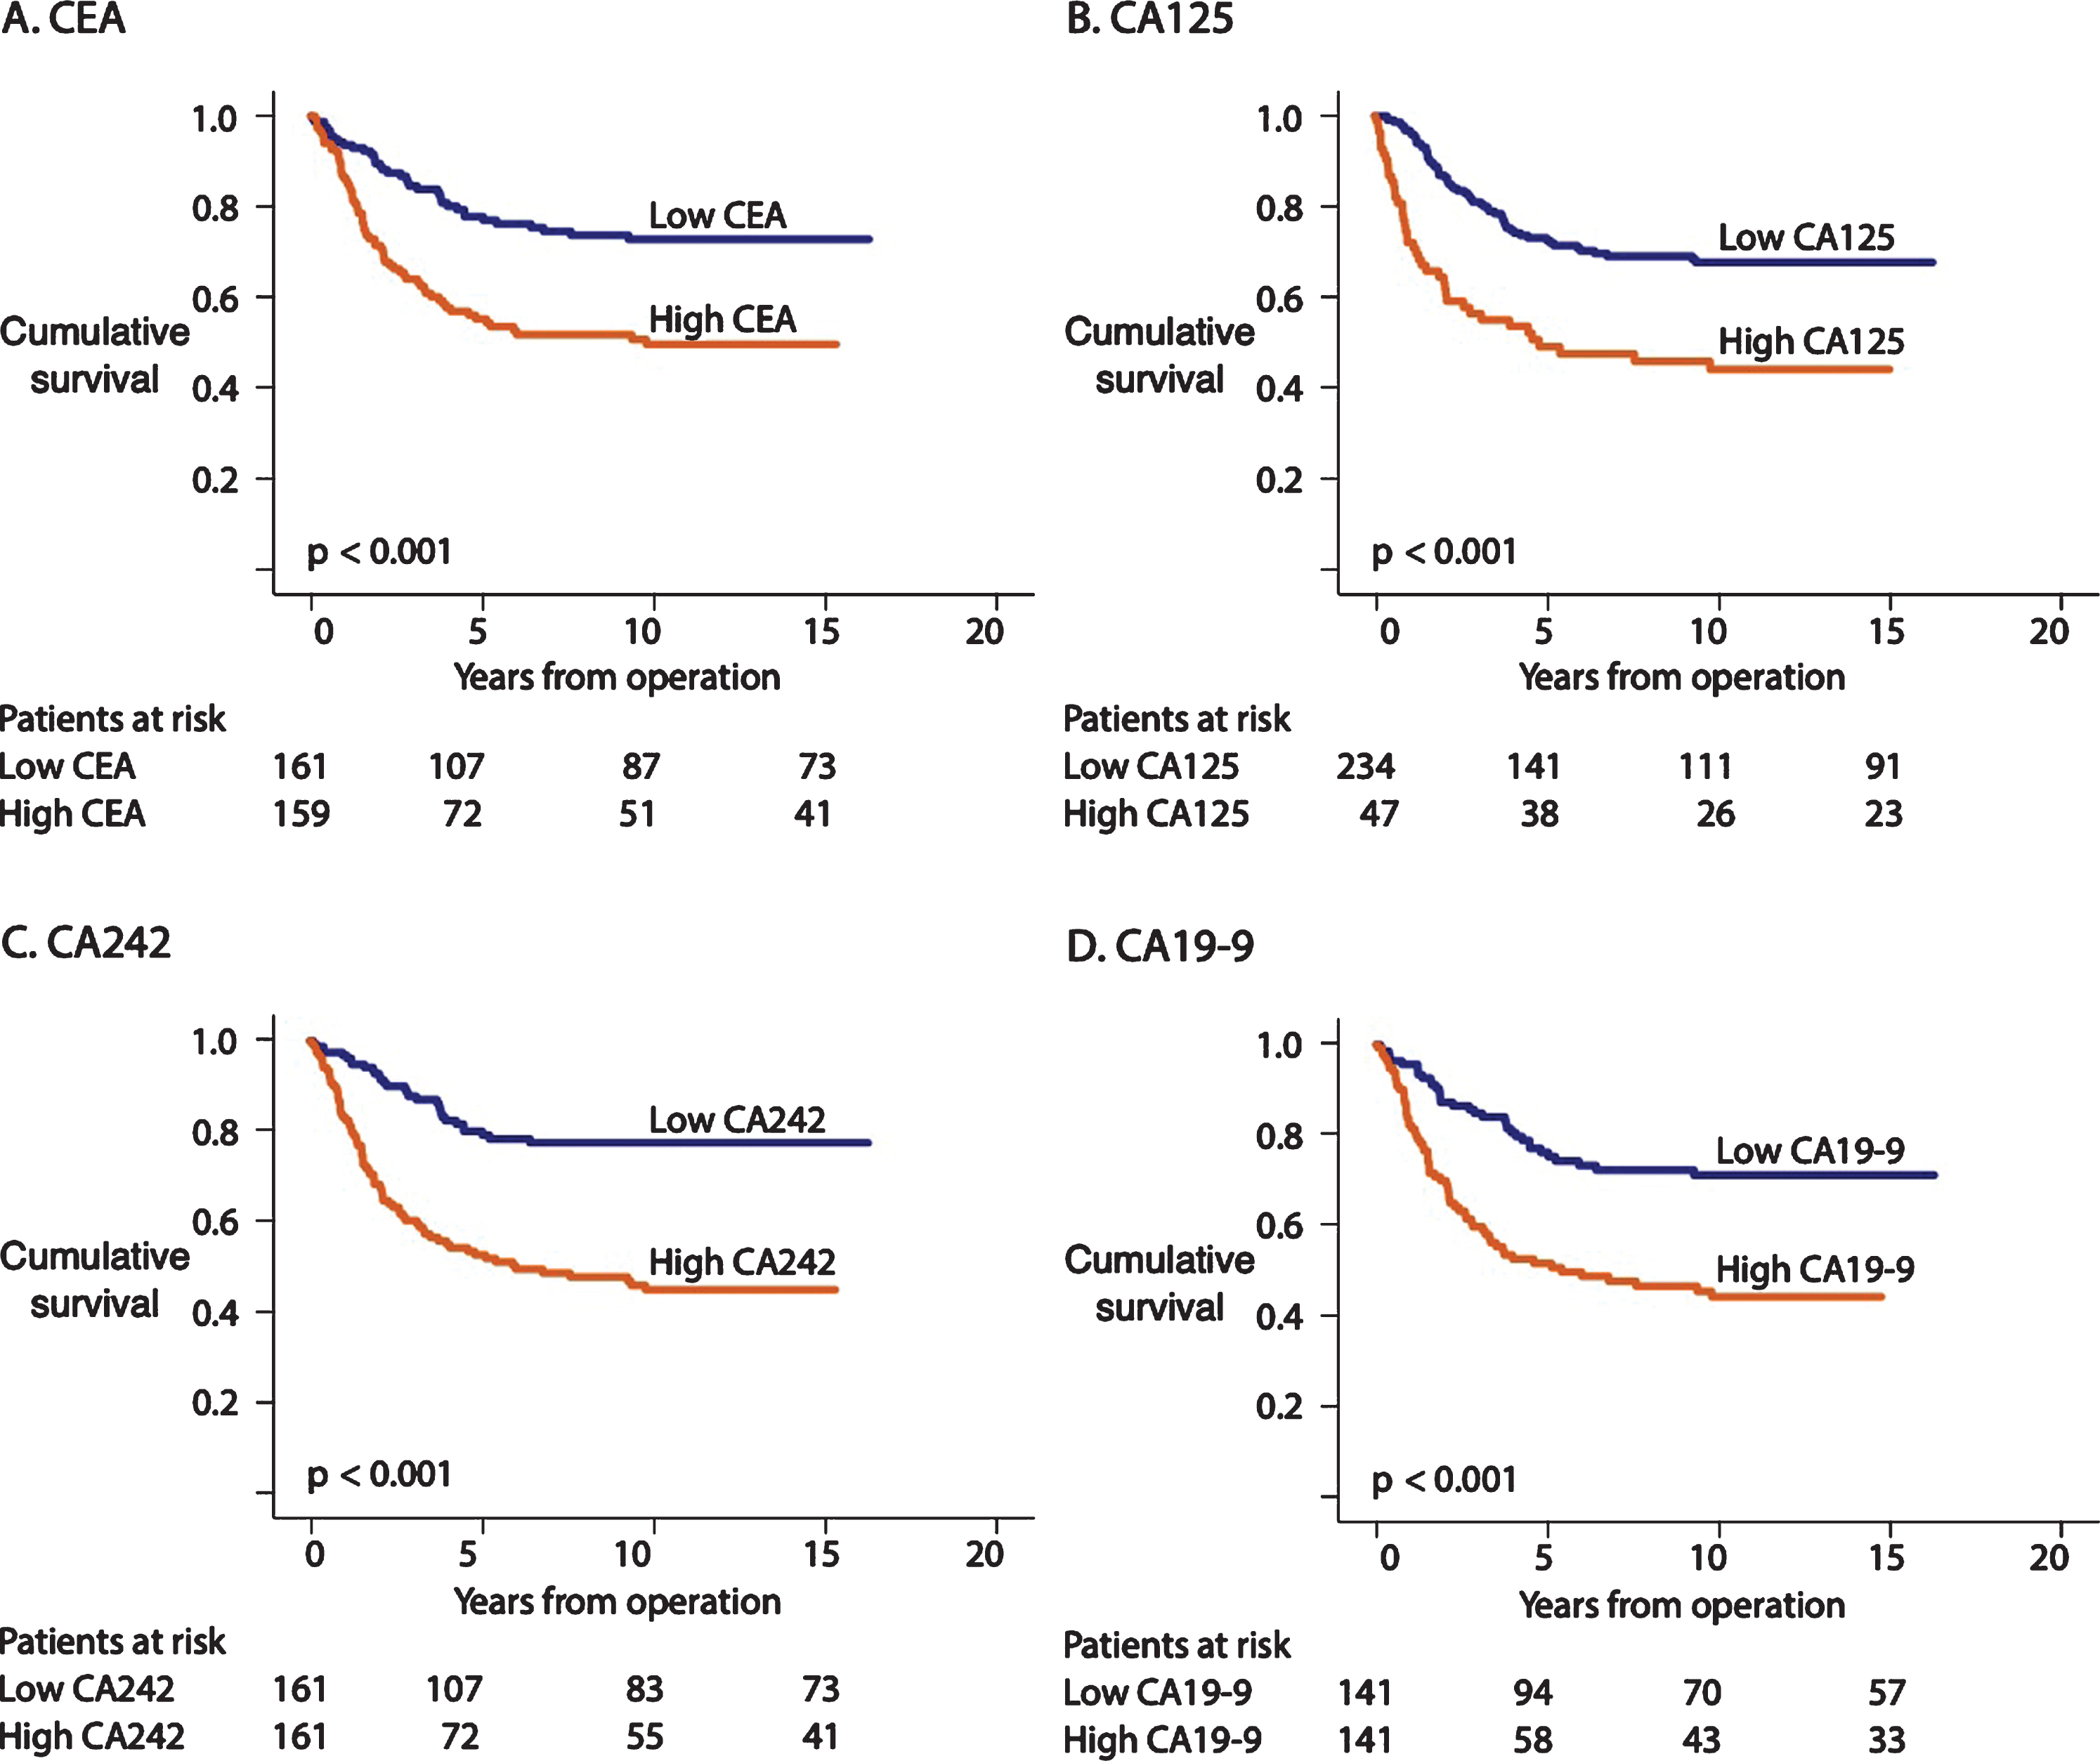
We performed a ROC analysis of 6 to 48 months following surgery on CEA, CA125, and CA242. The AUC was 0.645 for CEA, 0.572 for CA125, 0.699 for CA242, and 0.670 for CA19-9.
The 5-year survival for patients with a low CEA level was 80% (95% CI 73–87%) and 58% (95% CI 50–;66%) for those with a high level. The 5-year survival for those with a low CA125 level was 75% (95% CI 70–;81%) versus 53% (95% CI 42−64%) for high-level patients, whereas it was 82% (95% CI 76−89%) for patients with a low CA242 level and 55% (95% CI 47−63%) for those with a high level. When calculating survival for CA19-9, we found that 5-year survival was 81% (95% CI 74−87%) when CA19-9 was low and 53% (95% CI 44−62%) when high.
3.4Univariate analysis of CEA
The measurements of the CEA levels were performed on the same serum samples as the other biomarkers. Thus, we could use those as a solid reference point for our calculations. Survival among patients younger than 67 was worse for those with a high CEA level compared with patients with a low CEA level (HR 2.44; 95% CI 1.69−3.52; p < 0.001; Table 3; Supplementary Figure 1A). Among patients 67 years or older, survival was worse among patients with a high CEA level than for those patients with a low CEA level (HR 2.21; 95% CI 1.51−3.23; p < 0.001; Table 3; Supplementary Figure 1B). Patients with colon cancer exhibited a worse prognosis when CEA levels were high compared with patients with a low CEA level (HR 2.02; 95% CI 1.25−3.26; p < 0.001; Table 3; Supplementary Figure 1C), while rectum cancer patients with a high CEA level exhibited a poor prognosis compared with rectum cancer patients with a low CEA level (HR 2.41; 95% CI 1.76−3.30; p < 0.001; Table 3; Supplementary Figure 1D). We found no difference in prognosis among patients with a high or low CEA level when we analyzed stages I−II as one subgroup (HR 1.21; 95% CI 0.51−2.90; p = 0.664; Table 3; Supplementary Figure 1E). We further analyzed stages III−IV as one subgroup, finding that patients with a high CEA level experienced a worse prognosis than patients with a low CEA level (HR 1.73; 95% CI 1.30−2.30; p < 0.001; Table 3; Supplementary Figure 1F).
3.5Univariate analysis of CA125
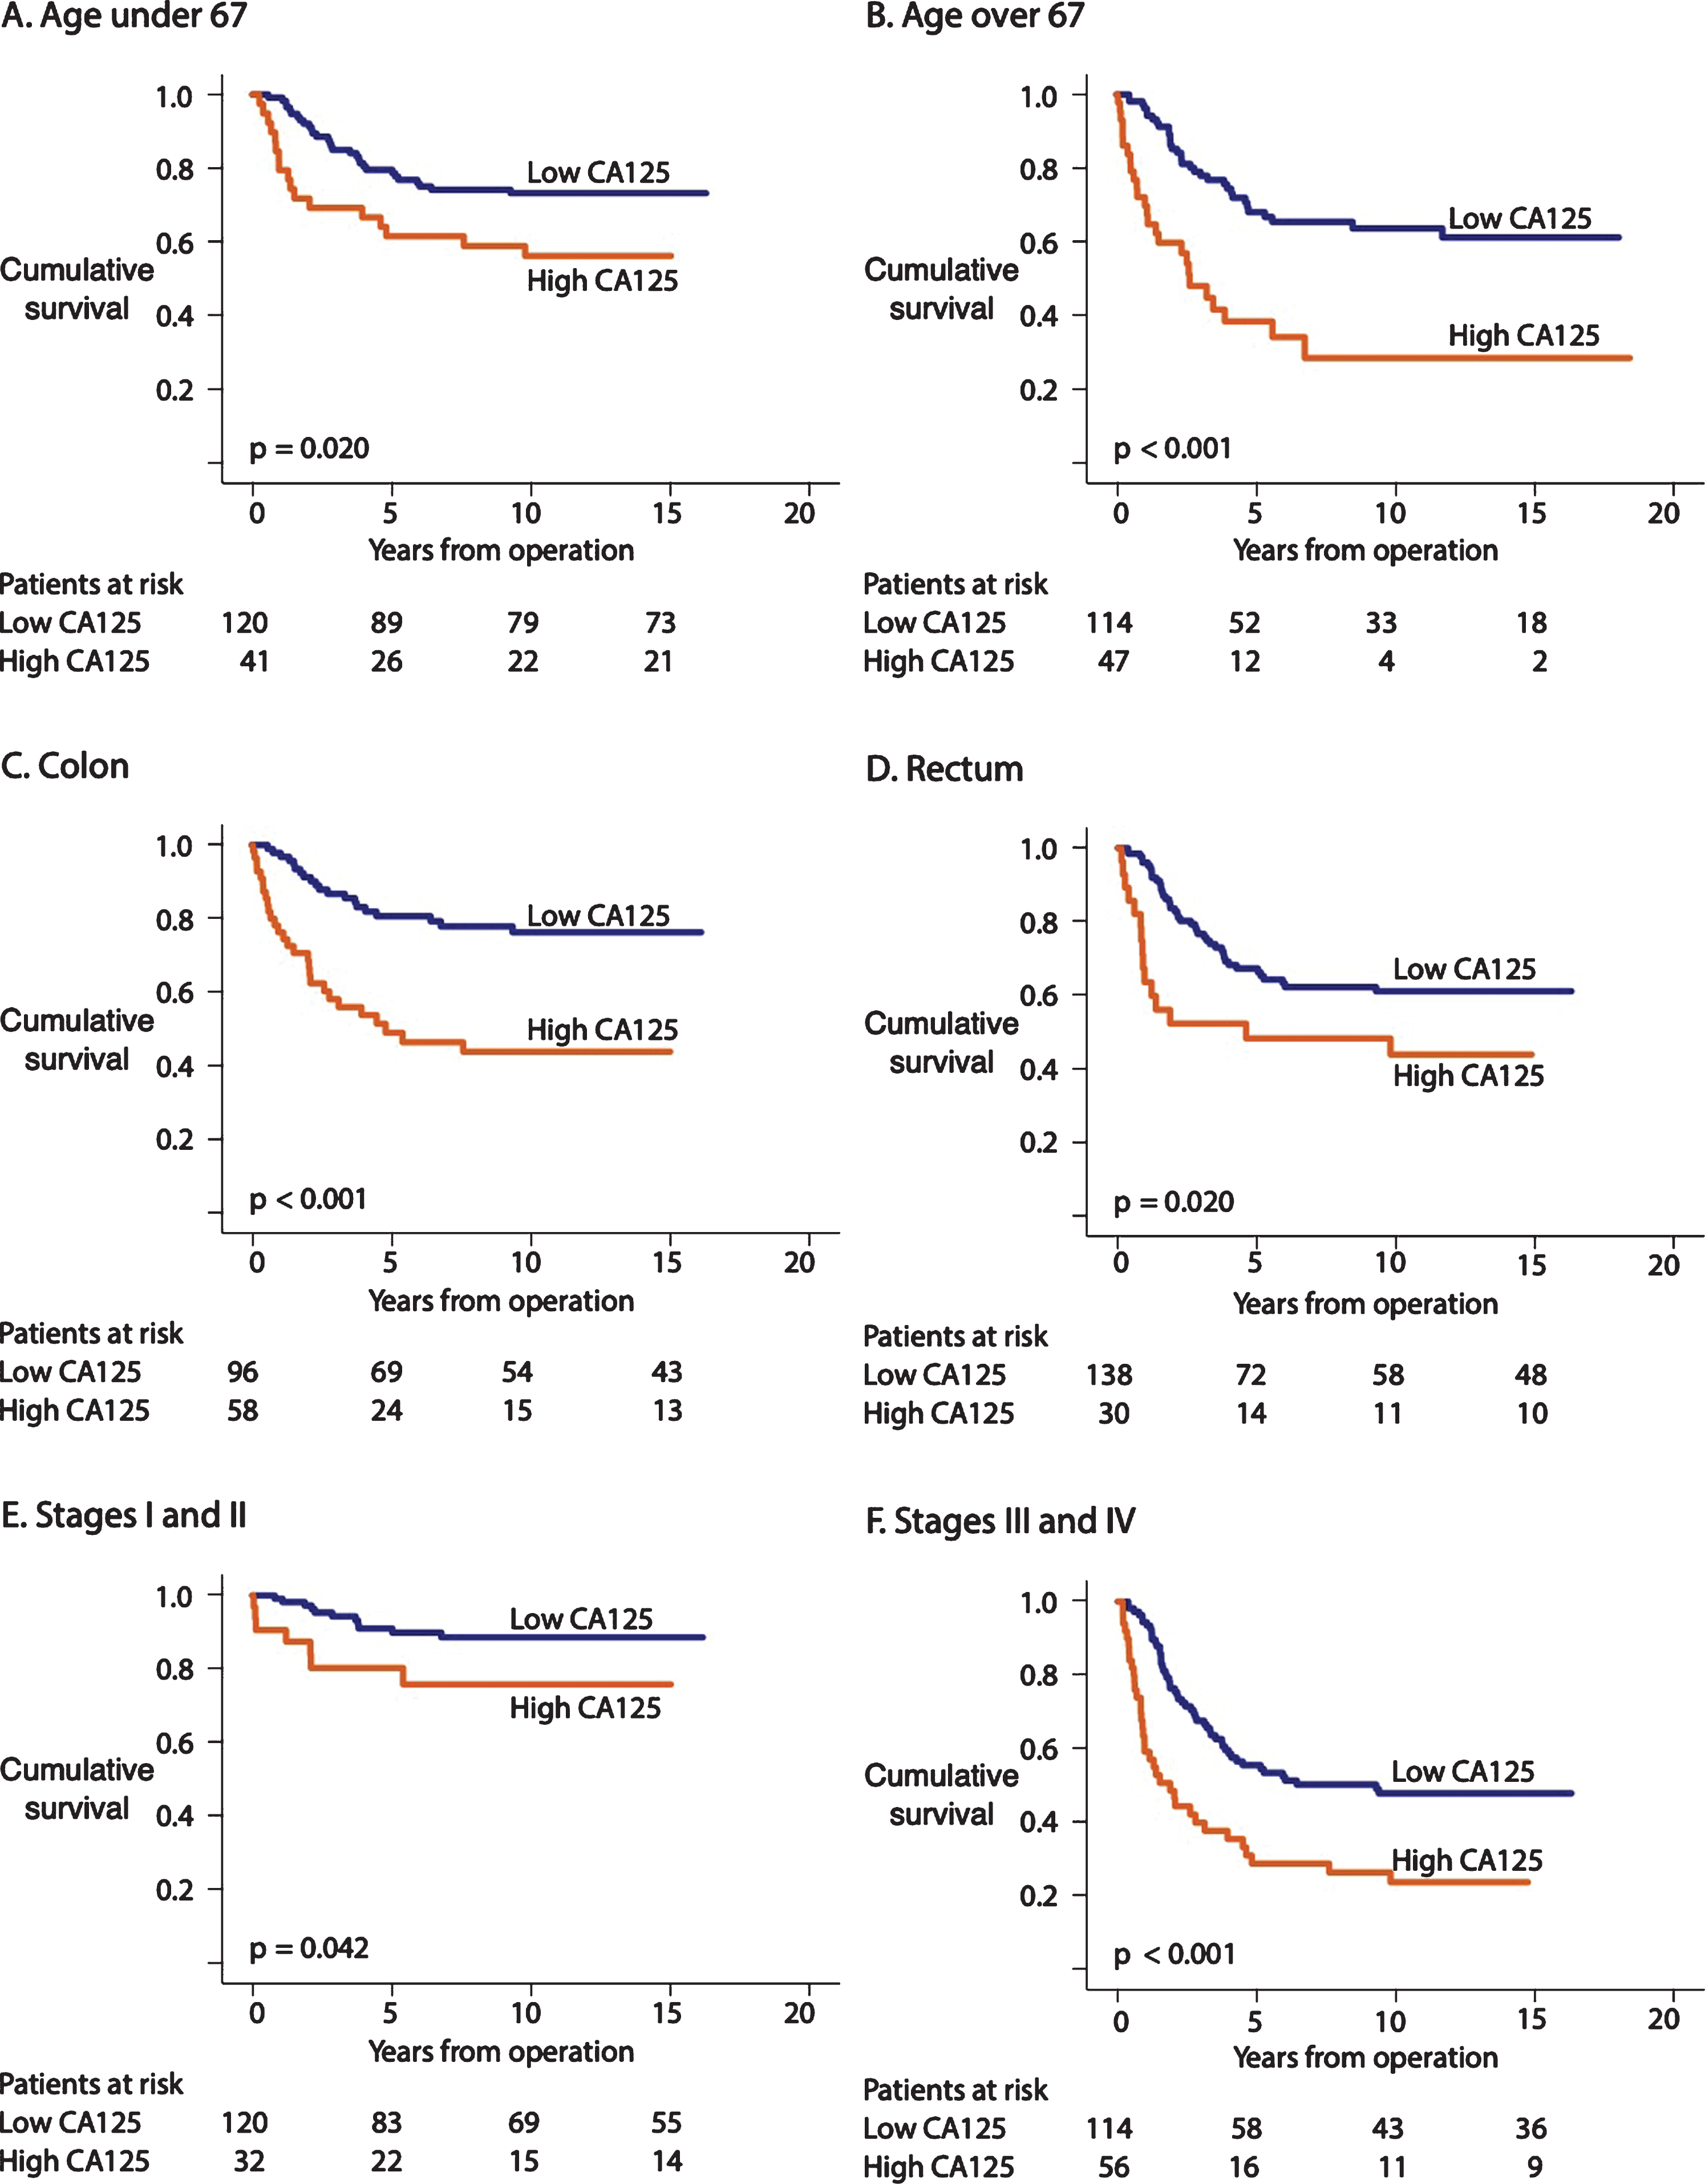
Survival among patients 67-years-old and younger was worse among those with a high CA125 level than among patients with a low CA125 level (HR 2.00; 95% CI 1.10–3.62; p = 0.023; Table 3; Fig. 2A). Among patients 67 years or older, survival was poor among those with a high CA125 level compared with patients with a low CA125 level (HR 2.99; 95% CI 1.79–5.00; p < 0.001; Table 3; Fig. 2B). Patients with colon cancer exhibited a poor prognosis when the CA125 level was high (HR 3.51; 95% CI 1.97–6.25; p < 0.001; Table 3; Fig. 2C), while rectum cancer patients with a high CA125 level also exhibited a poor prognosis (HR 2.05; 95% CI 1.14–3.69; p = 0.016; Table 3; Fig. 2D). When combining stages I and II, we detected no difference in the prognosis between patients with a high CA125 level from those with a low CA125 level (HR 2.59; 95% CI 1.00–6.68; p = 0.050; Table 3; Fig. 2E). We further combined the stages III and IV into one subgroup, in which patients with a high CA125 exhibited a poor prognosis than patients with a low CA125 level (HR 2.29; 95% CI 1.50–3.50; p < 0.001; Table 3; Fig. 2F).
Fig. 2
Disease-specific survival (DSS) according to Kaplan-Meier log-rank test of the CA125 subgroups. The cohort was dichotomized according to the maximum Youden values for CA125. (A) CA125 levels for patients <67 and (B) ≥67 years old. (C) CA125 levels for colon cancer and (D) rectum cancer. (E) CA125 levels for stages I–II and (F) stages III–IV.
3.6Univariate analysis of CA242
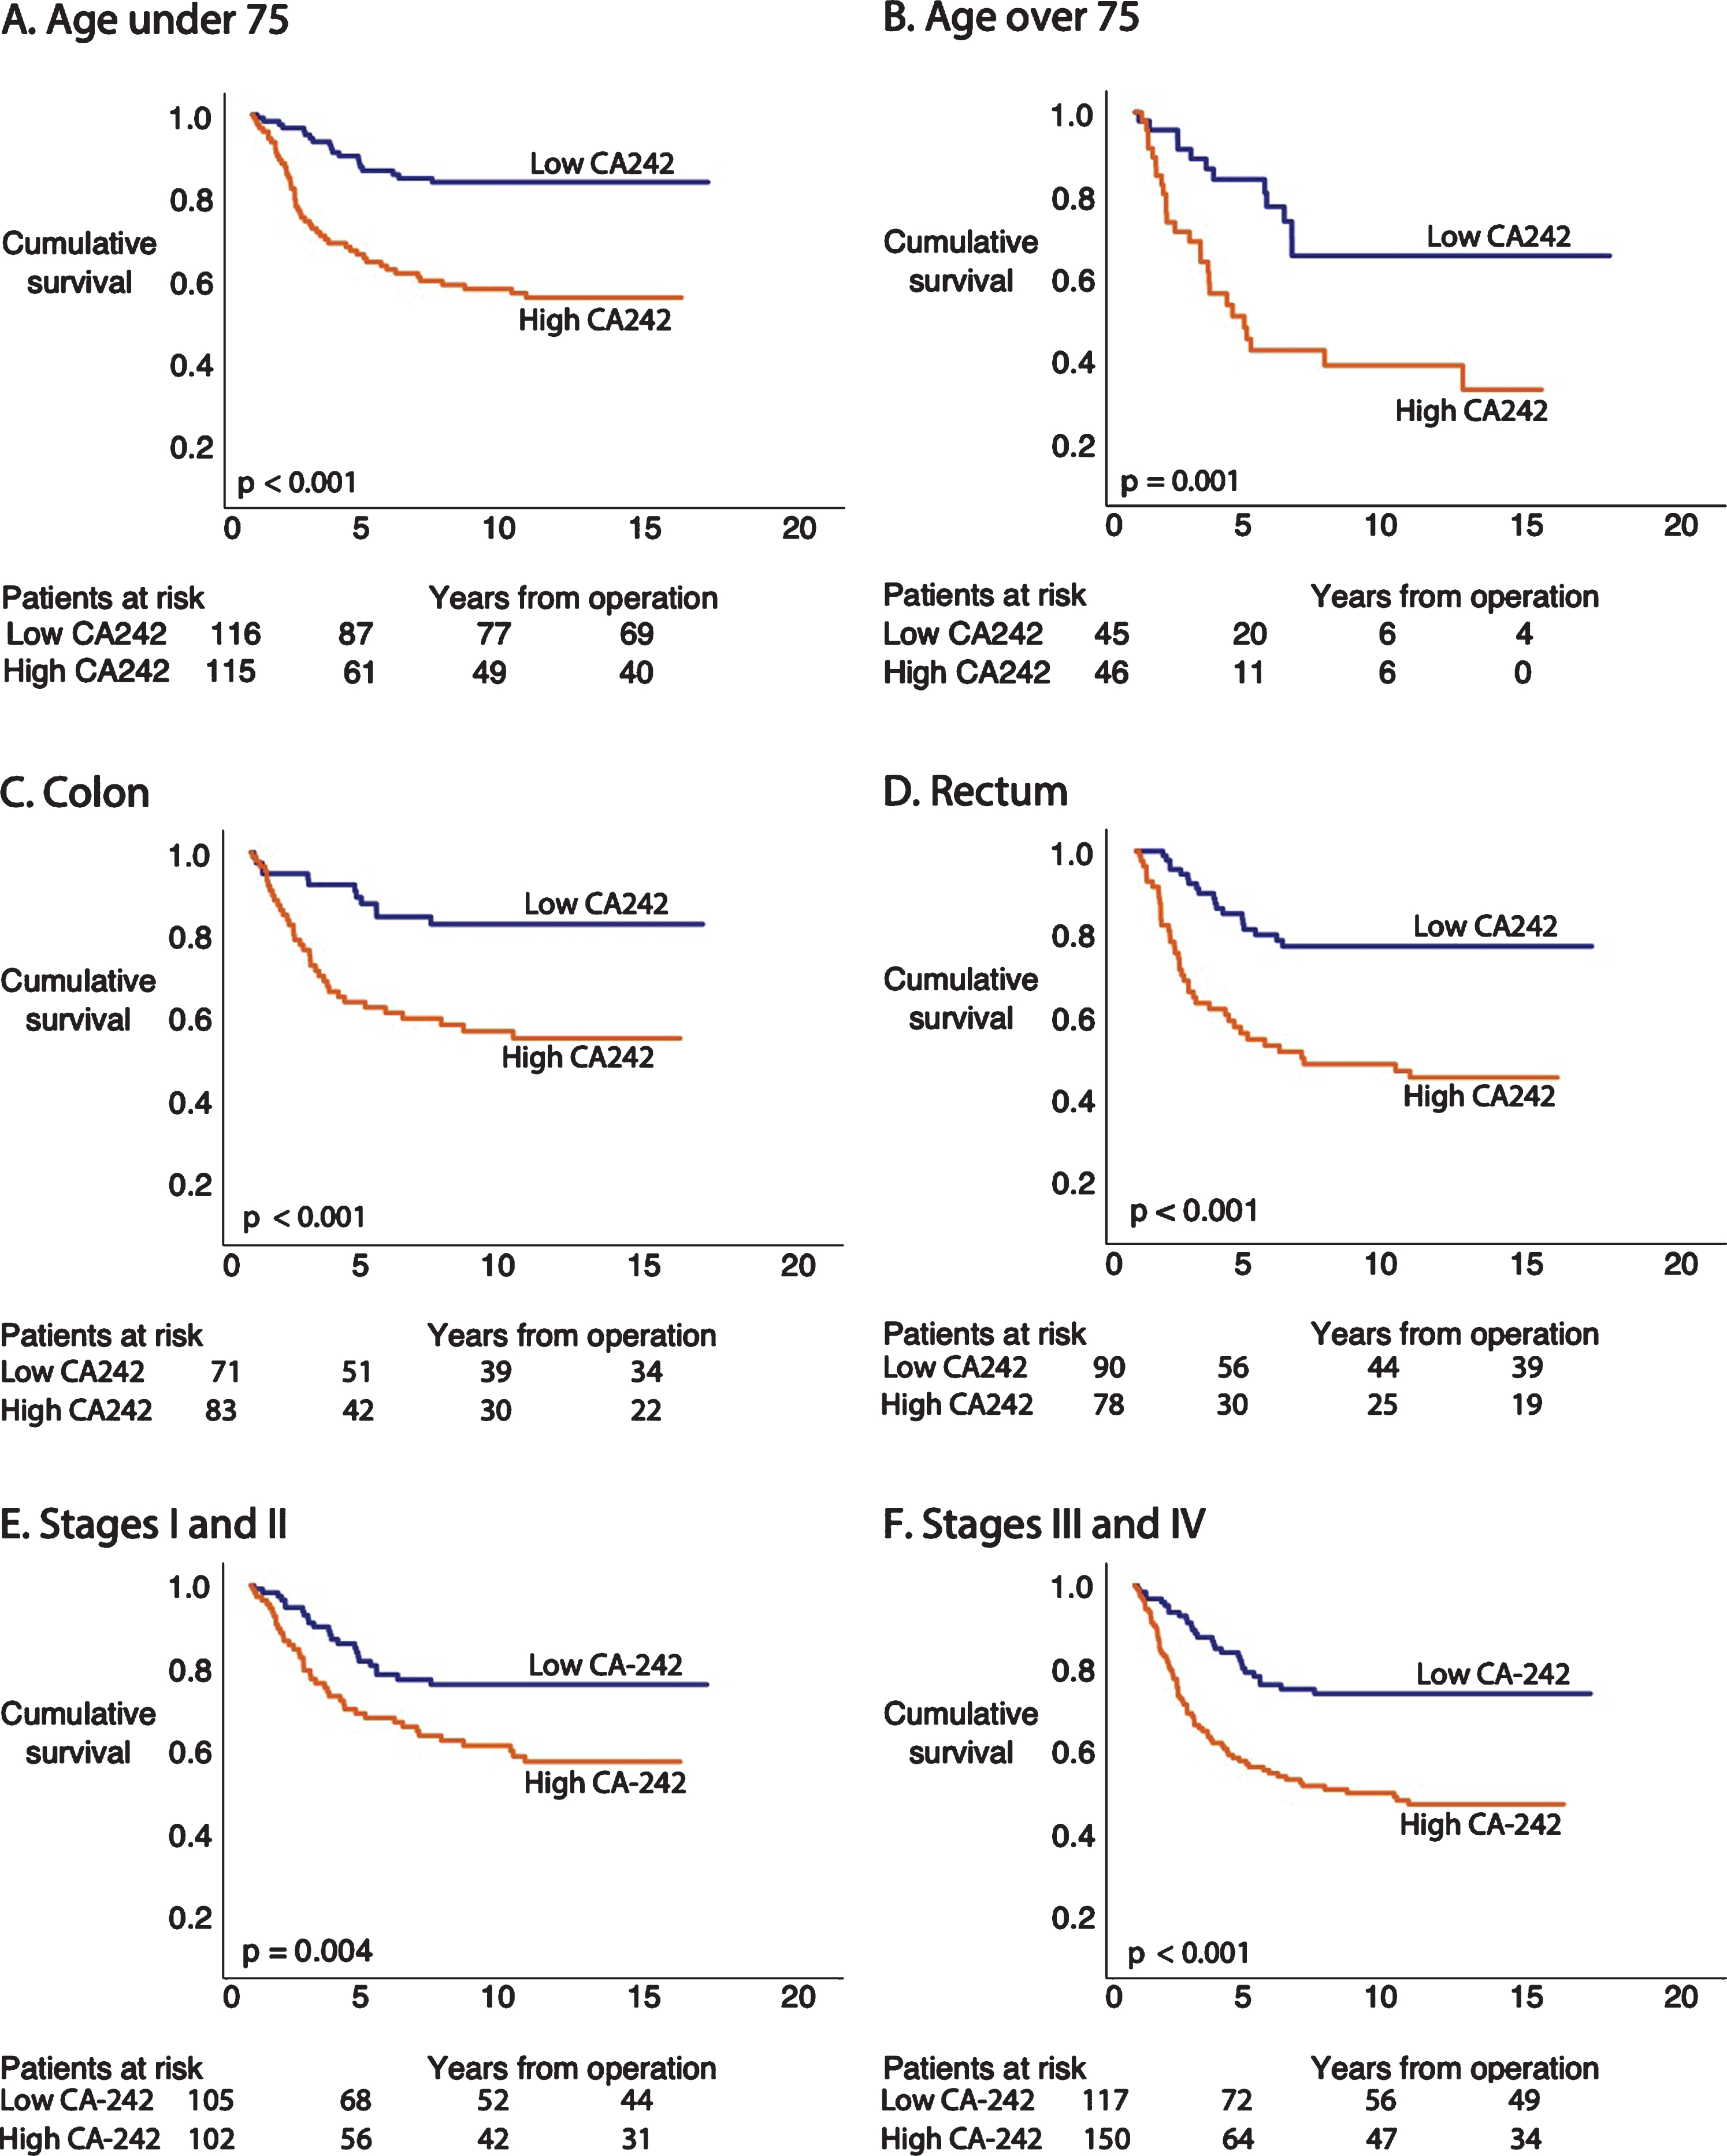
Among patients younger than 67, survival remained poor for those with a high CA242 level compared with patients with a low CA242 level (HR 2.84; 95% CI 1.52–5.31; p = 0.001; Table 3; Fig. 3A). Patients 67 or older exhibited a poor prognosis when CA242 was high compared with patients with a low CA242 level (HR 3.86; 95% CI 2.19–6.78; p < 0.001; Table 3; Fig. 3B). Among colon cancer patients, those with a high level of CA242 exhibited a poor survival compared with patients with a low level (HR 3.27; 95% CI 1.70–6.29; p < 0.001; Table 3; Fig. 3C). Patients with rectum cancer and a high CA242 level had a poor prognosis in comparison to rectum cancer patients with a low CA242 level (HR 3.35; 95% CI 1.94–5.79; p < 0.001; Table 3; Fig. 3D). When combining stages I and II, we found no difference in patient prognosis according to the CA242 level (HR 1.82; 95% CI 0.72–4.60; p = 0.209; Table 3; Fig. 3E). We further combined stages III and IV, finding that patients with a high CA242 level exhibited a poor prognosis compared with patients with a low CA242 level (HR 2.33; 95% CI 1.42–3.80; p = 0.001; Table 3; Fig. 3F).
Fig. 3
Disease-specific survival (DSS) according to Kaplan-Meier log-rank test of the CA242 subgroups. The cohort was dichotomized using the median values for CA242. (A) CA242 levels for patients <67 and (B) ≥67 years old. (C) CA242 levels for colon cancer and (D) rectum cancer. (E) CA242 levels for stages I–II and (F) stages III–IV.
3.7Univariate analysis of CA19-9
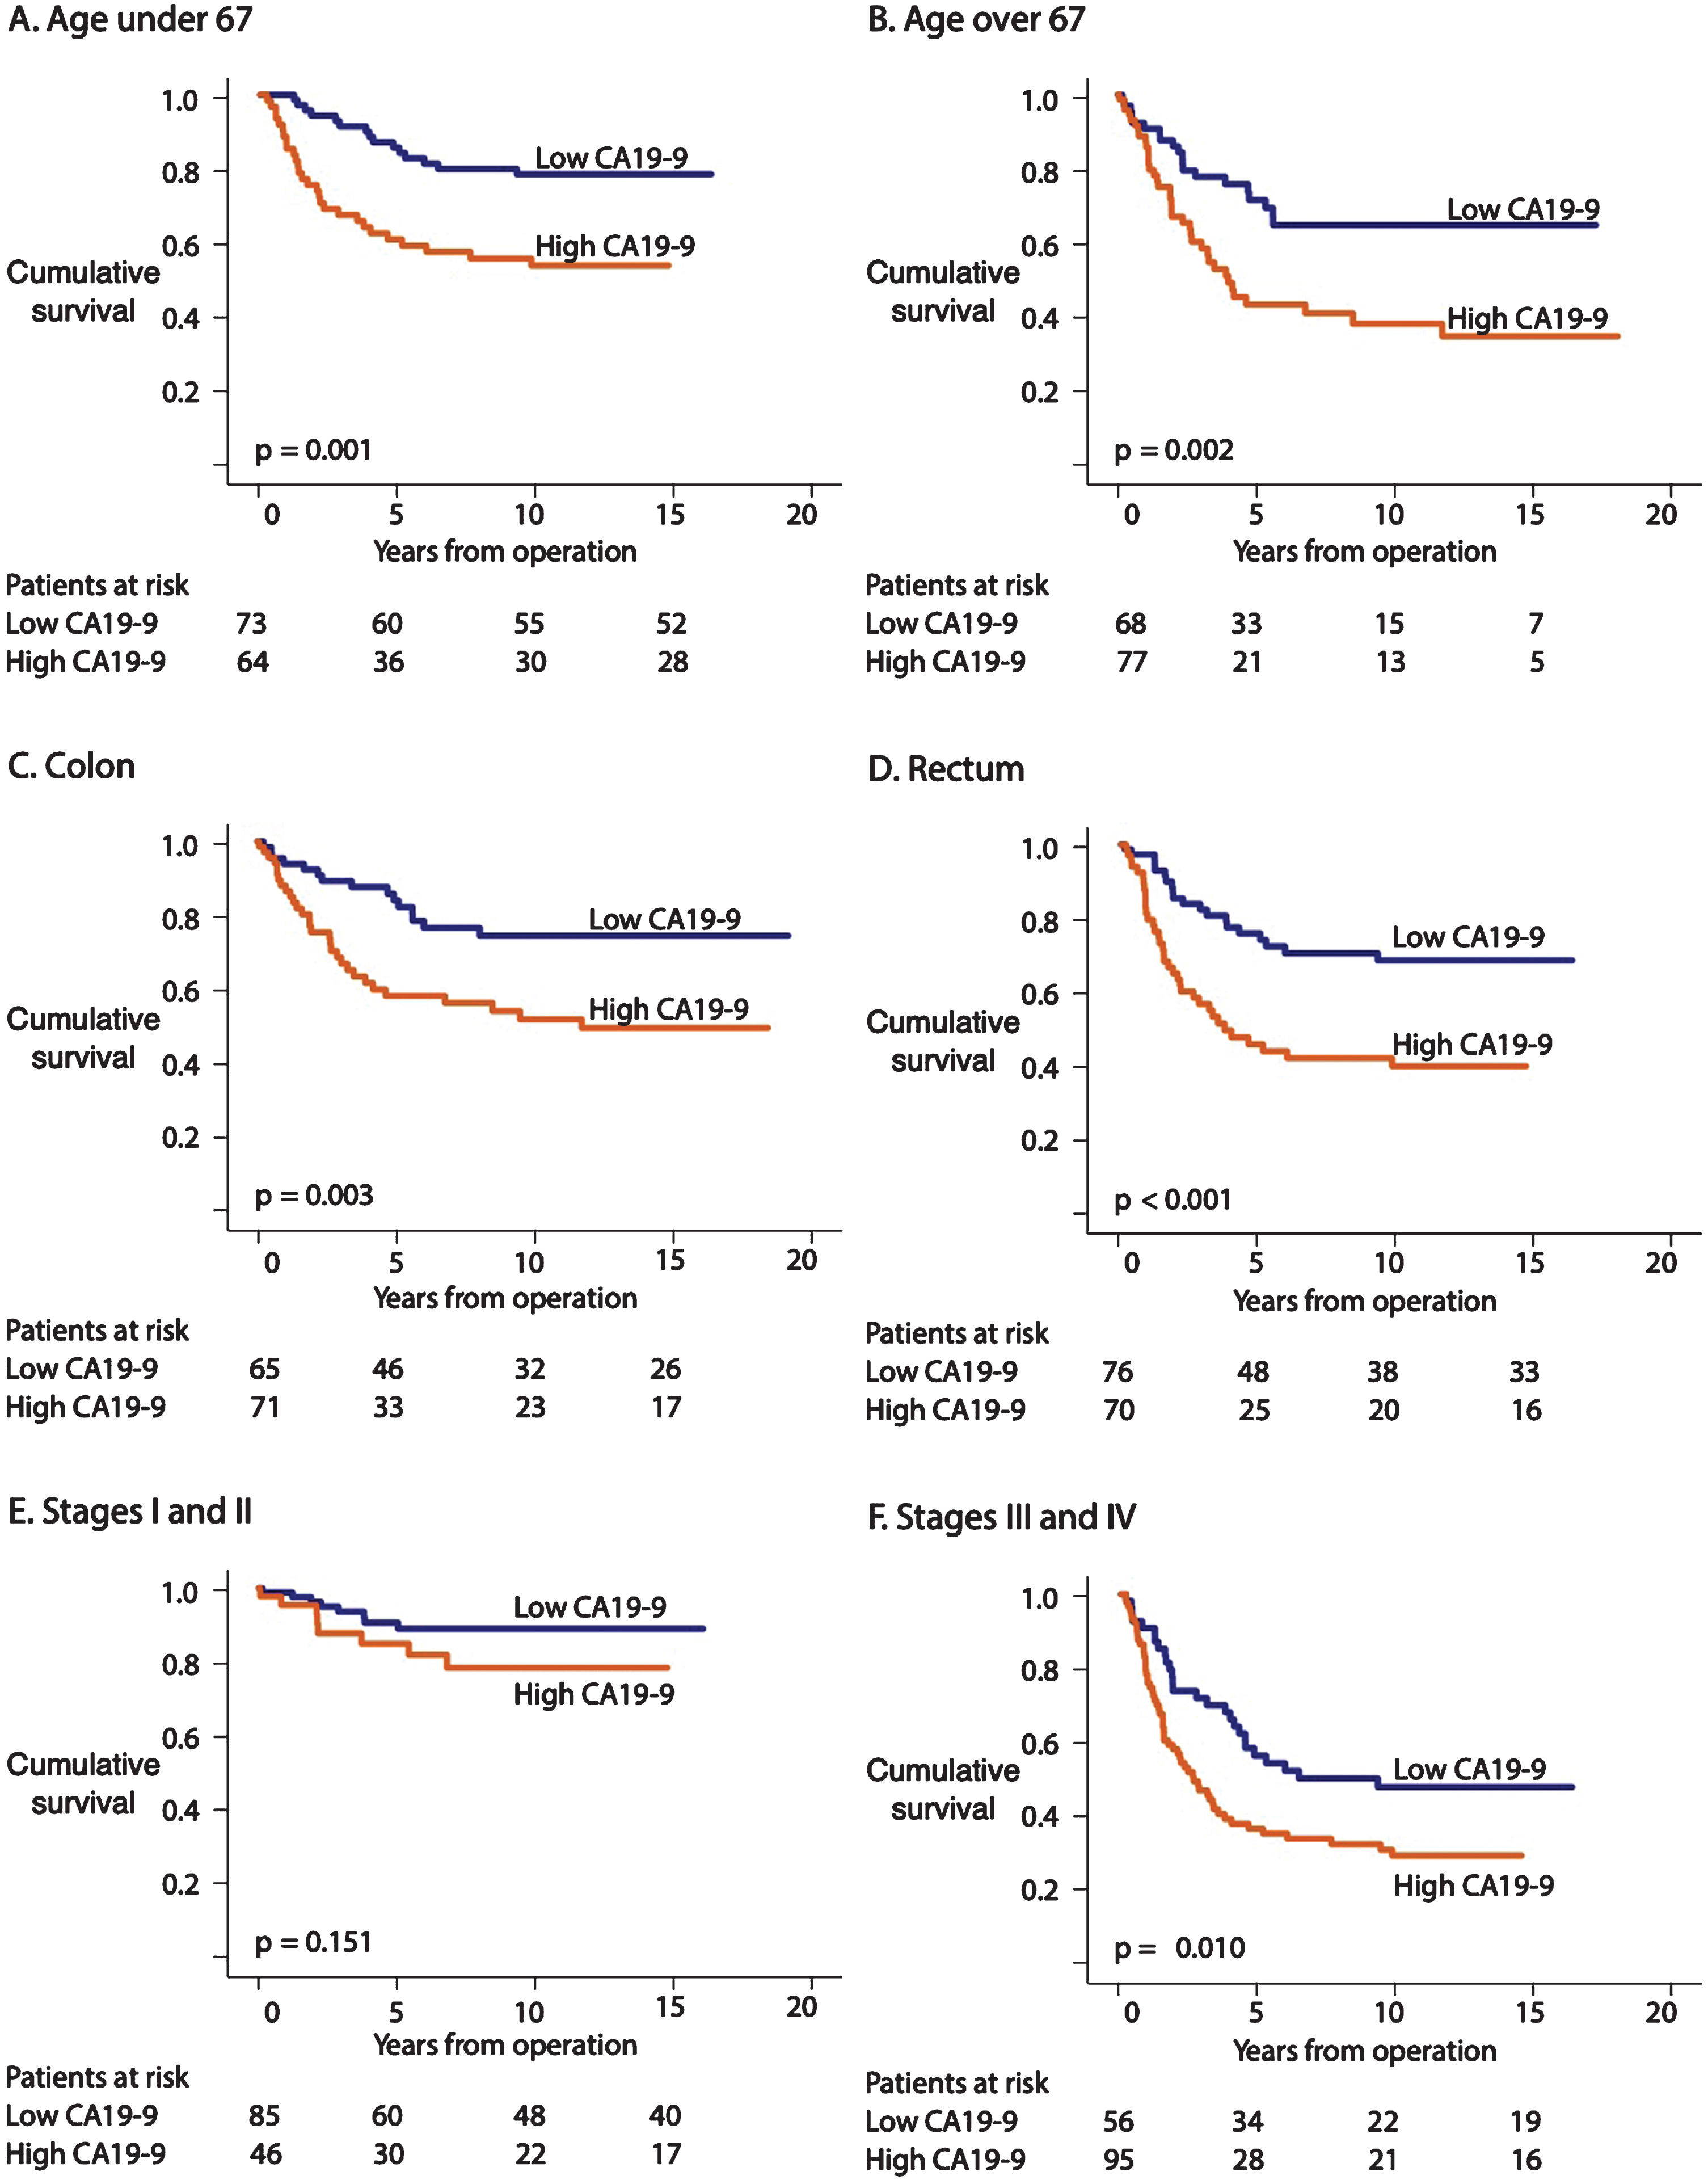
Survival among patients younger than 67 with a high CA19-9 level remained poor compared with patients with a low CA19-9 level (HR 2.77; 95% CI 1.48–5.19; p = 0.001; Table 3; Fig. 4A). Among patients 67 years or older, survival remained poor among those with a high CA19-9 level compared with those with a low CA19-9 level (HR 2.26; 95% CI 1.31–3.90; p = 0.003; Table 3; Fig. 4B). Patients with colon cancer exhibited a poor prognosis when the CA19-9 level was high compared with patients with a low CA19-9 level (HR 2.45; 95% CI 1.32–4.56; p = 0.005; Table 3; Fig. 4C). Rectum cancer patients exhibited a poor prognosis when CA19-9 levels were high versus low (HR 2.63; 95% CI 1.52–4.55; p = 0.001; Table 3; Fig. 4D). We found no difference in survival according to the CA19-9 level among patients with stage I–II CRC (HR 2.02; 95% CI 0.76–5.39; p = 0.160; Table 3; Fig. 4E). Stage III–IV CRC patients with a high CA19-9 level exhibited a poor prognosis compared with those with a low CA19-9 level (HR 1.81; 95% CI 1.14–2.86; p = 0.011; Table 3; Fig. 4F).
Fig. 4
Disease-specific survival (DSS) according to the Kaplan-Meier log-rank test of CA19-9 subgroups. The cohort was dichotomized based on the CA19-9 median. (A) CA19-9 levels for patients <67 and (B) ≥67 years old. (C) CA19-9 levels for colon cancer and (D) rectum cancer. (E) CA19-9 levels for stages I–II and (F) stages III–IV.
3.8Multivariate analysis
We performed a multivariate conditional forward-stepping analysis for the Cox regression model on all biomarkers: CEA, CA125, CA242, and CA19-9. The background clinical pathological characteristics included in the model were age, gender, and stage classification. We dichotomized CA125 using the Youden maximal cutoff point, and CEA, CA19-9, and CA242 based on their median values. In this multivariate analysis, the only marker that remained significant and independent together with stage, location, and age was CA125 (HR 1.91; 95% CI 1.24–2.95; p = 0.003; Table 4).
Table 4
Mutlivariate analysis of background data and CA125, CA242, CA19-9
| Background variables | HR | 95% CI | p |
| Age (67) | 1,03 | 1.02–1.05 | <0.001 |
| Location | 1,60 | 1.03–2.48 | 0,037 |
| Sex | 0,91 | 0.60–1.37 | 0,659 |
| Stage | |||
| I | |||
| II | 2,82 | 0.79–10.0 | 0,110 |
| III | 9,22 | 2.79–30.1 | <0.001 |
| IV | 19,6 | 5.67–67.8 | <0.001 |
| CEA median | 1,08 | 0.67–1.73 | 0,754 |
| Biomarkers | |||
| CA125 Yonden max | 1,91 | 1.24–2.95 | 0,003 |
| CA242 median | 1,67 | 0.91–3.04 | 0,095 |
| CA19-9 median | 0,97 | 0.57–1.67 | 0,915 |
Abbreviations: HR = hazard ratio; 95% CI = 95% confidence interval, CEA=carcinoembryonic antigen, CA125 = cancer antigen 125, CA242 = carbohydrate antigen 242, CA19-9 = carbohydrate antigen 19-9.
4Discussion
Previously, using a PEA and qPCR technique, we found that CA125 (MUC16) was a significant independent prognostic marker in colon cancer [4]. Here, we compared CEA, CA125, CA242, and CA19-9 as prognostic biomarkers in colon and rectum cancer. Not only did our results for CA125 in this study correlate strongly with our previous results, our findings highlight CA125 as a significant prognostic marker among CRC patients. Other significant biomarkers in our univariate analysis included CA242 and CA19-9. In the multivariate analysis with clinical background characteristics including CEA and the studied biomarkers CA19-9, CA242, and CA125, we found that CA125 was the only biomarker to serve as an independent prognostic factor. The biomarkers in our study associated with each other, and prognosis was poor for patients with high levels of any of them [8].
Because CEA is a verified and recommended biomarker used in CRC, we chose to use it as a background characteristic [8]. One strength to our study is that we could measure CEA from the same serum samples as CA125, CA242, and CA19-9, rather than simply relying on old, clinical laboratory results. As expected from previous studies, high serum CEA levels correlated with a poor prognosis, although in our study the prognostic value was inferior to that of the other markers CA125, CA242, and CA19-9.
The CA125 (MUC-16) levels from our Olink study strongly correlated with the CA125 levels in our present study, although the CA125 measurement techniques were rather different in the two studies [4]. This was expected, since the samples were partially taken from the same patient cohort. As we previously noted, we cannot directly compare CA125 (MUC-16) levels from the Olink PEA technique with biomarker levels taken from another study since the mathematical method is relative.
Previously, in a study by You et al. from 2019, among 735 CRC stage II and III patients, the biomarkers CA125, CEA, CA242, and CA19-9 played a significant role in patient prognostics [10]. Serum-level data were acquired from biochemistry reports and no patient received neoadjuvant radiotherapy or chemotherapy. We cannot, however, further elaborate upon the differences in the biomarker detection methods. They found CA125 levels varied significantly according to the tumor location and pathology type, but not according to clinical stage or patient age, thus diverging from our study, where CA125 was a significant and independent predictor in the univariate, multivariate, and subgroup analyses. Furthermore, we used DSS as the outcome measurement, whereas You et al. used disease-free survival (DFS) and overall survival (OS). By contrast, in a German study among 427 colon cancer patients, the preoperative serum levels analyzed using electrochemiluminescent immunoenzymometric assays of CA125 played no role in patient prognosis [2]. Our results differed from theirs likely due to the different cohorts—they only analyzed colon cancer patients. The divergent results may also stem from the different biomarker detection assays used. Unlike our study, they did not estimate the individual role of these biomarkers in the prognosis. We can still conclude, however, that serum biomarkers are of great importance in CRC prognostics. Furthermore, in the subgroup analysis, CA125 associated with a significant prognostic difference in colon cancer patients according to age, location, and clinical stage. CA125 is a known and recommended biomarker in the diagnosis and follow-up of ovarian cancer, but its prognostic role remains less clear [11], especially in cancers other than ovarian. Moreover, in contrast to modern tissue biomarkers, CA125 is a readily available low-cost biomarker suitable for a clinical laboratory setting.
We also included CA242 in our study, another interesting market yet less commonly used clinically. Furthermore, CA242 yielded excellent and promising results as a high-performing prognostic marker among CRC patients. In one of our older studies among 259 CRC patients, CA242 was identified as a strong significant independent prognostic factor alongside CEA [5]. By contrast, in another study among 310 CRC patients, preoperative CA242, CEA, and CA19-9 did not emerge as significant independent prognostic markers; they only held prognostic value when combined [12]. In yet another much earlier study from 1992, CA242 emerged as an independent prognostic factor in CRC compared to CEA; when combined with CEA, the sensitivity of CRC prognostics compared to CEA alone improved [13]. Since the biomarker analysis was developed on the basis of a forward sandwich assay with CA242 and carbohydrate antigen 50 (CA50) as relative values in that earlier study, we cannot directly compare the results with ours. We conclude, however, that CA242 is a significant yet not independent biomarker in CRC as well as in subgroup analyses based on age, location, and advanced clinical stage. However, much remains unexplored.
CA19-9 is a biomarker most often used in pancreatic ductal adenocarcinoma (PDAC) diagnosis and monitoring [7], but not routinely used or recommended in CRC diagnosis, monitoring, or prognostics. Yet, elevated CA19-9 levels are found in CRC patients with a poor prognosis compared with patients with low CA19-9 levels [14]. We found CA19-9 served as a significant but not independent prognostic tumor marker in CRC, whereas it was previously considered to hold predictive value [8, 15]. Thus, we can only conclude that CRC patients with high levels of CA19-9 experience a poor prognosis, although the other biomarkers in our study appear to play a more accentuated role in CRC prognostics.
In our multivariate analysis, we identified CA125 as an independent prognostic marker in CRC alongside the background variables age, location, and stage.
One strength of our study is the exceptionally long and thorough follow-up time complete with accurate DSS rates obtained from the Finnish Population Register Center and Statistics Finland. Several limitations to our study lie in the lack of recorded comorbidities as well as information related to adjuvant and neoadjuvant therapies.
To conclude, CA125 represents a significant and independent prognostic factor in CRC patients, clearly superior to the clinically used CEA. It is a low-cost biomarker that is readily available for use in a clinical laboratory setting. Additionally, CA242 performed better as a prognostic marker than CEA and CA19-9. We recommend that CA125 as well as CA242 be included in clinical trials.
Acknowledgments
We thank Fujirebio Diagnostics AB for the biomarker analytes.
This study was financially supported by Competitive State Research Financing of Expert Responsibility of Helsinki University Hospital (CH), the Finnish Cancer Foundation (CH and TK), Finska Läkaresällskapet (KB, CB, and CH), and the Sigrid Jusélius Foundation (CH). The funders played no role in the design of the study, the analysis, the interpretation of data, or in the writing of the manuscript.
Author contributions
CONCEPTION: CB and CH
DATA CURATION: CH, CB and TK
ANALYSIS OF DATA: KP, HK, KB, CB, HM and CH
PREPARATION OF THE MANUSCRIPT: KB
REVISION FOR IMPORTANT INTELLECTUAL CONTENT: All authors
Conflict of interest
The authors declare no conflict of interests.
Supplementary material
[1] The supplementary material is available in the electronic version of this article: https://dx.doi.org/10.3233/TUB-200069.
References
[1] | Bray F , Ferlay J , Soerjomataram I , et al. Global cancer statistics 2018: GLOBOCAN estimates of incidence and mortality worldwide for 36 cancers in 185 countries. CA Cancer J Clin. (2018) ;68: :394–424. |
[2] | Giessen-Jung C , Nagel D , Glas M , et al. Preoperative serum markers for individual patient prognosis in stage I–III colon cancer. Tumor Biol. (2015) ;36: :7897–906. |
[3] | Dressen K , Hermann N , Manekeller S , et al. Diagnostic Performance of a Novel Multiplex Immunoassay in Colorectal Cancer. Anticancer Res. (2017) ;37: :2477–86. |
[4] | Björkman K , Mustonen H , Kaprio T , et al. Mucin 16 and kallikrein 13 as potential prognostic factors in colon cancer: Results of an oncological 92-multiplex immunoassay. Tumor Biol. (2019) ;41: (7). |
[5] | Carpelan-holmström M , Haglund C , Lundin J , et al. Pre-operative serum levels of CA 242 and CEA predict outcome in colorectal cancer. Eur J Cancer. (1996) ;32: :1156–61. |
[6] | Kuusela P , Haglund C , Roberts PJ . Comparison of a new tumour marker CA 242 with CA 19-9, CA 50 and carcinoembryonic antigen (CEA) in digestive tract diseases. Br J Cancer. (1991) ;63: :636–40. |
[7] | Ducreux M , Cuhna AS , Caramella C , et al. Cancer of the pancreas: ESMO Clinical Practice Guidelines for diagnosis, treatment and follow-up. Ann Oncol. (2015) ;26: :56–68. |
[8] | Yu Z , Chen Z , Wu J , et al. Prognostic value of pretreatment serum carbohydrate antigen 19-9 level in patients with colorectal cancer: A meta-analysis. PLoS One. (2017) ;12: (11). |
[9] | Duffy MJ , Lamerz R , Haglund C , et al. Tumor markers in colorectal cancer, gastric cancer and gastrointestinal stromal cancers: European group on tumor markers 2014 guidelines update. Int Journal of Cancer. (2014) ;134: :2513–22. |
[10] | You W , Sheng N , Yan L , et al. The difference in prognosis of stage II and III colorectal cancer based on preoperative serum tumor markers. J Cancer. (2019) ;10: :3757–66. |
[11] | Colombo N , Sessa C , Bois Du A , et al. ESMO-ESGO consensus conference recommendations on ovarian cancer: Pathology and molecular biology, early and advanced stages, borderline tumours and recurrent disease. Int J Gynecol Cancer. (2019) ;29: :728–60. |
[12] | Wang J , Wang X , Yu F , et al. Combined detection of preoperative serum CEA, CA19-9 and CA242 improve prognostic prediction of surgically treated colorectal cancer patients. Int J Clin Exp Pathol. (2015) ;8: :14853–63. |
[13] | Nilsson O , Johansson C , Glimelius B , et al. Sensitivity and specificity of CA242 in gastro-intestinal cancer. A comparison with CEA, CA50 and CA 19-9. Br J Cancer. (1992) ;65: :215–21. |
[14] | Hidaka E , Maeda C , Nakahara K , et al. High Serum CA19-9 Concentration Predicts Poor Prognosis in Elderly Patients with Stage IV Colorectal Cancer. Gastrointest Tumors. (2018) ;5: :117–24. |
[15] | Polat E , Duman U , Duman M , et al. Diagnostic value of preoperative serum carcinoembryonic antigen and carbohydrate antigen 19-9 in colorectal cancer. Curr Oncol. (2014) ;21: :e1. |

