
Influence of shoe upper structure on shoe microclimate and human physiological characteristics during running
Abstract
BACKGROUND:
Shoes upper has been shown to affect the shoe microclimate (temperature and humidity). However, the existing data on the correlation between the microclimate inside footwear and the body’s physical factors is still quite limited.
OBJECTIVE:
This study examined whether shoes air permeability would influence foot microclimate and spatial characteristics of lower limb and body.
METHODS:
Twelve recreational male habitual runners were instructed to finish an 80 min experimental protocol, wearing two running shoes with different air permeability.
RESULTS:
Participants wearing CLOSED upper structure shoe exhibited higher in-shoe temperature and relative humidity. Although there was no significant difference, shank temperature and metabolism in OPEN upper structure shoes were lower.
CONCLUSIONS:
This indicates that the air permeability of shoes can modify the microclimate of the feet, potentially affecting the lower limb temperature. This study provides relevant information for the design and evaluation of footwear.
1.Introduction
Footwear is essential in people’s daily lives, with the primary requirements being functionality and comfort. Despite the multiple factors influencing foot comfort, the interplay between elevated temperature and humidity within footwear emerges as a critical determinant affecting the sensation of foot comfort [1].
Notably, the feet constitute approximately 7% of the body surface area, with foot sweat loss contributing to 3%–4% of total body sweat loss [2, 3, 4]. Footwear acts as an intermediary barrier, isolating the foot from the external environment. During prolonged periods of walking or running, the confinement of the feet within shoes results in elevated levels of both temperature and humidity inside the footwear [5, 6]. This accumulation of heat and moisture within the microclimate between the skin and footwear can result in a diminished capacity for heat dissipation from the skin to the shoe interior as the thermal gradient narrows [7]. Such a reduction in heat loss can precipitate discomfort in the feet. Moreover, the increased levels of temperature and humidity inside footwear not only lead to discomfort but also create conditions favorable for the growth of microorganisms. As a result, this may contribute to the development of odors or bacterial infections, underscoring the significance of these environmental factors in the overall perception of foot comfort and health [8].
Under controlled climatic conditions (23–25oC, 50% RH), the temperature and humidity levels inside footwear typically range from 27 to 37∘C and 67–96%, respectively [9, 10, 11]. Concurrently, research into sweat rates across the foot surface consistently reveals a heterogeneous distribution [12, 13], with areas such as the heel and sole particularly prone to elevated temperatures and moisture accumulation [1]. The correlation between objective assessments and subjective perceptions of the shoe microclimate does not always exhibit concordance. For instance, prior studies have indicated that during running, closed shoe uppers elicit higher thermal sensations, perceptions of wetness, and feelings of stickiness compared to open shoe uppers, findings that align with objective data regarding the shoe microclimate [1]. Conversely, sother research has suggested that an individual’s perception of foot wetness does not necessarily correlate with actual sweat production on the foot [14]. Furthermore, it remains ambiguous whether discomfort experienced in the foot is primarily attributed to increased temperatures or moisture within the footwear [10, 15].
Physical exercise facilitates the conversion of mechanical energy, derived from gait motions, into thermal energy, potentially resulting in elevated temperatures within footwear. Additionally, it has been demonstrated to impose additional strain on the cardiovascular system of the lower extremities, manifesting as a 33% increase in blood flow from a resting state [10, 16]. Previous research has indicated that a higher landing velocity during walking or running correlates with an increase in skin temperature and a more substantial metabolic rate [16]. However, research about the relationship between footwear microclimate and lower limb temperature and whole body metabolism is limited. Exploring the relationship between foot heat generation and overall body energy metabolism would be a valuable endeavor.
The aim of this study includes: 1) to investigate shoe microclimate, thermal characteristics of lower limb and body at different periods; 2) to compare whether shoe microclimate, spatial characteristics of lower limb and body are affected by the permeability of the shoe; 3) to ascertain the perceptibility of alterations in shoe microclimate. These findings could provide a theoretical basis for the following footwear research and design.
2.Methods
2.1Participants
Twelve male recreational runners (previous research showed that there was no significant difference in foot microclimate changes between different genders [19]), with a mean age of 25.1
2.2Shoe conditions
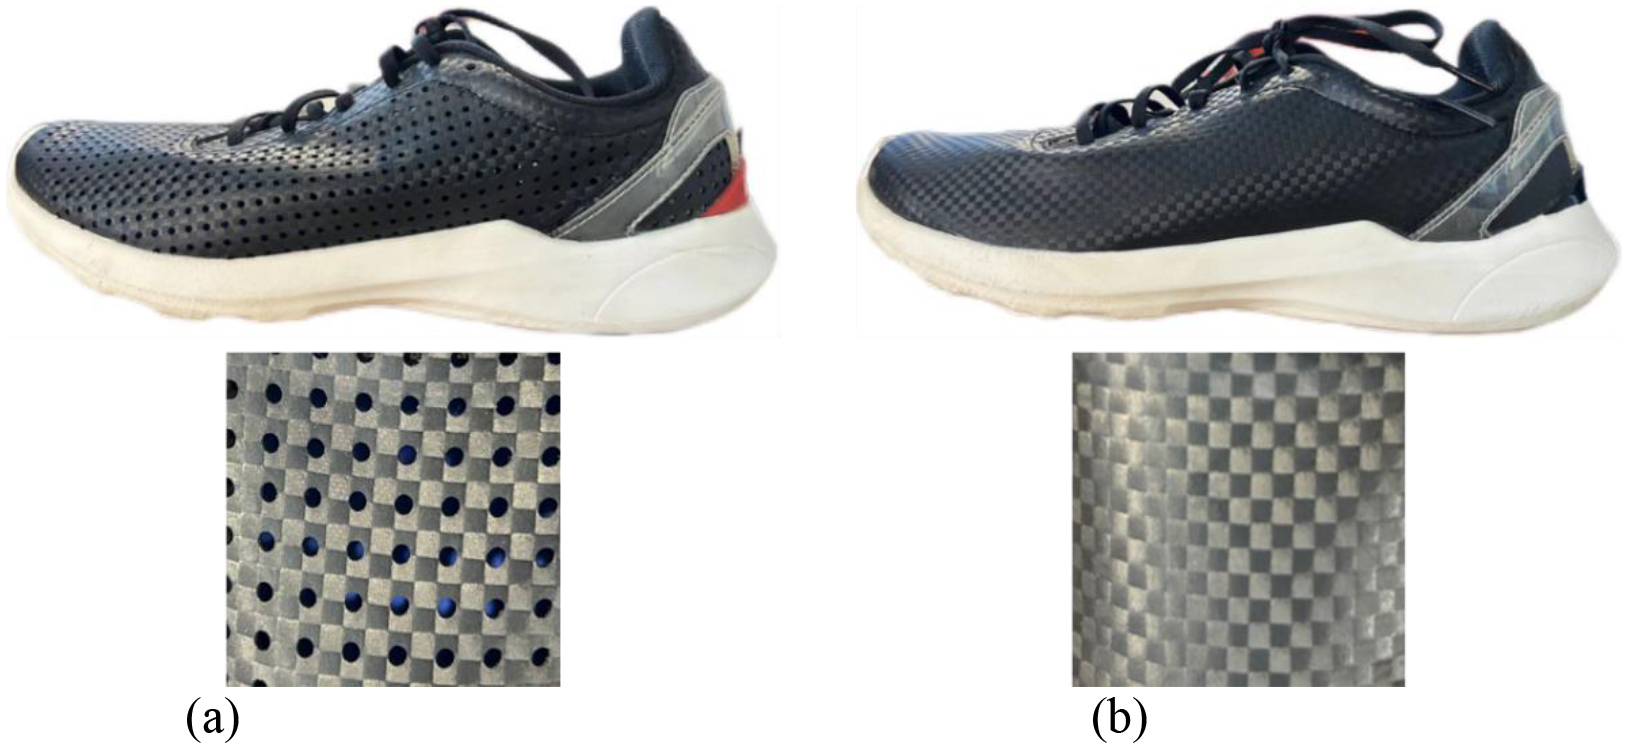
Two identical shoes in US size 9.0 with only different air permeability (CLOSED upper construction vs OPEN upper construction, Fig. 1a and b) were built for the research (LN tested model, Li Ning company, Beijing, China).
Figure 1.
(a) CLOSED upper construction (b) OPEN upper construction.
2.3Experimental protocol
The participants engaged in two experimental trials conducted at consistent times of day to mitigate the potential impacts of circadian rhythm. These trials occurred in a climate-controlled environment set to 23∘C and 35% relative humidity [1]. Each participant completed one trial while wearing a shoe with an OPEN upper construction and another while wearing a shoe with a CLOSED upper construction. Preceding the testing phase, participants removed their t-shirts, changed into running shorts, and cleansed their feet with tepid water. Subsequently, after instrumentation, the participants wore standard socks, and in-shoe temperature and relative humidity sensors (DS1922L, Hang Zhou meacon automation, China) were attached to their right feet to monitor in-shoe microclimate variables (Fig. 2(a)). Additionally, skin temperature was assessed at eight locations, including the chest, upper arm, thigh, calf, and lateral shank regions, using iButton wireless temperature loggers (Maxim, San Jose, USA) secured to the skin with surgical tape. Concurrently, metabolism and heart rate data were collected at 5-second intervals throughout the experimental protocol (Fig. 2(b)). Each subject takes a different amount of time, from resting to getting on the treadmill. Energy metabolism data was only collected during the running once the subjects had achieved a stable gait on the treadmill. The comprehensive 80-minute protocol encompassed a 10-minute rest period, during which participants wore the test shoes and remained seated upright, followed by a 40-minute running session at a constant speed of 9 km/h, and concluded with a 30-minute recovery period in an upright seated position. This protocol has been previously applied in studies on footwear microclimate [16]. The treadmill incline was raised by 1 degree to simulate air resistance in road running. Subjective assessments, including thermal sensation and thermal comfort for the entire body, thermal sensation, wetness perception, and thermal comfort specifically for the foot, were gauged using scales, with data collection occurring every 5 minutes and focused solely on the left foot (Fig. 3). Furthermore, the participants’ semi-nude body mass was measured pre-test and post-recovery using electronic scales accurate to 0.001 kg (Mettler Toledo kcc150, Mettler Toledo, Leicester, UK). The mass of the standard socks (left foot) was also recorded pre-test and post-test using electronic scales accurate to 0.001g (FX-500i, A&D Company Ltd, Oxfordshire, UK). To ensure that the shoe are thoroughly dry before testing, each pair of test shoes is tested only once a day, they are promptly dried after the test is completed.
Figure 2.
(a) In-shoe temperature and relative humidity sensors on the participants’ right feet; (b) body temperature sensors, heart rate and energy and metabolism measurements.
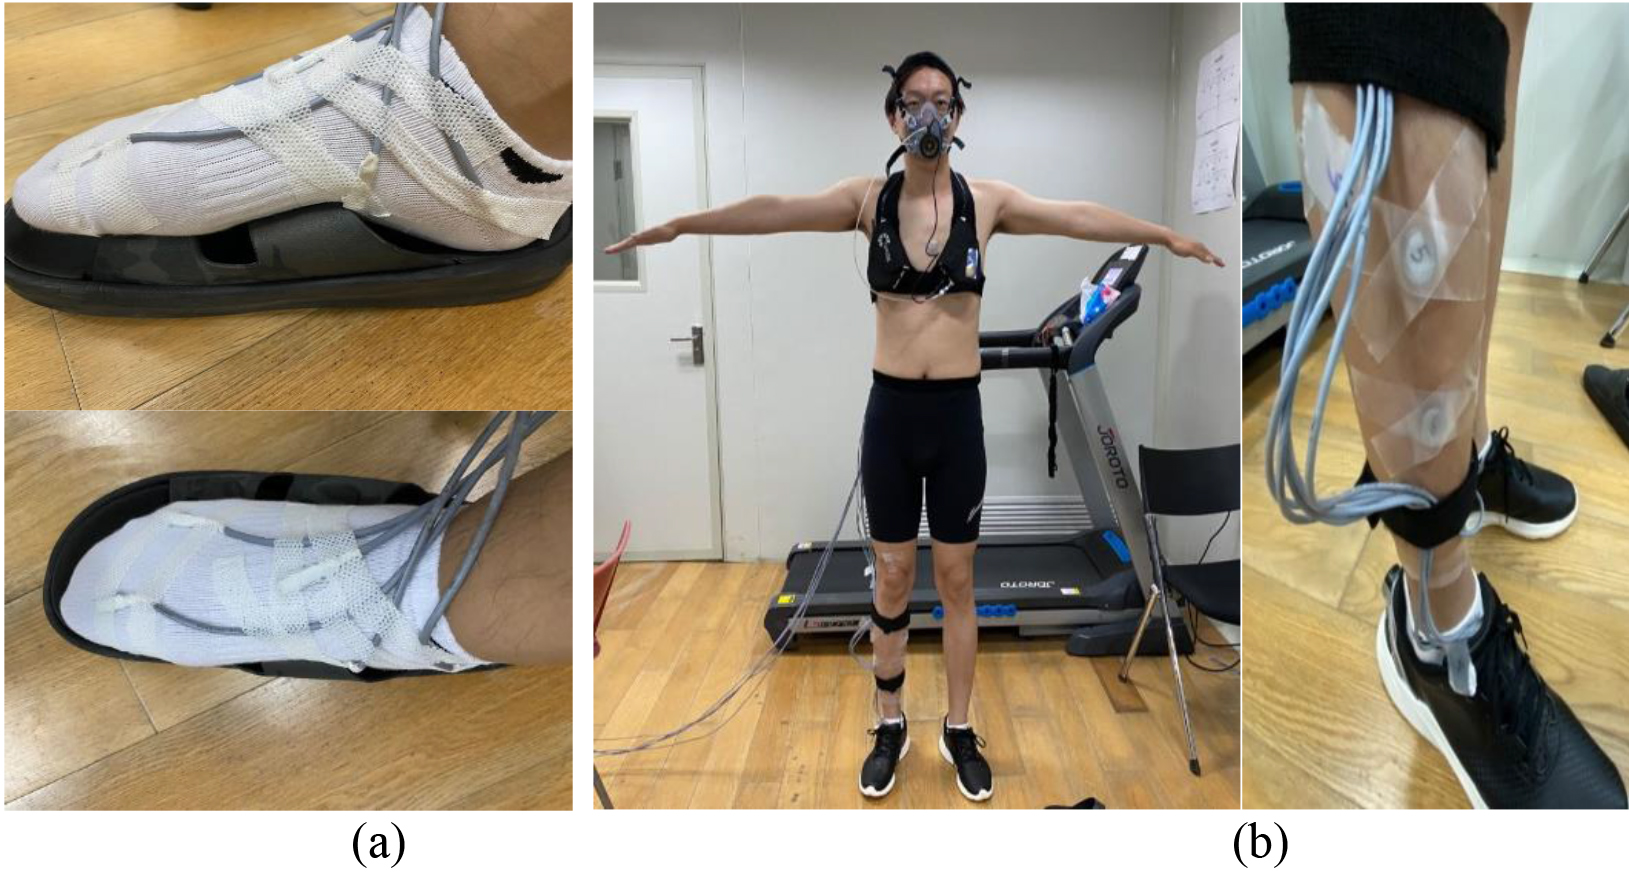
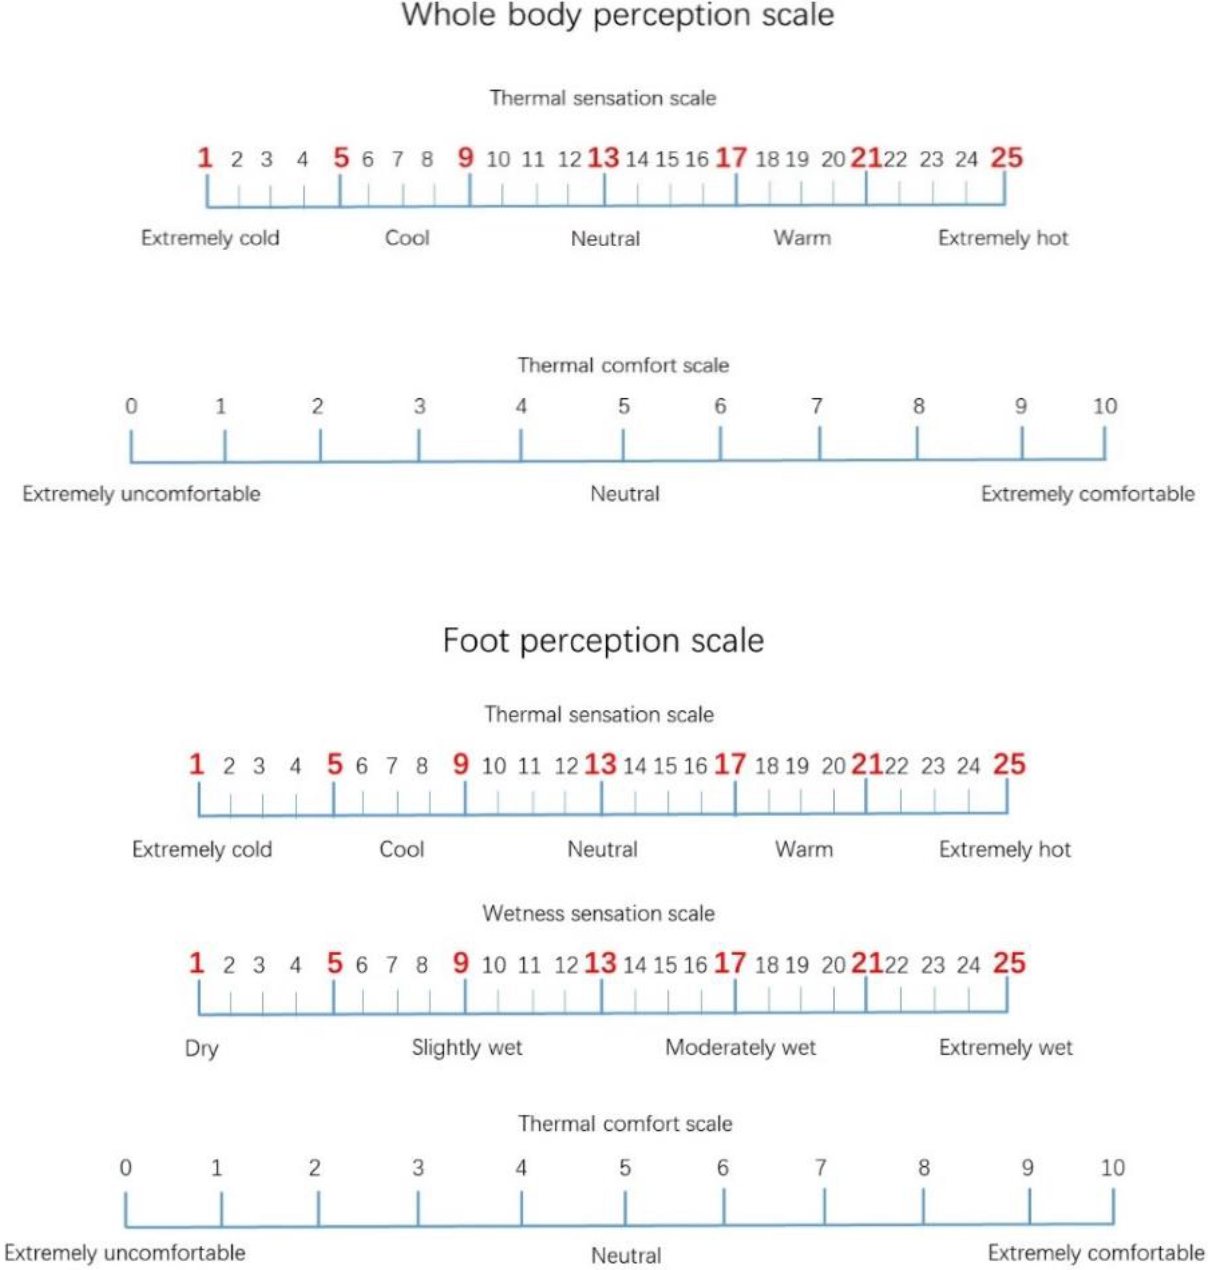
Figure 3.
Whole body perception scale and Foot perception scale.
2.4Instrumentation and calculations
2.4.1Gross sweat loss and sock sweat absorption
Gross sweat loss (GSL) was calculated based on the mass change of each participant before and at the end of the test:
Where;
Sock sweat absorption (SSA) was calculated based on the mass change before and at the end of the running period:
Where;
2.4.2Mean skin body and shank temperature
The body skin temperature (
The shank skin temperature (
2.4.3In-shoe temperature and in-shoe relative humidity
Temperature and relative humidity sensors were meticulously positioned at five specific sites on the participants’ right foot to capture variations in in-shoe temperature and relative humidity. These sensors were securely fastened using surgical tape to ensure accurate data collection. Subsequently, data retrieval occurred wirelessly via a custom-designed Bluetooth data transmission system.
2.4.4Metabolism and heart rate
Metabolic measurements were obtained through breath analysis using a telemetric portable metabolic system (MetaLyzer3B-R3; Cortex, Leipzig, Germany) throughout all testing sessions. Before each test, gas analyzers were calibrated using both ambient air (O2: 20.93% and CO2: 0.03%) and a gas mixture of known composition (O2: 16.00% and CO2: 5.00%). Subjects wore face masks to facilitate simultaneous breathing through the mouth and nose, enhancing comfort during the procedure. Furthermore, heart rate (HR) was continuously monitored using a wireless Polar monitoring system (Polar Electro Oy, Kempele, Finland) throughout all testing sessions.
2.4.5Subjective perception
To evaluate thermal sensation, wetness perception, and thermal comfort, ordinal scales were employed. These scales were meticulously designed by guidelines outlined in ISO 10551 [18]. Considerable attention was given to selecting appropriate descriptors, ensuring sensitivity, accuracy, and ease of use for each scale. The implemented scales allowed for the collection of subjective information concerning thermal sensation, thermal comfort for the entire body, thermal sensation, wetness perception, and thermal comfort specifically for the foot.
2.5Statistical analysis
Initial Shapiro-Wilk tests were used to validate that the data were normally distributed. Paired t-tests were conducted on each of the following variables: GSL, sock sweat absorption, Tbsk, Tssk, in-shoe temperature and relative humidity, metabolism, HR, and subjective perception. The alpha level was set at 0.05. All statistical analyses were conducted using SPSS 20.0 (SPSS Inc., Chicago, IL, USA).
3.Results
3.1Gross sweat loss, sock sweat absorption, and heart rate
There were no significant differences in the gross sweat loss (GSL) and heart rate (HR were averaged in the last 10 minutes) between the two shoe conditions (
Table 1
Gross sweat loss and sock sweat absorption by two test shoes
| Variable | OPEN upper structure | CLOSED upper structure |
|---|---|---|
| Gross sweat loss (GSL) (kg) | 0.66 | 0.70 |
| Sock sweat absorption (SSA)(g) |
1.06 |
1.39 |
| Heart rate (HR) (bmp) | 163.87 | 164.33 |
*Means a significant difference (
3.2Mean skin body and shank temperature
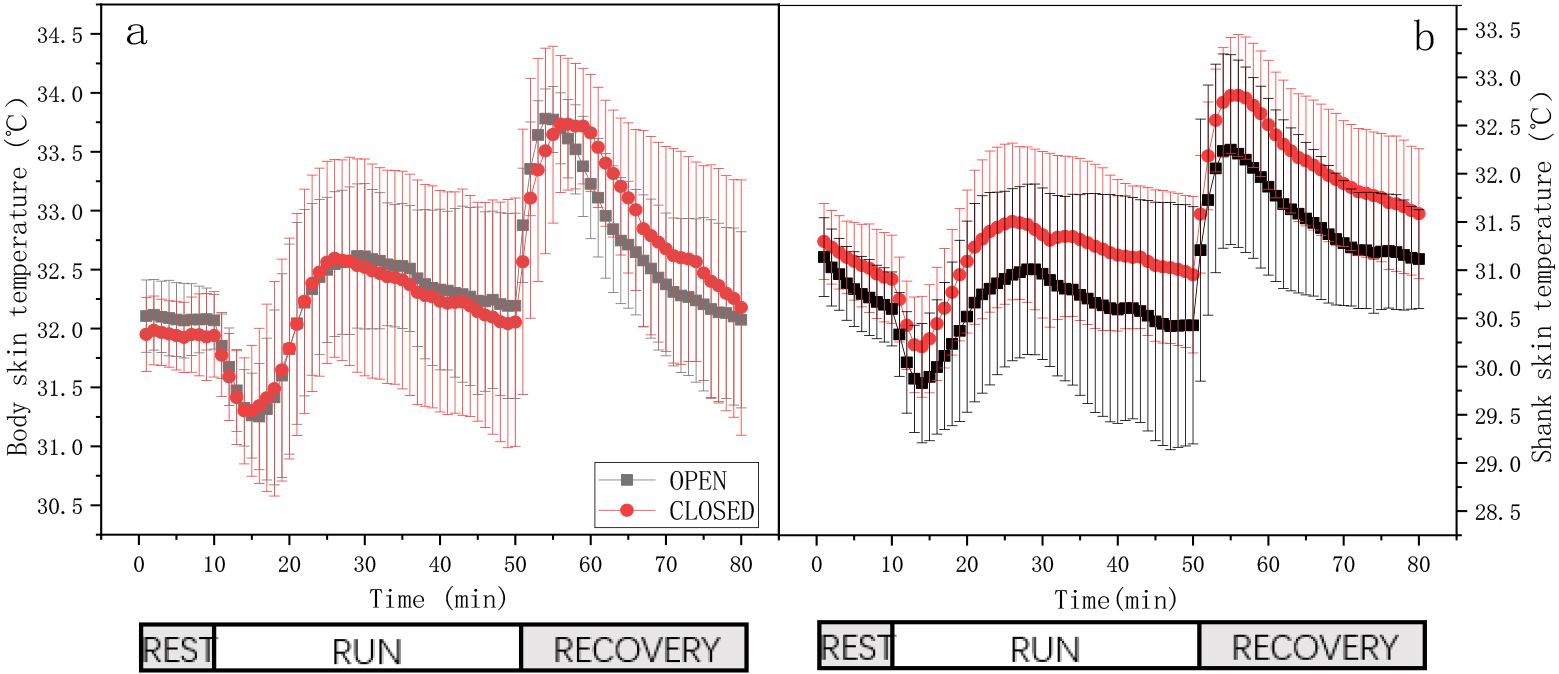
Body and shank temperatures were collected every minute. In this study, only the data from the last minute, representing the corresponding stage, was analysed. There were no significant differences in the body skin temperature (
Figure 4.
Skin temperatures of the body and shank with two test shoes during the rest, running, and recovery stages.
3.3sIn-shoe temperature and in-shoe relative humidity
In-shoe temperature and humidity were collected every minute. In this study, only the data from the last minute, representing the corresponding stage, was analyzed. In-shoe temperature revealed significant differences between two shoe conditions at the end of rest (OPEN vs CLOSED: 29.9
Figure 5.
In-shoe temperature and relative humidity with two test shoes during the rest, running, and recovery stages * means a significant difference (
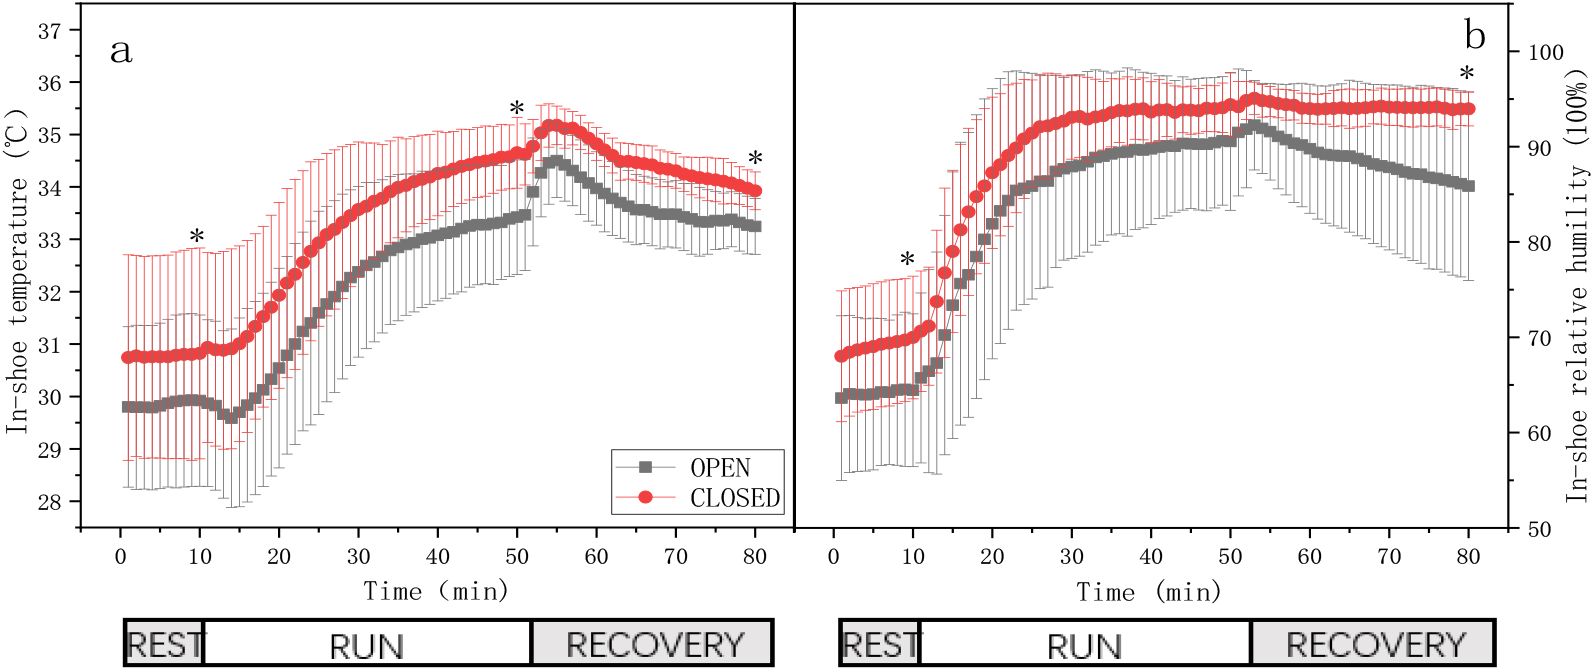
A lower in-shoe relative humidity was observed in the OPEN upper structure shoe at the end of the rest period (OPEN vs. CLOSED: 64.5
Figure 6.
VO2 and VCO2 by two test shoes during the running stage.
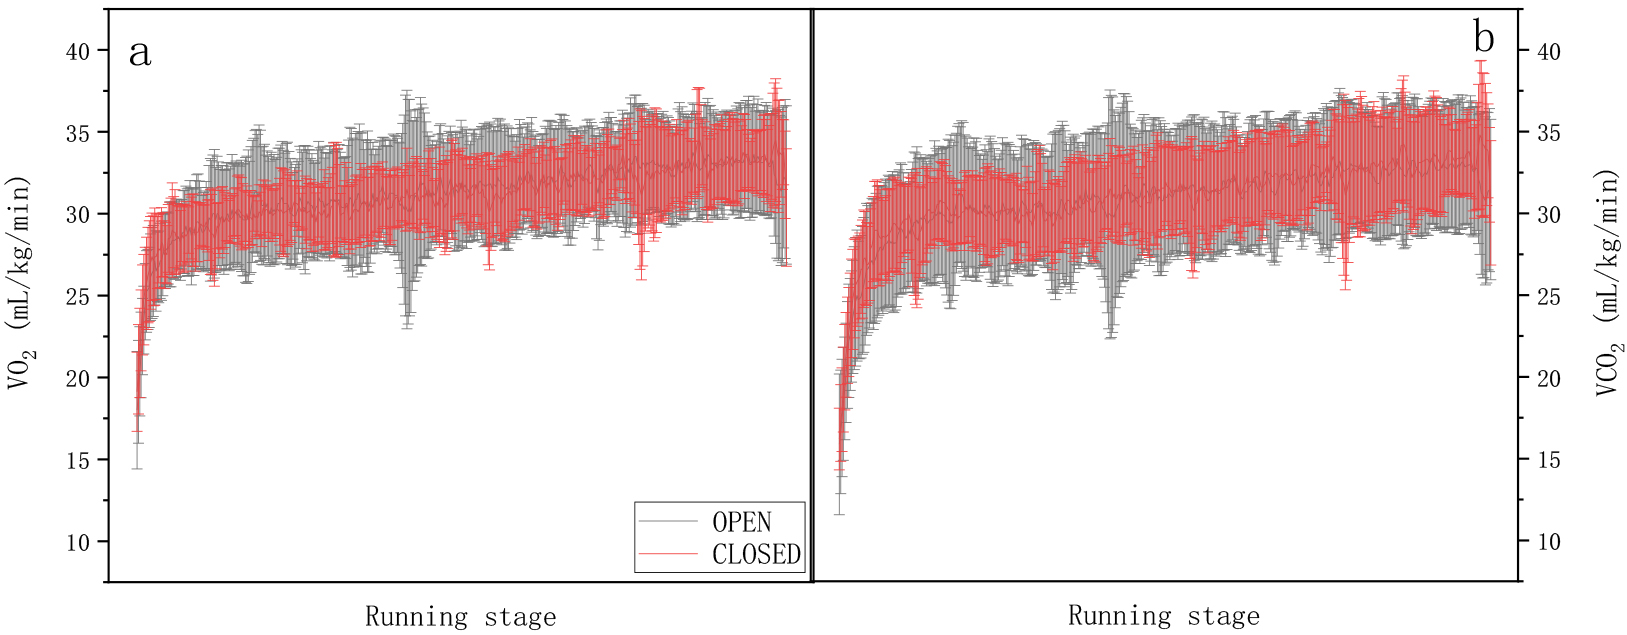
3.4Metabolism
The variation curves of VO2 and VCO2 during the running stage are depicted in Fig. 6a and b. The dynamics of VO2 and VCO2 were similar between the two shoe conditions: both VO2 and VCO2 showed a sharp increase at the start of running, followed by a slower rise over the next 20 minutes, and then remained almost constant during the last 10 minutes.
While there was no significant difference in the variables between the two shoe conditions (
Table 2
Metabolism, VO2, and VCO2 in the last 10 minutes by two test shoes
| Variable | OPEN upper structure | CLOSED upper structure |
|---|---|---|
| Metabolism (W/m2) | 425.9 | 429.1 |
| VO2 (mL/kg/min) | 32.9 | 33.1 |
| VCO2 (mL/kg/min) | 32.6 | 33.1 |
Figure 7.
Whole body and foot subjective perception. * means a significant difference (
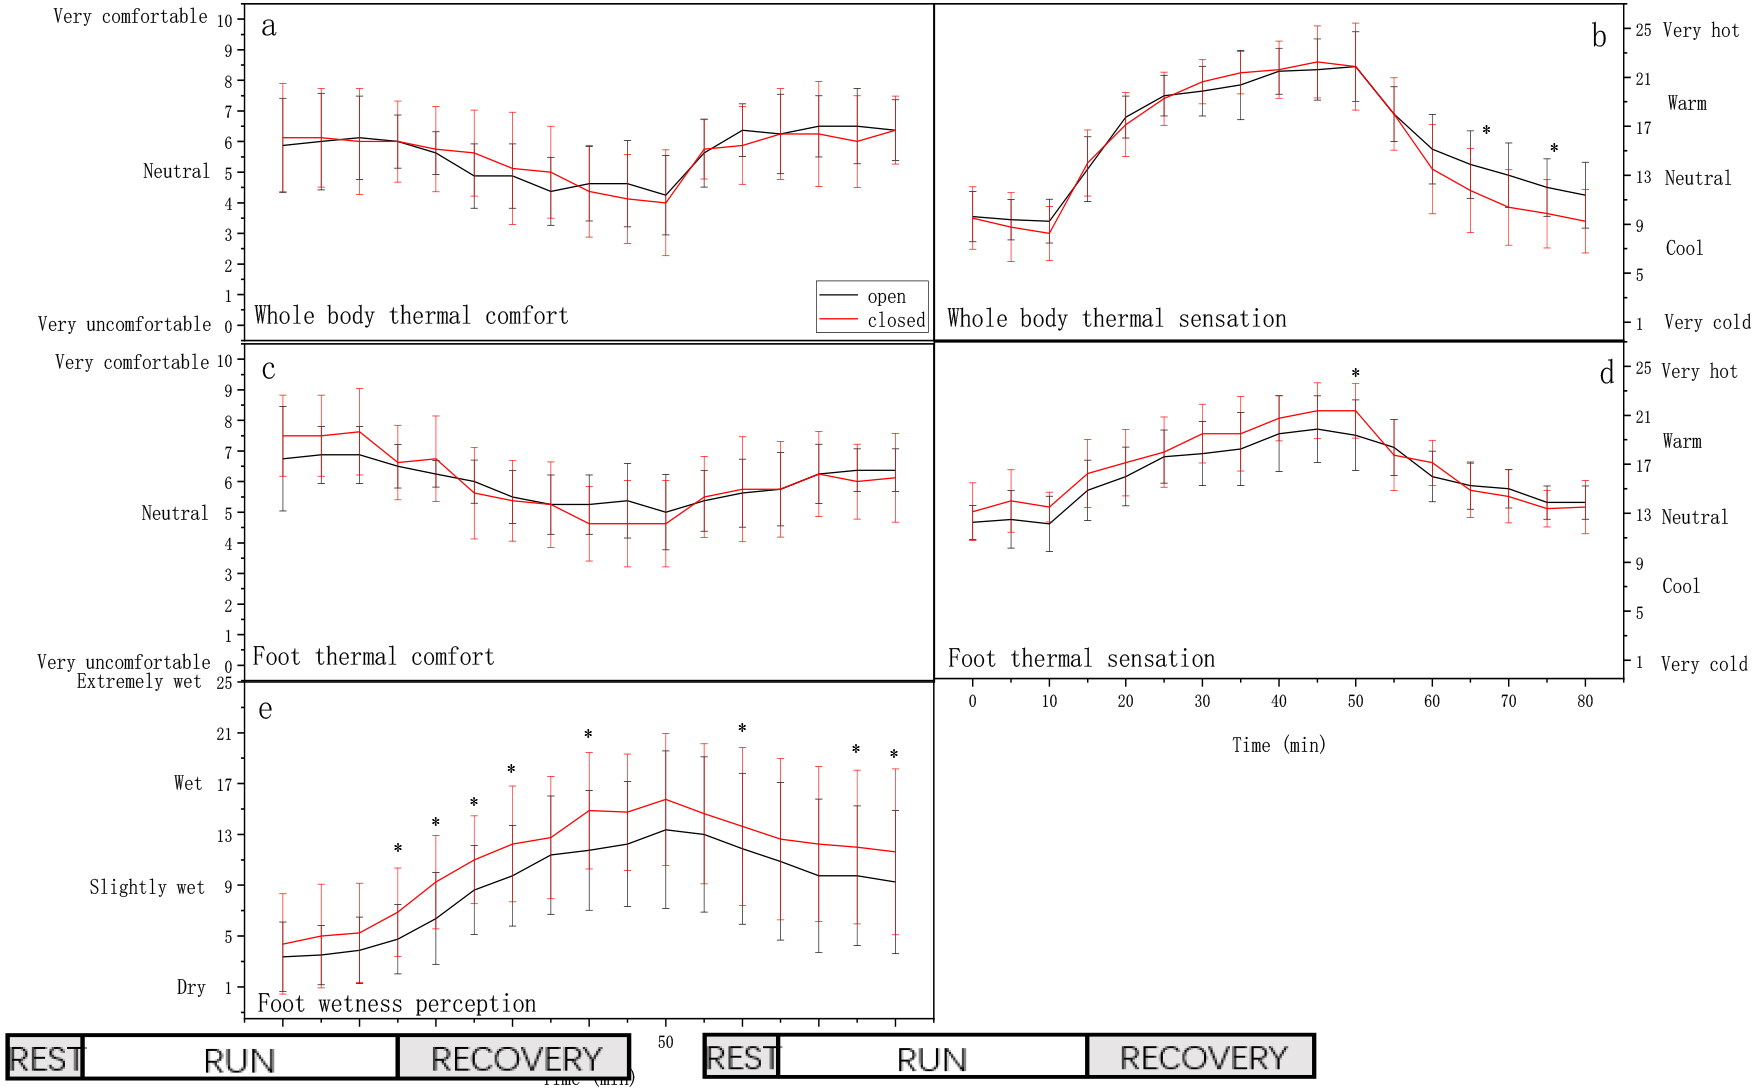
3.5Subjective perception
In terms of whole-body and foot thermal comfort (Fig. 7a, c), participants reported being neutral and moderately comfortable, respectively, with minimal changes over time. Participants tended to feel slightly uncomfortable during the running stage regardless of the shoe conditions, but returned to feeling slightly comfortable during the recovery stage. However, there was no significant difference in whole-body and foot thermal comfort between the two shoe conditions during the rest, running, and recovery stages (
During the rest stage, participants reported feeling cool for the whole body and neutral for the foot (Fig. 7b, d), regardless of the shoe condition. Subsequently, both body and foot thermal sensations transitioned from cool/neutral to warm/hot during the running stage. Notably, significant differences in foot thermal sensation were observed after the running phase (OPEN vs CLOSED: 19.4
Body and foot thermal sensation decreased from warm/hot to neutral/cool during the recovery stage. Significant differences in whole body thermal sensation were observed at time points 70 min (OPEN vs CLOSED: 10.4
For the foot wetness perception (Fig. 7e), participants were barely wet at the rest stage regardless of shoe conditions. Foot wetness perception increased and reached a moderate level of wetness in the CLOSED upper shoe condition, while it reached a slightly wet level in the OPEN upper shoe condition during the running stage. There were significant differences at time points 15 min (OPEN vs CLOSED: 4.8
4.Discussion
The study showed that general temporal characteristics of body and shank thermal variables and shoe microclimate were similar between two shoe conditions. Although a discernible influence of shoe permeability on shoe microclimate was evident throughout the experimental protocol, there is no significant difference for body and shank temporal characteristics.
4.1Influence of shoe permeability on shoe microclimate
The dynamics of shoe microclimate were similar between shoe conditions. Shoe temperature and relative humidity remained relatively stable for the resting stage, with a following increased trend at the running stage. During the recovery stage, the in-shoe temperature reached its maximum in the first few minutes and then gradually decreased. The in-shoe relative humidity of the OPEN upper structure showed a gradual decline, while the CLOSED upper structure shoe condition maintained almost the same level of humidity as during the running stage.
The experimental results indicated that the in-shoe temperature for the CLOSED upper structure was higher at the end of the rest, running, and recovery stages compared to the OPEN upper structure. These findings are consistent with previous studies on running footwear [1, 19] as well as research on other types of footwear such as protective and hiking footwear [15, 20]. There is a relative movement between foot and shoe during the running stage, thus leading to the air exchange accompanied by convective heat transfer between in-shoe and ambient air through the upper [21, 22]. The two key factors of this heat transfer mechanism are upper permeability and relative movement. The research findings are consistent with mechanism insight. Regarding upper permeability, the CLOSED upper restricts convective heat transfer, resulting in higher in-shoe temperatures. Additionally, due to reduced relative movement and decreased airflow from running to the recovery stage, there is a slight increase in in-shoe temperature for both types of upper structures. Indeed, previous research showed that in-shoe temperature and ventilation rates were inversely proportional [16].
In terms of in-shoe relative humidity, the CLOSED upper structure exhibited higher levels at the end of the rest and recovery stages compared to the OPEN upper structure. While there was no significant difference at the end of the running stage, this could be attributed to the insufficient air permeability of the OPEN upper structure, resulting in moisture accumulation within the shoe. The results of sock sweat absorption aligned with in-shoe relative humidity at the end of recovery. The mechanism suggests that sweat accumulation may be related to the heat in the feet [1]. Previous research has indicated that increased upper ventilation can reduce foot and in-shoe temperatures, effectively limiting moisture accumulation. Therefore, the OPEN upper structure exhibited lower moisture accumulation and in-shoe relative humidity [22, 23].
4.2Influence of shoe permeability on subjective perception
Previous research has indicated that in a hot environment, skin moisture levels can lead to thermal discomfort [24]. However, it remains unclear whether foot discomfort is attributable to elevated temperatures or the accumulation of moisture within the footwear [10, 15]. Interestingly, in this study, significant differences in in-shoe temperature and in-shoe humidity did not align with the overall subjective thermal comfort experienced by the whole body and feet. This suggests several preliminary conclusions: 1) distinguishing between temperature and moisture in natural wear tests may prove challenging due to the association between in-shoe temperature and humidity, a finding consistent with prior studies [1]; 2) the shoe microclimate may have minimal impact on overall subjective comfort for the entire body.
With regard to subjective thermal sensation, an intriguing finding emerged: the whole-body thermal sensation was higher for the OPEN upper structure during the recovery stage. This leads us to conclude that in-shoe temperature affects subjective whole-body sensation; individuals experiencing higher in-shoe temperatures may report lower whole-body sensation. Additionally, foot thermal sensation aligned with in-shoe temperature at the end of the running stage, which is consistent with our experimental hypothesis.
Regarding foot wetness perception, there was alignment between foot wetness perception and in-shoe humidity during the recovery stage. However, during the rest and running periods, perceptions of wetness and in-shoe humidity were not consistent, indicating a potentially more complex interaction among relevant parameters.
4.3Influence of shoe permeability on body and shank thermal variables
The dynamics of shank and body temperature were similar between the two shoe conditions during the running and recovery stages. Both shank and body temperatures decreased in the first few minutes of the running stage, consistent with previous research indicating a drop in skin temperature for subjects during bicycle exercise. This suggests that the constriction of blood vessels, rather than sweating, is responsible for the initial drop in temperature [25]. Despite the gradual increase in metabolic variables (VO2 & VCO2), shank and body temperature reached a peak in the next 15 minutes and then gradually decreased during the running stage. Previous research has demonstrated that sweating is a contributing factor that can explain these experimental results, as increased sweating during the running stage contributed to the decrease in shank and body temperature [26].
An interesting experimental result revealed that, although not statistically significant, the shank temperature in the OPEN upper structure shoe was lower throughout the entire stage. The CLOSED upper structure inhibited convective heat transfer between the in-shoe environment and the ambient air, leading to heat being transferred from the foot to the shank (the adjacent lower extremity) and resulting in an increase in shank temperature. As for body thermal variables, shoe upper air permeability did not influence body skin temperature, but metabolism and sweat loss differed between the two shoe conditions. Although there was no significant difference, metabolism and sweat loss were lower in the OPEN upper structure. However, we cannot yet conclude that the air permeability of the shoes affects running economy.
4.4limitation
There are some limitations associated with this study. While the study set the temperature and humidity in a laboratory environment based on previous research, it is indeed challenging to replicate the diverse scenarios encountered during actual running processes. Additionally, we believe that foot temperature and humidity may vary under different environmental conditions, which is highly relevant to footwear design and development.
5.Conclusion
The findings of this research hold significance for both theoretical understanding and practical applications. Theoretically, the temporal characteristics of body, shank, and shoe microclimates remained similar across the two shoe conditions. While a notable impact of shoe permeability on shoe microclimate was evident during the experimental protocol, no significant differences were observed in the temporal characteristics of the body and shank. On the practical side, this information can be valuable for shoe designers, developers, physicians, and athletes in comprehending how the design of shoe uppers influences heat dissipation and moisture management. The findings obtained from this study could potentially provide valuable guidance for improving the breathability of shoes.
Acknowledgments
The laboratory, experimental shoes, and testing equipment for this study were provided by the Li-Ning Sports Science Research Center.
Conflict of interest
None to report.
References
[1] | West AM, Schonfisch D, Picard A, et al. Shoe microclimate: An objective characterisation and subjective evaluation. Applied Ergonomics. (2019) ; 78: : 1-12. |
[2] | Weiner JS. The regional distribution of sweating. The Journal of Physiology. (1945) ; 104. |
[3] | Smith CJ, Havenith G. Body mapping of sweating patterns in male athletes in mild exercise-induced hyperthermia. European Journal of Applied Physiology. (2011) ; 111: (7): 1391-1404. |
[4] | Smith CJ, Machado-Moreira CA, Plant G, et al. Design data for footwear: sweating distribution on the human foot. International Journal of Clothing Science & Technology. (2013) ; 25: (1): 43-58. |
[5] | Havenith G, Heus R, Lotens WA. Resultant clothing insulation: A function of body movement, posture, wind, clothing fit and ensemble thickness. Ergonomics. (1990) ; 33: (1). |
[6] | Osada Y. Relationship between clothing ventilation and thermal insulation. Journal of Human & Living Environment. (2003) ; 63: (3): 262-268. |
[7] | Lu Y, Li J, Li X, et al. The effect of air gaps in moist protective clothing on protection from heat and flame. Journal of Fire Sciences. (2013) ; 31: (2): 99-111. |
[8] | Havenith G. Interaction of Clothing and Thermoregulation. Exogenous Dermatology. (2002) ; 1: (5): 221-230. |
[9] | Irzma E. The microclimate in protective fire fighter footwear: foot temperature and air temperature and relative humidity. Autex Research Journal. (2016) ; 16: (2): 75-79. |
[10] | Irzmańska E, Dutkiewicz JK, Irzmański R. New approach to assessing comfort of use of protective footwear with a textile liner and its impact on foot physiology. Textile Research Journal. (2014) ; 84: (7): 728-738. |
[11] | Bertaux E, Derler S, Rossi RM, et al. Textile, physiological, and sensorial parameters in sock comfort. Textile Research Journal. (2010) ; 80: (17): 1803-1810. |
[12] | Fogarty A, Bartlett R, Ventenat V, et al. Regional foot sweat rates during a 65 minute uphill walk with a backpack. Figshare. https//hdl.handle.net/2134/34976. (2019) . |
[13] | Smith CJ, Machado-moreira CA, Plant G, et al. Design data for footwear: sweating distribution on the human foot. International Journal of Clothing Science and Technology. (2013) ; 25: (1): 43-58. |
[14] | West A, Tarrier J, Hodder SG, et al. Sweat Distribution and Perceived Wetness across the Human Foot. Ergonomics. (2017) . |
[15] | Arezes P, Neves MM, Teixeira S, et al. Testing thermal comfort of trekking boots: An objective and subjective evaluation. Applied Ergonomics. (2013) ; 44: (4): 557-565. |
[16] | Shimazaki Y, Murata M. Effect of gait on formation of thermal environment inside footwear. Applied Ergonomics. (2015) ; 49: : 55-62. |
[17] | Ramanathan NL. A New Weighting System for Mean Surface Temperature of The Human Body. Journal of Applied Physiology. (1964) ; 19: (3): 531. |
[18] | Fabbri K. Assessment of the Influence of the Thermal Environment Using Subjective Judgement Scales. Springer International Publishing. (2024) ; 137-156. |
[19] | Yu AN, Li PL, Yick KL, et al. Investigation of Microclimate in Sports Shoes with the Integration of Human Subjective Sensations. Key Engineering Materials. (2018) ; 765: : 140-146. |
[20] | Irzmańska E. The microclimate in protective fire fighter footwear: foot temperature and air temperature and relative humidity. Autex Research Journal. (2016) ; 16: (2): 75-79. |
[21] | Havenith G, Heus R, Lotens W. Resultant clothing insulation: a function of body movement, posture, wind, clothing fit and ensemble thickness. Ergonomics. (1990) ; 33: (1): 67-84. |
[22] | Satsumoto Y, Piao S. Effects of Shoe Fit and Moisture Permeability of a Leather Shoe on Shoe Microclimate and Air Exchange. Journal of Ergonomics. (2016) ; 6: (4). |
[23] | Ueda H, Inoue Y, Matsudaira M, et al. Regional microclimate humidity of clothing during light work as a result of the interaction between local sweat production and ventilation. International Journal of Clothing Science and Technology. (2006) ; 18: (4): 225-234. |
[24] | Gagge AP, Stolwijk J, Hardy J. Comfort and thermal sensations and associated physiological responses at various ambient temperatures. Environmental Research. (1967) ; 1: (1): 1-20. |
[25] | Saltin B, Gagge A, Stolwijk J. Body temperatures and sweating during thermal transients caused by exercise. Journal of Applied Physiology. (1970) ; 28: (3): 318-327. |
[26] | Filingeri D, Redortier B, Hodder S, et al. The role of decreasing contact temperatures and skin cooling in the perception of skin wetness. Neuroscience Letters. (2013) ; 551: : 65-69. |


