
Computer-aided detection of prostate cancer in early stages using multi-parameter MRI: A promising approach for early diagnosis
Abstract
BACKGROUND:
Transrectal ultrasound-guided prostate biopsy is the gold standard diagnostic test for prostate cancer, but it is an invasive examination of non-targeted puncture and has a high false-negative rate.
OBJECTIVE:
In this study, we aimed to develop a computer-assisted prostate cancer diagnosis method based on multiparametric MRI (mpMRI) images.
METHODS:
We retrospectively collected 106 patients who underwent radical prostatectomy after diagnosis with prostate biopsy. mpMRI images, including T2 weighted imaging (T2WI), diffusion weighted imaging (DWI), and dynamic-contrast enhanced (DCE), and were accordingly analyzed. We extracted the region of interest (ROI) about the tumor and benign area on the three sequential MRI axial images at the same level. The ROI data of 433 mpMRI images were obtained, of which 202 were benign and 231 were malignant. Of those, 50 benign and 50 malignant images were used for training, and the 333 images were used for verification. Five main feature groups, including histogram, GLCM, GLGCM, wavelet-based multi-fractional Brownian motion features and Minkowski function features, were extracted from the mpMRI images. The selected characteristic parameters were analyzed by MATLAB software, and three analysis methods with higher accuracy were selected.
RESULTS:
Through prostate cancer identification based on mpMRI images, we found that the system uses 58 texture features and 3 classification algorithms, including Support Vector Machine (SVM), K-nearest Neighbor (KNN), and Ensemble Learning (EL), performed well. In the T2WI-based classification results, the SVM achieved the optimal accuracy and AUC values of 64.3% and 0.67. In the DCE-based classification results, the SVM achieved the optimal accuracy and AUC values of 72.2% and 0.77. In the DWI-based classification results, the ensemble learning achieved optimal accuracy as well as AUC values of 75.1% and 0.82. In the classification results based on all data combinations, the SVM achieved the optimal accuracy and AUC values of 66.4% and 0.73.
CONCLUSION:
The proposed computer-aided diagnosis system provides a good assessment of the diagnosis of the prostate cancer, which may reduce the burden of radiologists and improve the early diagnosis of prostate cancer.
1.Introduction
Prostate cancer (PCa) is the second most common cancer among men worldwide. Although Asia is known as the region with the lowest PCa incidence, it has been rising rapidly over the last 20 years [1]. Prostate biopsy is the gold standard diagnostic test for prostate cancer, but it is a non-target invasive examination, which may lead to discomfort, missed diagnosis, infection and other prostate issues. In recent years, multi-parameter MRI (mpMRI) has played an important role in the tumor staging of prostate cancer, showing whether there is extraprostatic extension, lymph node and bone metastasis [2, 3]. According to the European Society of Urogenital Radiology prostate MRI guidelines, mpMRI is recommended to evaluate PCa [4].
In recent years, artificial intelligence has been widely used in the early diagnosis of tumors [5, 6]. A precise diagnosis can optimize patient health care and avoid unnecessary surgical treatment [7]. Automated computer-assisted diagnosis helps to improve the diagnostic accuracy of PCa and reduce the differences between them [8, 9]. And, the use of CAD could also improve the experienced reader interpretation of prostate mp-MRI studies [10].
With the development of computer technology and imaging, the application of image analysis technology has become more extensive in the early diagnosis of tumors. More evidence suggests that AI may be a potential alternative to traditional hand-crafted methods that address the problems of pattern recognition and imaging classification [11, 12, 13, 14]. However, studies combining CAD and mp-MRI to address the issue of lesion detection and classification in the prostate have been limited [15, 16]. Hence, we developed a computer-aided diagnostic system by mapping of pathological sections and MRI images to explore the application of AI mp-MRI in the early diagnosis of prostate cancer with more clearer and accurate methods.
2.Patients and methods
We retrospectively reviewed the cases of patients who underwent radical prostatectomy at our institution from May 2017 to March 2021. The patients who received mpMRI before transperineal prostate biopsy in 3 months were included in this study. The exclusion criteria were: 1) the interval between surgery and mpMRI was more than three months; 2) patients were diagnosed with prostatic transitional cell carcinoma or sarcoma on pathology; 3) patients received neoadjuvant hormonal therapy or radiotherapy before surgery.
A total of 106 patients were included in the study. The mean age was 62.3
All mpMRI were performed by using a 3T magnet technique (Philips MR system Achieva 3.0T) with an eight-channel coil. T2W images were acquired with a fast spin-echo sequence, TR/TE
As shown in Fig. 1, the prostate tissue with the largest axial cross-sectional area corresponding to the three sequence MRI images was made into axial pathological sections. The boundary of tumor area, benign area and transitional zone on each layer were marked respectively by two senior pathologists. We then segmented, scaled and translated the histology and MR images, and then we used transparent mapping technology to cover the pathological sections on three sequence MRI axial images in the same level, and label the corresponding area of benign tissue and tumor tissue on the three sequence of MRI images. Meanwhile, before feature extraction, we adopt the median filtering method and the average filtering method in the airspace pixel feature denoising algorithm, and the selected filter window size is 3*3. The benign and malignant MRI images of each section in three sequences were extracted and defined as region of interest (ROI).
Figure 1.
The workflow for extracting benign and malignant regions of interest.
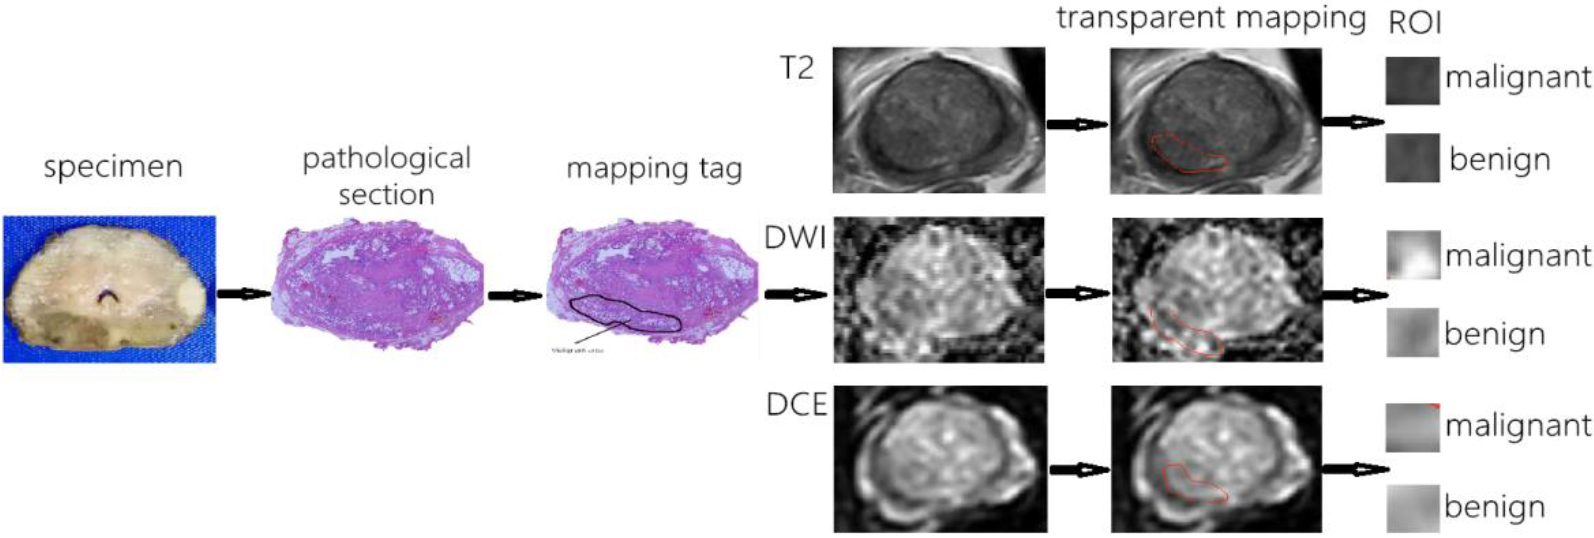
Figure 2.
The flowchart of the computer aided diagnosis system for detecting prostate cancer.
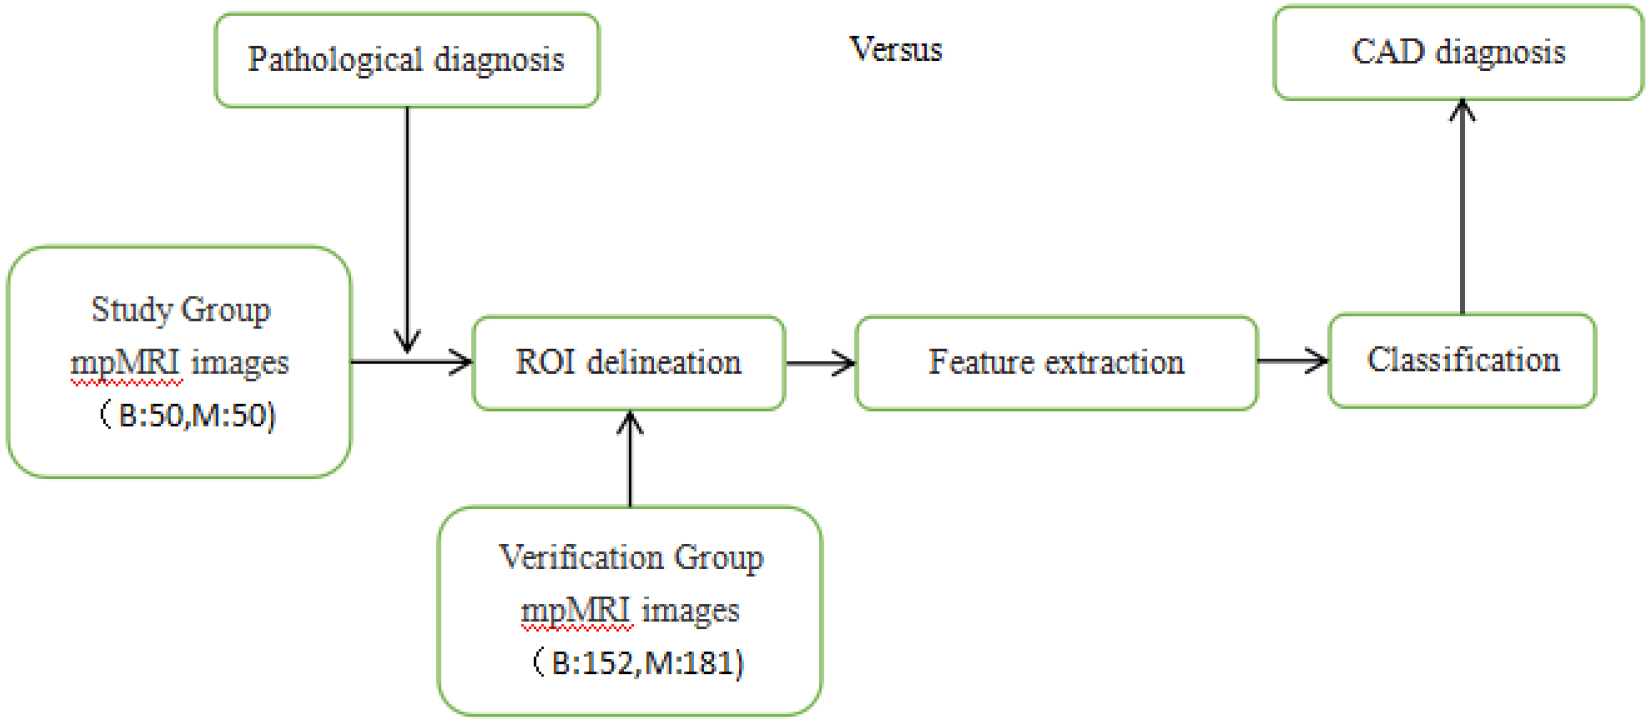
After the ROI data of prostate MRI images were collected and analyzed, we applied an image-processing algorithm to evaluate prostate cancer. As shown in Fig. 2, the algorithm mainly includes three steps: feature extraction of two-dimensional images, model training and evaluation. The ROI data of 433 prostate mpMRI images were obtained, of which 202 were benign and 231 were malignant. Of these, 50 benign and 50 malignant images were used for training, and the remaining 333 images were used for verification.
Texture feature extraction is divided into structure-based method and statistics-based method. The statistical analysis is based on the gray feature parameters of pixel and its neighborhood is extracted by a certain image processing algorithm. The Gray Level Co-occurrence Matrix (GLCM) and gray-level gradient co-occurrence matrix (GLGCM) are widely used second-order statistical texture features in medical image processing. GLCM learns the gray relationship between two pixels separated by a certain distance in the four directions of 0∘, 45∘, 90∘ and 135∘ in the image gray space. Gray histogram is a one-dimensional function of gray level and belongs to first-order statistical method. The texture of images in the spatial domain is suitable for fractal Brown Motion (FBM), which is used to process the texture channel in the frequency domain according to the time-frequency characteristics of Symlets (sym2) wavelet Transform (WT). The extraction of structural texture features with four different fractal dimensions can better reflect the features and distribution patterns of primitive elements, thus improving the classification effect.
Consequently, five main feature groups were extracted, including histogram, GLCM, GLGCM, wavelet-based multi-fractional Brownian motion features and Minkowski function features, including the original image gray scale histogram features (6), the image after filtering gray scale histogram features (12) (3*3 and 7*7 filters respectively), the Gray Level Co-occurrence Matrix (13), the gray-level gradient co-occurrence matrix (15), the wavelet-based multi-fractional Brownian motion features (4), and the Minkowski function features (8). Totally, fifty-eight features were extracted for classification.
RelieF’s algorithm was used to take different thresholds for DCE, DWI, T2WI and all weighting, and the calculated feature parameters whose weights were higher than this threshold were selected. The selected features of T2WI, DCE, DWI and all data synthesis were imported into Matlab and analyzed by various methods to obtain the accuracy of each one. Three analytical methods with higher accuracy were screened out.
3.Results
According to the weights of each feature, an appropriate threshold was selected to exclude features with weights lower than that threshold. The selected threshold based on T2WI features was
Table 1
Evaluation of the three analysis methods
| Method | ACC | AUC | |
|---|---|---|---|
| T2WI | KNN | 57.4% | 0.64 |
| SVM | 64.3% | 0.67 | |
| EL | 52.8% | 0.50 | |
| DCE | KNN | 62.6% | 0.62 |
| SVM | 72.2% | 0.77 | |
| EL | 61.9% | 0.67 | |
| DWI | KNN | 65.7% | 0.65 |
| SVM | 67.1% | 0.70 | |
| EL | 75.1% | 0.82 | |
| ALL | KNN | 63.3% | 0.63 |
| SVM | 66.4% | 0.73 | |
| EL | 65.5% | 0.72 |
The selected features of TWI2, DCE, DWI, and all data synthesis were imported into Matlab. Three analytical methods with highest accuracy were screened out (Table 1). The three analysis methods were Support Vector Machine (SVM), K-nearest Neighbor (KNN), and Ensemble Learning (EL).
Figure 3.
The ROC curve results based on T2WI classification. 1. ROC curve of predicted value according to KNN analysis; 2. ROC curve of predicted value according to EL analysis; 3. ROC curve of predicted value according to SVM analysis.
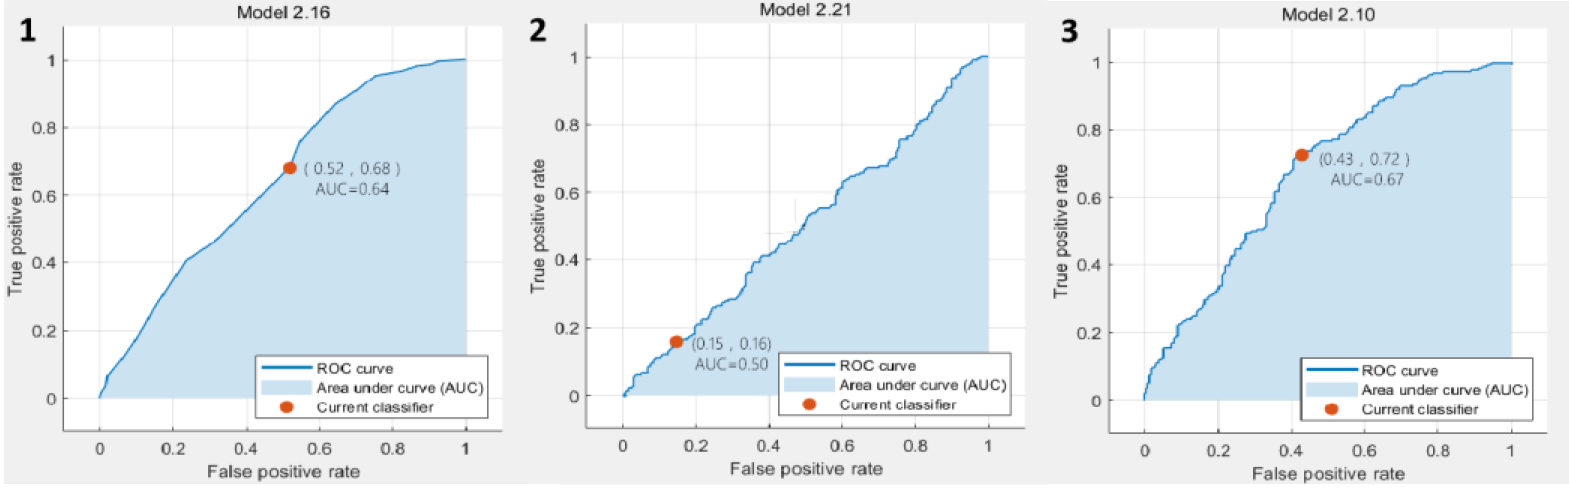
Figure 4.
The ROC curve results based on DCE classification. 1. ROC curve of predicted value according to KNN analysis; 2. ROC curve of predicted value according to EL analysis; 3. ROC curve of predicted value according to SVM analysis.
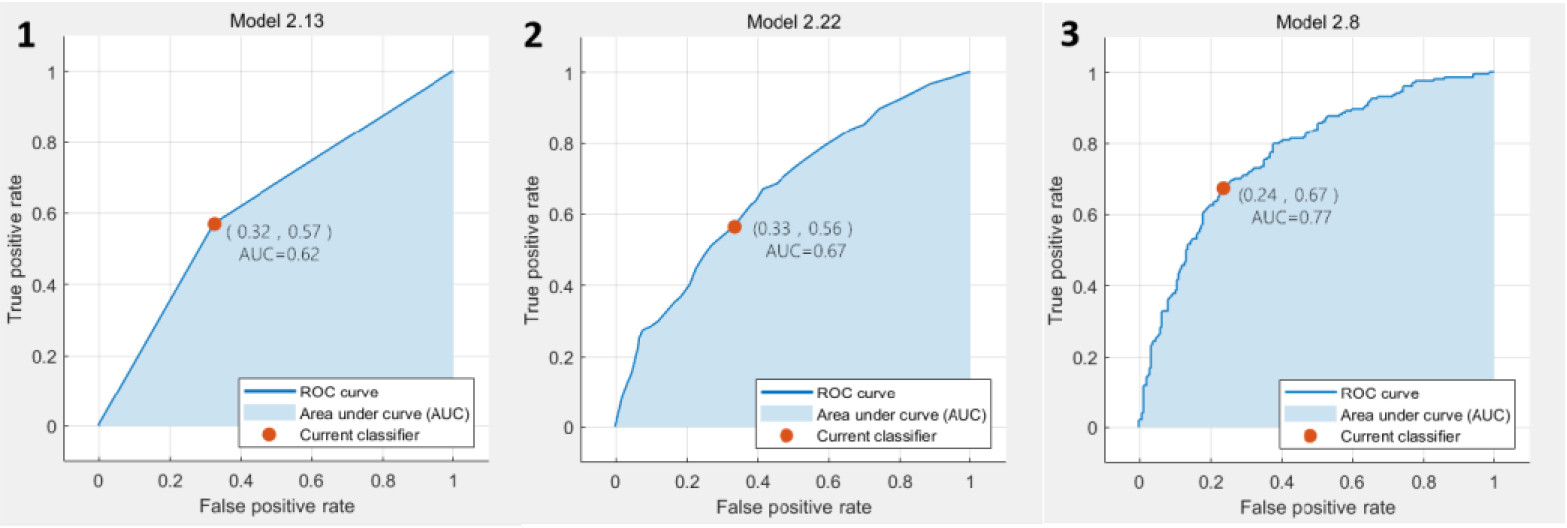
Figure 5.
The ROC curve results based on DWI classification. 1. ROC curve of predicted value according to KNN analysis; 2. ROC curve of predicted value according to SVM analysis; 3. ROC curve of predicted value according to EL analysis.
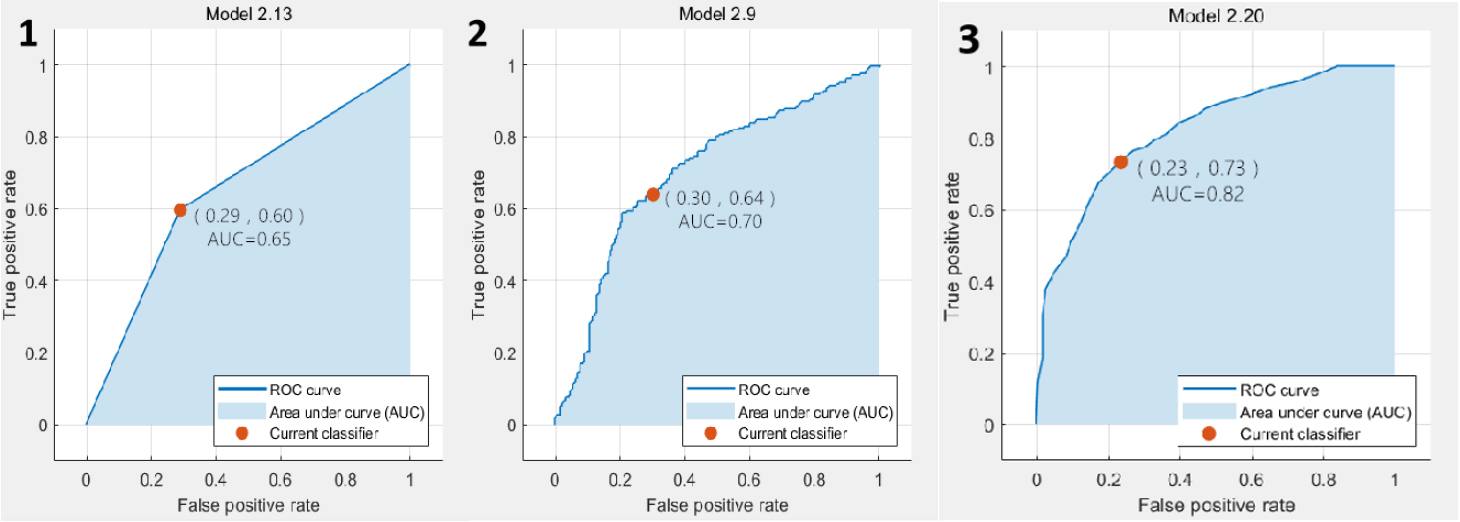
Figure 6.
The ROC curve results based on classification of all data combinations. 1. ROC curve of predicted value according to KNN analysis; 2. ROC curve of predicted value according to EL analysis; 3. ROC curve of predicted value according to SVM analysis.
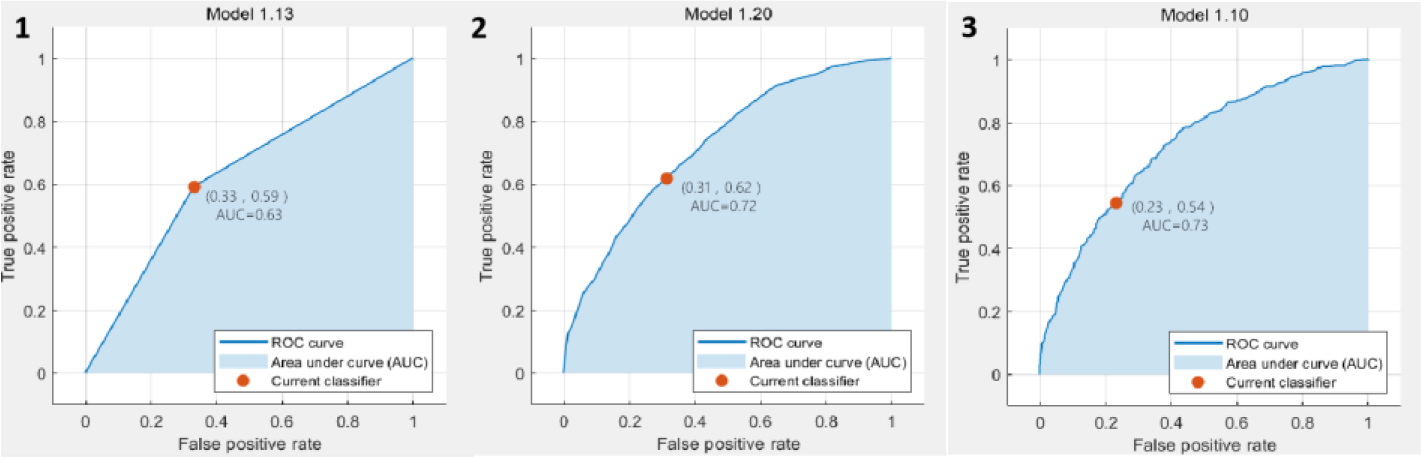
In the classification results based on T2WI, the SVM achieved the best accuracy and AUC value, which are 64.3% and 0.67, respectively. The ROC plots were shown in Fig. 3. In the classification results based on DCE, the SVM also achieved the best accuracy and AUC value, which were 72.2% and 0.77, respectively. The ROC plots were shown in Fig. 4. In the classification results based on DWI, the EL achieved the best accuracy and AUC value, which were 75.1% and 0.82, respectively. The ROC plots were shown in Fig. 5. In the classification results based on all data combinations, the SVM achieved the best accuracy and AUC value, which were 66.4% and 0.73, respectively. The ROC plots were shown in Fig. 6.
4.Discussion
Prostate cancer is one of the most critical diseases affecting health in the elderly men. Serum prostate specific antigen (PSA), digital rectal examination and transrectal ultrasound-guided prostate biopsy are the main methods for the early diagnosis of prostate cancer. Due to its high spatial resolution and superior soft tissue contrast, MRI can finely describe prostate anatomy, and has been clinically used as the most important non-invasive method for the early diagnosis of prostate cancer [2]. In particular, mpMRI not only provides the anatomical characteristics of the prostate, but also describes its histological characteristics, such as the volume of the prostate, cell and vascular characteristics. Several CAD systems for radiological evaluation of retinal disease [17], thyroid disease [18], and prostate [19] have been developed with encouraging results.
In this study, we extracted 58 image characteristics of MRI images, and RelieF’s algorithm was used to take different thresholds for DCE, DWI, T2WI, and all weighted sequences, respectively, to screen out the calculated feature parameters with weights greater than this threshold. Then we analyze the selected characteristic parameters in a variety of ways, so as to screen out methods with higher accuracy and applicability. The results showed that our CAD model combination of T2WI, ADC and DWI data achieved high diagnostic accuracy in terms of sensitivity.
Prostate biopsy is the gold standard but invasive for the diagnosis of prostate cancer. Studies have shown that infectious complications after transrectal ultrasound-guided prostate biopsy appear to be increasing [20], and the false negative rate was high. Lim S et al. [21] present a robot-assisted approach for transrectal ultrasound guided prostate biopsy. Our CAD system is very time-saving in clinical practice and is efficient, avoiding unnecessary puncture.
Studies have shown that T2WI combined with DWI, DCE has the highest diagnostic efficiency and is the best combination sequence for the diagnosis of prostate cancer [22]. Therefore, the development of new imaging intelligent analysis can accurately diagnose prostate cancer, classify its different pathological processes, and ultimately achieve the purpose of personalized precise treatment for specific patients.
Several studies [23, 24] have proposed methods for image registration by MRI and histology. Before feature extraction, we used the transparent mapping technique to complete the registration between whole-scaffold histology and MRI images.
In the past decade, several CAD have been developed for accurate and automated PCa detection and diagnosis [25, 26, 27, 28]. However, the diagnostic accuracy of different CAD systems is still controversial. These studies based on mpMRI have shown that combining different features from different imaging methods can increase the performance of computer-aided diagnosis. Compared to other CAD using only 1–2 MRI sequences, our study used more sequences for model construction. At the same time, we clearly marked the histopathological sections after radical prostate cancer by pathologists, and then mapped them on mpMRI. Unlike many CAD, which used puncture pathological sections for training, it has more clear directivity and more reliable accuracy.
Different studies have used different technical methods, such as field strength and MR sequence. Diagnosis of prostate tumors by mpMRI can be affected by multiple conditions, such as patient variability and the complexity of the lesion [29]. In our previous study, we extracted a total of 31 image features using matlab software, and the accuracy as well as the AUC were higher according to the analysis results of the Logistic regression model. In this study, we used more texture features and classification algorithms, but whether the limited dataset will cause the redundancy of these features, lead to the overfitting of the model, and reduce the accuracy rate and the area under the curve. In future studies, we will collect more MRI images and more meaningful texture features to further improve the performance of the system.
In the meanwhile, artificial intelligence-based computer-aided diagnosis system combined with prostate mpMRI can also have many other applications. For example, a CAD system combined with a tumor probability map can help radiologists accurately locate the peripheral prostate cancer area for targeted biopsy, local treatment and active follow-up [30]. In the radiotherapy of prostate cancer, CAD systems based on prostate MRI have been increasingly used to delineate the prostate tumor area to adjust the radiation dose. In recent years, increasing attention has been directed to texture analysis of tumor grade and prediction [31]. Xiong et al. [32] found that texture analysis parameters derived from ADC may be a valuable tool in predicting high-grade prostate cancer (HGPCa).
There are some limitations to our current study. First, the ROI on the image must be depicted manually by the physician. Secondly, the diagnosis only contains the MRI images. Additional clinical information can be added. Finally, the number of patients for model training is small, and clinical cases need to accumulate more.
5.Conclusion
We developed a CAD system to assess the risk of prostate malignancy in mpMRI images. It reduces the burden on radiologists and improves the accuracy of prostate cancer diagnosis. In future studies, we will collect more case data and further improve the performance of our system through a deep convolutional neural network method.
Acknowledgments
This study was supported by the Natural Science Foundation of Zhejiang Province (LGF19H160005) and Huzhou Science and Technology Public Welfare Technology Application Research Project (2018GYB12).
Conflict of interest
None to report.
References
[1] | Zhang K, Bangma CH, Roobol MJ. Prostate cancer screening in Europe and Asia. Asian J Urol. (2017) ; 4: (2): 86-95. |
[2] | Zhao K, Wang C, Hu J, Yang X, Wang H, Li F, et al. Prostate cancer identification: Quantitative analysis of T2-weighted MR images based on a back propagation artificial neural network model. Sci China Life Sci. (2015) ; 58: (7): 666-73. |
[3] | Hubner N, Shariat S, Remzi M. Prostate biopsy: Guidelines and evidence. Curr Opin Urol. (2018) ; 28: (4): 354-9. |
[4] | Turkbey B, Rosenkrantz AB, Haider MA, Padhani AR, Villeirs G, Macura KJ, et al. Prostate imaging reporting and data system version 2.1: 2019 update of prostate imaging reporting and data system version 2. Eur Urol. (2019) ; 76: (3): 340-51. |
[5] | Naguib RN, Robinson MC, Neal DE, Hamdy FC. Neural network analysis of combined conventional and experimental prognostic markers in prostate cancer: A pilot study. Br J Cancer. (1998) ; 78: (2): 246-50. |
[6] | Liu C, Chen S, Yang Y, Shao DD, Peng WX, Wang Y, et al. The value of the computer-aided diagnosis system for thyroid lesions based on computed tomography images. Quant Imaging Med Surg. (2019) ; 9: (4): 642-53. |
[7] | Tsantis S, Dimitropoulos N, Cavouras D, Nikiforidis G. Morphological and wavelet features towards sonographic thyroid nodules evaluation. Comput Med Imaging Graph. (2009) ; 33: (2): 91-9. |
[8] | Hambrock T, Vos PC, Hulsbergen-van de Kaa CA, Barentsz JO, Huisman HJ. Prostate cancer: Computer-aided diagnosis with multiparametric 3-T MR imaging-effect on observer performance. Radiology. (2013) ; 266: : 521-30. |
[9] | Vos PC, Barentsz JO, Karssemeijer N, Huisman HJ. Automatic computer-aided detection of prostate cancer based on multiparametric magnetic resonance image analysis. Phys Med Biol. (2012) ; 57: : 1527-42. |
[10] | Niaf E, Lartizien C, Bratan F, Roche L, Rabilloud M, Mege-Lechevallier F, Rouviere O. Prostate focal peripheral zone lesions: Characterization at multiparametric MR imaging-influence of a computer-aided diagnosis system. Radiology. (2014) ; 271: : 761-9. |
[11] | Shen D, Wu G, Suk HI. Deep learning in medical image analysis. Annu Rev Biomed Eng. (2017) ; 19: : 221-48. |
[12] | Schmidhuber J. Deep learning in neural networks: an overview. Neural Netw. (2015) ; 61: : 85-117. |
[13] | Aerts HJ, Velazquez ER, Leijenaar RT, Parmar C, Grossmann P, Carvalho JB, et al. Decoding tumour phenotype by noninvasive imaging using a quantitative radiomics approach. Nat Commun. (2014) ; 5: : 4006. |
[14] | Alipanahi B, Delong A, Weirauch MT, Frey BJ. Predicting the sequence specificities of DNA- and RNA-binding proteins by deep learning. Nat Biotechnol. (2015) ; 33: (8): 831-8. |
[15] | Le MH, Chen J, Wang L, Wang ZW, Liu WY, Tim KT, et al. Automated diagnosis of prostate cancer in multi-parametric MRI based on multimodal convolutional neural networks. Phys Med Biol. (2017) ; 62: (16): 6497-514. |
[16] | Reda I, Khalil A, Elmogy M, Abou A, Shalaby A, Abou M, et al. Deep learning role in early diagnosis of prostate cancer. Technol Cancer Res Treat. (2018) ; 17: : 1533034618775530. |
[17] | Kermany DS, Goldbaum M, Cai W, Valentim CC, Liang HY, Baxter SL, et al. Identifying medical diagnoses and treatable diseases by image-based deep learning. Cell. (2018) ; 172: (5): 122-31. |
[18] | Jin A, Li Y, Shen J, Zhang Y, Wang Y. Clinical value of a computer-aided diagnosis system in thyroid nodules: analysis of a reading map competition. Ultrasound Med Biol. (2019) ; 45: (10): 2666-71. |
[19] | Song Y, Zhang YD, Yan X, Liu H, Zhou MX, Hu BW, et al. Computer-aided diagnosis of prostate cancer using a deep convolutional neural network from multiparametric MRI. J Magn Reson Imaging. (2018) ; 48: (6): 1570-7. |
[20] | Lee SJ. Infection after transrectal ultrasound-guided prostate biopsy. Korean J Urol. (2015) ; 56: (5): 346-50. |
[21] | Lim S, Jun C, Chang D, Petrisor D, Han M, Stoianovici D. Robotic transrectal ultrasound guided prostate biopsy. IEEE Trans Biomed Eng. (2019) ; 66: (9): 2527-37. |
[22] | Perrot T, Scheffler M, Boto J, Delattre MA, Combescure C, Pusztaszeri M, et al. Diffusion in prostate cancer detection on a 3T scanner: How many b-values are needed. J Magn Reson Imaging. (2016) ; 44: (3): 601-9. |
[23] | Kalavagunta C, Zhou X, Schmechel SC, Metzger GJ. Registration of in vivo prostate MRI and pseudo-whole mount histology using Local Affine Transformations guided by Internal Structures (LATIS). Journal of Magnetic Resonance Imaging. (2014) ; 41: (4): 1104-14. |
[24] | Oliveira FP, Tavares JMR. Medical image registration: A review. Computer Methods in Biomechanics and Biomedical Engineering. (2014) ; 17: : 73-93. |
[25] | Mehta P, Antonelli M, Hashim U, Emberton M, Punwani S, Ourselin S. Computer-aided diagnosis of prostate cancer using multiparametric MRI and clinical features: A patient-level classification framework. Med Image Anal. (2021) ; 73: : 102153. |
[26] | Giannini V, Rosati S, Regge D. Specifificity improvement of a CAD system for multiparametric MR prostate cancer using texture features and artifificial neural networks. Health Technol. (2017) ; 7: : 71-80. |
[27] | Giannini V, Mazzetti S, Defeudis A, Stranieri G, Calandri M, Bollito E, et al. A fully automatic artificial intelligence system able to detect and characterize prostate cancer using multiparametric MRI: Multicenter and multi-scanner validation. Front Oncol. (2021) ; 1: (11): 718155. |
[28] | Roethke MC, Kuru TH, Mueller-Wolf MB, Agterhuis E, Edler C, Hohenfellner M, et al. Evaluation of an automated analysis tool for prostate cancer prediction using multiparametric magnetic resonance imaging. PLoS One. (2016) ; 11: : e0159803. |
[29] | Hoeks CM, Barentsz JO, Hambrock T, Yakar D, Somford DM, Heijmink S, et al. Prostate cancer: Multiparametric MR imaging for detection, localization, and staging. Radiology. (2011) ; 261: (1): 46-66. |
[30] | Shah V, Turkbey B, Mani H, Pang YX, Pohida T, Merino MJ, et al. Decision support system for localizing prostate cancer based on multiparametric magnetic resonance imaging. Med Phys. (2012) ; 39: (7): 4093-103. |
[31] | Gao WJ, Zhang PB, Wang H, Tuo PF, Li ZQ. Magnetic resonance imaging image feature analysis algorithm under convolutional neural network in the diagnosis and risk stratification of prostate cancer. J Healthc Eng. (2021) ; 2021: : 1034661. |
[32] | Xiong H, He XJ, Guo DJ. Value of MRI texture analysis for predicting high-grade prostate cancer. Clinical Imaging. (2021) ; 72: : 168-74. |


