
Using NIPAM gel dosimeter and concentric swing machine to simulate the dose distribu- tion during breathing: A feasibility study
Abstract
BACKGROUND:
Radiotherapy plays an important role in cancer treatment today. Successful radiotherapy includes precise positioning and accurate dosimetry.
OBJECTIVE:
To use NIPAM gel dosimeter and concentric swing machine to simulate and evaluate the feasibility of lung or upper abdominal tumor dose distribution during breathing.
METHODS:
We used a concentric swing machine to simulate actual radiotherapy for lung or upper abdomen tumors. A 4
RESULTS:
The concentric dynamic dose curve for a simulated respiratory rate of 3 seconds/breath and 4
CONCLUSIONS:
NIPAM gel dosimeter and concentric swing machine use is feasible to simulate dose distribution during breathing and results conforming to clinical evaluation standards.
1.Introduction
Radiotherapy plays an important role in cancer treatment today. Successful radiotherapy includes precise positioning and accurate dosimetry. Currently, common dosimetry tools include free-air ionization chambers, films, and thermoluminescent dosimetry.
Gel dosimeter is a chemical dosimeter that is also a relative dosimeter and has the advantage of providing three-dimensional relative dose distribution [1]. The action mechanism of gel dosimeter is the generation of free radicals by ionization of water molecules by radiation. Monomers and free radicals continuously bind to form polymer chain molecules and gelatin matrices to form a three-dimensional structure. After the gel dosimeter is irradiated, a readout instrument can be used to obtain image data to analyze the dose. Commonly used readout instruments include magnetic resonance imaging (MRI) [2], optical computed tomography (OCT) [3], and computed tomography (CT) [4]. MRI has the advantages such as having high resolution and high contrast; however, disadvantages such as high cost and temperature increase under long periods of scanning may result in dose differences.
Previous dosimetry studies mostly used static treatment target regions. However, the physiological motion and displacement of organs must be considered in some radiotherapy cases, of which breathing is a physiological motion that tends to cause organ motion. Bussels et al. used MRI measurement and found that significant motion of organs in the thorax and abdomen in the cranial-caudal direction will occur due to breathing [5]. Korin et al. used MRI to measure the displacement of upper abdominal organs in 15 volunteers and found that the diaphragm had the greatest cranial-caudal displacement and the motion range for normal breathing and deep breathing was 13 mm and 39 mm, respectively [6]. In addition, studies also mentioned that a higher dose may be needed in radiotherapy for various malignant tumors (such as lung cancer) due to organ motion caused by breathing so as to increase therapeutic efficacy and increase local control rate [7, 8]. Therefore, accurate dose measurement in the target region is important when organ motion causes changes in the treatment target volume.
Dynamic phantoms have clinical value in simulating dosimetry during organ motion. In 2004, David et al. published a paper on quantitation of abdominal tumor motion caused by breathing using dynamic phantoms and its impact on dose distribution in intensity-modulated radiotherapy. The authors felt that interference caused by tumor motion must be decreased during treatment [9]. In 2009, Masset et al. employed dynamic phantoms and films to simulate the effects of normal breathing on planar doses. They found that there were differences in dose distribution in the longitudinal and axial directions under motion and found that simulation could be used to measure the consistency of real-time position management system [10]. In 2011, Boda-Heggemann et al. used dynamic phantoms and CBCT to simulate image-guided radiotherapy of lung tumors. The study results showed that simulation by using dynamic phantoms combined with breathing monitoring equipment and comparison with clinical images could increase the treatment accuracy for lung tumors [11].
The past research of NIPAM gel dosimeter has good reading results, and it is worth looking forward to the dose presentation in the three-dimensional space in the future [12]. However, most studies are static measurements, and a few dynamic measurements are studies on calibration tubes, which cannot present dynamic dose distribution. This is a feasibility study in which NIPAM monomer-based gel dosimeter was combined with simulated dynamic displacement of organs caused by a concentric swing machine used in the laboratory. A linear accelerator was used for irradiation, MRI was used as a measurement tool, and MATLAB was used for readout analysis to evaluate whether NIPAM gel dosimeter could be used to simulate dose distribution during breathing under dynamic irradiation.
2.Materials and methods
2.1Preparation of NIPAM polymer gel
The NIPAM gel dosimeter used in this study was provided by the laboratory of the department of medical imaging and radiological sciences of central Taiwan university of science and technology. Its formula included 87% deionized water, 5% gelatin, 5% NIPAM monomer, 3% bisacrylamide (BIS), and 5 mM Tetrakis Hydroxymethyl Phosphonium Chloride (THPC) was used as oxygen scavenger (Table 1). After preparation, the gel dosimeter was wrapped in an aluminum foil to prevent light from inducing polymerization and the gel dosimeter was stored in a temperature-controlled 4
Table 1
The specification of drugs used in preparing the gel
| Drug | Specification/purity | Chemical formula | Manufacturer |
|---|---|---|---|
| Gelatin | Type A from porcine skin, 300 bloom | C | Sigma-Aldrich |
| NIPAM | 97% pure | C | Sigma-Aldrich |
| THPC | 80% solution in water | C | TCI |
| BIS | For electrophoresis | C | Mreck |
2.2Simulation of organ motion by using the concentric swing machine
In this study, the concentric swing machine that is commonly used in the laboratory was used to simulate organ motion in the body. The swing machine can cause the slider to swing back and forth in a concentric manner. The minimum swinging speed was 20 rpm, which was 3 second/revolution after conversion, and this conformed to lowest respiratory conversion frequency of 12–20 breaths/minute in adults mentioned by Korin et al. in 1992 [6].
2.3Gel irradiation
Irradiation in this study was divided into two parts. The irradiation device was Varian Clinic 21 iX (Varian Medical Systems, USA). Before irradiation, the gel was used as a substrate without addition of other materials (such as cross-linking agent, monomer) to prepare calibration tubes and gel dosimeter. Following that, a CT simulator was used to acquire CT images and the Varian Eclipse
Figure 1.
Schematic diagram of positions of the gel dosimeter and concentric swing machine.
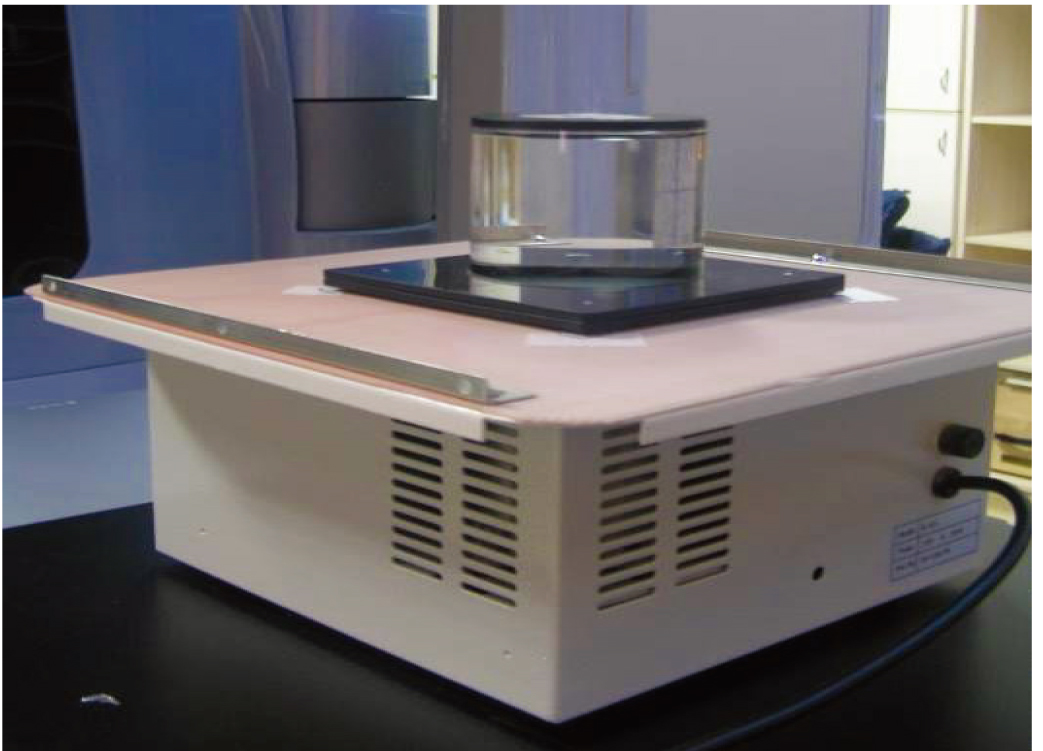
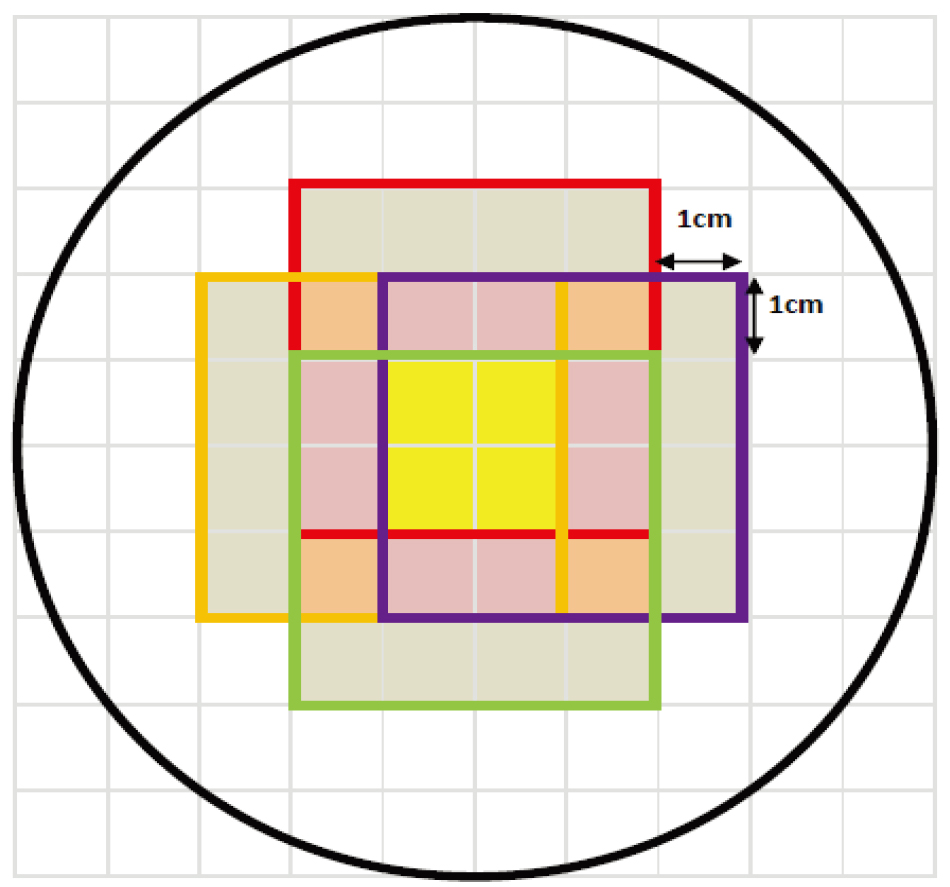
Figure 2.
Predicted simulation graph of the concentric swing machine. From the predicted simulation result in the graph, it was found that dose was most concentrated in the yellow region due to the way the concentric swing machine was positioned, a cross-shaped dose region was formed, i.e., yellow plus purple region.
2.4MRI readout and image reconstruction
After irradiation, the gel dosimeter was first placed in the MRI room for 24 hours so that the dosimeter and examination room ambient temperature reached an equilibrium. The temperature of the examination room was controlled at 22
Table 2
MRI scan parameters in this study
| Parameter | Set value |
|---|---|
| Repetition time (TR) | 3,000 ms |
| Echo time (TE) | 22, 44, 66, 88, 110, 132, 154, 176, 198, 220, 242, 264, 286, 308, 330, 352 ms |
| FOV | 240 mm |
| Slice thickness | 5 mm |
| Slice interval | 0.5 mm |
| Resolution | 512 |
2.5Gamma evaluation
After image reconstruction, the results measured by NIPAM gel dosimeters were compared with the TPS calculated data. The quantitative gamma evaluation proposed by Low et al. [13, 14] was used for performance analysis. The gamma evaluation criteria were distance-to-agreement (DTA
3.Results
3.1Gamma passing rates
The gamma passing rates with gamma evaluation criteria of DTA
Figure 3.
Comparison of readout result and TPS. The top to bottom figures show the comparison for (a) 2
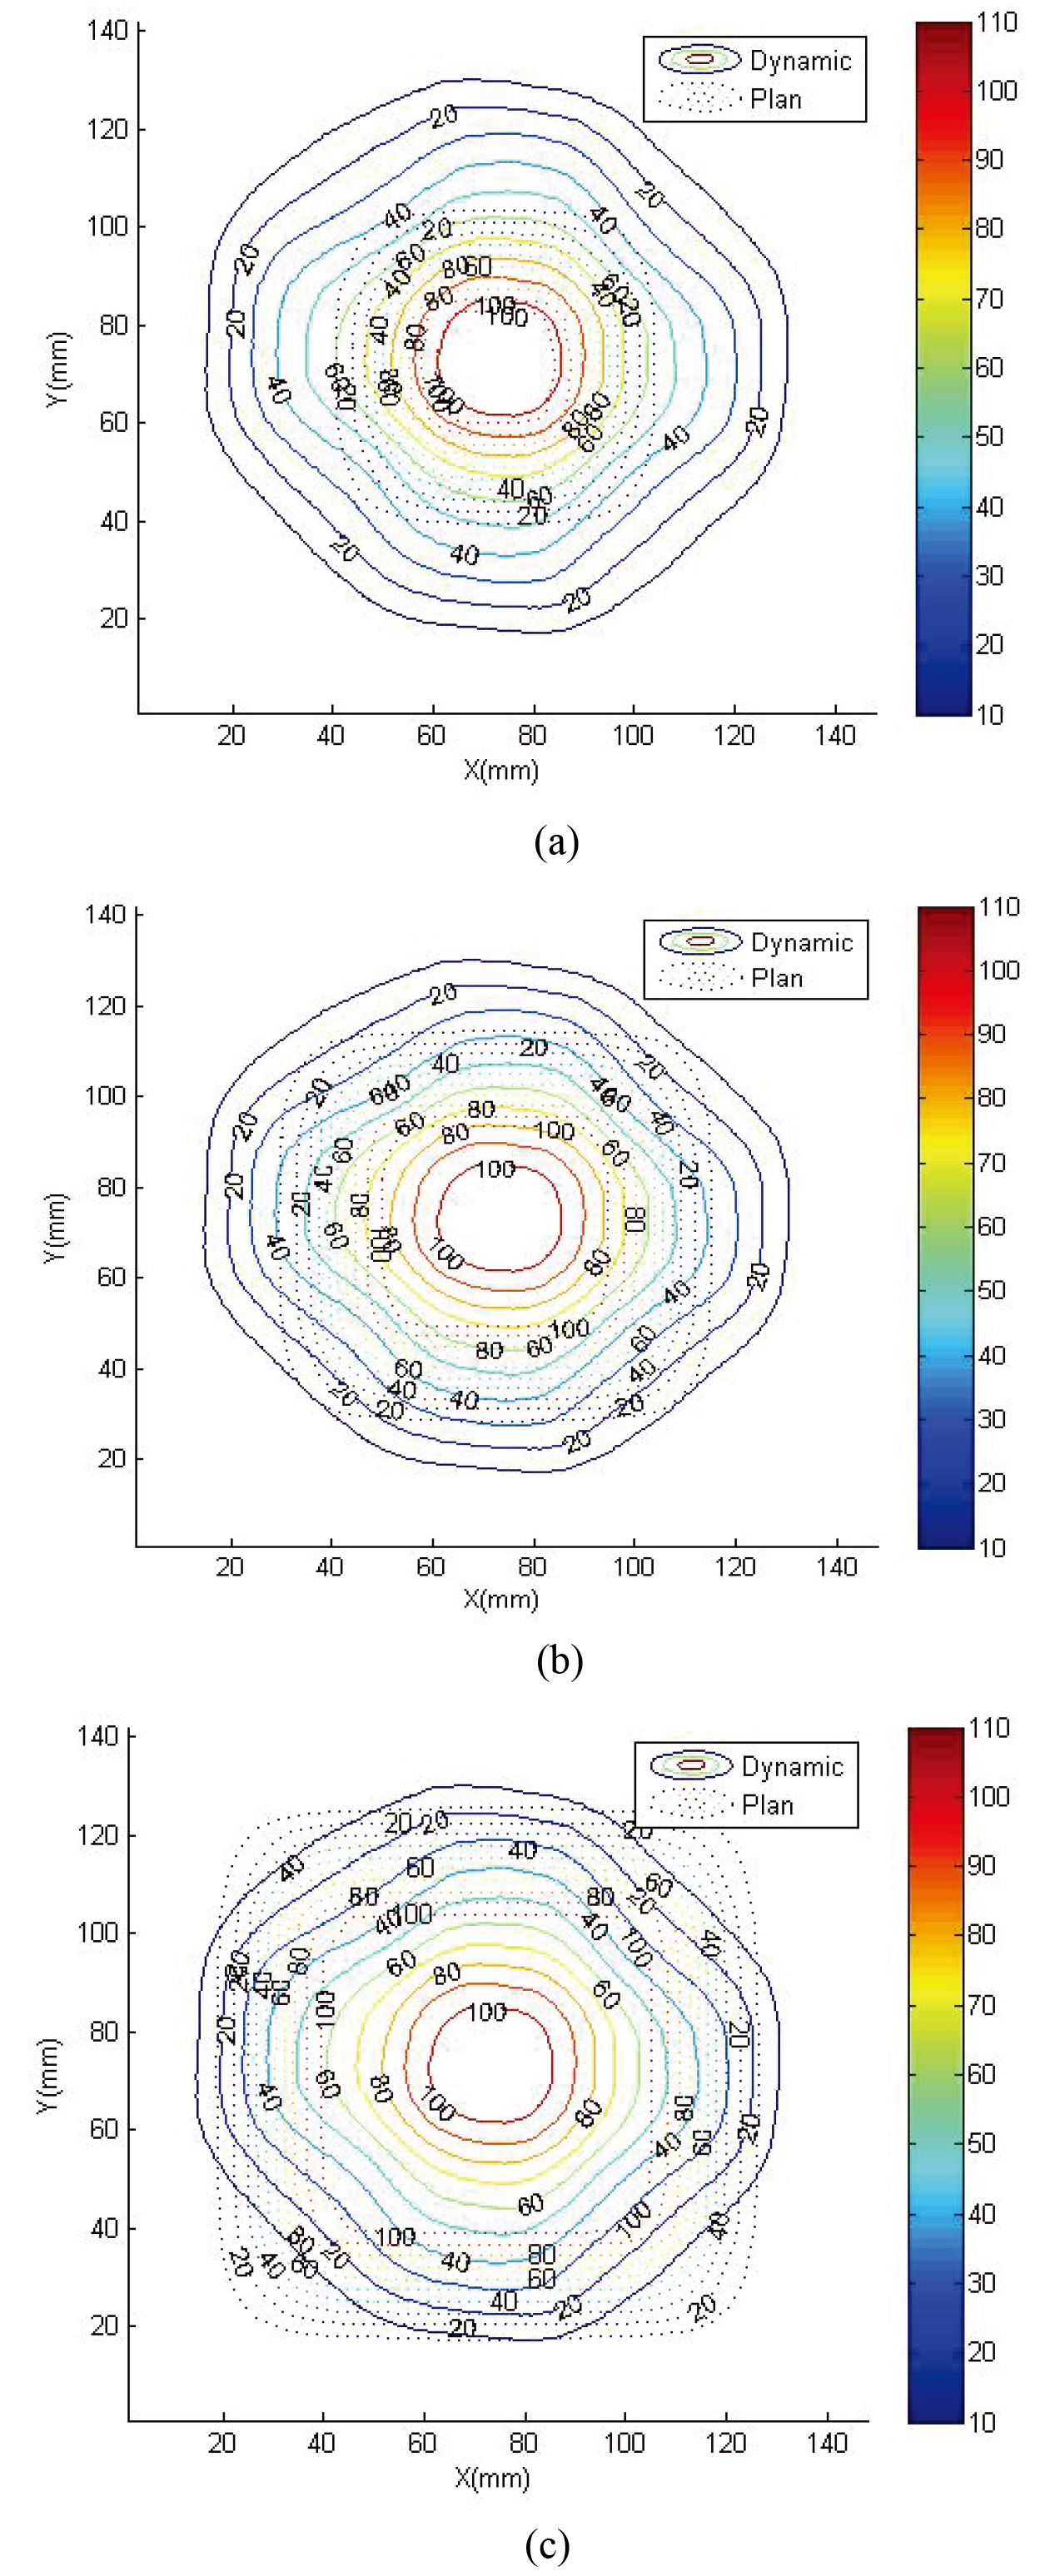
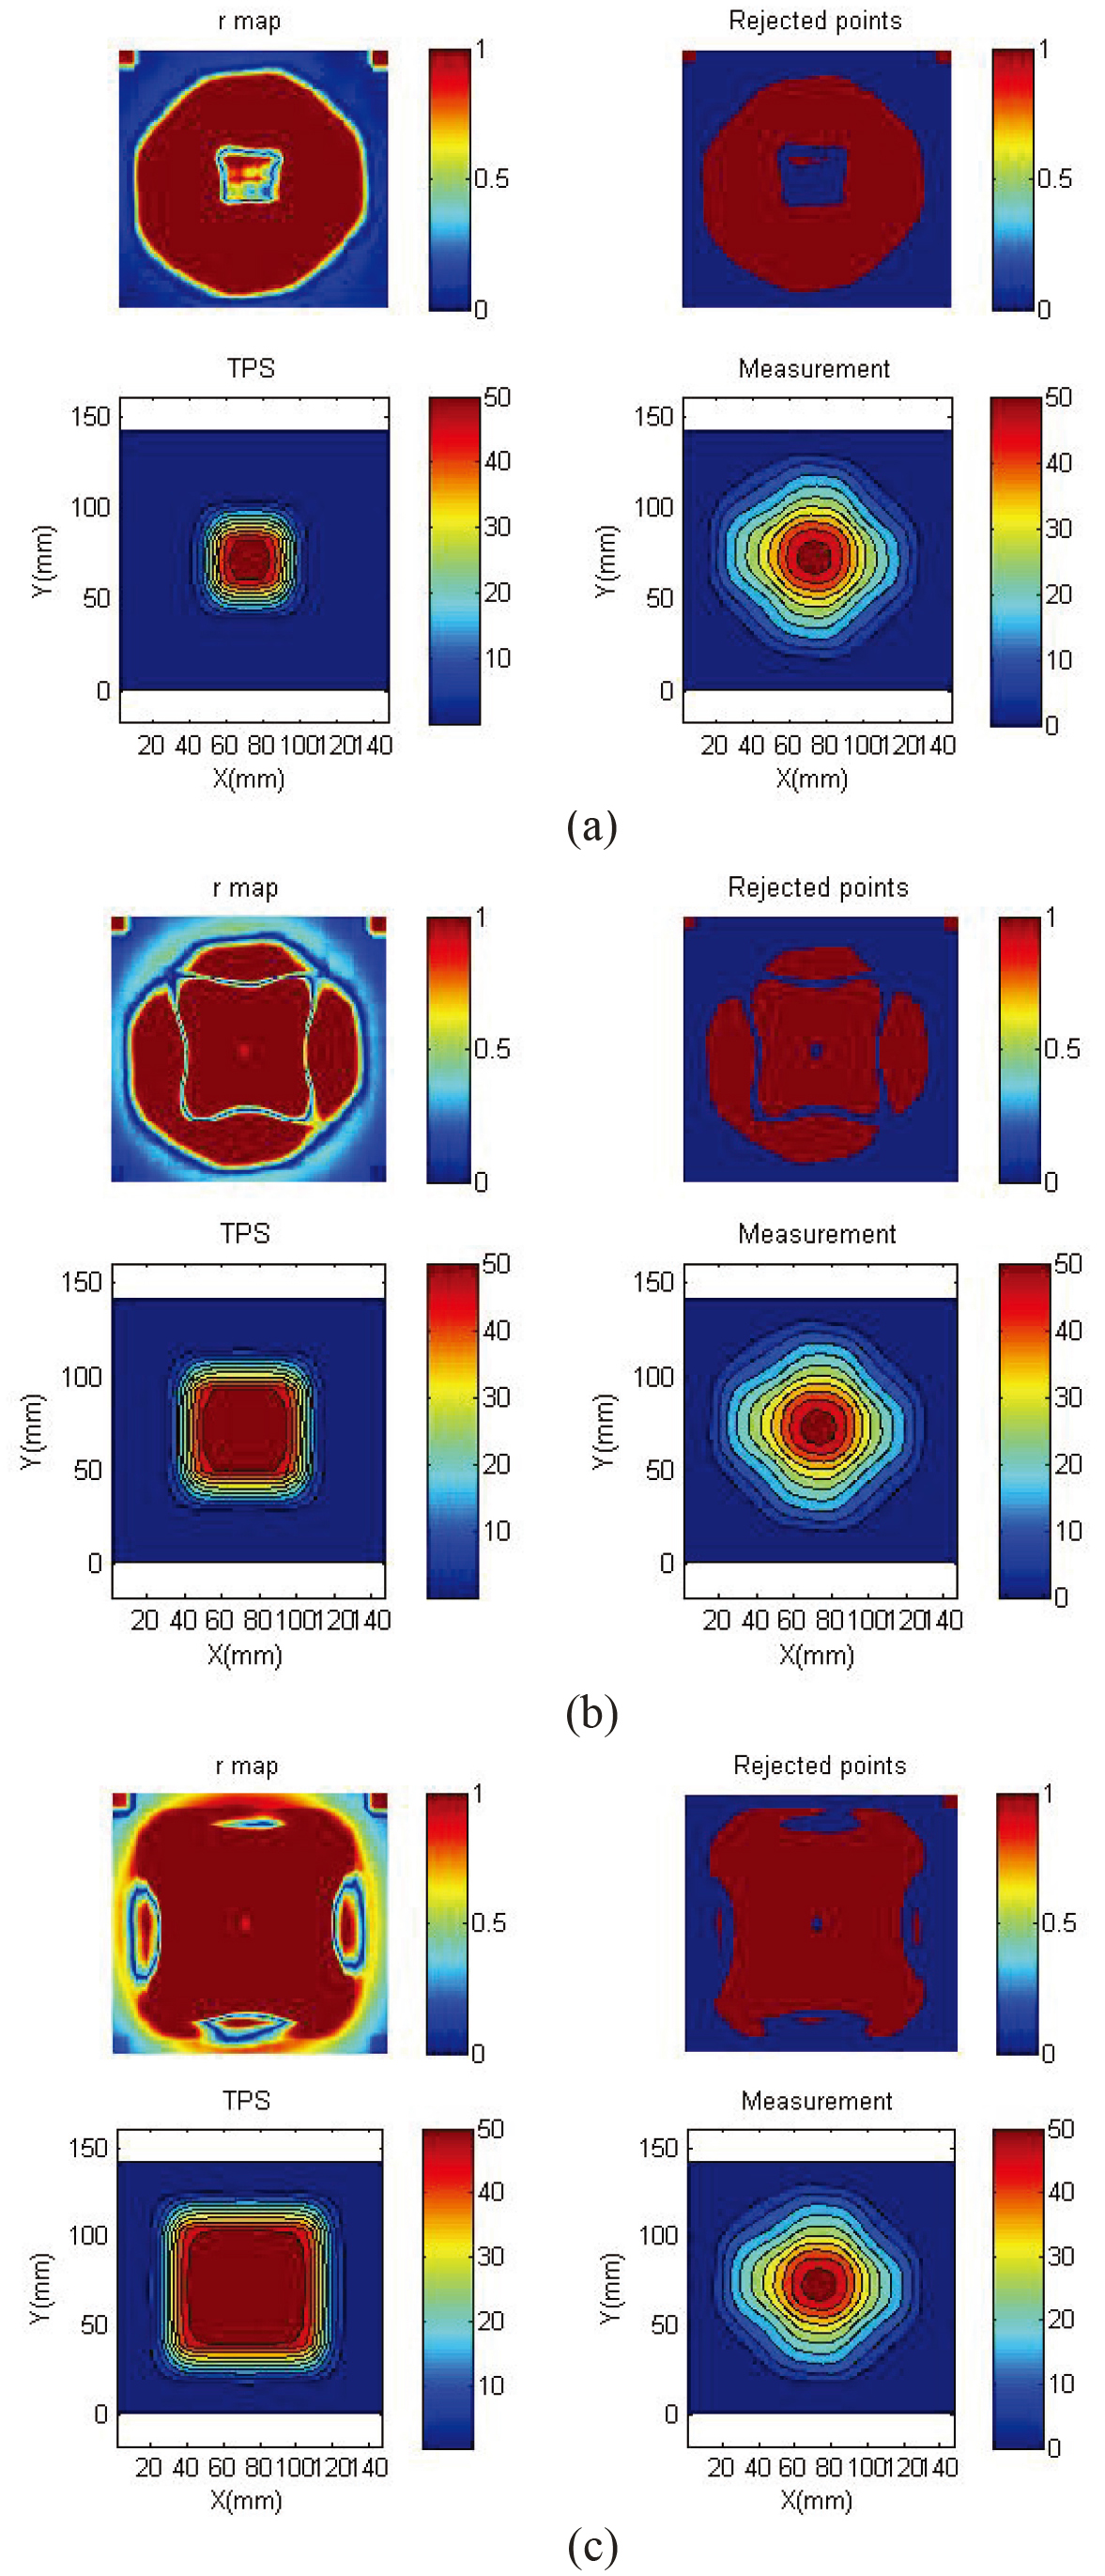
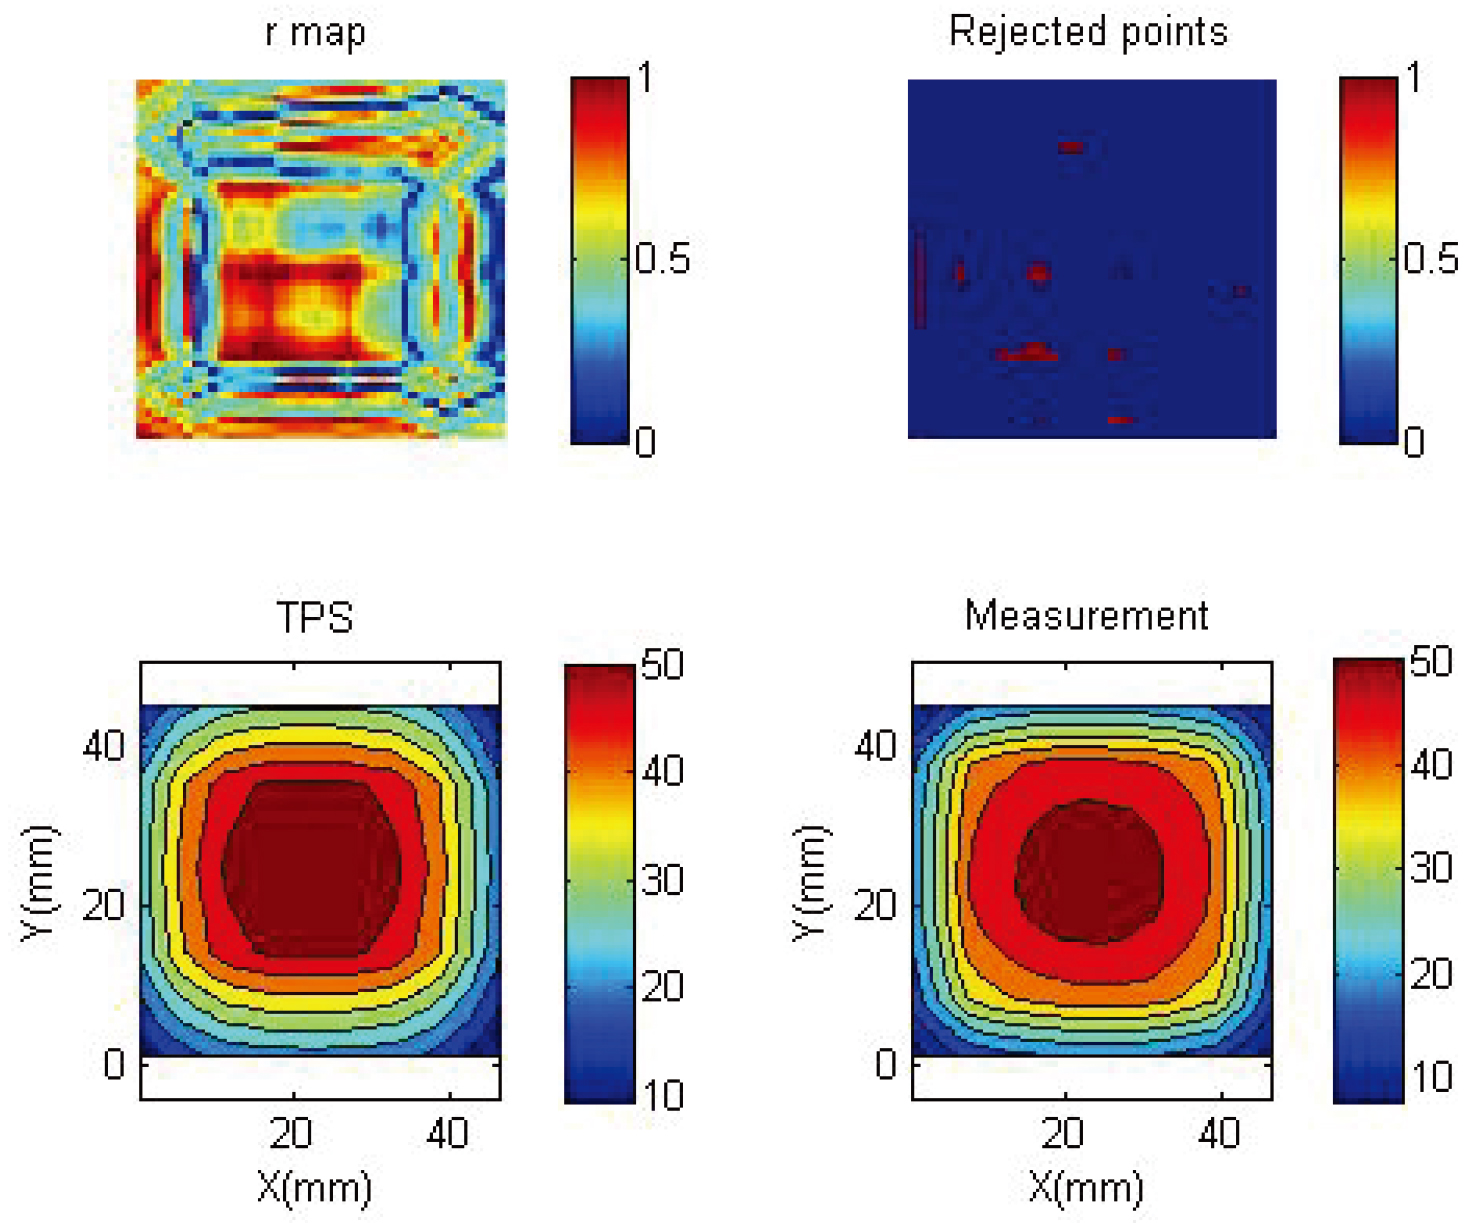
Figure 4.
Gamma map of readout result and TPS. The top to bottom figures show the 3 mm, 3% gamma map for (a) 2
3.2Dose distribution and isodose line
Figure 3 shows the dynamics of 2
Figure 5.
Comparison of readout results and dose curve at
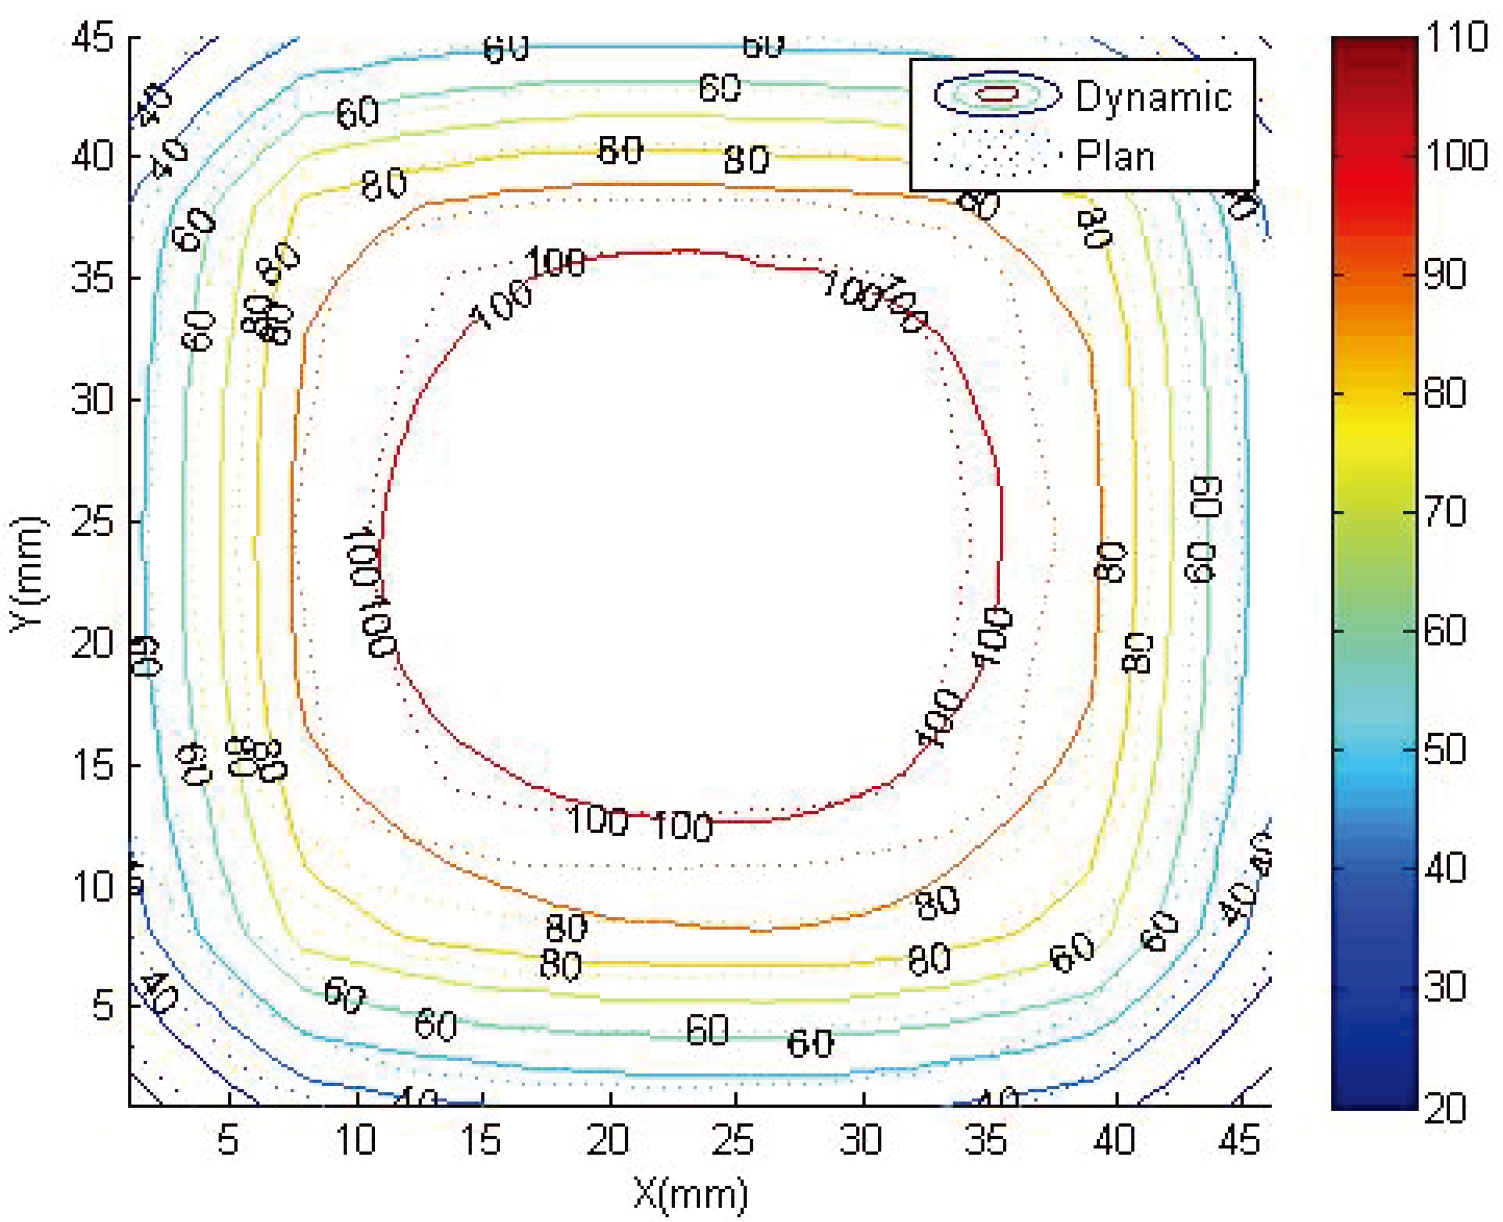
Figure 6.
3 mm, 3% gamma map of readout results and dose curve at
3.3Gamma map of the adjustment
Figure 6 shows the gamma map of the 2
4.Discussion
4.1Selection of suitable readout tools
The main objective of this study was to examine the feasibility of clinical application of NIPAM gel dosimeter when irradiated under continuous motion. De Deene et al. proposed a complete insight on how to use MRI to read out a gel dosimeter. Following their recommendation of multiple spin-echo in 2010 [15], they proposed a more complete scanner readout guideline in 2013, including selection of suitable gel dosimeters and MRI imaging sequence parameters, temperature control during gel dosimeter preparation, storage, and scanning, and comparison with treatment plan results [16]. Although there are scanning time and temperature control problems when MRI is used for gel dosimetry, MRI also has many advantages when compared with other readout techniques such as multiple options for parameter sequences, high resolution, and diverse changes in phantom container volume. Therefore, we believed that selection of suitable readout instruments should be one of the guidelines for gel dosimetry measurements.
4.2Selection of optimal parameters
Detailed design is required when using MRI for gel dosimetry. In this study, multiple spin-echo was used for image scanning based on the recommendations of past papers, and T2 weighted image readouts were obtained under different TE conditions for the same TR. Following that, the MATLAB program was used to measure the pixel signal intensity in the area of interest and signal intensity was directly proportional to image brightness. Increase in TR increased the clarity of the phenomenon of protons jumping from a stable state to an excited stable, thereby increasing signal intensity and decreasing noise production. However, a disadvantage was that this increased scanning duration, thereby increasing gel temperature. In their article published in 2000, De Deene et al. mentioned that temperature elevation when MRI was used for gel dosimetry caused dose to be underestimated [17]. Therefore, TR was set as 3000 ms and only one slice of Dmax was acquired to decrease scanning time and temperature elevation. In addition, longer TE caused differences in gel that were irradiated with different doses and more TE sampling tended to lead to actual T2 attenuation. However, the shortcoming was that it increased total scanning duration. The data requirements of the post-processing workstation used in this study limited minimum TE to be 4 and the software recommended a TE of 8 to more accurately measure the T2 of the material. In order to obtain better measurement image results, we set up 16 sampling TE. Although scanning duration was longer, the calibrated 3 mm, 3% gamma passing rate was 97.92%, which met the clinical criteria of
4.3Dynamic dosimetry in previous papers
In 2015, Hsieh et al. used a calibration tube for dynamic and static dosimetry measurement comparisons in a study that used NIPAM gel dosimetry and results were consistent [18]. They employed an experimental method which placed the calibration field in the center of the field, such that the gel dosimeter was still in 100% of the irradiation area of dose distribution even under dynamic conditions. Therefore, the differences in measurements between the two conditions were not large. The distribution of the dose curve must be completely measured in order to further confirm its clinical applicability and compared with the treatment plan to completely evaluate whether the NIPAM gel dosimeter was suitable for dose analysis of dynamic phantoms. In this study, concentric swinging was used for gel dosimetry, which was different compared with common dynamic phantom swinging methods, so it was difficult to compare with treatment plan results. Therefore, pre-simulation was carried out followed by measurement comparison to estimate the differences between dynamic and static states when the gel dosimeter was used in actual clinical practice. The evaluation results found that the readout result and isodose curve in the treatment plan were similar in the high-dose region and gamma passing rate also met the clinical requirements.
4.4Measurement results of other gel dosimeters
Thomas et al. published a paper in 2013 on employing 3D dosimetry to observe the effects of organ motion on radiotherapy and evaluated its interaction [19]. Their study used the PRESAGE gel dosimeter combined with CIRS dynamic phantom for dosimetry and observed two types of treatment plans, namely the intensity-modulated radiation therapy and the arc therapy (RapidArc). The study results found that the dose volume histogram (DVH) coverages for gross tumor volume (GTV) and clinical target volume (CTV) were similar and there were large differences in DVH coverage between internal target volume (ITV) and planning target volume (PTV). The authors believed that inaccuracy caused by organ motion could be minimized by considering leaf speed of the multileaf collimator, gantry rotation of the device, and breathing period. In this study, 3 mm, 3% gamma passing rate that is commonly used today was used for comparison. Predictions using concentric swing machine pre-simulation found that the GTV/CTV coverage was similar and ITV/PTV coverage difference was large. In addition, the gamma passing rate of dose curves
4.5Study limitations and future developments
Although this study proved that it was feasible to use NIPAM gel dosimeter for dynamic dosimetry, the swinging method was different from commonly seen dynamic phantoms and the field used was not large, which differed from the field that is commonly used in clinical treatment. Therefore, we recommend that commonly used dynamic phantoms could be used in future studies and attempts should be made to quantify dose differences under dynamic states. Furthermore, although MATLAB is a commonly used program, it is not easy to write and apply the program in dose readout measurements. Regardless of whether MRI, OCT, or CT is used, subsequent readout analysis is required in addition to parameter setting for the device. Hence, developing a stable and complete analysis program should be one of the focus for consideration. In addition, although the NIPAM gel dosimeter has strengths in presenting three-dimensional dose distribution, it is still not widely used in clinical practice currently. Furthermore, gel dosimetry is a type of relative dosimetry. Besides comparing with the treatment plan results, we recommend comparing with other dosimetry tools that are commonly used in clinical practice, such as films and free-air ionization chambers to increase the reliability of the reference. Changes in dynamic phantom parameters, such as operating range and frequency, could also be added to obtain more data. We believe that this can be a direction for consideration for future researchers who are interested.
5.Conclusion
Gel dosimetry has the advantage of providing three-dimensional relative dose distribution and the use of dynamic phantom in simulation of dose measurement in organ motion has clinical reference value. Therefore, the combination of the two can simulate the distribution of clinical dynamic dose. Many previous studies on the NIPAM gel dosimeter used static treatment target zones. In this study, we carried out pre-simulation and comparison to confirm that it was feasible to employ NIPAM gel dosimeter and concentric swing machine in simulation of dynamic dose measurement. Appropriate selection and comparison was carried out and it was found that
Acknowledgments
The authors highly appreciate the financial support for this study by the Ditmanson Medical Foundation Chia-Yi Christian Hospital (Contract No. R107-14).
Conflict of interest
None to report.
References
[1] | Azadbakht B, Adinehvand K. Investigation of the post time dependence of PAGAT gel dosimeter by electron beams using MRI technique. Res J Appl Sci Eng Techn. (2012) ; 4: (3): 232-235. |
[2] | Crescenti RA, Scheib SG, Schneider U, Gianolini S. Introducing gel dosimetry in a clinical environment: customization of polymer gel composition and magnetic resonance imaging parameters used for 3D dose verifications in radiosurgery and intensity modulated radiotherapy. Med Phys. (2007) ; 34: (4): 1286-1297. |
[3] | Massilon-JL G, Minniti R, Soarcs CG, Maryanski MJ, Robertson S. Characteristics of a new polymer gel for high-dose gradient dosimetry using a micro optical CT scanner. Appl Radiat Iso. (2010) ; (1): 144-154. |
[4] | Baxter P, Jirasek A, Hilts M. X-ray CT dose in normoxic polyacrylamide gel dosimetry. Med Phys. (2007) ; 34: : 1934-1943. |
[5] | Bussels B, Goethals L, Feron M, Bielen D, Dymarkowski S, Suetens P, et al. Haustermans K. Respiration-induced movement of the upper abdominal organs: A pitfall for the three-dimensional conformal radiation treatment of pancreatic cancer. Radiother Oncol. (2003) ; 68: (1): 69-74. |
[6] | Korin HW, Ehman RL, Riederer SJ, Felmlee JP, Grimm RC. Respiratory kinematics of the upper abdominal organs: A quantitative study. Magn Reson Med. (1992) ; 23: (1): 172-178. |
[7] | Beyer T, Townsend DW, Brun T, Kinahan PE, Charron M, Roddy R, et al. A combined PET/CT scanner for clinical oncology. J Nucl Med. (2000) ; 41: (8): 1369-1379. |
[8] | Goerres GW, Kamel E, Heidelberg T-NH, Schwitter MR, Burger C, von Schulthess GK. PET-CT image co-registration in the thorax: Influence of respiration. Eur J Nucl Med Mol Imaging. (2002) ; 29: (3): 351-360. |
[9] | Gierga DP, Chen GTY, Kung JH, Betke M, Lombardi J, Willett CG. Quantificion of respiration induced abdominal tumor motion and its impact on IMRT dose distribution. Int J Radiat Oncol Biol Phys. (2004) ; 58: (5): 1584-1595. |
[10] | Masset H, Dumas J-L, Gschwind R, Gavignet E, Makovicka L, Bosset J-F. Dosimetric impact of the 2D motion of a platform simulating breathing during a dynamic mode treatment. Cancer Radiother. (2009) ; 13: (2): 108-113. |
[11] | Boda-Heggemann J, Fleckenstein J, Lohr F, Wertz H, Nachit M, Blessing M, et al. Multiple breath-hold CBCT for online image guided radiotherapy of lung tumors: Simulation with a dynamic phantom and first patient data. Radiother Oncol. (2011) ; 98: (3): 309-316. |
[12] | Kai-Yuan C, Ling-Ling H, Cheng-Ting S. A comprehensive evaluation of NIPAM polymer gel dosimeters on three orthogonal planes and temporal stability analysis. PLoS ONE. (2016) ; 11: (5): e0155797. |
[13] | Low DA, Moran JM, Dempsey JF, Dong L, Oldham M. Dosimetry tools and techniques for IMRT. Med Phys. (2011) ; 38: : 1313-1338. |
[14] | Low DA, Harms WB, Mutic S, Purdy JA. A technique for the quantitative evaluation of dose distributions. Med Phys. (1998) ; 25: : 656-661. |
[15] | Deene DY. How to scan polymer gels with MRI? J. Phys.: Conf. Ser. (2010) , 250, 012015. |
[16] | Deene DY, Vandecasteele J. On the reliability of 3D gel dosimetry. J. Phys.: Conf. Ser. (2013) , 444, 012015. |
[17] | Deenet YD, De Wagter C, De Neve W, Achten E. Artefacts in multi-echo T2 imaging for high-precision gel dosimetry: II. Analysis of B1-field inhomogeneity. Phys Med Biol. (2000) ; 45: (7): 1825-1839. |
[18] | Chih-Ming H, Bor-Tsung H, Hang JL, Yu-Bun N, Chih-Wu C, Jung-Chang S, et al. The feasibility assessment of radiation dose of movement 3D NIPAM gel by magnetic resonance imaging. Radiat Phys Chem. (2015) ; 116: : 142-146. |
[19] | Thomas A, Yan H, Oldham M, Juang T, Adamovics J, Yin FF. The effect of motion on IMRT-looking at interplay with 3D measurements. J PhysConf Ser. (2013) ; 444: : 012049. |


