
Application of nonlinear analysis for the assessment of gait in patients with Parkinson’s disease
Abstract
BACKGROUND:
Gait can be affected by diseases such as Parkinson’s disease (PD), which lead to alterations like shuffle gait or loss of balance. PD diagnosis is based on subjective measures to generate a score using the Unified Parkinson’s Disease Rating Scale (UPDRS). To improve clinical assessment accuracy, gait analysis can utilise linear and nonlinear methods. A nonlinear method called the Lyapunov exponent (LE) is being used to identify chaos in dynamic systems. This article presents an application of LE for diagnosing PD.
OBJECTIVE:
The objectives were to use the largest Lyapunov exponents (LaLyEx), sample entropy (SampEn) and root mean square (RMS) to assess the gait of subjects diagnosed with PD; to verify the applicability of these parameters to distinguish between people with PD and healthy controls (CO); and to differentiate subjects within the PD group according to the UPDRS assessment.
METHODS:
The subjects were divided into the CO group (
RESULTS:
There were significant differences between the CO and PD groups for RMS, SampEn and the LaLyEx. After dividing the PD group according to the UPDRS score, there were significant differences in LaLyEx and RMS.
CONCLUSIONS:
The selected parameters can be used to distinguish people with PD from CO subjects, and separate people with PD according to the UPDRS score.
1.Background
Human movement is a complex process that requires the interoperability of all systems in the human body. Gait is one of the important functions of the human movement apparatus. When a person’s gait is disrupted, they experience many difficulties. Gait analysis can help identify human gait disorders and diagnose or quantify the severity of the diseases or help select appropriate medications or rehabilitation program.
Gait can be affected by various injuries and diseases. Each disease affects gait differently, so analysing gait features is important. Conditions such as Parkinson’s disease (PD) and multiple sclerosis damage the locomotor system. PD gait is characterised by major motor symptoms such as leg shuffle, instability at the beginning of gait, shortened stride length and reduced speed. PD is not curable, so the main task while performing diagnostics is to detect it at an early stage [1]. A proper diagnosis of the disease would help select the right treatment. Therefore, gait analysis and research on quantitative parameters in PD diagnostics are performed continuously. PD diagnosis is based on measures derived from visual observations by neurologists who generate a score using the Unified Parkinson’s Disease Rating Scale (UPDRS). This scale consists of four parts: first, assess reasoning, behaviour, and mood; second, evaluate how daily life activities are performed; third, motor task research, which covers 14 areas such as speech, rest tremor, leg mobility etc.; fourth, examine complications caused by drug treatment [2].
Many tools and methods are used to record gait, such as a video camera systems, inertial measurement unit (IMU) sensors [3], force plates [4], electromyogram (EMG) [5] and electric goniometers, which record spatiotemporal parameters. IMUs are widely employed because the sensors are small and portable; there are three types: accelerometer, gyroscope, and magnetometer.
Gait can be analysed using several methods, both linear and nonlinear. Linear methods usually analyse spatiotemporal parameters, which determine parameters such as step length, time, joint amplitudes, rhythm and other kinematic parameters. These parameters and the linear method are used extensively in clinical practice to diagnose and to monitor neurogenerative diseases [6, 7]. Kinematic parameters provide the necessary information, but kinematics alone does not provide a complete description of movement without the knowledge of various dynamic parameters [8].
Even though human gait is a cyclic and repetitive movement, there is some degree of variability expressed in irregular fluctuations over time. Therefore, due to the complexity of gait patterns it can be considered a chaotic system, and nonlinear methods suitable for chaos analysis can be applied to its analysis. The methods used for chaos analysis are considered nonlinear, and the recorded gait data represent a time series. Nonlinear methods applied onto the time series allow obtaining quantitative measures of motion variability [9]. Methods such as the Hurst exponent and the Lyapunov exponent (LE) provide useful information about the dynamic system and are used in clinical trials to analyse biological signals [10].
The human body as a dynamic system in motion possesses a number of active degrees of freedom, and analysis of one of its variables changing in time via nonlinear analysis allows determining the characteristic quantities related to degrees of freedom such as the largest Lyapunov exponent (LaLyEx) [11]. LaLyEx calculation has been mostly applied to study a single joint affected by osteoarthritis [12] and to assess a person’s balance while standing [13]. Another important application of LE is in the analysis of knee movement in the sagittal plane [14]. Most of the studies have used LaLyEx for only one joint or segment or for the more affected side. No research has been performed using LE and LaLyEx on two lower extremity joints (hip, knee on both sides) and it is desired to evaluate diseases that involve limb motor action dysfunction with respect to the LaLyEx parameter based on clinical evaluations. LaLyEx was used analysed young and elderly individuals [15]. Liu et al. [16] used LaLyEx to analyse relationship between nonlinear dynamic character and individuals standing balance. Nessler et al. [17] used nonlinear time series analysis to examine the variability of multiple kinematic variable of human locomotion. Gouwanda et al. [18] used Maximum Lyapunov Exponent to investigate how knee and ankle brace affects a person’s natural dynamic gait stability. Yang and Wu [13] showed potential of LaLyEx measure the balance control of human standing.
Several nonlinear parameters have been used in the development of diagnostic systems or for the quantitative evaluation of movements. Each of the nonlinear parameters can be adapted to a specific registered signal. Quantitative information about the motion performed can be gathered by nonlinear parameters such as sample entropy (SampEn) and root mean square (RMS). These quantitative parameters have been widely used in experimental studies and clinical practice [15, 16]; they can be applied to time series data recorded from various sensors.
Entropy measures the level of regularity of a time series; high values indicate reduction of regularity [17] and can be interpreted as knowledge about lost information in the time series data. The SampEn algorithm is sensitive to input parameters such as
The main objectives of the study was to use LaLyEx, SampEn and RMS to assess PDimpaired gait; to verify the applicability of these parameters to separate PD and healthy control (CO) groups from each other; and to differentiate the subjects within the PD group based on the UPDRS. After verifying these parameters, they could be included in a clinical decision support system for PD diagnostics.
2.Methods
2.1Subjects and biomedical experiment setup
Biomechanical data were collected from two groups consisting of patients diagnosed with PD and healthy control volunteers. The demographic data of the subjects are presented in Table 1. The biomedical experiment was performed in cooperation with a neurologist in the Santara Clinics, neurology department. The inclusion criteria for both groups were:
Table 1
Demographic and clinical characteristics of the subjects
| Group | Age (mean | Total UPDRS score (mean | UPDRS III score |
|
|---|---|---|---|---|
| PD | 60.26 | 38.17 | 26.57 | 14 |
| CO | 57.83 | NA | NA | 12 |
| UDPRS 0 | 63 | 43.14 | 25.29 | 7 |
| UPDRS 1 | 64.43 | 50.83 | 35.16 | 7 |
IMU sensors were used to record the subjects’ gait data (Shimmer Research, Dublin, Ireland) [25]. The sensors were placed on the right and left shank and thigh. Each subject was asked to walk at their selected comfortable speed and abilities a marked distance of 5 m. The task was repeated three times.
2.2Experimental data processing
Raw data were processed using MATLAB software (Mathworks Inc., 2020, USA). Three parameters were selected for nonlinear analysis of the lower extremity: LaLyEx, SampEn and RMS (Fig. 1).
Figure 1.
The calculation algorithm.
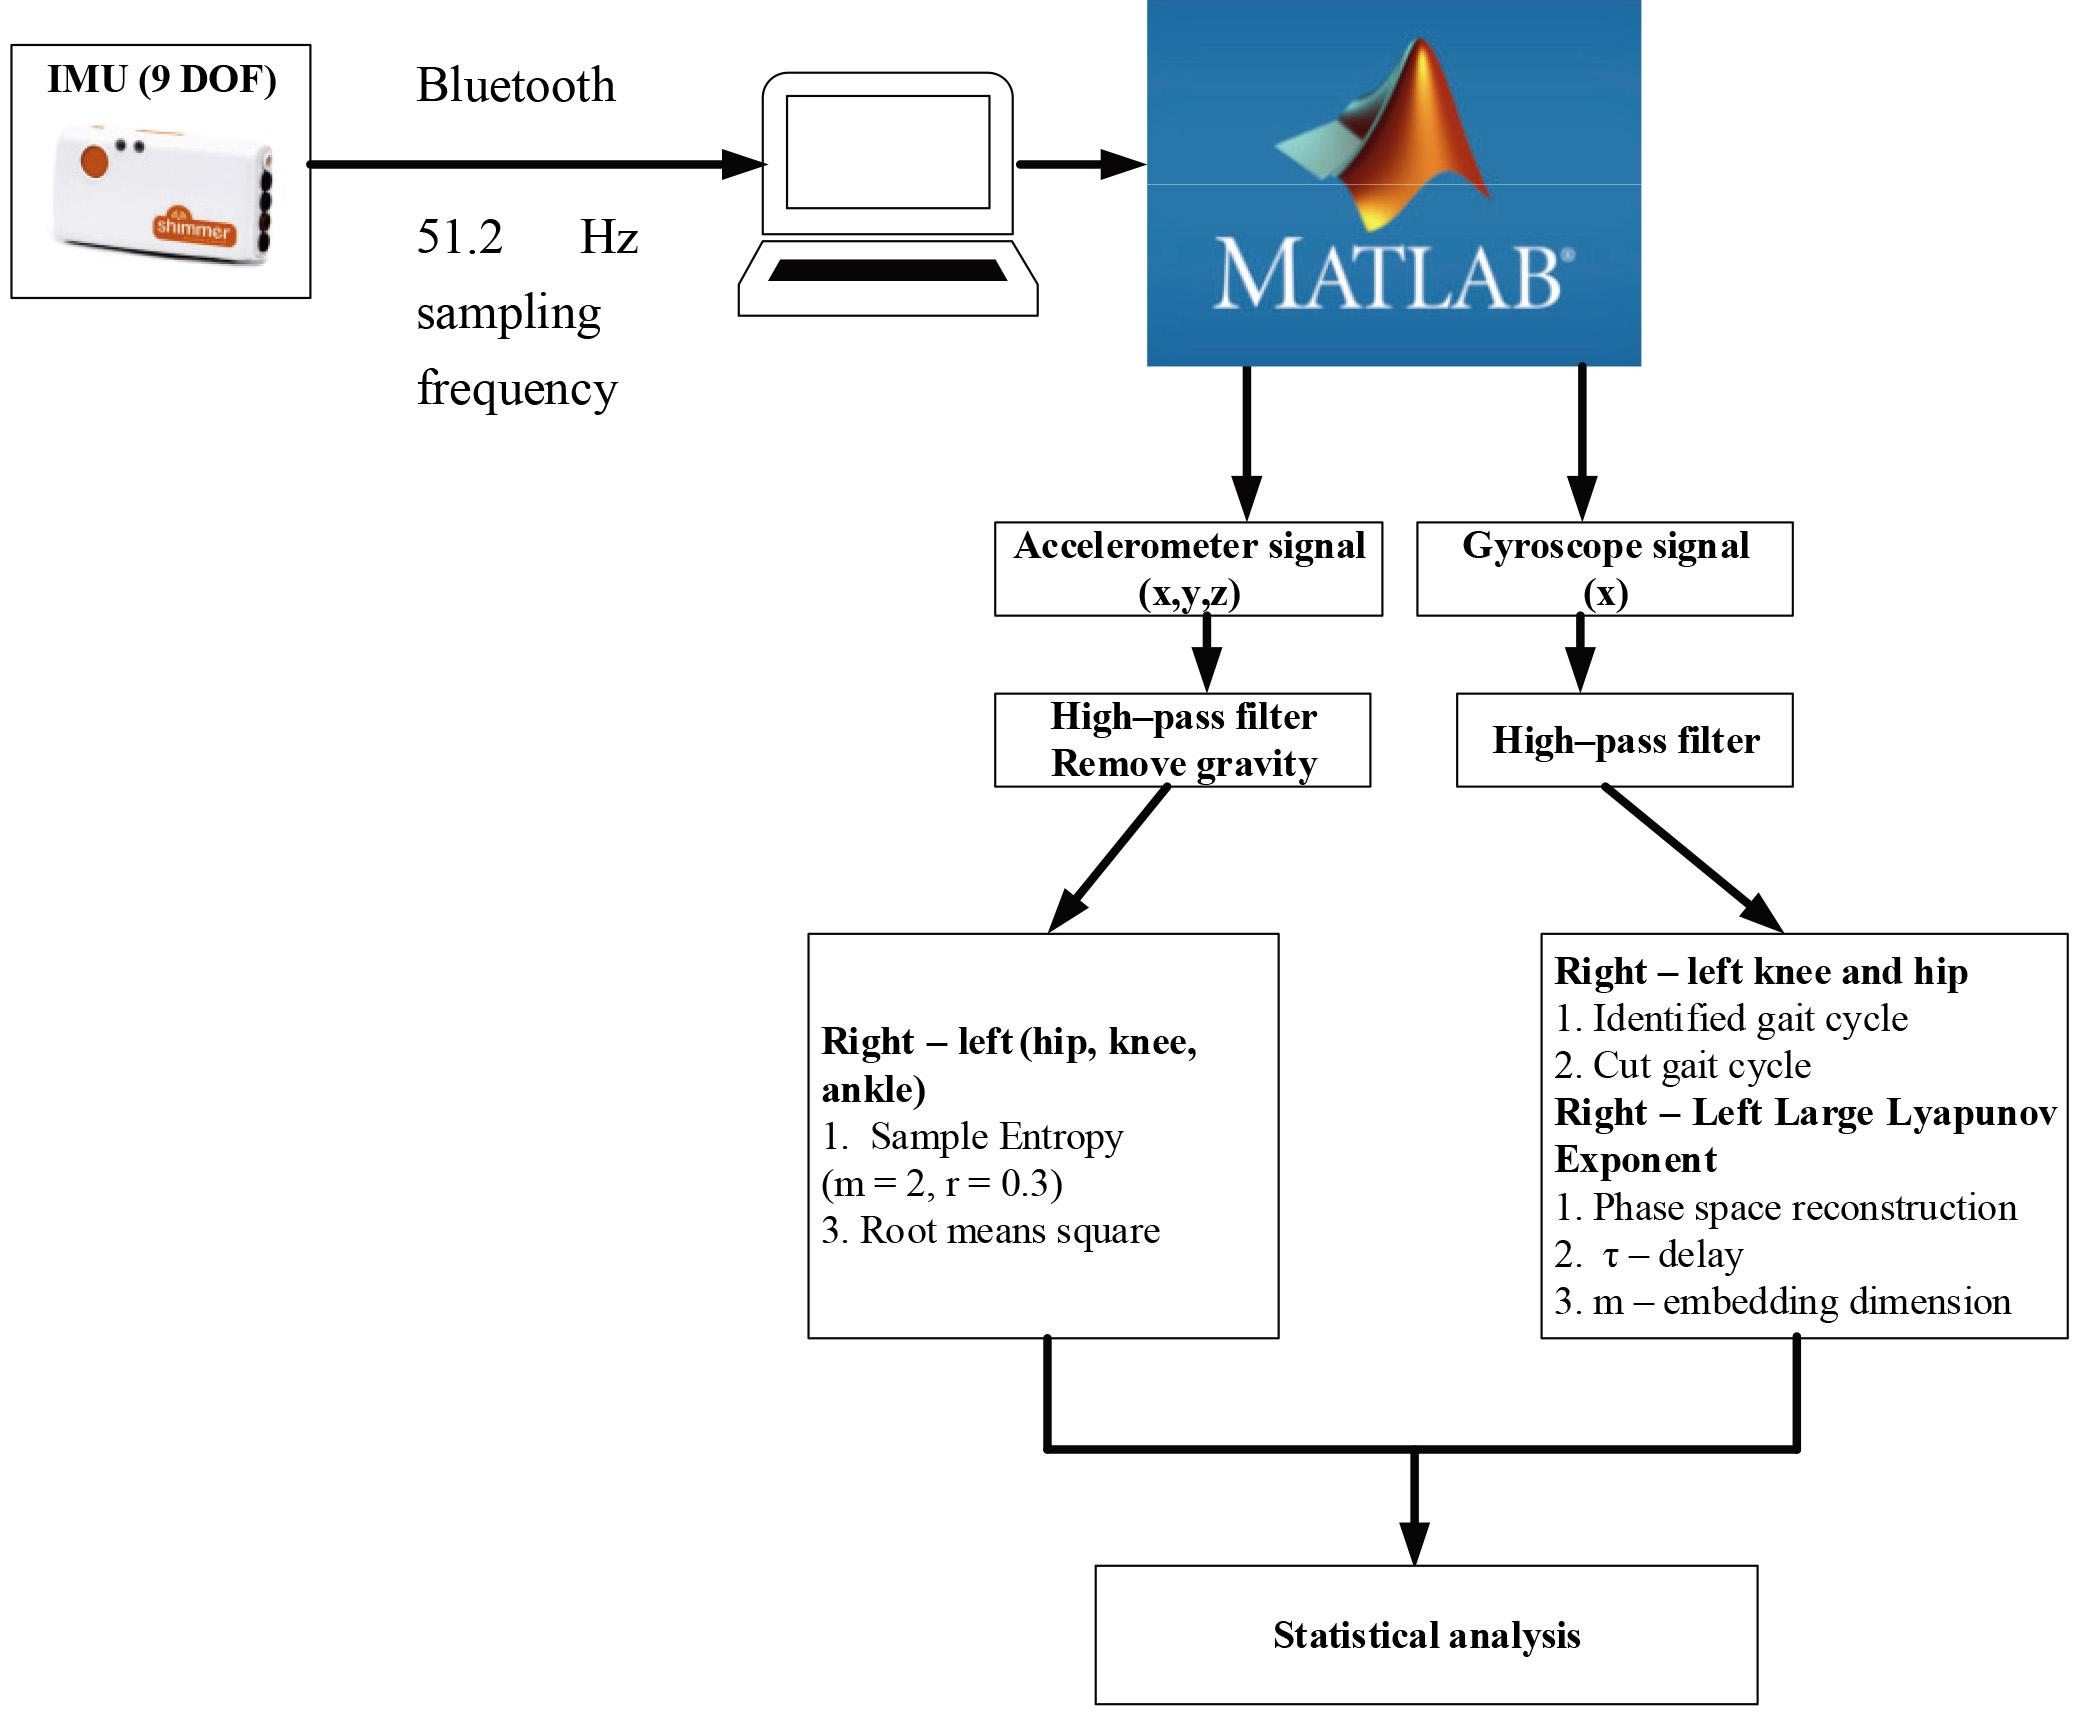
Figure 2.
Phase plane for mean cycle.
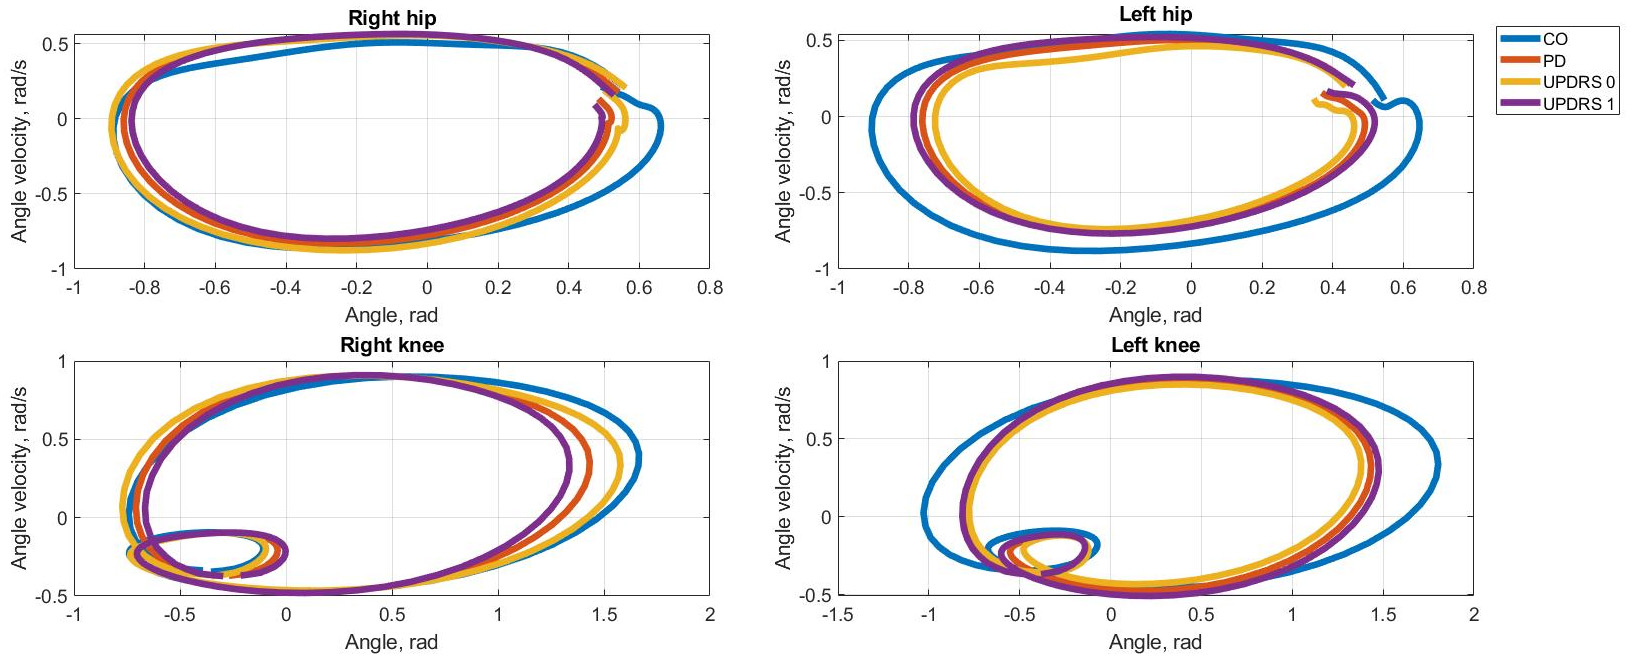
Phase plane plots are used to characterize the kinematics of the dynamics system and provide a better understanding of the steady state dynamics (Fig. 2).
The Madgwick AHRS algorithm was used to determine the orientation of the sensors [26]. Two signals were selected for data processing, namely acceleration and angular velocity. The pre-processing for each is described below.
1. Gravity components were removed from the acceleration signal and high-pass filtered with a cut-off frequency of 1 Hz with a first order Butterworth filter. From this signal, RMS for each segment and each axis was calculated (all-time series). RMS defined as:
(1)
SampEn was calculated for each joint and each axis separately. The following values were used to calculate SampEn with parameters
(2)
Where
2. The angular velocity signal was filtered using a fifth-order low-pass Butterworth filter and a cut-off frequency of 5 Hz. By having curves of angular velocity of the thigh in the sagittal plane, it is possible to find characteristic points of gait phases (swing, step, stride, etc.) [27].
3. The next step was the calculation of LaLyEx, which measures exponential divergence between two trajectories in phase space. The phase space reconstruction defined as:
(3)
where
Phase space reconstruction computes the reconstruction for each time series as
(4)
where
The two other important parameters required to calculate LaLyEx are
(5)
where
The embedding dimension phase space reconstruction is calculated by applying the false nearest neighbour (FNN) algorithm [28]. For a point at dimension
(6)
where
The estimated embedding dimension
2.3Statistical analysis
Separate one-way analysis of variances (ANOVA) were applied to determine a significant difference in the RMS, SampEn and LaLyEx metrics. This test was used to evaluate the null hypothesis that the calculation parameters were the same between PD and CO groups, as well as patients with PD classified according to the UPDRS score. A significant difference was considered when
3.Results and discussion
Nonlinear analysis parameters were calculated for each subject and statistical analysis was performed. There were significant differences between the PD and CO groups (Table 2). After dividing the PD group according to the UPDRS score – 0, normal (no problems), and 1, a slight problem (independent walking with minor gait impairment – there were) significant differences (Table 3).
Table 2
Significant differences between the PD and CO groups
| Parameter | Joint and axis | PD (mean | CO (mean |
|
|---|---|---|---|---|
| RMS | Left hip x-axis | 3.725 | 3.295 | 0.0022 |
| Right knee y-axis | 3.228 | 3.428 | 0.0133 | |
| Left knee y-axis | 3.326 | 3.229 | 0.011 | |
| Right ankle x-axis | 5.588 | 3.916 | 0.0011 | |
| Left ankle x-axis | 5.549 | 3.586 | 0.0033 | |
| Left ankle y-axis | 8.138 | 5.833 | ||
| Sample entropy | Left hip y-axis | 0.615 | 0.655 | 0.0003 |
| Right knee y-axis | 0.466 | 0.514 | 0.0009 | |
| Left knee y-axis | 0.483 | 0.559 | ||
| Large Lyapunov exponent | Right hip | 0.385 | 0.276 | 0.0364 |
| Left hip | 0.428 | 0.35 | 0.0438 | |
| Right knee | 0.283 | 0.188 | 0.0397 | |
| Left knee | 0.242 | 0.183 | 0.0228 |
Table 3
Significant differences between the UDPRS 0 and UDPRS 1 groups
| Parameter | Joint and axis | UDPRS 0 (mean | UDPRS 1 (mean |
|
|---|---|---|---|---|
| RMS | Right ankle x-axis | 4.814 | 6.361 | 0.0158 |
| Right ankle y-axis | 6.607 | 9.041 | 0.0147 | |
| Right ankle z-axis | 5.901 | 7.144 | 0.0129 | |
| Large Lyapunov exponent | Right knee | 0.139 | 0.238 | 0.0208 |
RMS, SampEn and LaLyEx were selected for nonlinear gait analysis, which allowed us to distinguish PD and CO groups as well as to separate subjects with PD according to the UDPRS score.
LaLyEx allowed the study groups to be separated according to the calculated values for two joints (right and left hip and knee). LaLyEx for an unstable system that has a high amount of divergence will be positive with a large value (
RMS values between the PD and CO groups were obtained only for the left hip x-axis, the right knee y-axis, the left knee y-axis, the right ankle x-axis and the left ankle y-axis. There were higher values in the PD group, an outcome that underscores gait is more intense than in the CO group. After dividing the PD group according to the UPDRS score, there was a significant difference between UPDRS 0 and UPDRS 1 at the right ankle in all axes (x, y and z). There were higher values in the UDPRS 1 group.
There were significant SampEn differences in the sagittal plane of the right and left knee and left hip joints. The PD group had lower SampEn values, indicating that subjects in this group tend to be more likely to fall. There were no significant differences when dividing the PD group according to the UPDRS score. Therefore, it can be concluded that this parameter is more suitable for separating subjects diagnosed with PD from healthy controls than separating subjects with PD according to the disease rating scale.
4.Conclusions
The selected parameters can be used to distinguish between PD and control groups as well as to separate subjects with PD according to the assessment of the severity using the UPDRS score. The selected parameter will be included in the diagnostic system, which will quantify PD motor disorder based on UPDRS recommendations. The obtained results allow to state that RMS better separates both PD vs CO and UPDRS 0 and UPDRS 1 groups. SampEN and LaLyEx resulta are more appropriate for PD and CO groups, than for assessing disease severity based UPDRS. LaLyEx values are higher in the PD groups than in CO, so this parameter allowed to distinguish PD vs CO groups in the hip and knee joints. This result suggest that hip and knee joints are more damaged in PD group and have greater chaos during gait than in the CO group. SampEn lower values in PD group of knee joints predict disorder and a higher probability of falling in motions. No statically significant differences were found in UPDRS 0 and UPDRS group indicating that fall prediction when gait rates 0 and 1 is difficult and this parameter is not appropriate.
Conflict of interest
None to report.
References
[1] | Abdulhay E, Arunkumar N, Narasimhan K, Vellaiappan E, Venkatraman V, de Souza MA, et al. Feasibility of large-scale deployment of multiple wearable sensors in Parkinson’s disease. Front Neurol [Internet]. (2018) ; 12: (5): 1-8. Available from: doi: 10.1038/s41531-019-0093-5. |
[2] | Goetz CG. What’s new? Clinical progression and staging of Parkinson’s disease. J Neural Transm Suppl. (2006) ; (70): 305-8. |
[3] | Parisi F, Ferrari G, Giuberti M, Contin L, Cimolin V, Azzaro C, et al. Inertial BSN-based characterization and automatic UPDRS evaluation of the gait task of parkinsonians. IEEE Trans Affect Comput. (2016) ; 7: (3): 258-71. |
[4] | Karatsidis A, Jung M, Schepers HM, Bellusci G, de Zee M, Veltink PH, et al. Musculoskeletal model-based inverse dynamic analysis under ambulatory conditions using inertial motion capture. Med Eng Phys. (2019) ; 65: : 68-77. |
[5] | Trinler U, Hollands K, Jones R, Baker R. A systematic review of approaches to modelling lower limb muscle forces during gait: Applicability to clinical gait analyses. Gait Posture [Internet]. (2018) ; 61: (November 2017): 353-61. Available from: doi: 10.1016/j.gaitpost.2018.02.005. |
[6] | Chen PH, Wang RL, Liou DJ, Shaw JS. Gait disorders in Parkinson’s disease: Assessment and management. Int J Gerontol [Internet]. (2013) ; 7: (4): 189-93. Available from: doi: 10.1016/j.ijge.2013.03.005. |
[7] | Massimiliano Pau, 1 Federica Corona 1, Roberta Pili, 2 Carlo Casula 2, Marco Guicciardi, 3 Giovanni Cossu 2, Murgia4 M. Quantitative assessment of gait parameters in people with Parkinson’s disease in laboratory and clinical setting: Are the measures interchangeable? Neurol Int 2018. (2018) ; 10: : 1-4. |
[8] | Vieten MM, Sehle A, Jensen RL. A novel approach to quantify time series differences of gait data using attractor attributes. PLoS One. (2013) ; 8: (8). |
[9] | Quintana-Duque JC, Saupe D. Evidence of chaos in indoor pedaling motion using non-linear methods. Perform Anal Sport IX. (2013) ; 203-13. |
[10] | Goshvarpour A, Goshvarpour A. Nonlinear analysis of human gait signals. Int J Inf Eng Electron Bus. (2012) ; 4: (2): 15-21. |
[11] | Perc M. The dynamics of human gait. Eur J Phys. (2005) ; 26: (3): 525-34. |
[12] | Daniela TARNITA D-BM. Nonlinear dynamics of normal and osteoarthritic human knee. (2017) ; 18: (4): 353-60. |
[13] | Yang C, Wu Q. On stabilization of bipedal robots during disturbed standing using the concept of Lyapunov exponents. Proc Am Control Conf. (2006) ; 2006: (February): 2516-21. |
[14] | Fallah Yakhdani HR, Bafghi HA, Meijer OG, Bruijn SM, van den Dikkenberg N, Stibbe AB, et al. Stability and variability of knee kinematics during gait in knee osteoarthritis before and after replacement surgery. Clin Biomech [Internet]. (2010) ; 25: (3): 230-6. Available from: doi: 10.1016/j.clinbiomech.2009.12.003. |
[15] | Mehdizadeh S. The largest Lyapunov exponent of gait in young and elderly individuals: A systematic review. Gait Posture [Internet]. (2018) ; 60: (January): 241-50. Available from: doi: 10.1016/j.gaitpost.2017.12.016. |
[16] | Liu K, Wang H, Xiao J, Taha Z. Analysis of Human Standing Balance by Largest Lyapunov Exponent. (2015) ; 2015. |
[17] | Nessler JA, De Leone CJ, Gilliland S. Nonlinear Time Series Analysis Of Knee and Ankle Kinematics During Side By Side Treadmill Walking Nonlinear Time Series Analysis Of Knee and Ankle Kinematics During. (2009) ; 19. |
[18] | Gouwanda D, Muraledharan SP. Local gait dynamic stability of individuals with knee brace and ankle brace. 2012 IEEE-EMBS Conf Biomed Eng Sci IECBES 2012. (2012) December; pp. 294-9. |
[19] | Stergiou N, Decker LM. Human movement variability, nonlinear dynamics, and pathology: Is there a connection? Hum Mov Sci. (2011) ; 30: (5): 869-88. |
[20] | Kosse NM, Vuillerme N, Hortobágyi T, Lamoth CJC. Multiple gait parameters derived from iPod accelerometry predict age-related gait changes. Gait Posture. (2016) ; 46: : 112-7. |
[21] | Ahmadi S, Sepehri N, Wu C, Szturm T. Sample entropy of human gait center of pressure displacement: A systematic methodological analysis. Entropy. (2018) ; 20: (8): 1-17. |
[22] | Yentes JM, Hunt N, Schmid KK, Kaipust JP, McGrath D, Stergiou N. The appropriate use of approximate entropy and sample entropy with short data sets. Ann Biomed Eng. (2013) ; 41: (2): 349-65. |
[23] | Bisi MC, Riva F, Stagni R. Measures of gait stability: Performance on adults and toddlers at the beginning of independent walking. J Neuroeng Rehabil. (2014) ; 11: (1): 1-9. |
[24] | Pansera M, Estrada JJ, Pastor L, Cancela J, Greenlaw R, Arredondo MT. Multi-parametric system for the continuous assessment and monitoring of motor status in Parkinson’s disease: An entropy-based gait comparison. Proc 31st Annu Int Conf IEEE Eng Med Biol Soc Eng Futur Biomed EMBC 2009. (2009) ; pp. 1242-5. |
[25] | Huijben B, van Schooten KS, van Dieën JH, Pijnappels M. The effect of walking speed on quality of gait in older adults. Gait Posture. (2018) ; 65: (July 2017): 112-6. |
[26] | Millar PJ, Rakobowchuk M, McCartney N, MacDonald MJ. Heart rate variability and nonlinear analysis of heart rate dynamics following single and multiple wingate bouts. Appl Physiol Nutr Metab. (2009) ; 34: (5): 875-83. |
[27] | Mei Z, Zhao G, Ivanov K, Guo Y, Zhu Q, Zhou Y, et al. Sample entropy characteristics of movement for four foot types based on plantar centre of pressure during stance phase. Biomed Eng Online [Internet]. (2013) ; 12: (1): 1. Available from: BioMedical Engineering OnLine. |
[28] | Decker LM, Cignetti F, Stergiou N. Wearing a safety harness during treadmill walking influences lower extremity kinematics mainly through changes in ankle regularity and local stability. J Neuroeng Rehabil [Internet]. (2012) ; 9: (1): 8. Available from: http://www.jneuroengrehab.com/content/9/1/8. |
[29] | McGrath D, Greene BR, O’Donovan KJ, Caulfield B. Gyroscope-based assessment of temporal gait parameters during treadmill walking and running. Sport Eng. (2012) ; 15: (4): 207-13. |
[30] | Madgwick SOH. An efficient orientation filter for inertial and inertial/magnetic sensor arrays. Rep x-io Univ |
[31] | Luksys D, Jatuzis D, Kaladyte-Lokorniniene R, Buneviciute R, Sawicki A, Griskevicius J. Differentiation of gait using principal component analysis and application for Parkinson’s disease monitoring. Proc Int Conf BIOMDLORE. (2018) ; pp. 2-5. |
[32] | Sakdapong Chavanaves. Exploration of gait variability and local dynamic stability of foot and trunk in human walking using accelerometers. Vol. 6. (2017) . |
[33] | Myers SA, Johanning JM, Stergiou N, Celis RI, Robinson L, Pipinos II. Gait variability is altered in patients with peripheral arterial disease. J Vasc Surg [Internet]. (2009) ; 49: (4): 924-931.e1. Available from: doi: 10.1016/j.jvs.2008.11.020. |

