
Temporal changes of quantitative CT findings from 102 patients with COVID-19 in Wuhan, China: A longitudinal study
Abstract
BACKGROUND:
Computed tomography (CT) imaging combined with artificial intelligence is important in the diagnosis and prognosis of lung diseases.
OBJECTIVE:
This study aimed to investigate temporal changes of quantitative CT findings in patients with COVID-19 in three clinic types, including moderate, severe, and non-survivors, and to predict severe cases in the early stage from the results.
METHODS:
One hundred and two patients with confirmed COVID-19 were included in this study. Based on the time interval between onset of symptoms and the CT scan, four stages were defined in this study: Stage-1 (0
RESULTS:
The infection volume and percentage of four HU ranges peaked in Stage-2. The highest proportion of HU [
CONCLUSIONS:
The findings indicate rapid deterioration in the first week since the onset of symptoms in non-survivors. H higher proportion of HU [
1.Introduction
Since December 2019, a novel coronavirus, severe acute respiratory syndrome coronavirus 2 (COVID-19), was reported [1, 2] and has rapidly spread to most countries in the world. By July 24 2020, the number of confirmed COVID-19 cases worldwide had risen above 15 million, and the death toll from COVID-19 passed 619,150 worldwide, equivalent to a mortality rate of around 4.13% [3].
COVID-19 has a high mortality rate, and it progresses rapidly without obvious signs. In previous studies, the times between onset of symptoms and the emergence of ARDS could be as short as 9 days [4]. Despite real-time reverse transcription polymerase chain reaction (RT-PCR) is used as one of the main tool for diagnosing COVID-19 [5], chest computed tomography (CT) imaging, as an auxiliary mean of examination, is fast and can produce fast diagnosis for suspected patients with COVID-19. Because of its high efficiency and sensitivity, CT imaging diagnosis report was once as one of the COVID-19 clinical diagnostic criterion in the Hubei Province by the Chinese Center for Disease Control and Prevention [6]. However, there are individual differences in observing the infection regions among radiologists. Therefore, a combination of artificial intelligence (AI) and CT imaging could be helpful in the diagnosis and prognosis of COVID-19 [7, 8].
However, at present, there is no research on how to evaluate the severity from temporal changes of the quantitative CT findings in detail at the early stage [9, 10]. In this study, we extracted the quantitative parameters associated with lesions from CT images and investigated temporal changes of 8 quantitative parameters in patients with COVID-19, and compared the quantitative parameters across the disease course between three clinic types patients (moderate
2.Materials and methods
2.1Patients
This retrospective study included 102 adult inpatients at Zhongnan Hospital of Wuhan University (Wuhan, China), who died or were discharged between Jan 1, 2020 and Mar 1, 2020. The requirement for informed consent was waived by the ethics commission for this retrospective study. The median age of the 102 patients was 56.0 years (IQR 41.0–68.0), ranging from 25 years to 96 years.
2.2Inclusion and exclusion criterions
All patients diagnosed with COVID-19, confirmed by real-time RT-PCR analysis of throat swab specimens, with obvious lesions in their CT images were included. The patients whose RT-PCR results were positive but CT results normal were exclude.
2.3Typing
Following the guideline of COVID-2019 (trial version 7) issued by the China National Health Commission, the severity includes four types: mild, common, severe, and critical [11]. In order to distinguish patients discharged or not, we categorized patients to three groups based on the severity: moderate (patients with mild symptoms, including mild and common), severe (survivors with severe symptoms, including severe and critical) and non-survivors. Mild symptoms were defined as not meeting the following three criteria and severe symptoms were defined as meeting one of the following criteria during the disease course: 1) severe respiratory distress (respiratory rate
2.4Stages
Based on the time interval between onset of symptoms and the CT scan, we designated four stages in our study: Stage-1 (CT scans done
3.CT image analyses
3.1Image acquisition
All CT scans were obtained with patients in the supine position, using GE discover CT750 (GE Healthcare, USA). Patients were scanned from the lever of the upper thoracic inlet to the inferior lever of the costophrenic angle. For CT acquisition, the tube voltage was 120 kVp and the tube current was modulated by automatic exposure control system. Images were reconstructed with a slice thickness of 1 mm from the raw data, respectively. The reconstructed images were transmitted to the workstation and picture archiving and communication systems (PACS) for post-processing.
3.2Lesion segmentation
An artificial intelligence (AI) software, uAI-Discover-PNA (pneumonia) [12], developed by United Imaging Intelligence Co., Ltd, was used in the image analysis. The segmentation algorithm in the software is based on a modified 3-D convolutional neural network called VB-net [12]. The VB-net adopted the bottle-neck blocks during the down-sampling and up-sampling operations inside the V-shaped network (V-net) [12]. The bottle-neck blocks use a stacked 3-layer structure (1
3.3Image parameters extraction
According to the segmentation results, 8 parameters, which were potentially related to COVID-19, the infection volume and percentage of HU (
(1)
(2)
Where V(.) represents the volume of the region of interest, x represents different lung lobes or segments, and
The typical pattern of CT values in the range of HU (
Table 1
Baseline characteristics
| Characteristics | All patients ( | Patients with mild symptoms ( | Survivors with severe symptoms ( | Non-survivors ( |
|
|---|---|---|---|---|---|
| Age (years) | 55.3 | 45.2 | 57.6 | 72.5 | |
| Sex | 0.023 | ||||
| Female | 41 (40%) | 24 (56%) | 15 (38%) | 5 (25%) | .. |
| Male | 61 (60%) | 19 (44%) | 27 (62%) | 15 (75%) | .. |
| Chronic diseases | |||||
| Hypertension | 26 (25.5%) | 3 (7%) | 12 (30.8%) | 11 (55%) | |
| Diabetes | 10 (9.8%) | 1 (2.3%) | 7 (17.9%) | 2 (10%) | 0.047 |
| Cardiovascular diseases | 13 (12.7%) | 1 (2.3%) | 6 (15.4%) | 6 (30%) | 0.005 |
| Chronic obstructive pulmonary disease (COPD) | 4 (3.9%) | 2 (4.7%) | 5 (7.8%) | 1 (2.6%) | 1.000 |
| Malignancy | 7 (6.9%) | 0 (0%) | 3 (7.7%) | 4 (20%) | 0.008 |
| Main signs and symptoms | |||||
| Fever | 87 (85.3%) | 41 (95.3%) | 37 (94.9%) | 19 (95%) | 0.016 |
| Highest temperature ( | |||||
| 15 (14.7%) | 12 (27.9%) | 2 (5.1%) | 1 (5%) | .. | |
| 37.3 to 38.0 | 14 (13.7%) | 7 (16.3%) | 6 (15.4%) | 1 (5%) | .. |
| 38.0 to 39.0 | 45 (44.1%) | 20 (46.5%) | 19 (48.7%) | 6 (30%) | .. |
| 28 (27.5%) | 4 (9.3%) | 12 (30.8%) | 12 (60%) | .. | |
| Cough | 55 (53.9%) | 22 (51.2%) | 21 (53.8%) | 12 (60%) | 0.812 |
| Myalgia or fatigue | 60 (58.8%) | 22 (51.2%) | 25 (64.1%) | 13 (65%) | 0.425 |
| Headache | 10 (9.8%) | 5 (11.6%) | 3 (7.7%) | 2 (10%) | 0.909 |
| Diarrhea | 14 (13.7%) | 4 (9.3%) | 4 (10.3%) | 6 (30%) | 0.093 |
| Dyspnea | 19 (18.6%) | 3 (7%) | 8 (20.5%) | 8 (40%) | 0.006 |
| Respiratory percentage (bpm) | 20.5 | 19.6 | 20.3 | 23.1 | 0.023 |
| Laboratory findings | |||||
| Leukopenia ( | 29 (28.4%) | 17 (39.5%) | 12 (30.8%) | 0 (0%) | 0.001 |
| Lymphocyte count ( | 65 (63.7%) | 23 (53.5%) | 28 (71.8%) | 14 (70%) | 0.192 |
Data are mean
4.Statistical analysis
Statistical analyses were performed using Statistical Package for Social Science (SPSS version 19; IBM, New York, USA). Distribution normality was assessed using the Shapiro-Walk test. Continuous variables and categorical variables were presented as mean (SD) and frequency (%), respectively. We used the Mann-Whitney
Figure 1.
System flowchart. The data flowchart can be divided into three parts: (1) 102 patients were assigned to three groups and then four stages were designated based on the time interval between the onset of symptoms and the CT scans in each group; (2) eight quantitative parameters were calculated according to the segmentation results from 328 CT scans, and (3) statistical analysis was performed from the three perspectives.
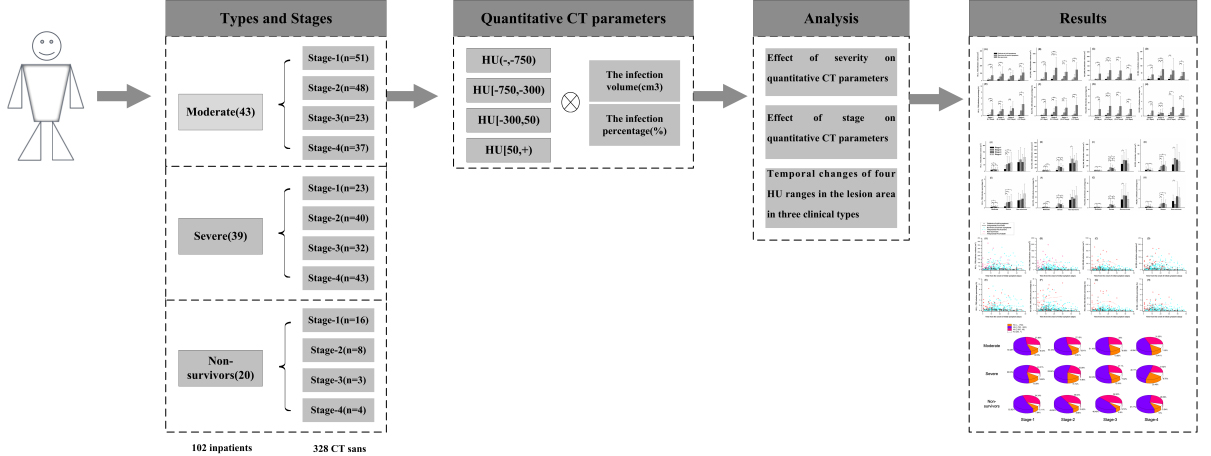
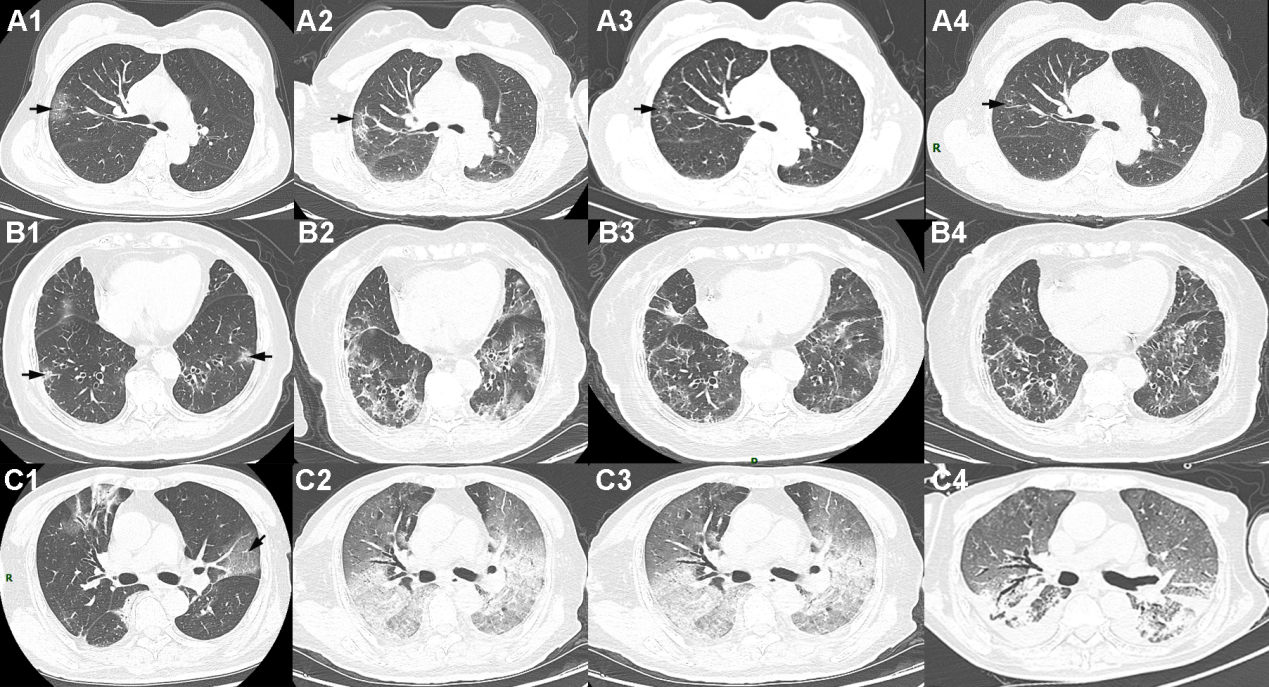
Figure 2.
The CT images of three clinic types of patients at four stages. Shown in A1–A4 (Stage 1–Stage 4) are corresponding slices of a patient with mild symptoms (58 years, male). Shown in B1–B4 (Stage 1–Stage 4) are corresponding slices of a survivor with severe symptoms (82 years, female). Shown in C1–C4 (Stage 1–Stage 4) are corresponding slices of a non-survivor (70 years, male). The infection volume was obviously increasing in Stage-2 (8–15 days since symptom onset) in the three patients.
5.Results
As shown in Table 1, patients were divided into three clinic types based on severity: 43 (42%) patients with mild symptoms, 39 (38%) patients with severe symptoms and the remaining 20 (20%) were non-survivors. There were significant differences in age (
In Stage-1, there were no differences between patients with mild symptoms and survivors with severe symptoms in the infection volume and percentage in four HU ranges. In Stage-2, there were no differences between survivors with severe symptoms and non-survivors in the infection volume and percentage of HU (
For moderate, there were significant differences in the infection volume and percentage of HU (
Figure 3.
Temporal changes in 8 parameters of CT images since symptom onset in three groups and the differences in 8 quantitative parameters of CT images between different groups in the same stage. The figure shows temporal changes in HU (
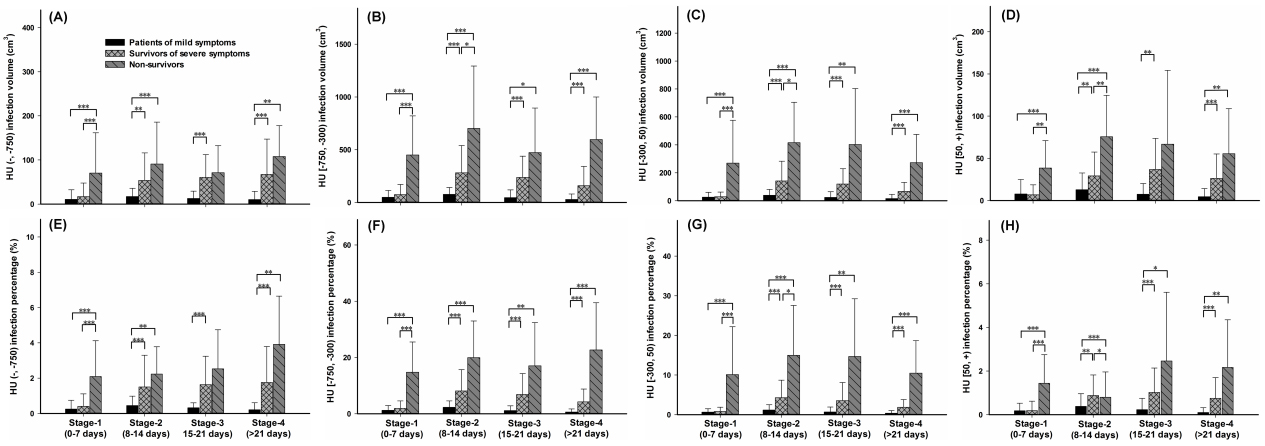
Figure 4.
The differences in 8 quantitative parameters of CT images between different stages in the same group. The figure shows the differences in the same group between four stages in HU (
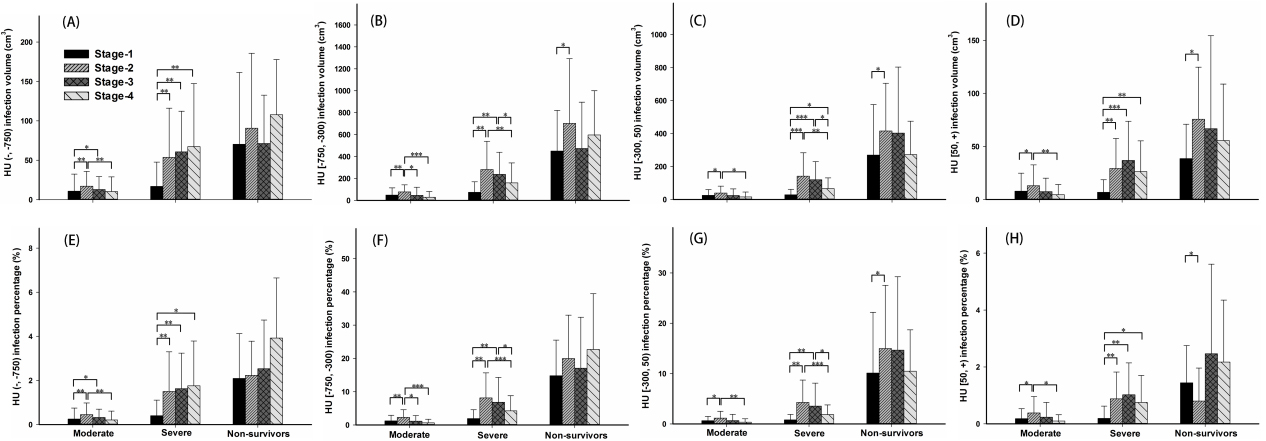
Figure 5.
The total volume and the percentage of the 8 parameters of CT images were fitted with a three-order polynomial estimation model from illness onset in three clinic types of patients with COVID-19. The figure shows temporal changes in HU (
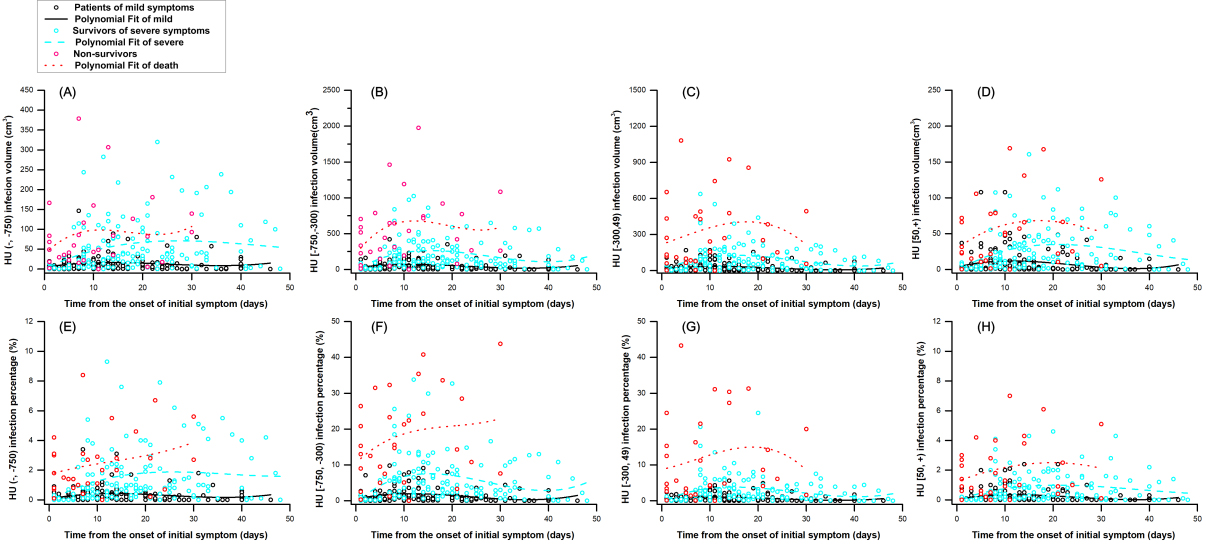
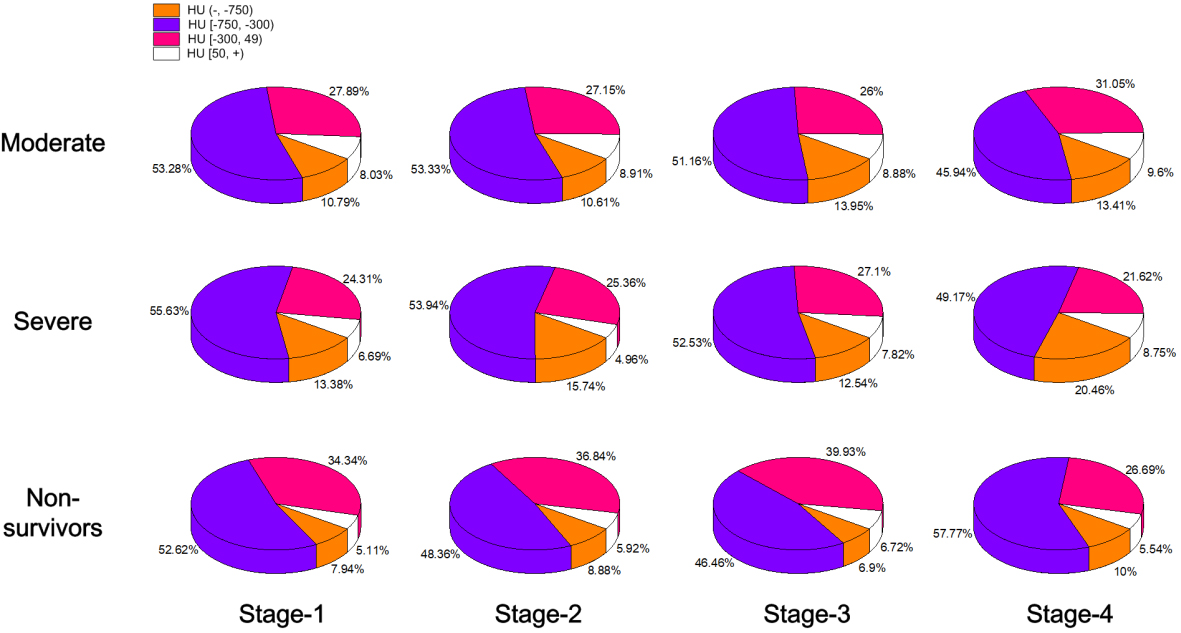
Figure 6.
Temporal changes in the proportion of four HU ranges in the lesion area since symptom onset in three clinic types, moderate (patients with mild symptoms), severe (survivors with severe symptoms) and non-survivors with COVID-19. The 3D color pie chart shows different patterns in proportion in the three groups in four stages.
Figures 3 and 4 show that the infection volume and percentage in four HU ranges were significantly different between the three groups’ patients in four stages. The infection volume and percentage of HU (
6.Discussion
This study investigated temporal changes of quantitative CT findings in COVID-19 confirmed patients with different clinic types, including moderate, severe, and non-survivors. The infection volume and percentage of HU (
6.1Effect of severity on quantitative CT parameters
For HU [
6.2Effect of stage on quantitative CT parameters
For the moderate and severe group, the infection volume and percentage of HU (
6.3Temporal changes of four HU ranges in the lesion area in three clinical types
For moderate, the three-order polynomial estimation model results showed that all 8 parameters had a stable change during course of disease, which was consistent with their good outcome. For severe, the three-order polynomial estimation model results showed that all 8 parameters increased at Stage-1 and Stage-2 and decreased since Stage-3 during course of disease, which implied the rehabilitation. For non-survivors, the three-order polynomial estimation model results that all 8 parameters increased even at Stage-3, which indicated a continuous progression during course of disease. The highest proportion of HU [
6.4Limitations
The sample size of non-survivors is limited and the follow up CT scans of non-survivors were hard to be obtained because of the disease progress, especially in Stage-3 and Stage-4. Besides, without considering the clinic treatment options might lead to a bias in this study and prospective experimental design could eliminate the effect and is a better choice for such research. However, this is unrealistic for the outbreak of COVID-19. In order to make our research conclusion more credible, we will expand the sample size and refine our experimental design according to the preliminary research results in the future.
6.5Conclusion
This study aimed to investigate temporal changes of quantitative CT findings in confirmed COVID-19 patients with different clinic types, including moderate, severe, and non-survivors. CT findings of quantitative parameters tend to manifest in different CT features in different stages from illness onset among different clinic type patients, and the infection volume of four HU ranges were rapidly increased in Stage-1 (the first week) in non-survivors, and peaked in Stage-2 (the second week) in three groups, which indicated that early and timely intervention is very important. Higher proportion of HU [
Acknowledgments
The authors thank all their colleagues who helped them with the study. They greatly appreciate the kind assistance of Wang Liang (Radiology, Zhongnan Hospital of Wuhan University, Wuhan, China) in the statistical analysis and the staff Zhang Wei and Shen Hong at Shanghai United Imaging Intelligence Healthcare for technical support. They are also grateful to all medical staff for their great work while risking their lives.
Conflict of interest
The authors declared that they have no conflicts of interest to this work.
References
[1] | Zhu N, Zhang D, Wang W, Li X, Yang B, Song J, et al. A novel coronavirus from patients with pneumonia in China, 2019. New England Journal of Medicine, (2020) . |
[2] | Cui J, Li F, Shi Z. Origin and evolution of pathogenic coronaviruses. Nature Reviews Microbiology, (2019) . 17: (3): 181–192. |
[3] | World Health Organization. (2020) . Coronavirus disease (COVID-19) Pandemic. Available from: https://www.who.int/emergencies/diseases/novel-coronavirus-2019. |
[4] | Huang C, Wang Y, Li X, Ren L, Zhao J, Hu Y, et al. Clinical features of patients infected with 2019 novel coronavirus in Wuhan, China. The Lancet, (2020) . 395: (10223): 497–506. |
[5] | Ai T, Yang Z, Hou H, Zhan C, Chen C, Lv W, et al. Correlation of chest CT and RT-PCR testing in coronavirus disease 2019 (COVID-19) in China: a report of 1014 cases. Radiology, (2020) : 200642. |
[6] | National Health Committee of the People’s Republic of China. Notice on Issuing a New Coronavirus Infected Pneumonia Diagnosis and Treatment Plan (Trial Version 5). February 5, (2020) . http://www.nhc.gov.cn/yzygj/s7653p/202002/3b09b894ac9b4204a79db5b8912d4440.shtml. |
[7] | McCall B. COVID-19 and artificial intelligence: protecting health-care workers and curbing the spread. The Lancet Digital Health, (2020) . 2: (4): e166–e167. |
[8] | Shi H, Han X, Jiang N, Cao Y, Alwalid O, Gu J, et al. Radiological findings from 81 patients with COVID-19 pneumonia in Wuhan, China: a descriptive study. The Lancet Infectious Diseases, (2020) . |
[9] | Lu J, Hu S, Fan R, Liu Z, Yin X, Wang Q, et al. ACP risk grade: a simple mortality index for patients with confirmed or suspected severe acute respiratory syndrome coronavirus 2 disease (COVID-19) during the early stage of outbreak in Wuhan, China. (2020) . |
[10] | Cheng Z, Lu Y, Cao Q, Qin L, Pan Z, Yan F, et al. Clinical features and chest CT manifestations of coronavirus disease 2019 (COVID-19) in a single-center study in Shanghai, China. American Journal of Roentgenology, (2020) : 1–6. |
[11] | China National Health Commission. (2020) . Diagnostic and treatment protocol for Novel Coronavirus Pneumonia: Trial version 7. Available from: http://www.nhc.gov.cn/yzygj/s7653p/202003/46c9294a7dfe4cef80dc7f5912eb1989.shtml, (in Chinese). |
[12] | Shan F, Gao Y, Wang J, Sh W, Shi N, Han M, et al. Lung infection quantification of covid-19 in ct images with deep learning. arXiv preprint arXiv:2003.04655, (2020) . |
[13] | Tang Z, Zhao W, Xie X, Zhong Z, Shi F, Liu J, et al. Severity assessment of COVID-19 using CT image features and laboratory indices. Physics in Medicine & Biology, (2020) . |
[14] | Caruso D, Zerunian M, Polici M, Pucciarelli F, Polidori T, Rucci C, et al. Chest CT features of COVID-19 in Rome, Italy. Radiology, (2020) : 201237. |
[15] | Ye Z, Zhang Y, Wang Y, Huang Z, Song B. Chest CT manifestations of new coronavirus disease 2019 (COVID-19): a pictorial review. European radiology, (2020) : 1–9. |
[16] | Wang Y, Dong C, Hu Y, Li C, Ren Q, Zhang X, et al. Temporal changes of CT findings in 90 patients with COVID-19 pneumonia: a longitudinal study. Radiology, (2020) : 200843. |
[17] | Wong HYF, Lam HYS, Fong AH, Leung ST, Chin TW, Lo CSY, et al. Frequency and distribution of chest radiographic findings in COVID-19 positive patients. Radiology, (2020) : 201160. |
[18] | Xu Z, Shi L, Wang Y, Zhang J, Huang L, Zhang C, et al. Pathological findings of COVID-19 associated with acute respiratory distress syndrome. The Lancet Respiratory Medicine, (2020) . 8: (4): 420–422. |
[19] | Zhou S, Wang Y, Zhu T, Xia L. CT features of coronavirus disease 2019 (COVID-19) pneumonia in 62 patients in Wuhan, China. American Journal of Roentgenology, (2020) . 214: (6): 1287–1294. |

