
Study on the prediction of the contamination symptoms in the fermentation process of Chlortetracycline based on soft sensor modeling method
Abstract
BACKGROUND:
How to accurately predict the occurrence of contamination in the fermentation process of Chlortetracycline? How to prompt field operators to take effective measures in time? This is a difficult problem that the fermentation process of Chlortetracycline has not been solved well.
OBJECTIVE:
The aim of this paper is to effectively predict whether the fermentation process of Chlortetracycline is contaminated or not.
METHODS:
A Gaussian process regression soft sensor modeling method with real time integration learning is studied in depth by combining two local learning strategies, namely just-in-time learning (JITL) method and integrated learning method, and a multi-model weighted Gaussian process regression (MWGPR) soft sensor modeling method based on real-time integration learning is proposed in the paper. This soft sensing method was used to study the relationship between the viscosity of fermentation broth and the contamination in fermentation process. A soft-sensing model based on the viscosity of fermentation broth for predicting the signs of contamination is established.
RESULTS:
The validity of this method is verified by field data. The experimental results demonstrate that the soft sensing model proposed in this paper can effectively determine whether the fermentation broth is infected by hybrid bacteria.
CONCLUSIONS:
The method proposed in this paper is innovative and practical so that field operators can issue early warning and take effective measures.
1.Introduction
Chlortetracycline is a secondary metabolite. At present, it mainly depends on the fermentation of Streptomyces aureus. Metabolite Chlortetracycline is obtained by metabolism of the strain, and its fermentation process is a very complex biochemical reaction process. It is difficult to accurately model the mechanism of production process [1, 2]. In order to produce high yield and high quality Chlortetracycline, it is not only necessary to breed good strains of Streptomyces aureus and to develop medium more suitable for the growth and propagation of strains, and the process parameters of fermentation should be adjusted and analyzed [3]. During the fermentation process of Chlortetracycline, the invasion of hybrid bacteria will cause the fermentation liquor to infect bacteria, which will affect the growth of beneficial bacteria and the quality of Chlortetracycline. In severe cases, the fermentation broth is forced out, which is about to be released. If effective sterilization and sterilization measures are not taken timely, other production tanks may be contaminated. It will seriously affect production output and waste a lot of raw materials.
Currently, there are three types of soft sensor modeling methods used in industrial production process. The modeling methods based on production process mechanism, the modeling methods based on production process data and the hybrid modeling methods based on production process mechanism and production process data are respectively [4]. In the fermentation process of Chlortetracycline, transfected bacteria refer to other microorganisms that appear in the fermentation process of Chlortetracycline and affect the growth and reproduction of beneficial bacteria. These are bacteriophages or bacteria and so on. Bacterial infection has always been one of the difficult problems in biological fermentation. These hybrid microbes take away a lot of nutrients. They consume a lot of nutrients such as sugar and nitrogen. Moreover, their metabolites will further influence the growth, reproduction and metabolism of beneficial bacteria [5].
Field operators can influence biological potency of Chlortetracycline fermentation by human factors. For example, the selection and culture of the medium; information handling of cultivation conditions, the treatment of strain, automation control feeding, important parameter measurement. so as to systematically optimize the Chlortetracycline fermentation form and refine Chlortetracycline fermentation process [6]. Because Chlortetracycline production is intermittent, and some factors are uncontrollable, the stability of the biological potency of Chlortetracycline fermentation is not easy to control. A local model was established based on just-in-time learning (JITL) to get a raw predict of the process. A neuro-fuzzy model (NFM) system was built to learn the characteristics of prediction error of JITL. With the error compensation of the NFM, JITL can get a higher modeling accuracy [7]. Reference [8] proposes a multi-model soft sensing method based on Dempster-Shafer theory (DS) and Gaussian process regression (GPR). This method was validated based on simulation data in the process of a penicillin fermentation and industrial data in the process of an erythromycin fermentation. The simulation results demonstrated that the proposed method had good predictive accuracy. In order to reduce the influence on product quality caused by various challenges including process nonlinearity, multiple operating phases, and different local dynamics, reference [9]proposes a multi-model soft sensor method based on the JITL method. The proposed method uses the Gaussian mixture model (GMM) to distinguish the data from different operating phases. A Tennessee Eastman (TE) chemical process is used to show the effectiveness and feasibility of this approach. The results demonstrate that the approach provides higher predictive accuracy.
Fermentation broth viscosity is an important parameter in the fermentation process of Chlortetracycline. To some extent it reflects the concentration of beneficial bacteria in the fermentation tank. The viscosity is usually too low because the strain is not well developed. However, too high viscosity of fermentation fluid will result in slow carbon dioxide emissions and insufficient oxygen supply. It results in abnormal metabolism of beneficial bacteria. If the fermentation broth is infected with bacteriophages or bacteria, the growth, reproduction and metabolism of beneficial bacteria will be affected. The viscosity of the fermentation broth also changes. The purpose of this paper is to apply the soft sensor modeling method to predict the viscosity of Chlortetracycline fermentation broth. The relationship between the viscosity of fermented liquid and the bacteria is studied by analyzing the change trend of the viscosity of fermented liquid in normal and bacteria-infected condition.
This paper combines two local learning strategies of just-in-time learning and integrated learning, and a multi-model weighted Gaussian process regression soft measurement modeling method based on just-in-time integration learning (JITL-MWGPR) is proposed. The main points of this method are summarized as follows:
(1) The feature of dimensionality reduction by principal component analysis (PCA) is used to construct the multi-input variable groups quickly.
(2) The combination of r JITL algorithm and integrated learning method can effectively solve the nonlinear and time-varying problem in the process of Chlortetracycline fermentation, and it has better reliability.
(3) The adaptive updating ability of the soft sensor model is: 1. The real-time update of the model is realized by the method of real-time learning; 2. The weighted values of each local model are updated in real time through Bayesian inference and finite mixture mechanism.
In the production process of Pucheng Zhengda Fujian Biochemical Co. Ltd. in China, the production of each batch of Chlortetracycline is approximately 90
2.Methods
2.1The process of Chlortetracycline fermentation
The process of Chlortetracycline (CTC) fermentation in this paper is an industrial production process in a biochemical company in China. The cultivation process of Streptomyces aureofaciens is carried out in a volume of 120 m
Figure 1.
The technological process of the fed-batch CTC production process.
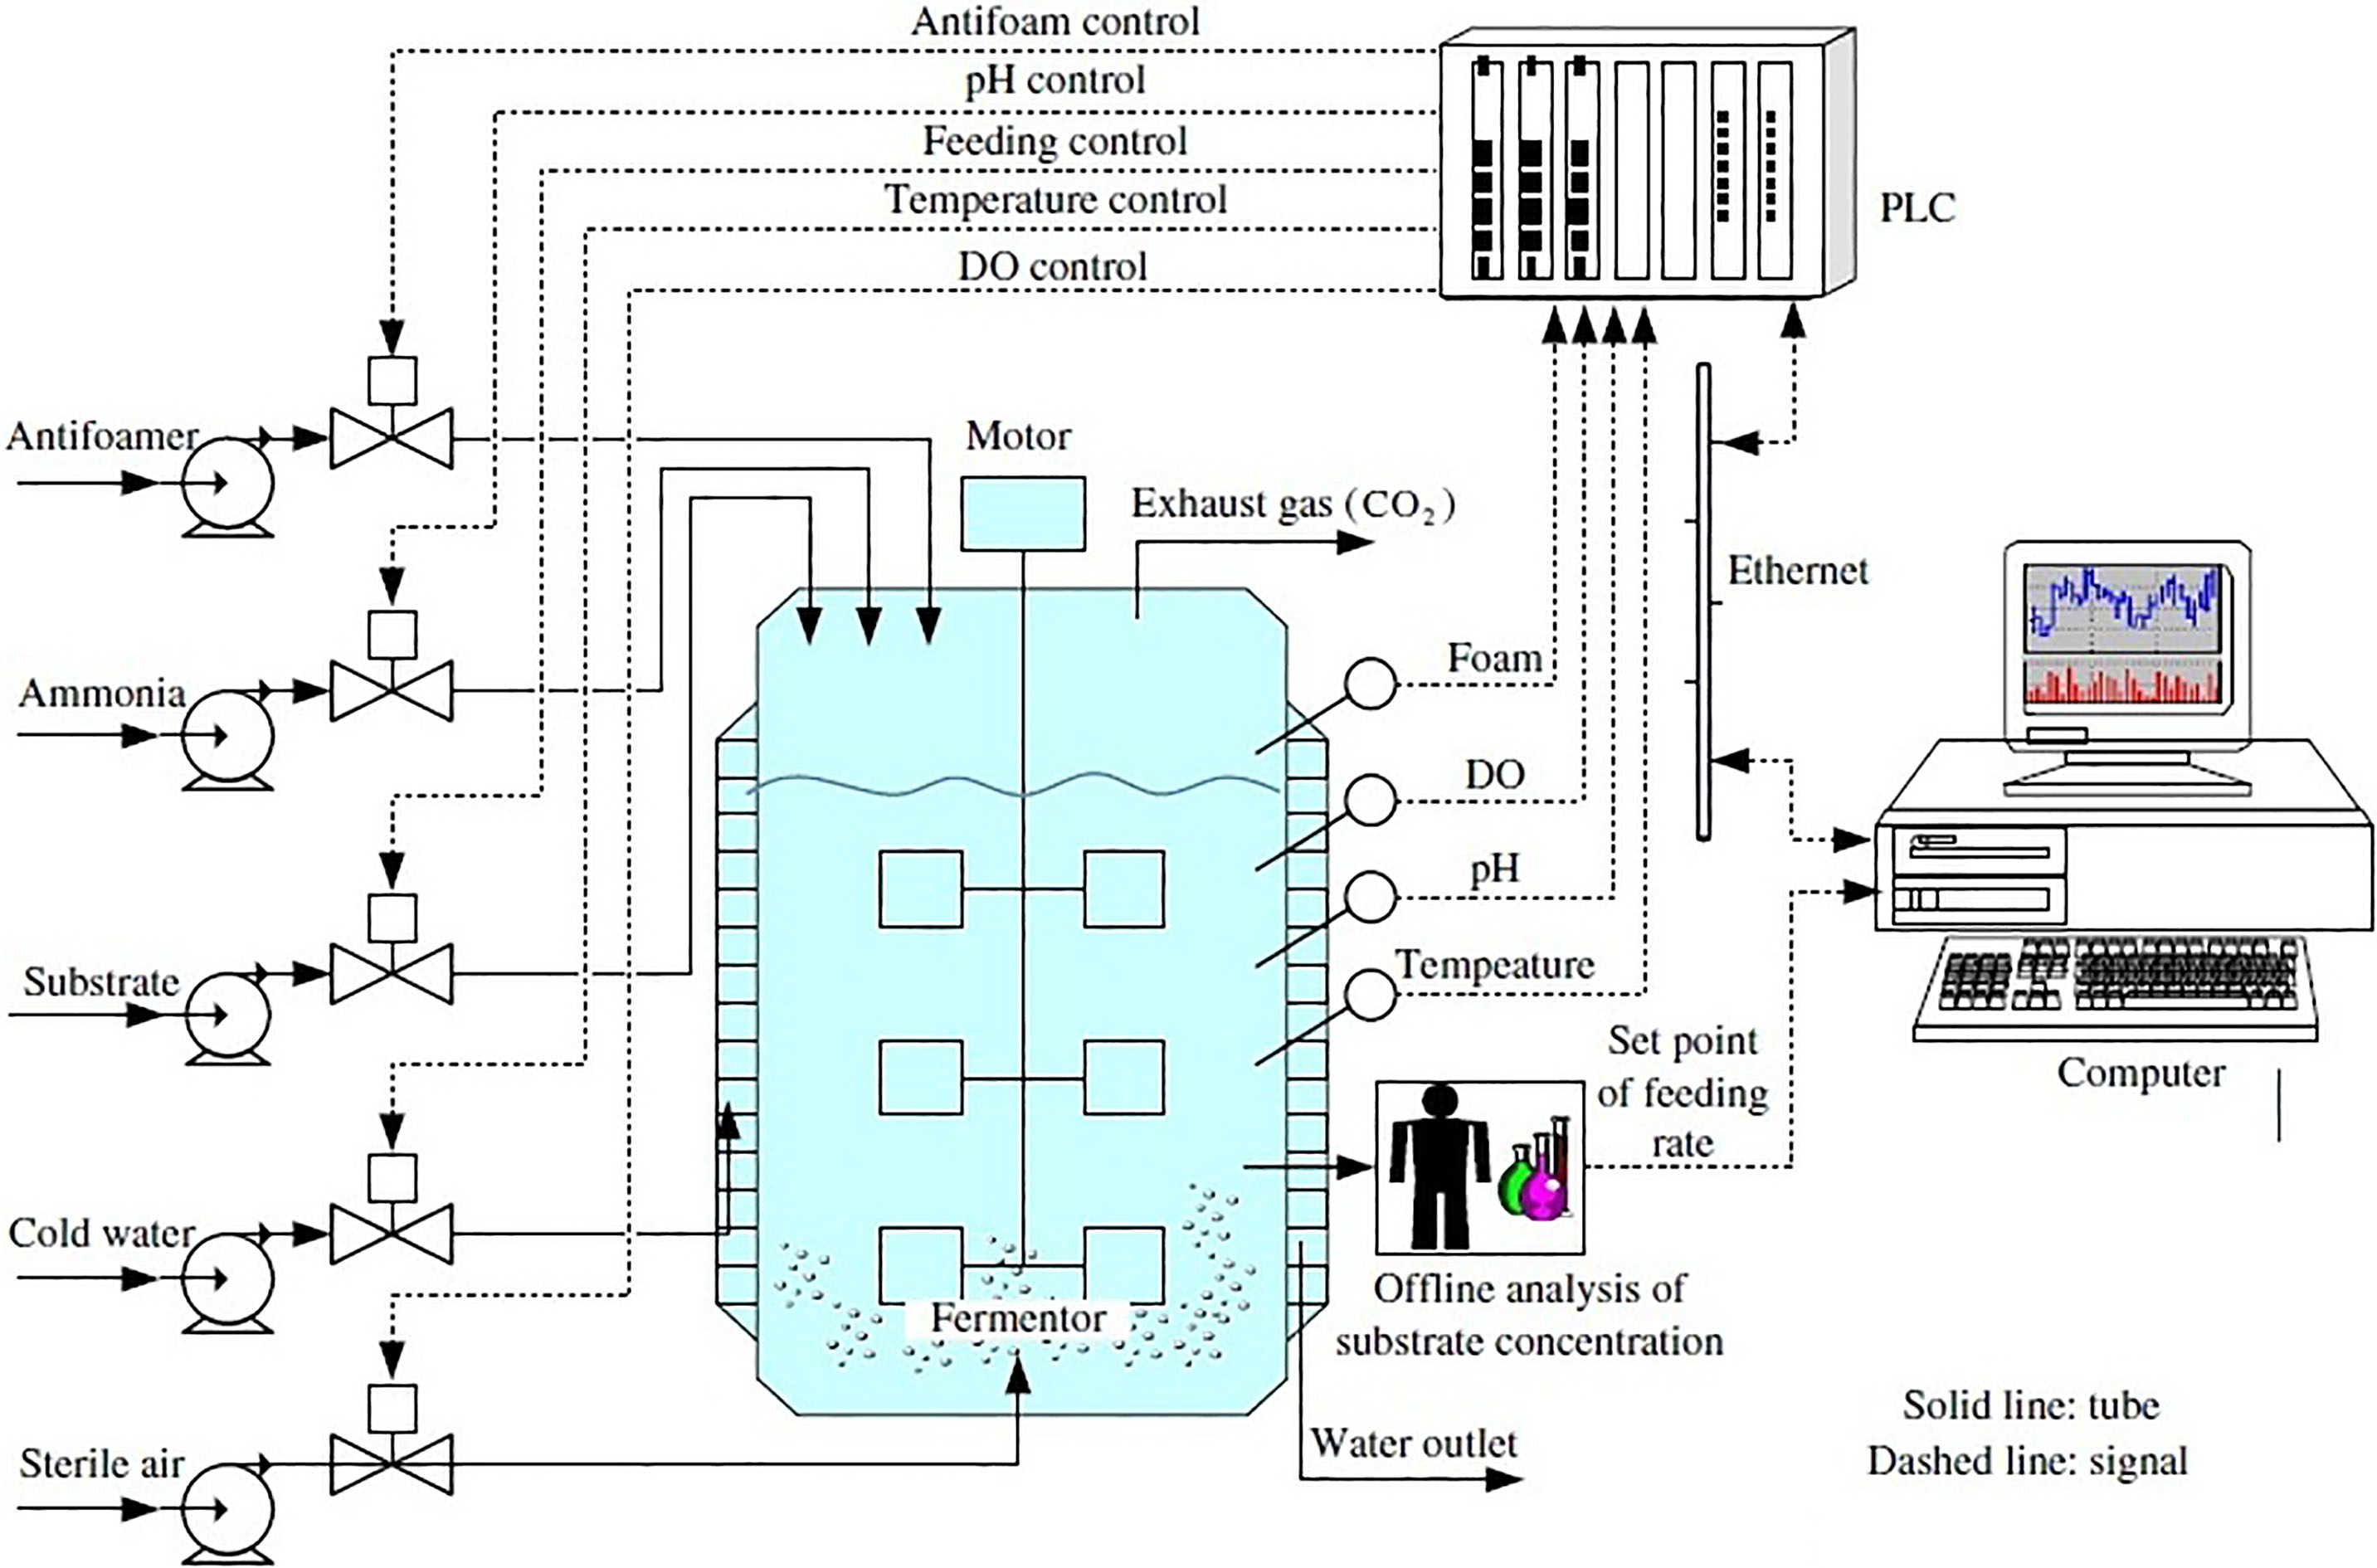
The main measured parameters in the fermentation tank shown in Fig. 1 are air flow, pressure, temperature, dissolved oxygen (DO) concentration, the volume of fermentation broth, pH, the content of carbon dioxide and oxygen in the exhaust and so on. The measured parameters can be measured online or calculated by the related measuring instruments. In addition, the fermentation tank has five main control systems, that are, temperature, pH, DO concentration, antifoam and feeding control systems. The temperature control system is realized by adjusting the cooling water or steam, pH control system is realized by adjusting the flow of ammonia, DO concentration control system is realized by adjusting sterile air flow based on a cascade of PID controllers. Antifoam control system employs two position control method, when the fermenting foam touches the detecting electrode, the antifoam valve is opened automatically. When the fermenting foam drops, the antifoam valve is automatically closed. Feeding control system is realized by adjusting the amount of nutrient flow. The purpose of the above control is to control the main parameters of the fermentation tank in the required values.
2.2JITL-MWGPR soft sensor algorithm
2.2.1Variable component blocks based on PCA
An important part of the JITL modeling approach is to select historical data similar to the prediction samples. There are two methods to select samples for similarity degree. That is, based on the distance and angle between samples, and on the correlation between data [11, 12]. The method of selecting samples with similarity degree is based on the difference of variable groups, and the final samples with similar degree will be very different. Figure 2 fully illustrates this problem. Figure 2 shows a two-dimensional input variable data
Figure 2.
Similar sample selected based on different input variable groups. (a) Similar sample selection results based on
![Similar sample selected based on different input variable groups. (a) Similar sample selection results based on [𝒙1,𝒙2]; (b) Similar sample selection results based on [𝒙1].](https://content.iospress.com:443/media/thc/2019/27-S1/thc-27-S1-thc199020/thc-27-thc199020-g002.jpg)
It can be seen from the above analysis that the selection results of similar samples are closely related to the set of input variables. Therefore, the PCA algorithm is used to block the input variables into several input variable groups. The variable component blocks method based on PCA algorithm is as follows.
(1) For the input variable
(2) Calculate the weight index of each principal component
(3) The weights of each principal component are arranged in descending order, Take the jth principal component for example, that is,
(4) Calculate the number of selected variables in the first principal component,
(5) We get the sets of variables in group
(6) Repeat steps (3) to (5), we can get A sets of input variables for group
2.2.2Selection of locally similar samples
The JITL local learning algorithm first assumes that the test samples have the same distribution characteristics as the selected similar samples. Therefore, the JITL algorithm in this paper is based on different sets of input variables. Historical data similar to the test sample
Let’s say all the historical data sets are
(1)
When a new test sample
(2)
Sort
Repeat the above steps to select a similar historical sample for each set of input variables.
2.2.3Local model construction
Based on the sample set of multiple input variable groups constructed in the previous section, the corresponding local GPR model is established for the sample data of each set of input variables. The local GPR model can be expressed as
(3)
Where,
2.2.4Local model integration
The main idea of integrated learning is to break up and reintegrate. Multiple predictors are predicted simultaneously, and multiple predictors are weighted by a certain fusion method. Compared with the traditional single learner, integrated learning can effectively improve the generalization ability of learning system. In this paper, Bayesian inference and finite mixture mechanism are applied to weighted integration of multiple models. The weight adaptive adjustment of each model is realized. The operation principle can be expressed as
(4)
(5)
Where, the calculation method of posterior probability
(6)
Where,
(7)
(8)
For
2.2.5Model parameters selection
Three key parameters in the JITL-MWGPR soft sensor model need to be determined offline, they are
(1) The cumulative contribution rate of multiple principal components in 95% principal component analysis algorithm is selected.
(2) Cross validation is used to determine the number of
(3) Cross validation is also used to determine the weight adjustment parameter
2.2.6Implementation steps of the JITL-MWGPR soft sensor model
Figure 3 depicts the modeling process of the JITL-MWGPR soft sensor model. The specific implementation steps are as follows. The local JITL-GPR model is established immediately.
Figure 3.
Soft sensor modeling flow chart based on JITL-MWGPR.
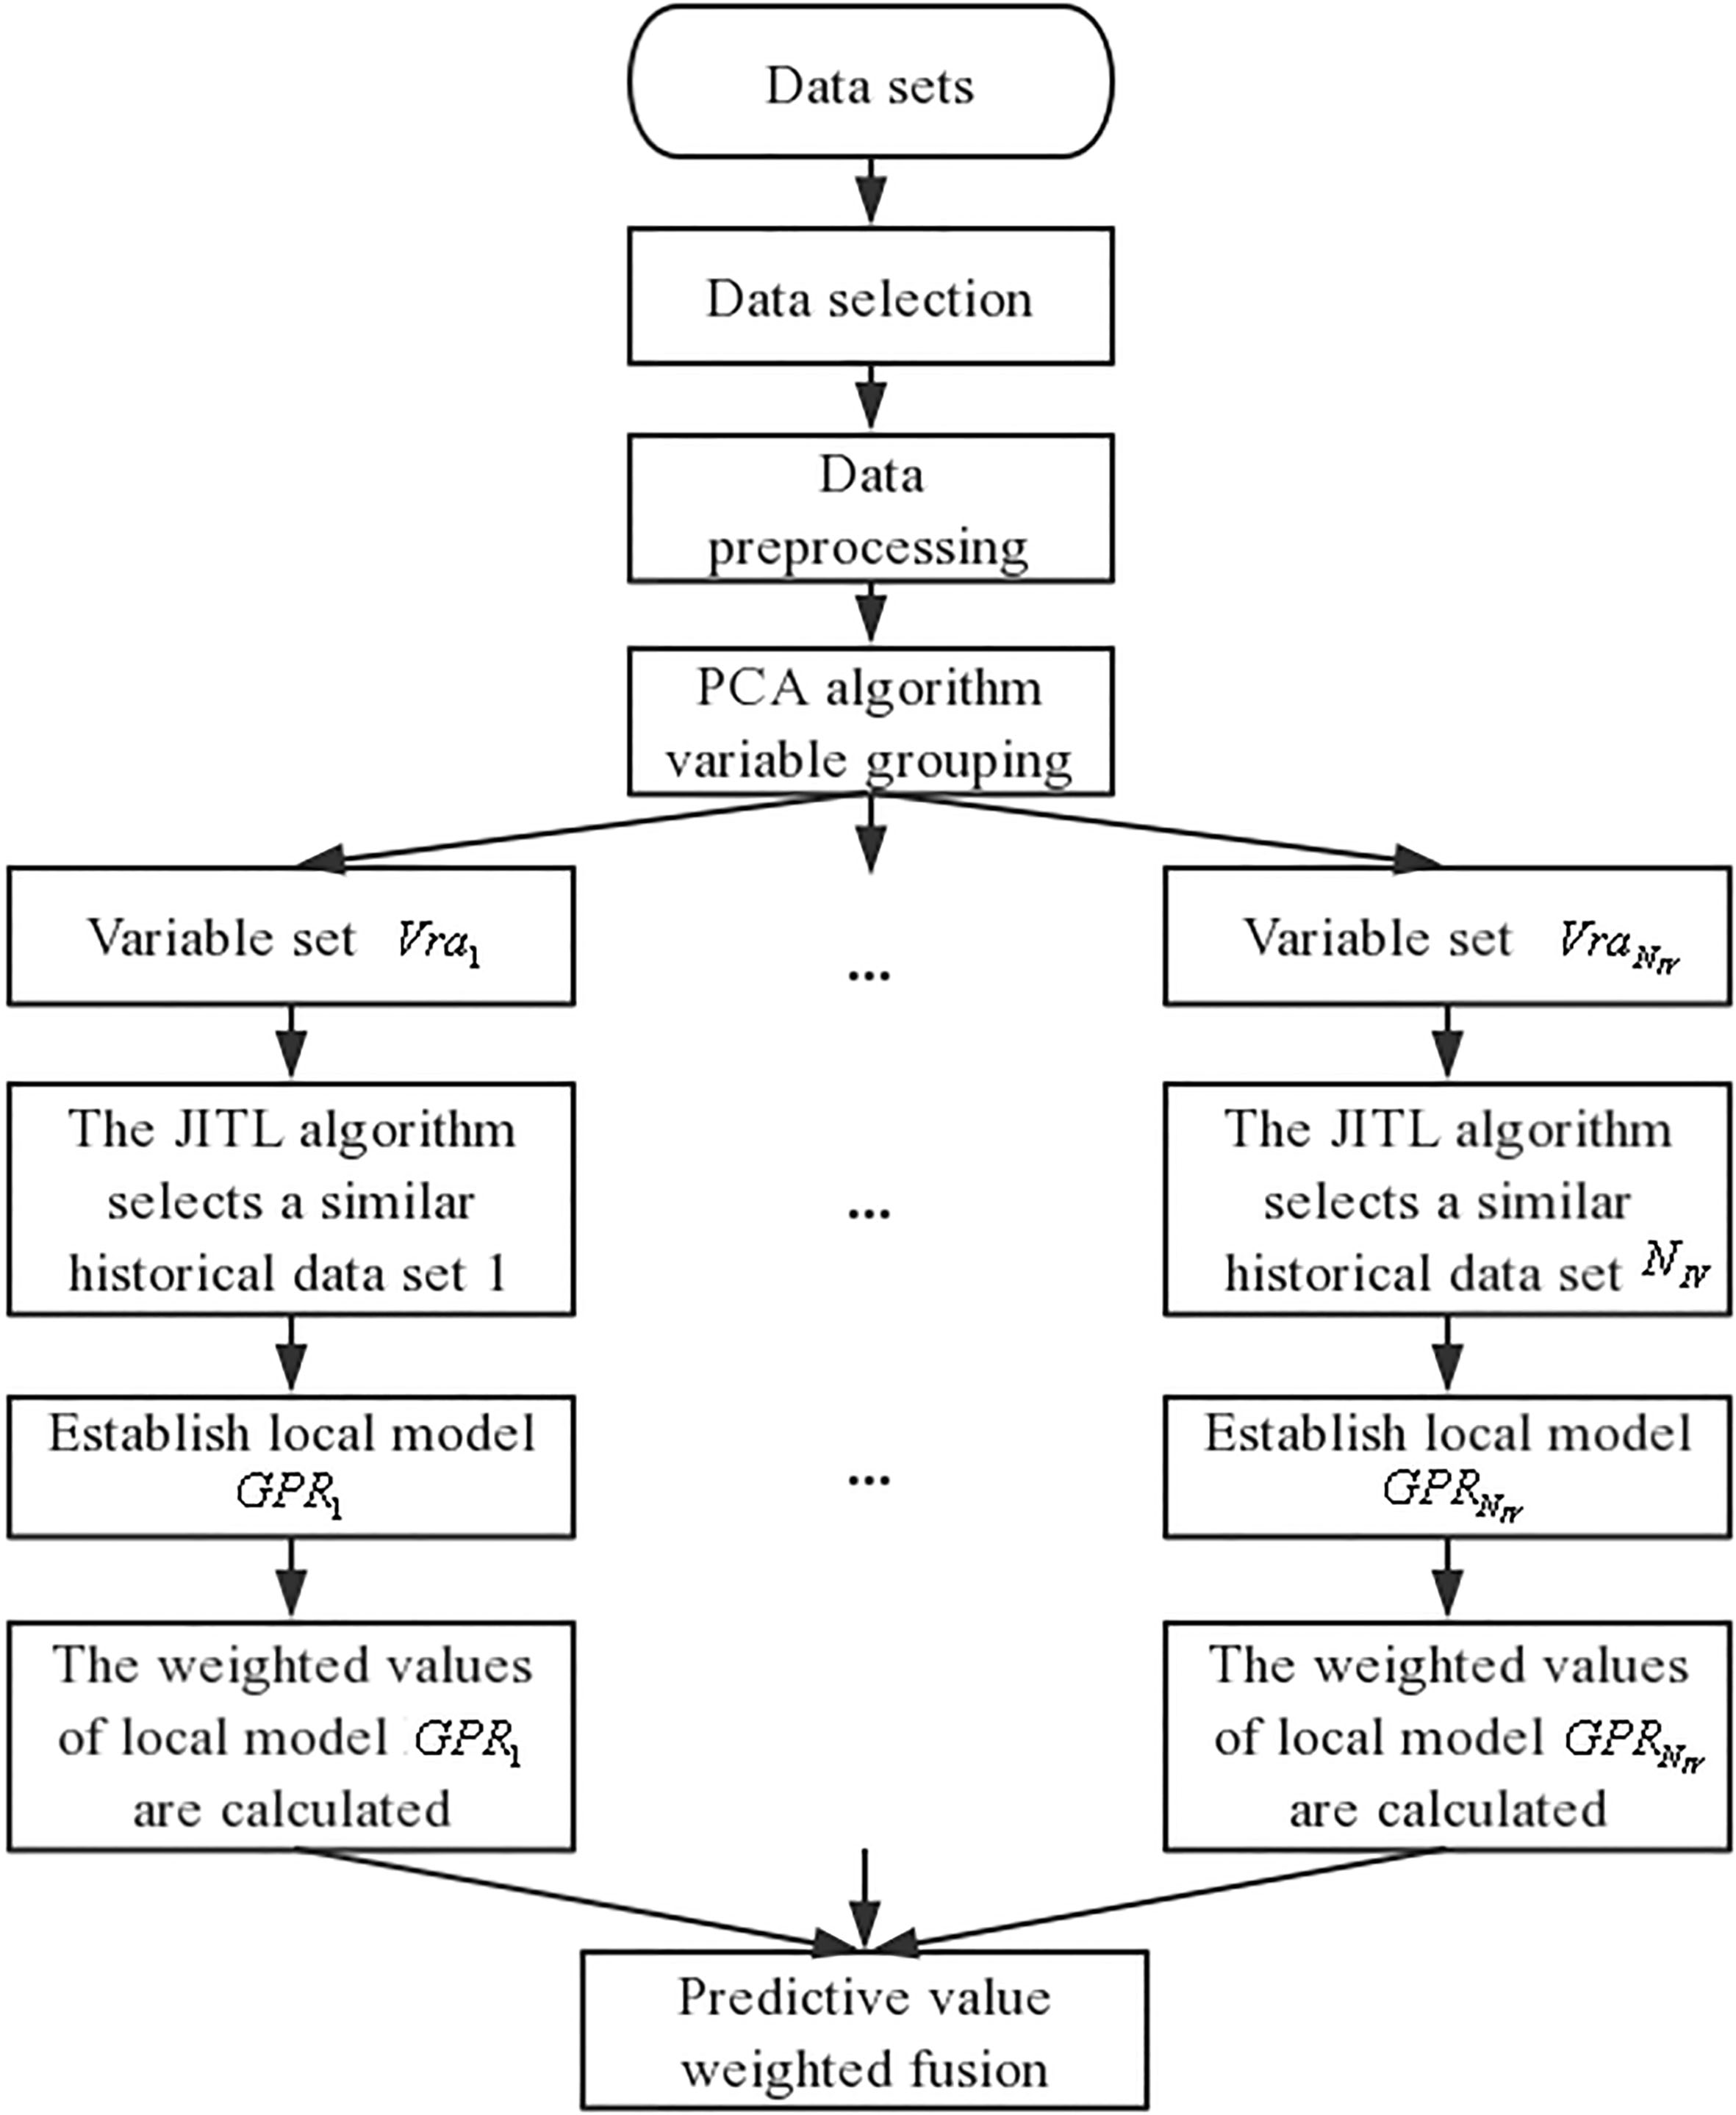
(1) Historical data of the fermentation process of Chlortetracycline are collected and preprocessed.
(2) The PCA algorithm is used to group the input variables, so that multiple input variable groups can be constructed.
(3) When a new test sample arrives, similar historical data is selected for each set of input variables based on the JITL algorithm.
(4) According to the finite mixing mechanism and Bayesian inference formula, the weighted values of each local model are obtained.
(5) The predictive output of the local JITL-GPR model is weighted and integrated to obtain the final predictive value.
(6) When the next sample arrives, return to step (3).
3.Results
3.1Experimental design and modeling data
In this paper, JITL-MWGPR algorithm is used to predict the viscosity of Chlortetracycline fermentation broth. The relationship between fermentation broth viscosity and bacteria infection is analyzed by analyzing the variation trend of fermentation broth viscosity under normal condition and bacteria infected condition. The data used in this paper come from the fermentation process of Chlortetracycline in a biochemical company in China. The off-line assay of the fermentation broth viscosity during the production process is by loading the sampled fermentation broth into a fixed volume of large abdomen pipette. A timer is used to read the time it took for all the fermentation liquid to leave the pipette in seconds, in terms of s. The interval between off-line testing is every six hours. A production site for Pucheng Zhengda Fujian Biochemical Co. Ltd. in China has more than 20 fermentation tanks (including primary and secondary seed tanks). Samples of each fermentation tank need to be analyzed 3–5 parameters. Considering production and labor costs, At present, the factory determines that each fermentation tank is sampled every 6 hours.
Ten process parameters including fermentation time, fermentation temperature, pH value, aseptic air consumption, ammonia water consumption, substrate consumption, carbon dioxide release, blender rate, fermentation liquid volume and substrate feeding rate are selected as auxiliary variables. The viscosity of fermentation broth is selected as the dominant variable. Forty batches of normal fermentation process data are used for model training. In addition, the fermentation process data of 20 batches with both normal batch and infected batch are used for model verification.
3.2Analysis of the results
(1) Predictive performance comparison. In this paper, JITL-MWGPR soft sensor model is compared with GPR soft sensor model and JITL-GPR soft sensor model. Table 1 is the RMSE comparison of the predicted values of fermentation broth viscosity using different soft sensor models in 10 batches under normal fermentation conditions. As can be seen from Table 1, RMSE of GPR soft sensor model is the largest and the prediction effect is the worst. The JITL-MWGPR software sensor model has the smallest RMSE and the best predictive performance.
Table 1
RMSE comparison of normal batch fermentation broth viscosity based on prediction results of different models
Batch number JITL-MWGPR GPR JITL-GPR 1 0.3653 0.4952 0.4231 2 0.3785 0.5387 0.4454 3 0.3340 0.5178 0.3926 4 0.3679 0.4821 0.4364 5 0.3965 0.5235 0.4754 6 0.3467 0.5764 0.4637 7 0.3556 0.5147 0.4823 8 0.3852 0.6086 0.4878 9 0.3578 0.5219 0.4533 10 0.3391 0.5432 0.4675 (2) Analysis of the relationship between the viscosity of fermentation broth and the contamination. In this paper, the JITL-MWGPR soft sensor model was used to predict the fermentation fluid viscosity of Chlortetracycline broth under three different conditions: normal fermentation, phage infection and bacillus infection. The results are shown in Figs 4–6.
Figure 4.
Comparison (and prediction error) of off-line test and prediction values of viscosity of fermentation broth in a normal fermentation batch.
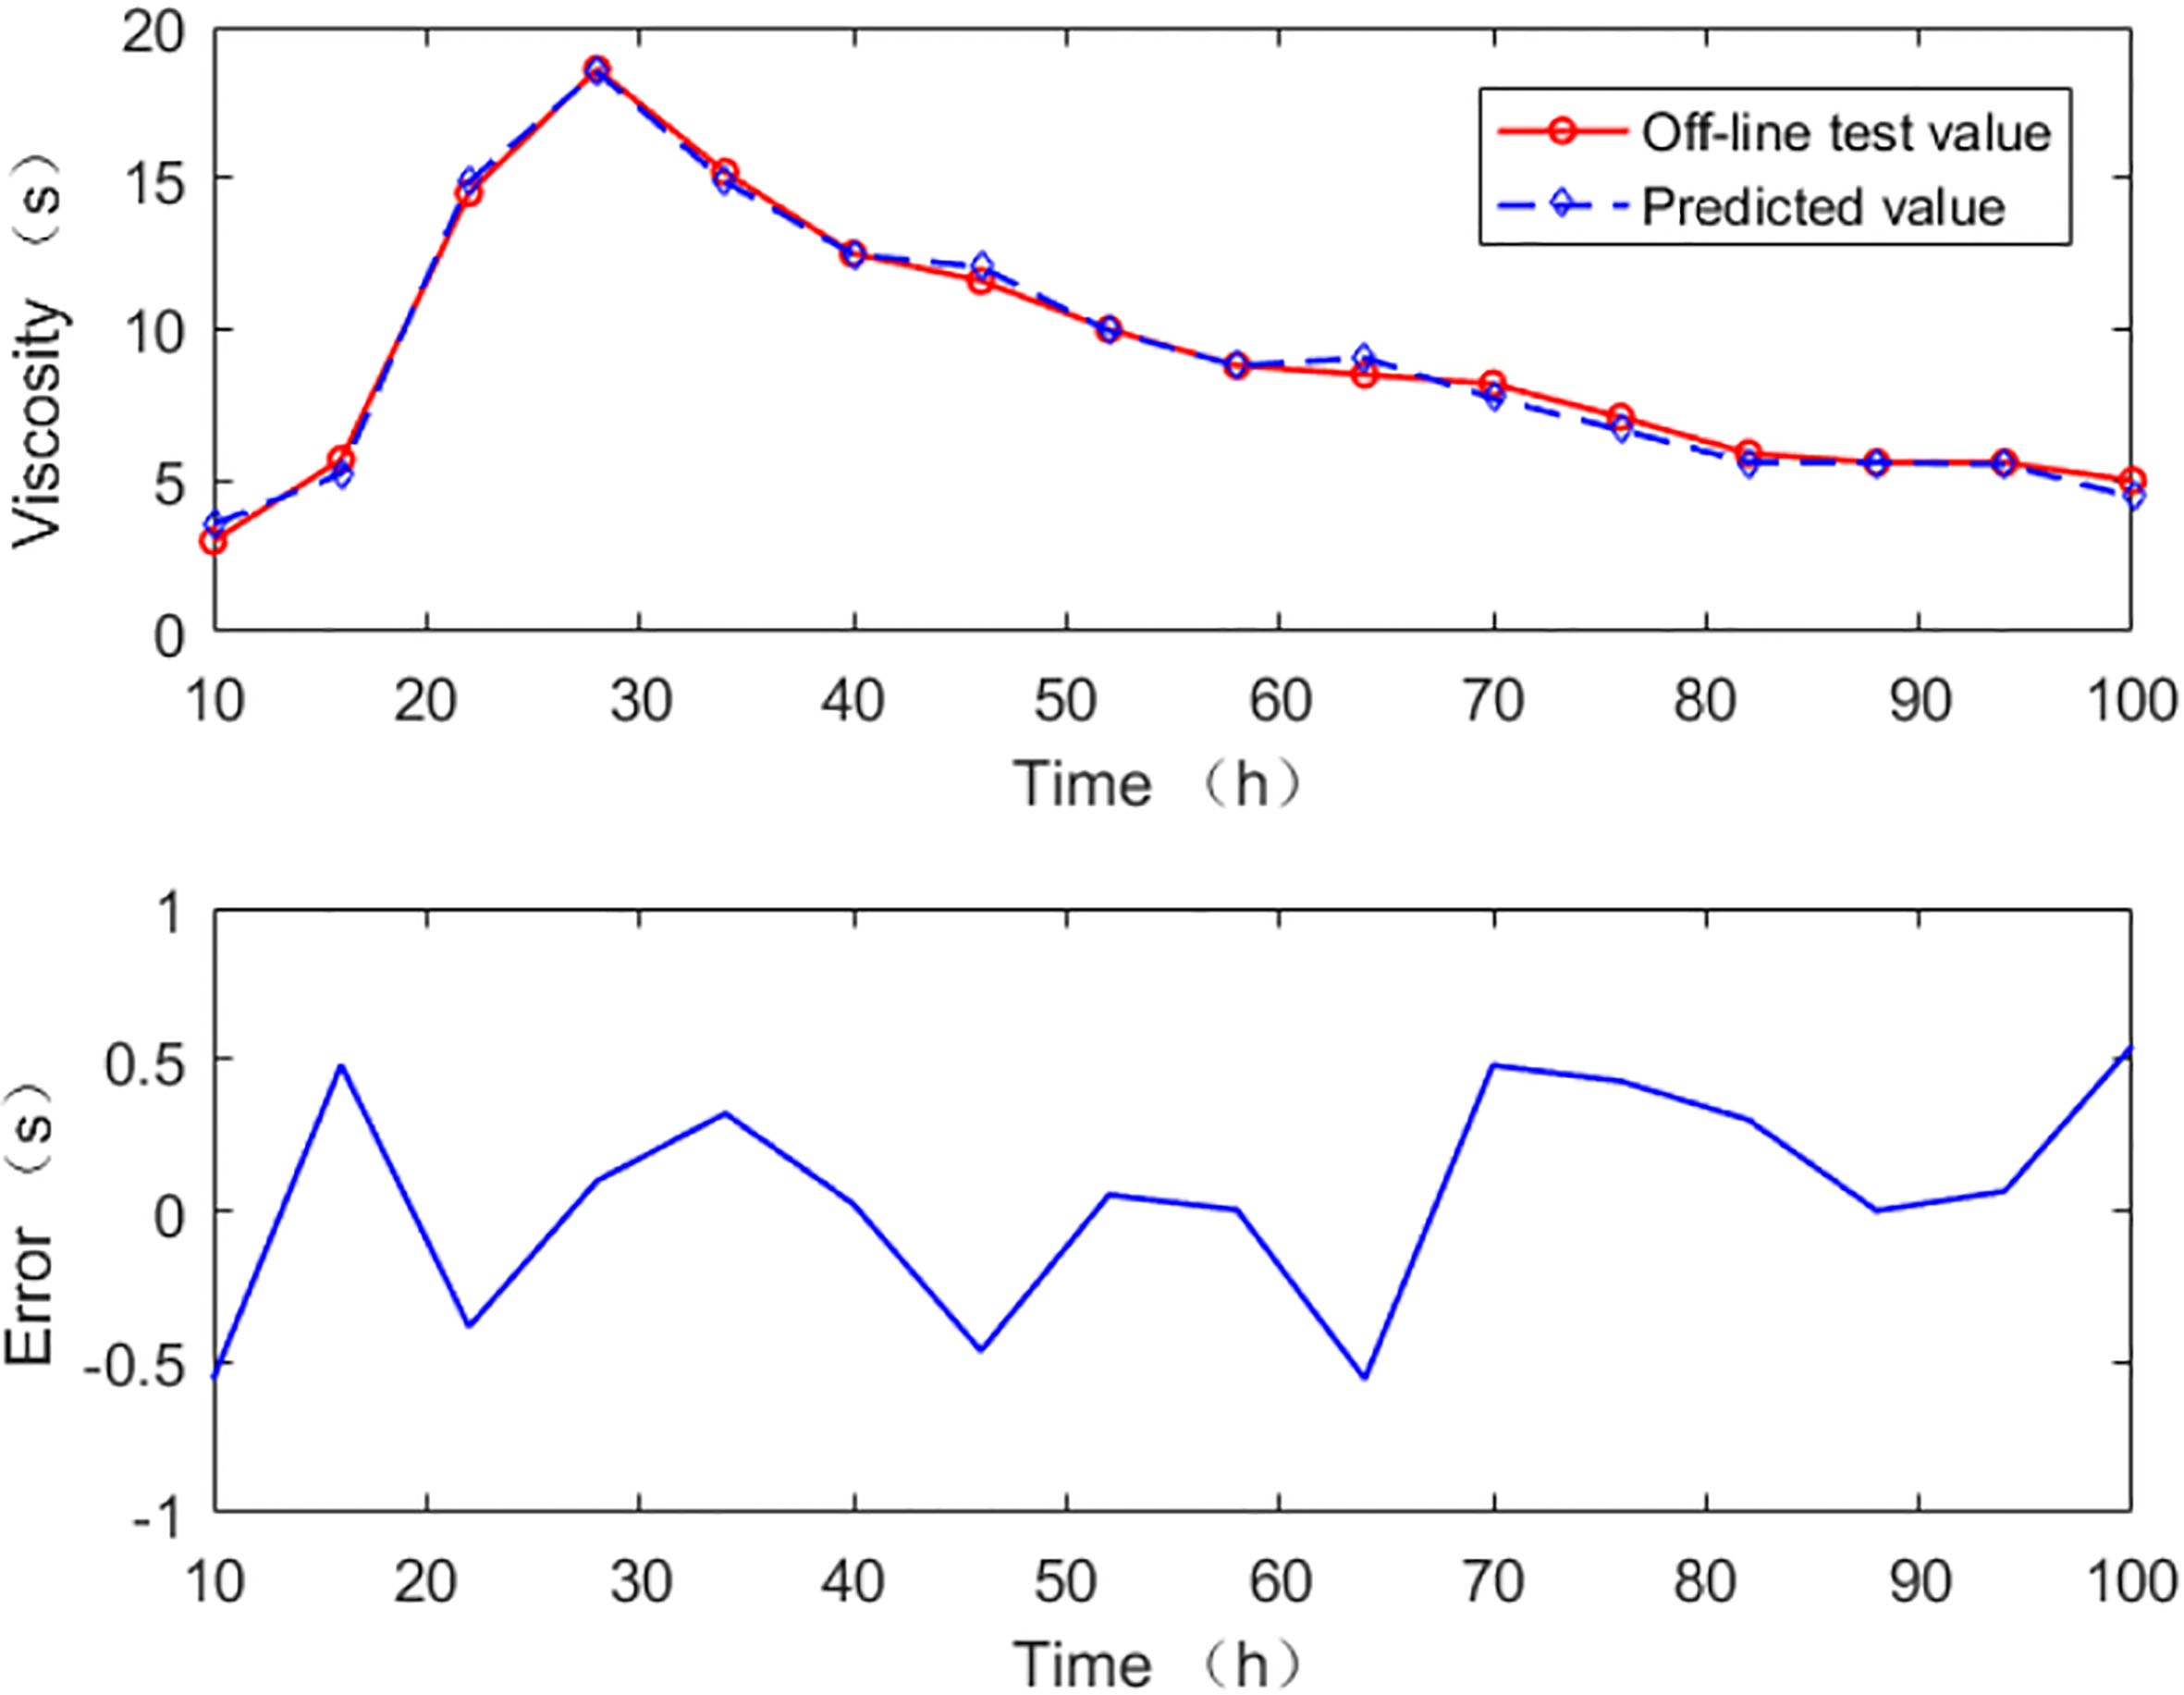
Figure 5.
Comparison (and prediction error) of off-line test and prediction values of viscosity of fermentation broth in a batch of phage infection.
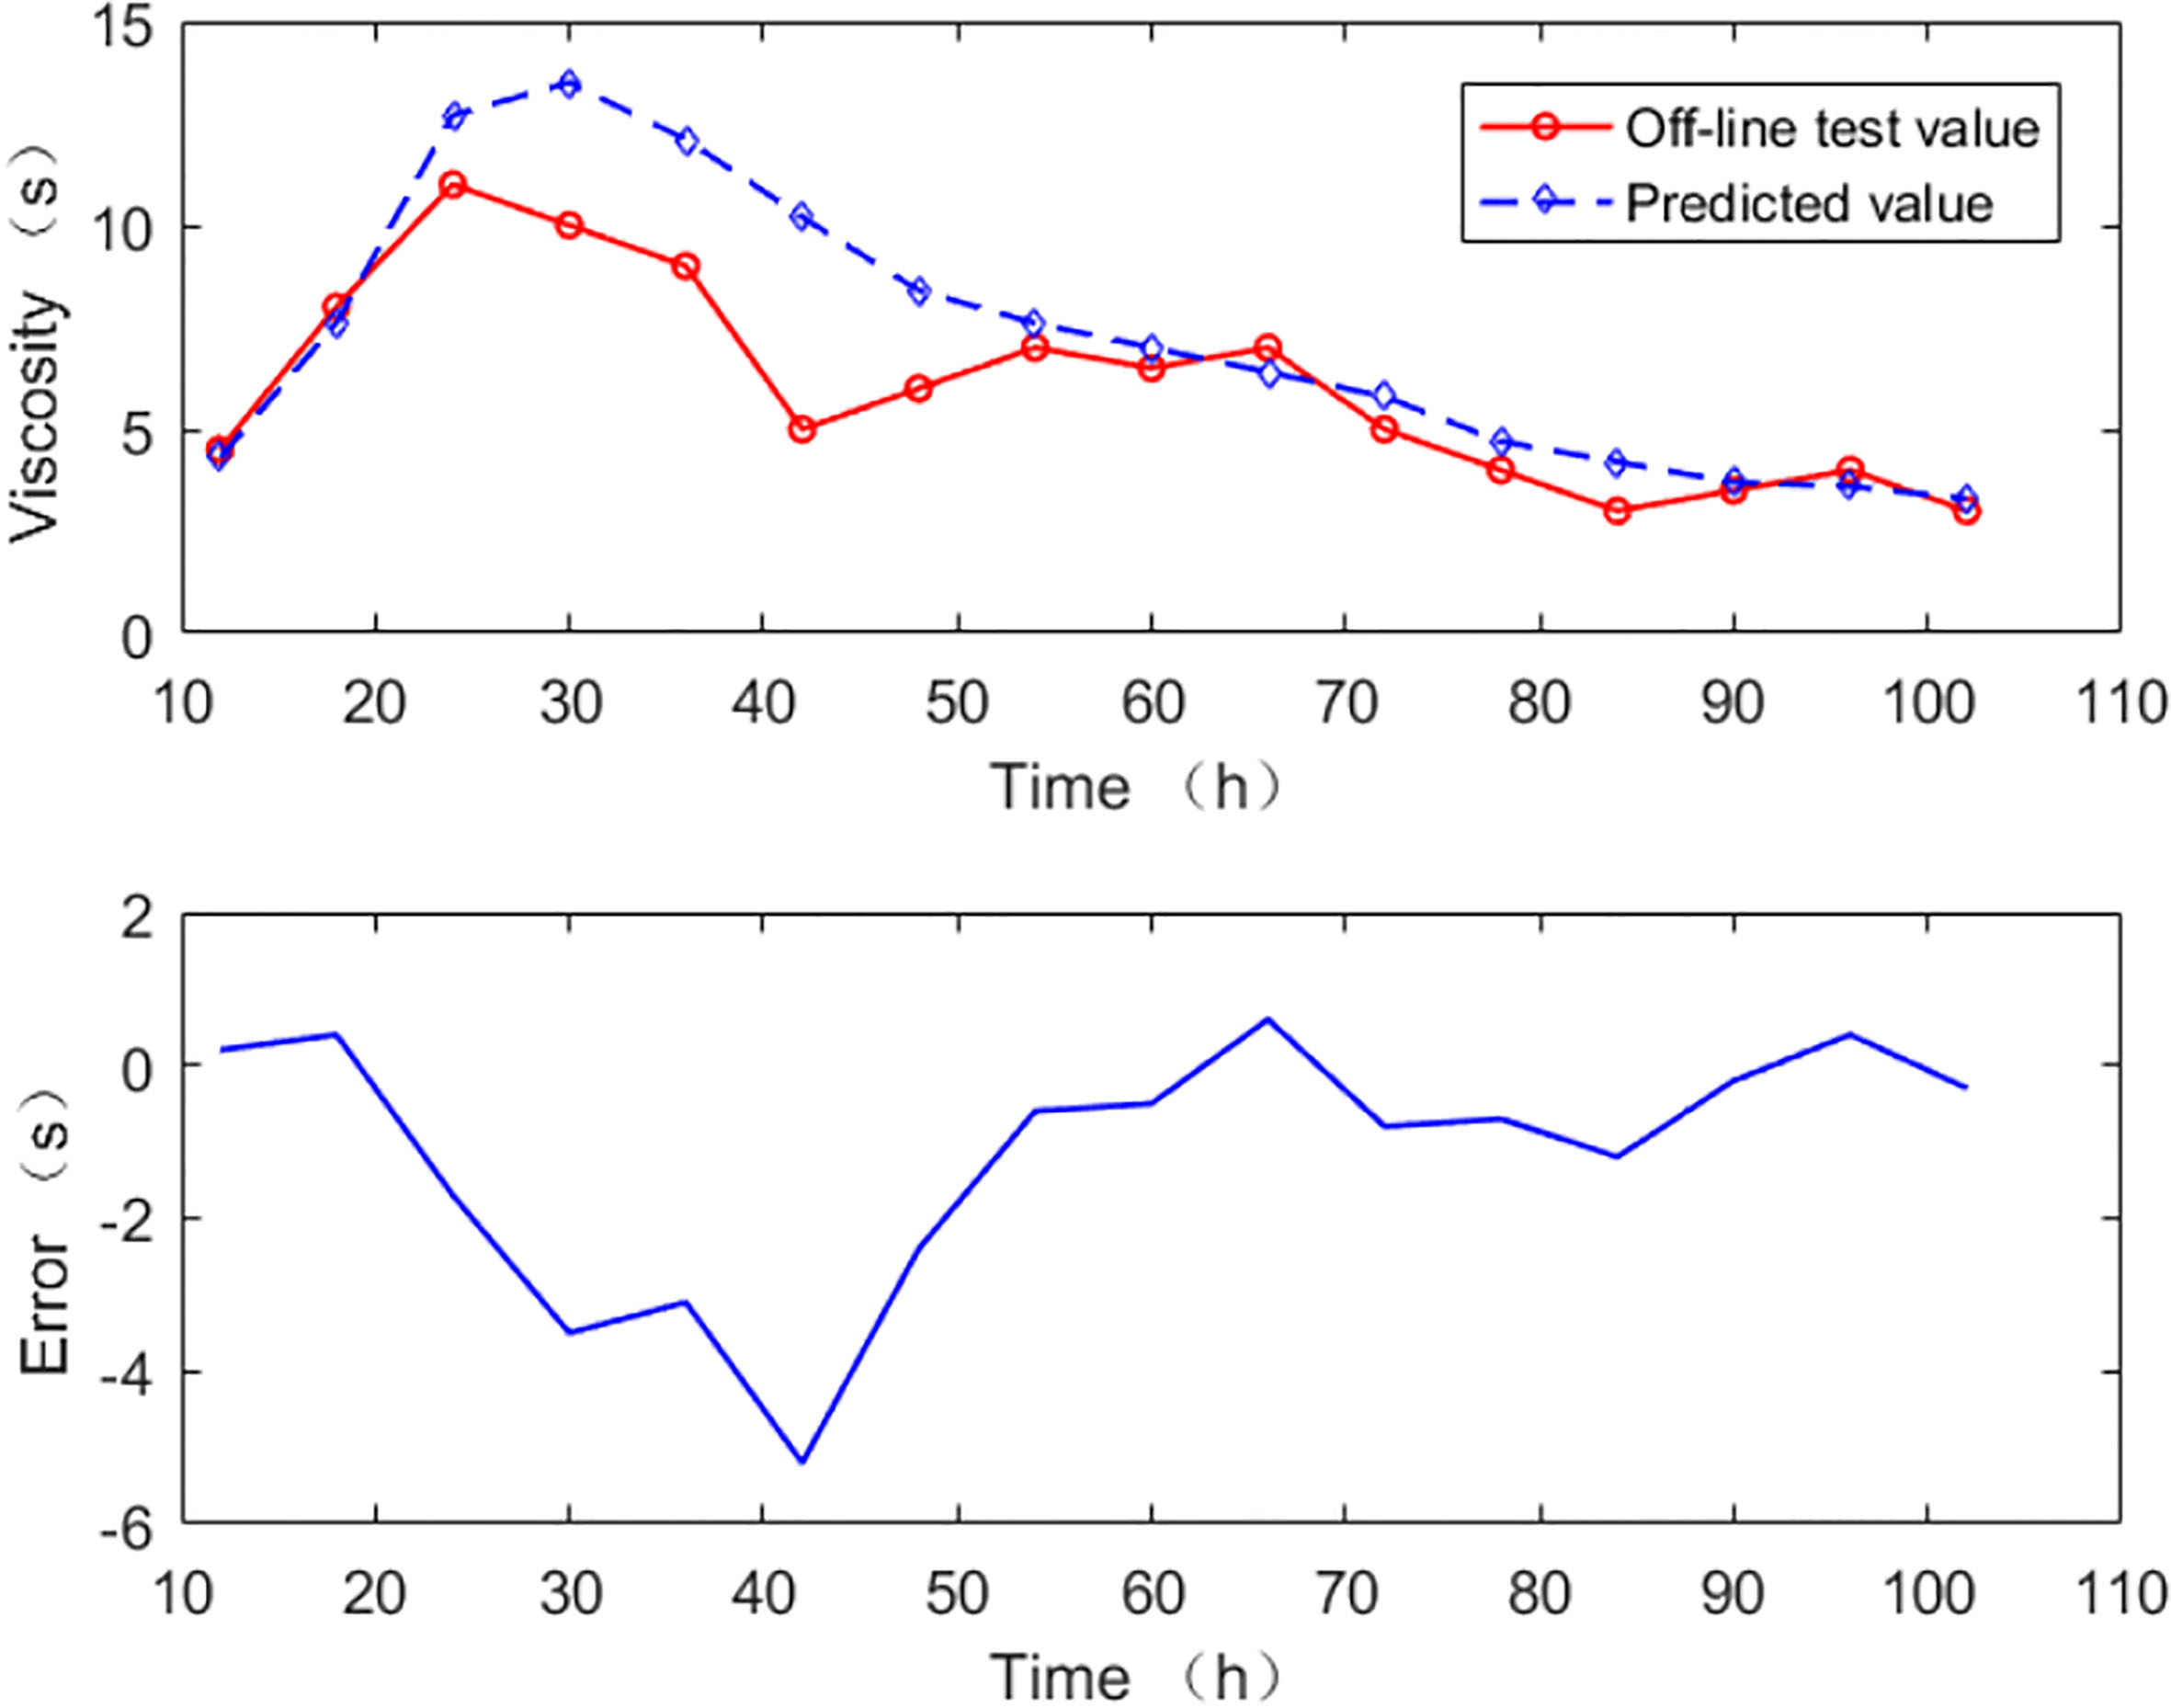
Figure 6.
Comparison (and prediction error) of off-line test and prediction values of viscosity of fermentation broth in a batch of bacillus infection.
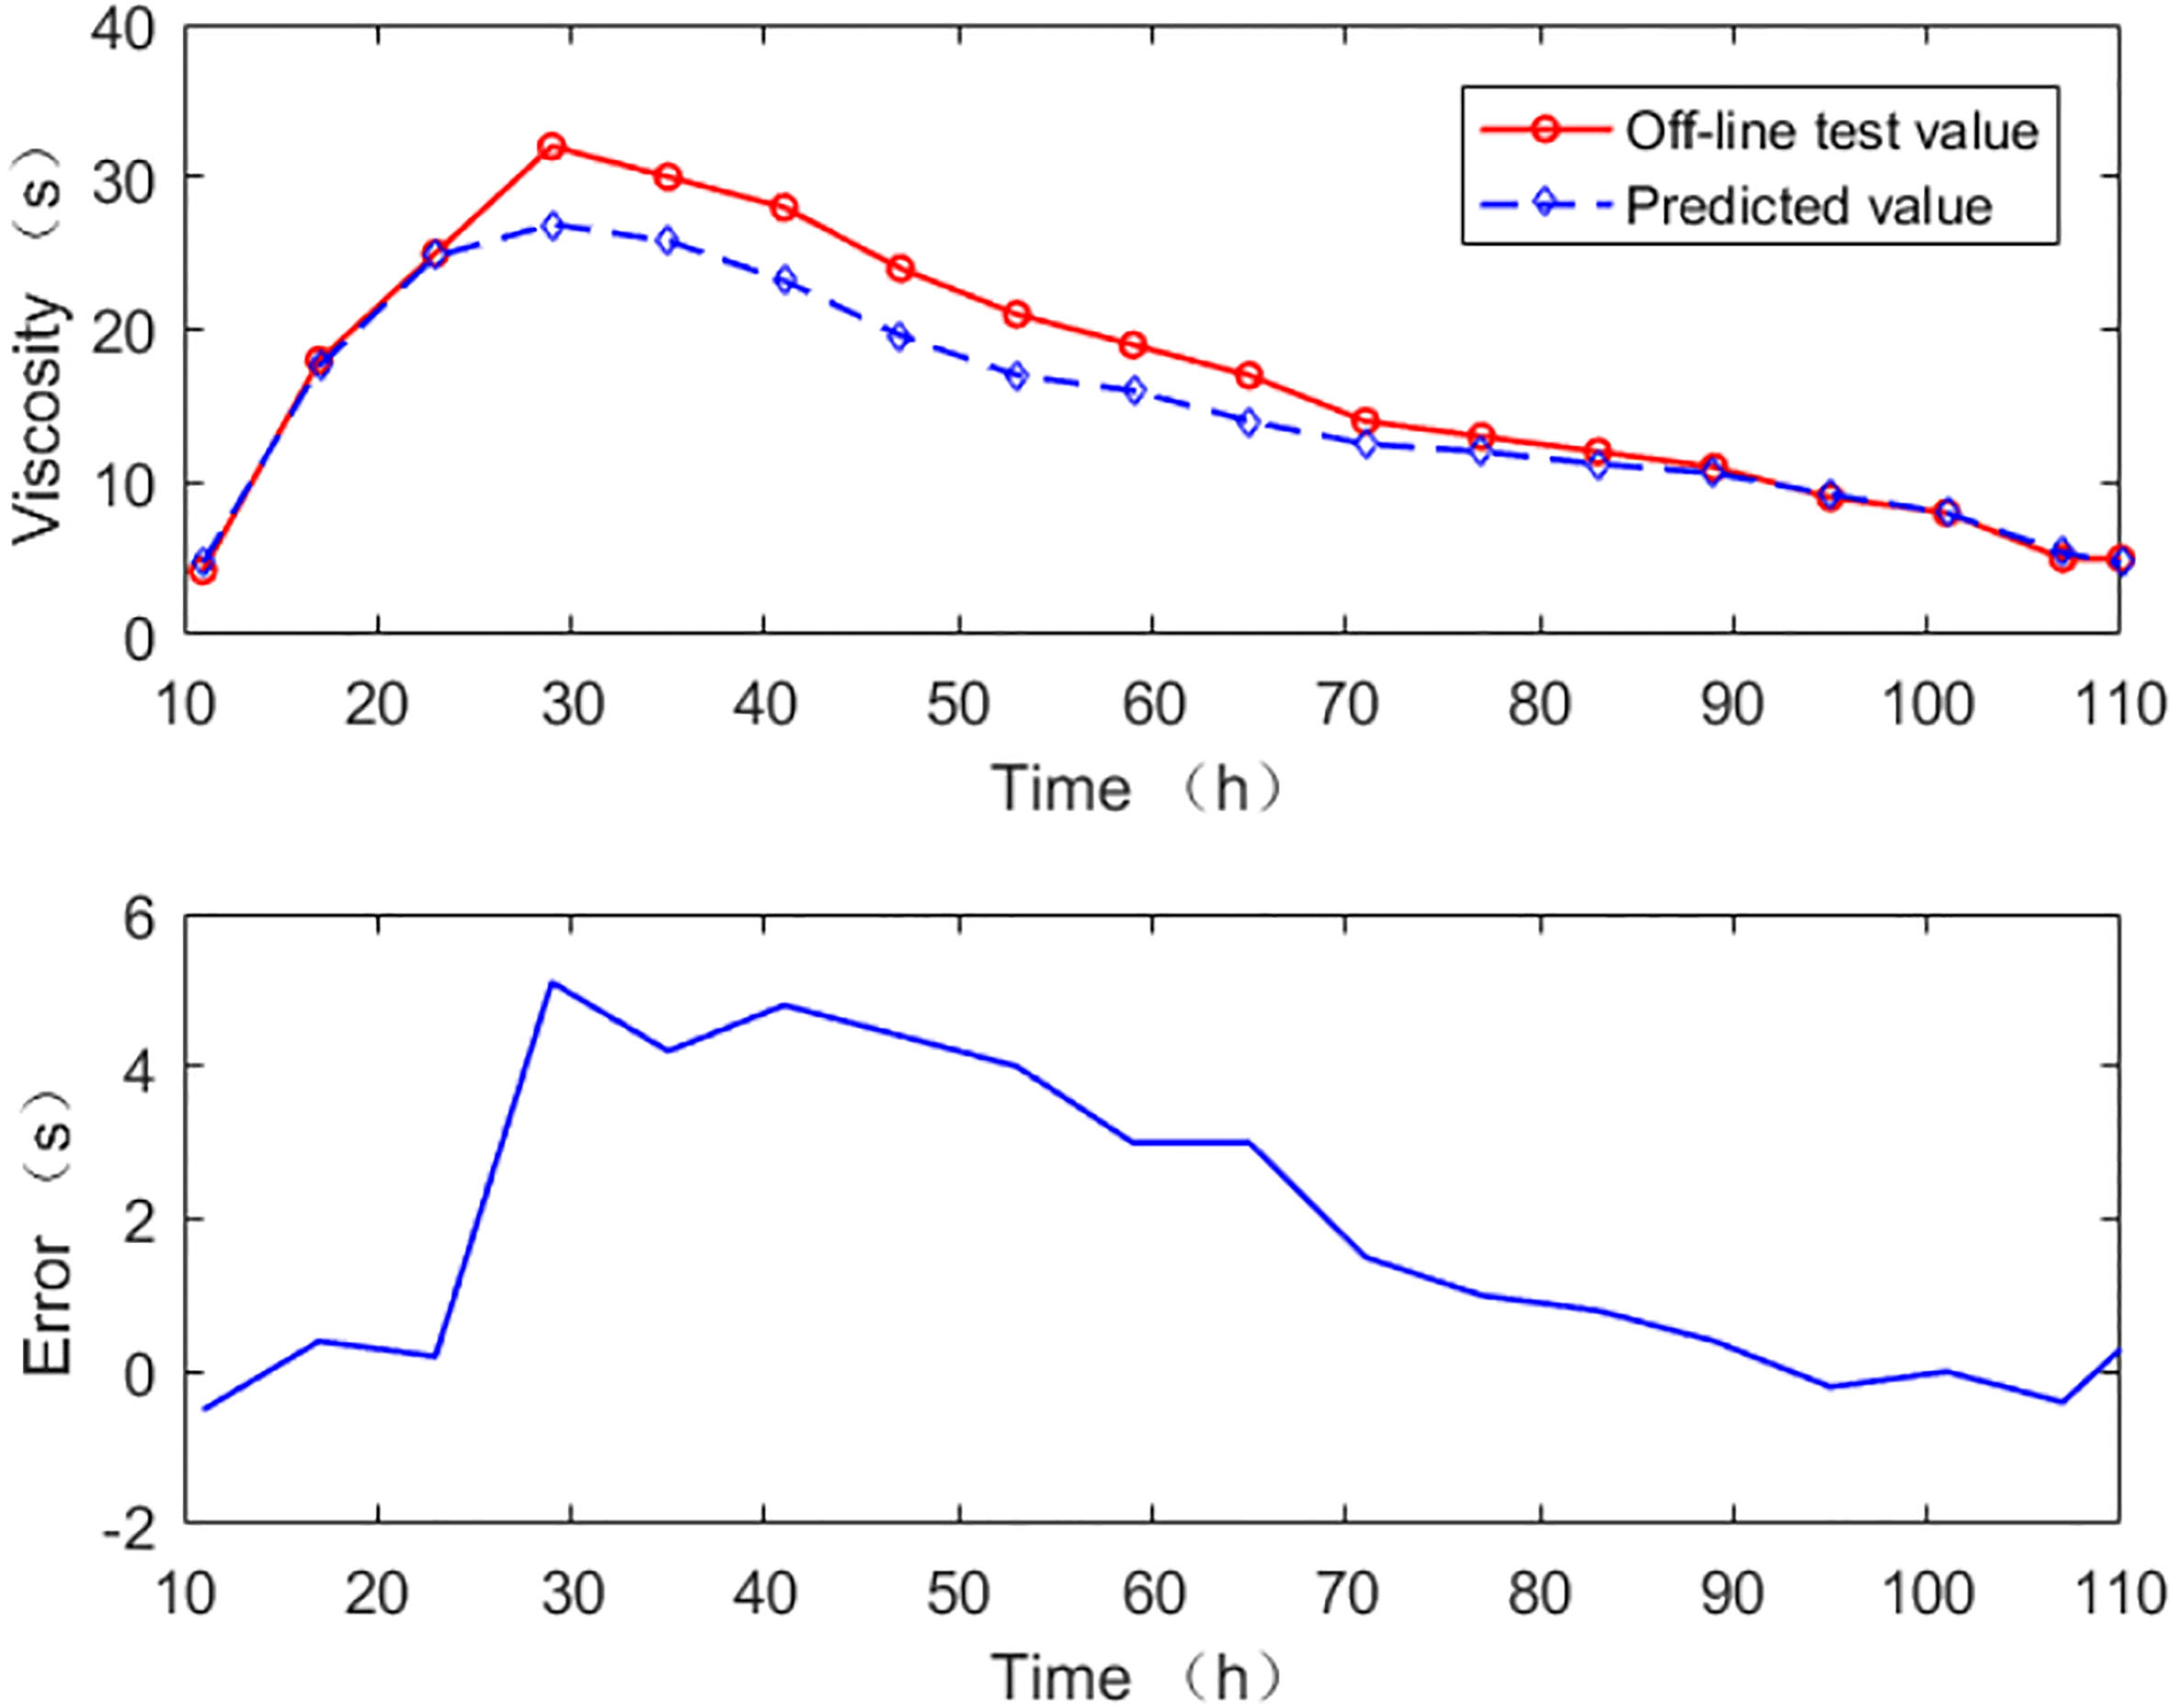
Figure 4 shows the comparison between off-line test values and predicted values of normal batch fermentation broth viscosity. It can be seen from the Fig. 4 that the rapid growth and reproduction of the bacteria in the early fermentation period makes the fermentation liquid viscosity increase rapidly. In the middle and late stage of fermentation, because the metabolism of bacteria consumes nutrients in the matrix and the bacteria themselves gradually decline, the viscosity of fermentation fluid will gradually decrease. Figure 5 shows the off-line testing value of phage infection batch fermentation broth viscosity compared with the predicted value. When infected with a phage, the offline testing value is smaller than predicted value. The results showed that the invasion of phage accelerated the autolysis and division of some beneficial bacteria, thus reducing the viscosity of fermentation broth. Figure 6 shows the comparison between off-line test values and predicted values of the viscosity of fermentation broth in batch of bacillus infection. After infection with bacteria, the growth and reproduction of the bacillus allowed offline testing valued to be greater than predicted values.
In summary, after the fermentation process of Chlortetracycline is infected with phage, bacillus and other miscellaneous bacteria, the fermentation broth will affect the growth, reproduction and metabolism of beneficial bacteria, and the fermentation broth viscosity will also change with it. Figures 4–6 illustrate three different states in normal, phage and bacillus infections. In this paper, the predictive value of the soft sensor model is compared with the off-line test value, from which we can make an effective judgment on whether the fermentation process is contaminated or not.
4.Conclusion
In this paper, a JIT learning multiple model weighted Gaussian process regression soft sensor modeling method is proposed (Abbreviated JITL – MWGPR). It was applied to the prediction of the viscosity of fermentation broth during the fermentation of Chlortetracycline. This method combines the advantages of integrated learning and instant learning. First, the PCA degradation method was used to rapidly construct multiple sets of input variables, and the pointwise mutual information (PMI) relationship between input and output variables is added into the covariance function of the PCA method. It is more convenient to construct the set of input variables closely related to output variables. Then, based on each set of input variables, the corresponding similar samples of each test sample are selected. Then a real-time GPR model is established based on each group of similar samples. Finally, the weighted value of each local model is calculated by Bayesian theory and finite mixture mechanism. The integrated prediction results are obtained by weighted fusion of the output values of each local model.
In order to improve the prediction performance of the soft sensor model, the real-time update of the model is realized by the JIT method. The weighted value of each local JIT-GPR model is updated in real time through Bayesian inference and finite mixture mechanism. JIT-MWGPR was applied to the correlation analysis of fermentation broth viscosity and bacteria contamination during the fermentation of Chlortetracycline. The predicted and measured values of fermentation broth viscosity in normal fermentation batch, phage infection batch and bacillus infection batch were compared. The comparison results are also analyzed. The experimental results demonstrate that the JIT-MWGPR soft sensor model can make an effective judgment on whether Chlortetracycline is contaminated by bacteria during fermentation process by predicting the viscosity of fermentation liquid. Several points in this paper are explained as follows:
(1) The relationship between viscosity of fermentation broth and bacteria contamination is first proposed, and a soft sensor model is established for the signs of bacterial contamination based on the relationship during Chlortetracycline fermentation. Because there are several stages in the fermentation process, the viscosity of fermentation broth is different. The viscosity of fermentation broth is a parameter that is difficult to measure online.
(2) The research object and data source of the authors are not from simulation, nor from the laboratory, but from the production site. Therefore, the research content in this paper is different from the relevant articles published at present.
Acknowledgments
This work is financially supported by the Yantai “Double Hundred Plan” Talent Project in 2018, and the Natural Science Foundation (No. ZR2016FM28) of Shandong Province in 2016. We also thank the Charoen Pokphand Group for their financial support and for providing the industrial datasets offed-batch CTC fermentation process.
Conflict of interest
None to report.
References
[1] | Yang H, Zhao Y, Lai L, et al. Optimization of fermentation medium for chlortetracycline production by response surface methodology. Journal of Shenyang Pharmaceutical University, (2013) , 30: (6): 464-469. (Chinese) |
[2] | Chen L. Study on the fermentation process technology of chlortetracycline. Strait Pharmaceutical Journal, (2010) , 22: (6): 23-25. (Chinese) |
[3] | Wang P-F. Study on the Breeding and Fermentation Process Optimization of CTC-Production Strains. Inner Mongolia University, (2013) . (Chinese) |
[4] | Kadlec P, Gabrys B, Strandt S. Data-driven soft sensors in the process industry. Computers & Chemical Engineering, (2009) , 33: (4): 795-814. |
[5] | Camu N, González A, De WT, et al. Influence of turning and environmental contamination on the dynamics of populations of lactic acid and acetic acid bacteria involved in spontaneous cocoa bean heap fermentation in Ghana. Applied & Environmental Microbiology, (2008) , 74: (1): 86-98. |
[6] | Gao H, Zheng Z, Li J, et al. Discussion on fermentation form of chlortetracycline. Modern Chemical Research, 2018: (1): 159-160. (Chinese) |
[7] | Fu Z, Jia L. Complex model for batch process based on just in-time learning. Journal of Shanghai Jiaotong University, (2016) , 50: (6): 937-942,948. (Chinese) |
[8] | Mei C, Yang M, Liu G. A multi-model based soft sensor using evidence theory and Gaussian process regression. CIESC (The Chemical Industry and Engineering Society of China) Journal, (2015) , 66: (11): 4555-4564. (Chinese) |
[9] | Zhang W, Xiong W, Xu B. Multi-model combination modeling based on just-in-time learning using Gaussian process regression. Information and Control, (2015) , 44: (4): 487-492. (Chinese) |
[10] | Huaiping J. Research and Application of Data-driven Modeling Methods for Adaptive Soft Sensor Development. Beijing: Beijing Institute of Technology, (2016) . (Chinese) |
[11] | Fujiwara K, Kano M, Hasebe S, et al. Soft-sensor development using correlation-based just-in-time modeling. Aiche Journal, (2009) , 55: (7): 1754-1765. |
[12] | Cheng C, Chiu MS. A new data-based methodology for nonlinear process modeling. Chemical Engineering Science, (2004) , 59: (13): 2801-2810. |


