
Estimation and clinical verification of the effective and skin doses for pediatric and adult patients undergoing the cardiac interventional examination using five PMMA phantoms and TLD/ionization chamber technique
Abstract
BACKGROUND:
Effective and skin doses gain much attention since the cardiac catheterization laboratory (CCL) is a place where both patients and medical staff are exposed to X-ray or fluoroscopy environment and gain a cumulative dose during the cardiac interventional procedure.
OBJECTIVE:
These doses for pediatric and adult patients undergone cardiac interventional examination using five PMMA phantoms and thermoluminescence dosimeter (TLD)/ionization chamber technique were estimated in this work with the further clinical verification.
METHODS:
Five PMMA phantoms (10, 30, 50, 70, and 90 kg) were customized to represent baby, child, adult female, adult male, and overweight adult (by Asian complexion standards), respectively, in accordance with the ICRU-48 report. Each phantom could be disassembled into 31 plates to insert TLD chips for measuring X-ray exposed dose or assisted with an auxiliary plate to insert high-sensitivity ionization chamber for surveying low-energy fluoroscopy dose.
RESULTS:
The data acquired from five phantoms were integrated into four semi-empirical formulas, in order to fit the binary quadratic form “Dose
CONCLUSIONS:
The model refinement with DAP share adjustment is envisaged.
1.Introduction
Effective and skin doses of X-ray and fluoroscopy obtained by patients after the cardiac interventional examination were assessed in this work using five PMMA phantoms and thermoluminescence dosimeter (TLD)/ionization chamber technique with the further clinical verification. These doses gain much attention since the cardiac catheterization laboratory (CCL) is a place where both patients and medical staff are exposed to X-ray or fluoroscopy environment and gain a cumulative dose during the cardiac interventional procedure. The medical staff can be efficiently protected by lead aprons around the X-ray facility and protective clothing for personnel [1], whereas patients are mandatorily exposed to X-ray or fluoroscopy during the interventional examination. Several researchers have addressed this issue and applied different techniques for evaluating the cumulative doses obtained by patients of different age, weight, and size. In particular, McFadden et al. [2] established the reference level, Wu et al. [3] evaluated the exposed dose for the pediatric interventional cardiology, while Ector et al. [4] focused on the possible underestimation of accumulated doses in case of obesity/overweight patients. Chida et al. [5] addressed a surrogate measurement of the total amount of X-ray energy delivered to a patient via the dose area product (DAP) expressed in Gy
In contrast to X-ray, the fluoroscopy as frequently adopted in the cardiac interventional procedure draws less attention due to its comparatively low energy. However, the long-time exposure still creates a measurable amount of cumulative dose for patients. Thus, Chida et al. [5], Mettler et al. [7] and Koenig et al. [8] revealed the radiation injuries from fluoroscopy. Therefore, the aim of this study is to accomplish a comprehensive survey of the dose obtained from either X-ray or fluoroscopy by patients of various age and weight (from babies to overweight adult patients) via five respective PMMA phantoms and TLD/ionization chamber technique. The five phantoms are customized to simulate pediatric and adult patients of 10, 30, 50, 70, and 90 kg, respectively, according to the ICRU-48 report [9], whereas the TLD/ionization chamber was also used as a robust technique for converting the medium/low ionization energy into the exposure dose of personnel. Further, the empirical data were integrated altogether by STATISTICA developed by StatSoft, Inc. [10] to fit four semi-empirical formulas, which were defined as a binary quadratic equation to represent the effective or skin doses from X-ray or fluoroscopy by various DAP (dose area product) of facility and BMI (body mass index) of patients. The theoretical estimation of patients’ skin doses was verified by the clinical examination of 30 patients who underwent the cardiac interventional examination from May 2016 to September 2017. The discrepancies between theoretical results and clinical data and the reliability of obtained unique binary quadratic equation are discussed in detail.
2.Materials and methods
2.1Effective dose
ICRP committees have been quantifying personal radiation dose for several decades. According to the ICRP-60 report published in 1990, the protection quantity for personal dosimetry is termed the effective dose,
(1)
where
(2)
Here
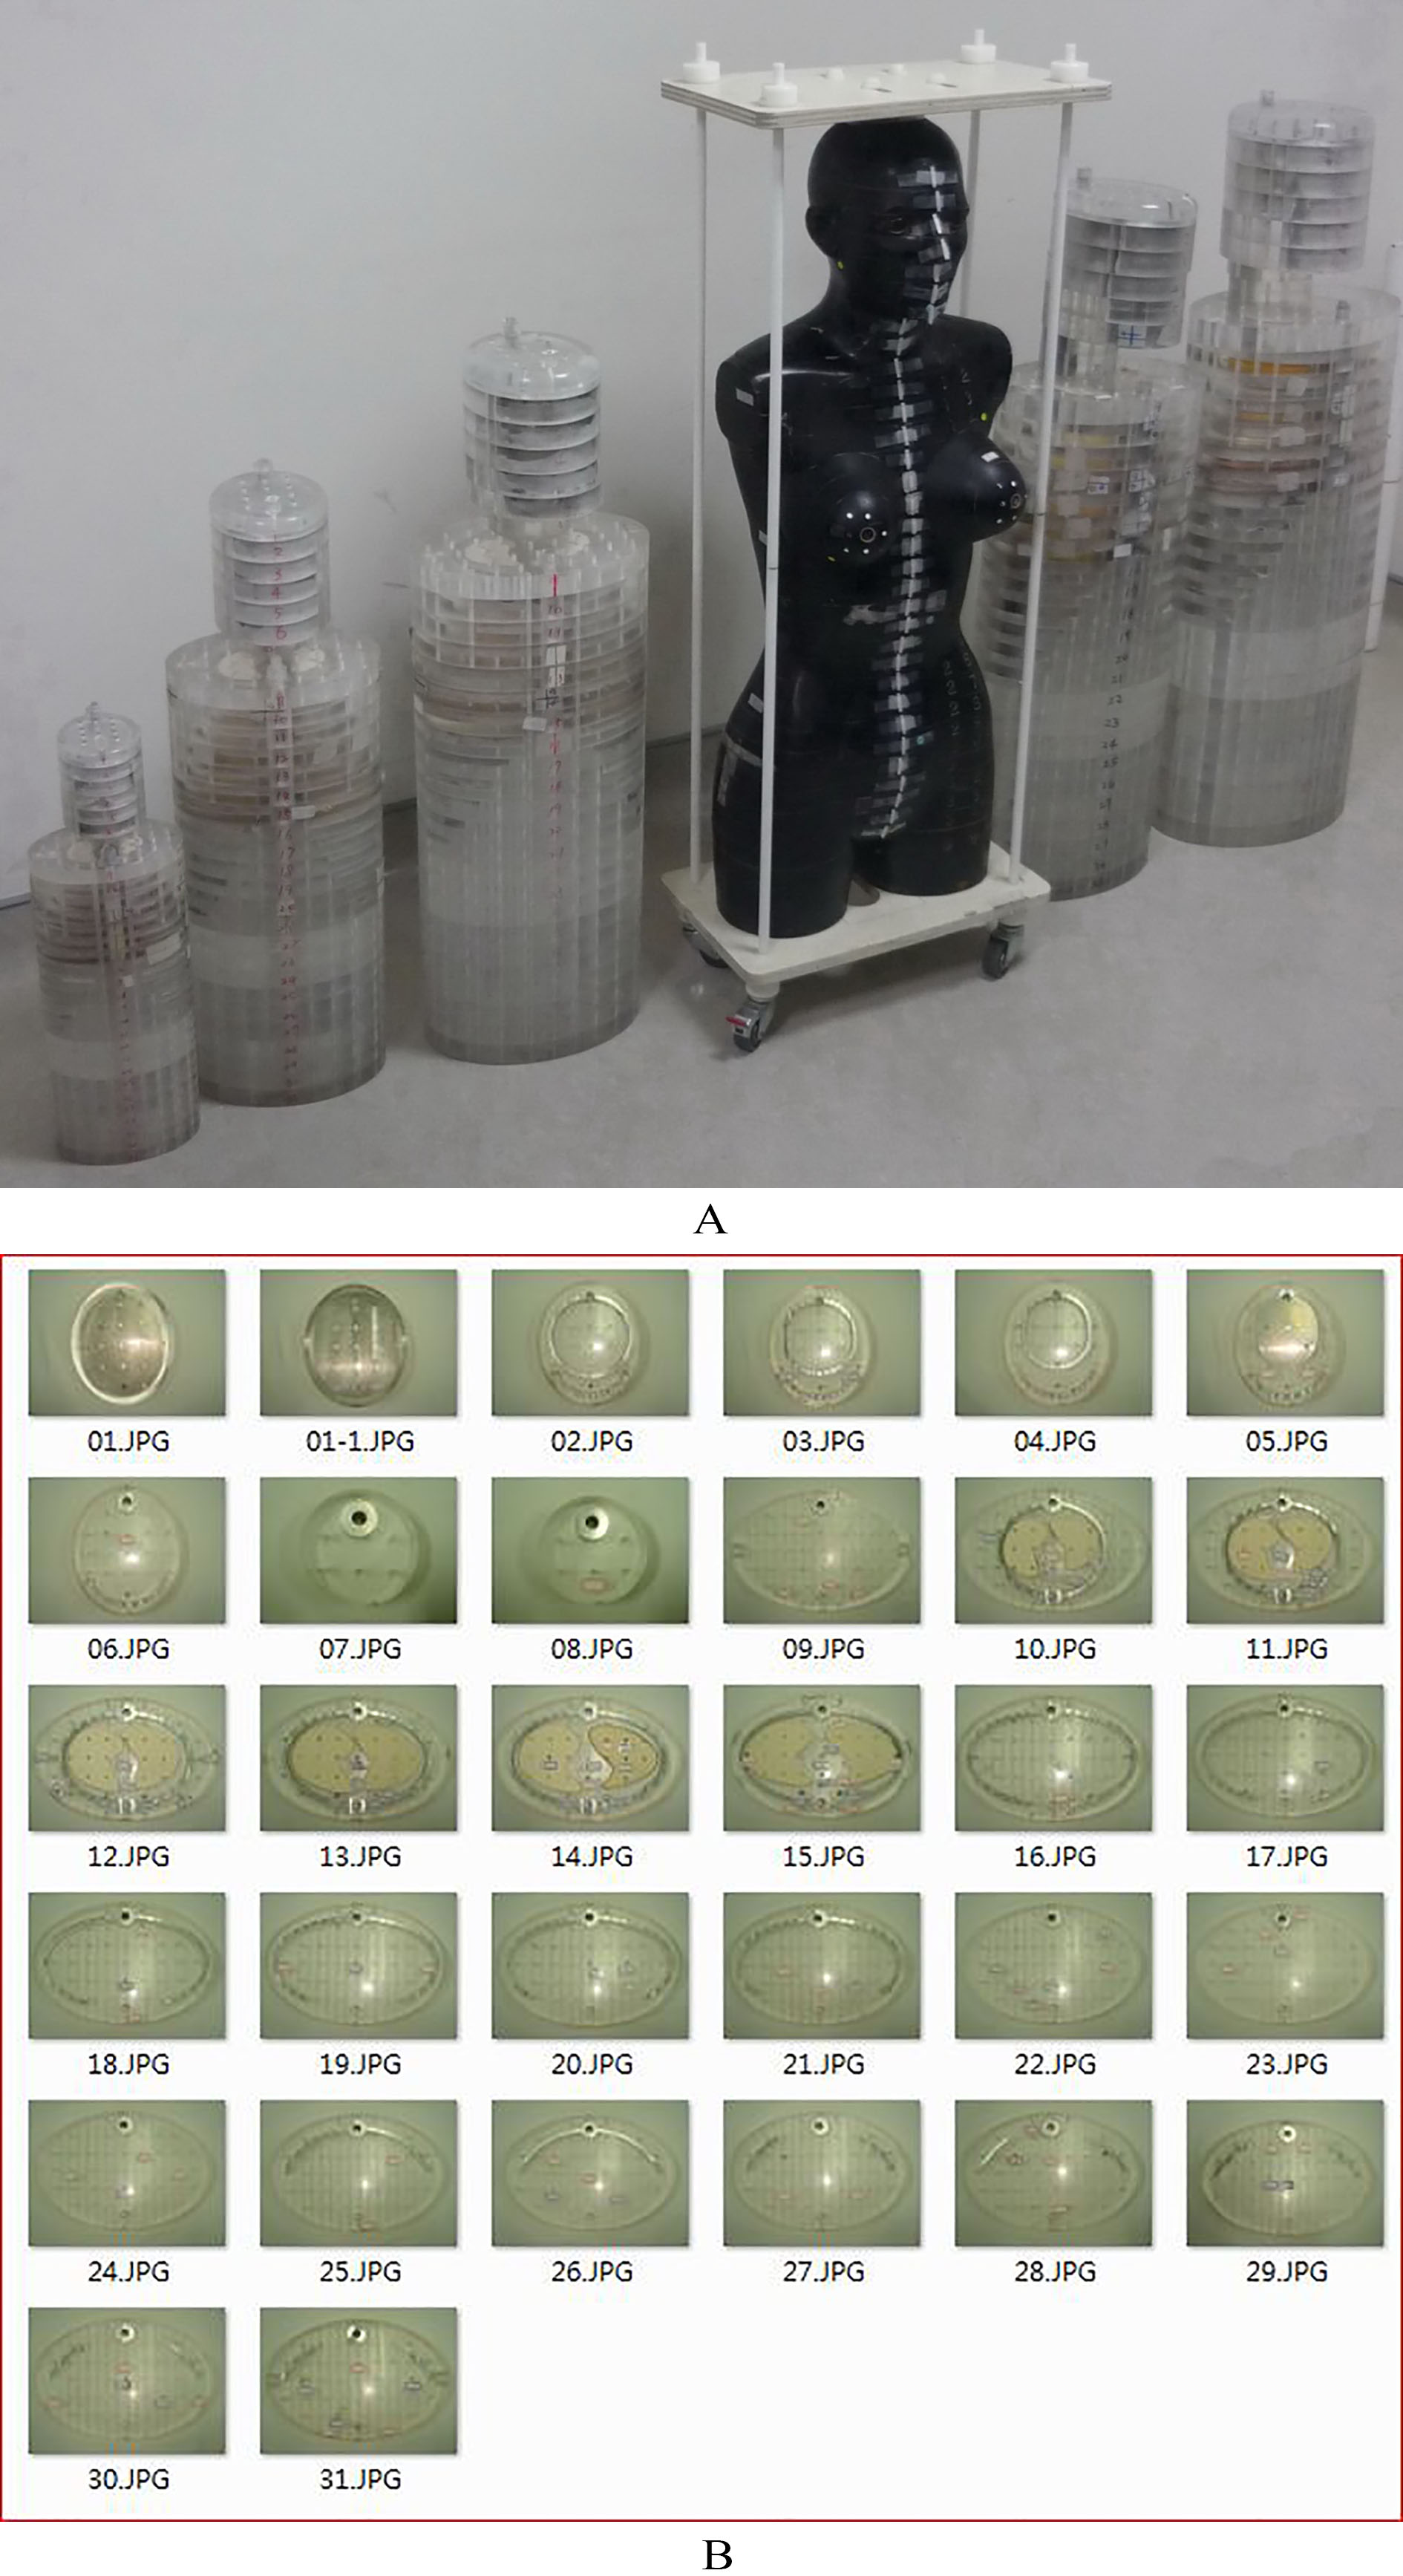
Figure 1.
(A) Five PMMA phantoms were put side by side with Rando phantom to demonstrate the relative geometrical size, (B) each phantom was assembled from 31 plates of various sizes and numbered sequentially from top to bottom as follows: Nos. 1–6 corresponded to head, 7–8 to neck, 9–21 to chest and abdomen, and 22–31 to pelvis.
2.2Five PMMA phantoms
Five PMMA phantoms (10, 30, 50, 70, and 90 kg, respectively) were customized to represent a baby, child, adult female, adult male, and overweight adult (obesity case), in accordance with ICRU-48 report, as shown in Fig. 1 [9]. Each heterogeneous phantom was assembled from 31 acrylic (PMMA) plates. In addition, the skull, ribs, spine, and pelvis were made of pure aluminum, while the lung was made of high-density polyethylene foamed cotton. Several through holes were drilled into each plate, then 3–5 TLD chips were inserted in these through holes for the dose survey, while acrylic plugs were used to fill empty ones. As shown in Fig. 1A, five PMMA phantoms were put side by side with Rando phantom to demonstrate the relative geometrical size, (B) each phantom was assembled from 31 plates of various sizes and numbered sequentially from top to bottom as follows: Nos. 1–6 corresponded to head, 7–8 to neck, 9–21 to chest and abdomen, and 22–31 to pelvis. The dimensions of five phantoms were designed according to the physical dimensions of linearity, i.e., weight
2.3TLD/ionization chamber setup
One hundred five standard TLD-100 chips consisting of Lithium Fluoride (LiF: Mg, Ti; 3.2
An additional high-sensitivity pencil-type ionization chamber (Victoreen, model 6000–100, 3.2 cc) was preset for measuring the fluoroscopy, since TLD had comparatively low detecting efficiency for fluoroscopy. In doing so, an auxiliary PMMA plate was specially made with 3–5 through tunnels. The pencil-type ionization chamber could be inserted into any tunnel to survey the dose, whereas acrylic sticks of the same size were inserted into the remaining 2–4 through tunnels to maintain the plate integrity, yet, the auxiliary plate could be inserted into any layer to replace the original one of the phantom. The pencil-type ionization chamber had a high sensitivity to measure the low-energy fluoroscopy and maintain the dose-response linearity, its only drawback being the inconvenience of its application and larger time required for the dose measurement. The pencil-type ionization chamber could record a single fluoroscopy dose at a time to obtain a single dose position inside the phantom. In contrast, 105 TLDs could be fully inserted into the phantom and then exposed only once to acquire the full empirical data for a single specific task.
Table 1
The tests on X-ray or fluoroscopy of phantoms were verified using real patients undergone the cardiac interventional examination. Here 10- and 30-kg phantoms corresponded to baby or child, respectively, from the pediatric viewpoint. Similarly, 50-, 70-, and 90-kg phantoms were used to simulate the adult female, male, and overweight adult, respectively
| Pediatric | Adult | ||||
| Phantom | 10 kg | 30 kg | 50 kg | 70 kg | 90 kg |
| X-ray | |||||
| kVp | 61 | 63 | 66 | 67 | 70 |
| mA | 135 | 267 | 375 | 430 | 577 |
| Fluoroscopy | |||||
| kVp | 60 | 65 | 68 | 68 | 75 |
| mA | 3.0 | 5.7 | 8.3 | 8.3 | 12.4 |
The phantom was assembled with TLD chips or pencil-type ionization chamber inside, then exposed to the bi-plane X-ray facility that was specifically designed for the cardiac interventional examination (Philips Integris Allura 9 Biplane system) located at the Cardiac Catheterization Laboratory, Taichung Veteran General Hospital, Taiwan (CCL, TVGH). The X-ray and fluoroscopy settings for each phantom were then applied to real patients that underwent the cardiac interventional examination as listed in Table 1. Here 10- and 30-kg phantoms corresponded to baby or child, respectively, from the pediatric viewpoint. Similarly, 50-, 70-, and 90-kg phantoms were used to simulate the adult female, male, and overweight adult, respectively. The recorded DAP could be manipulated by changing the exposure time. Table 2 implies the precise arrangement of well-packed TLDs inside the phantom for X-ray exposure. Each TLD pack had three chips sealed in a PE bag, which were then inserted into specific through holes for the exposure. Also, the tissue weighting factor (cf. Eq. (1),
Table 2
Implies the precise arrangement of well-packed TLDs inside the phantom for X-ray exposure. Each TLD pack had three chips sealed in a PE bag, which were then inserted into specific through holes for the exposure. Also, the tissue weighting factor (cf. Eq. (1),
| Organ or tissue | ICRP-60 | Phantom plate no. | No. of TLD pack | Precise position |
|---|---|---|---|---|
| Thyroid | 0.05 | 8 | 2 | |
| Esophagus | 0.05 | 9 | 2 | |
| Breast | 0.05 | 15 | 2 | Left side |
| 15 | 2 | Right side | ||
| Lung | 0.12 | 11 | 2 | Left side |
| 14 | 2 | Right side | ||
| Heart | 0.05 | 10 | 2 | Left atrium |
| 11 | 2 | Right atrium | ||
| 14 | 2 | Right ventricle | ||
| 15 | 2 | Left ventricle | ||
| Liver | 0.05 | 21 | 2 | |
| Stomach | 0.12 | 20 | 2 | |
| Bone surface | 0.01 | 9 | 1 | Clavicle |
| 9 | 1 | Thoracic vertebra | ||
| 11 | 1 | |||
| 15 | 1 | |||
| 18 | 1 | |||
| 11 | 1 | Left side | ||
| 17 | 1 | Right side | ||
| 16 | 1 | Sternum | ||
| Skin | 0.01 | 11 | 1 | X-ray focal spot on patient’s back |
| 12 | 1 | |||
| 13 | 1 | |||
| Colon | 0.12 | 24 | N/A | |
| Bladder | 0.05 | 28 | N/A | |
| Gonads | 0.20 | 31 | N/A | |
| Sum | 1.00 | 35 |
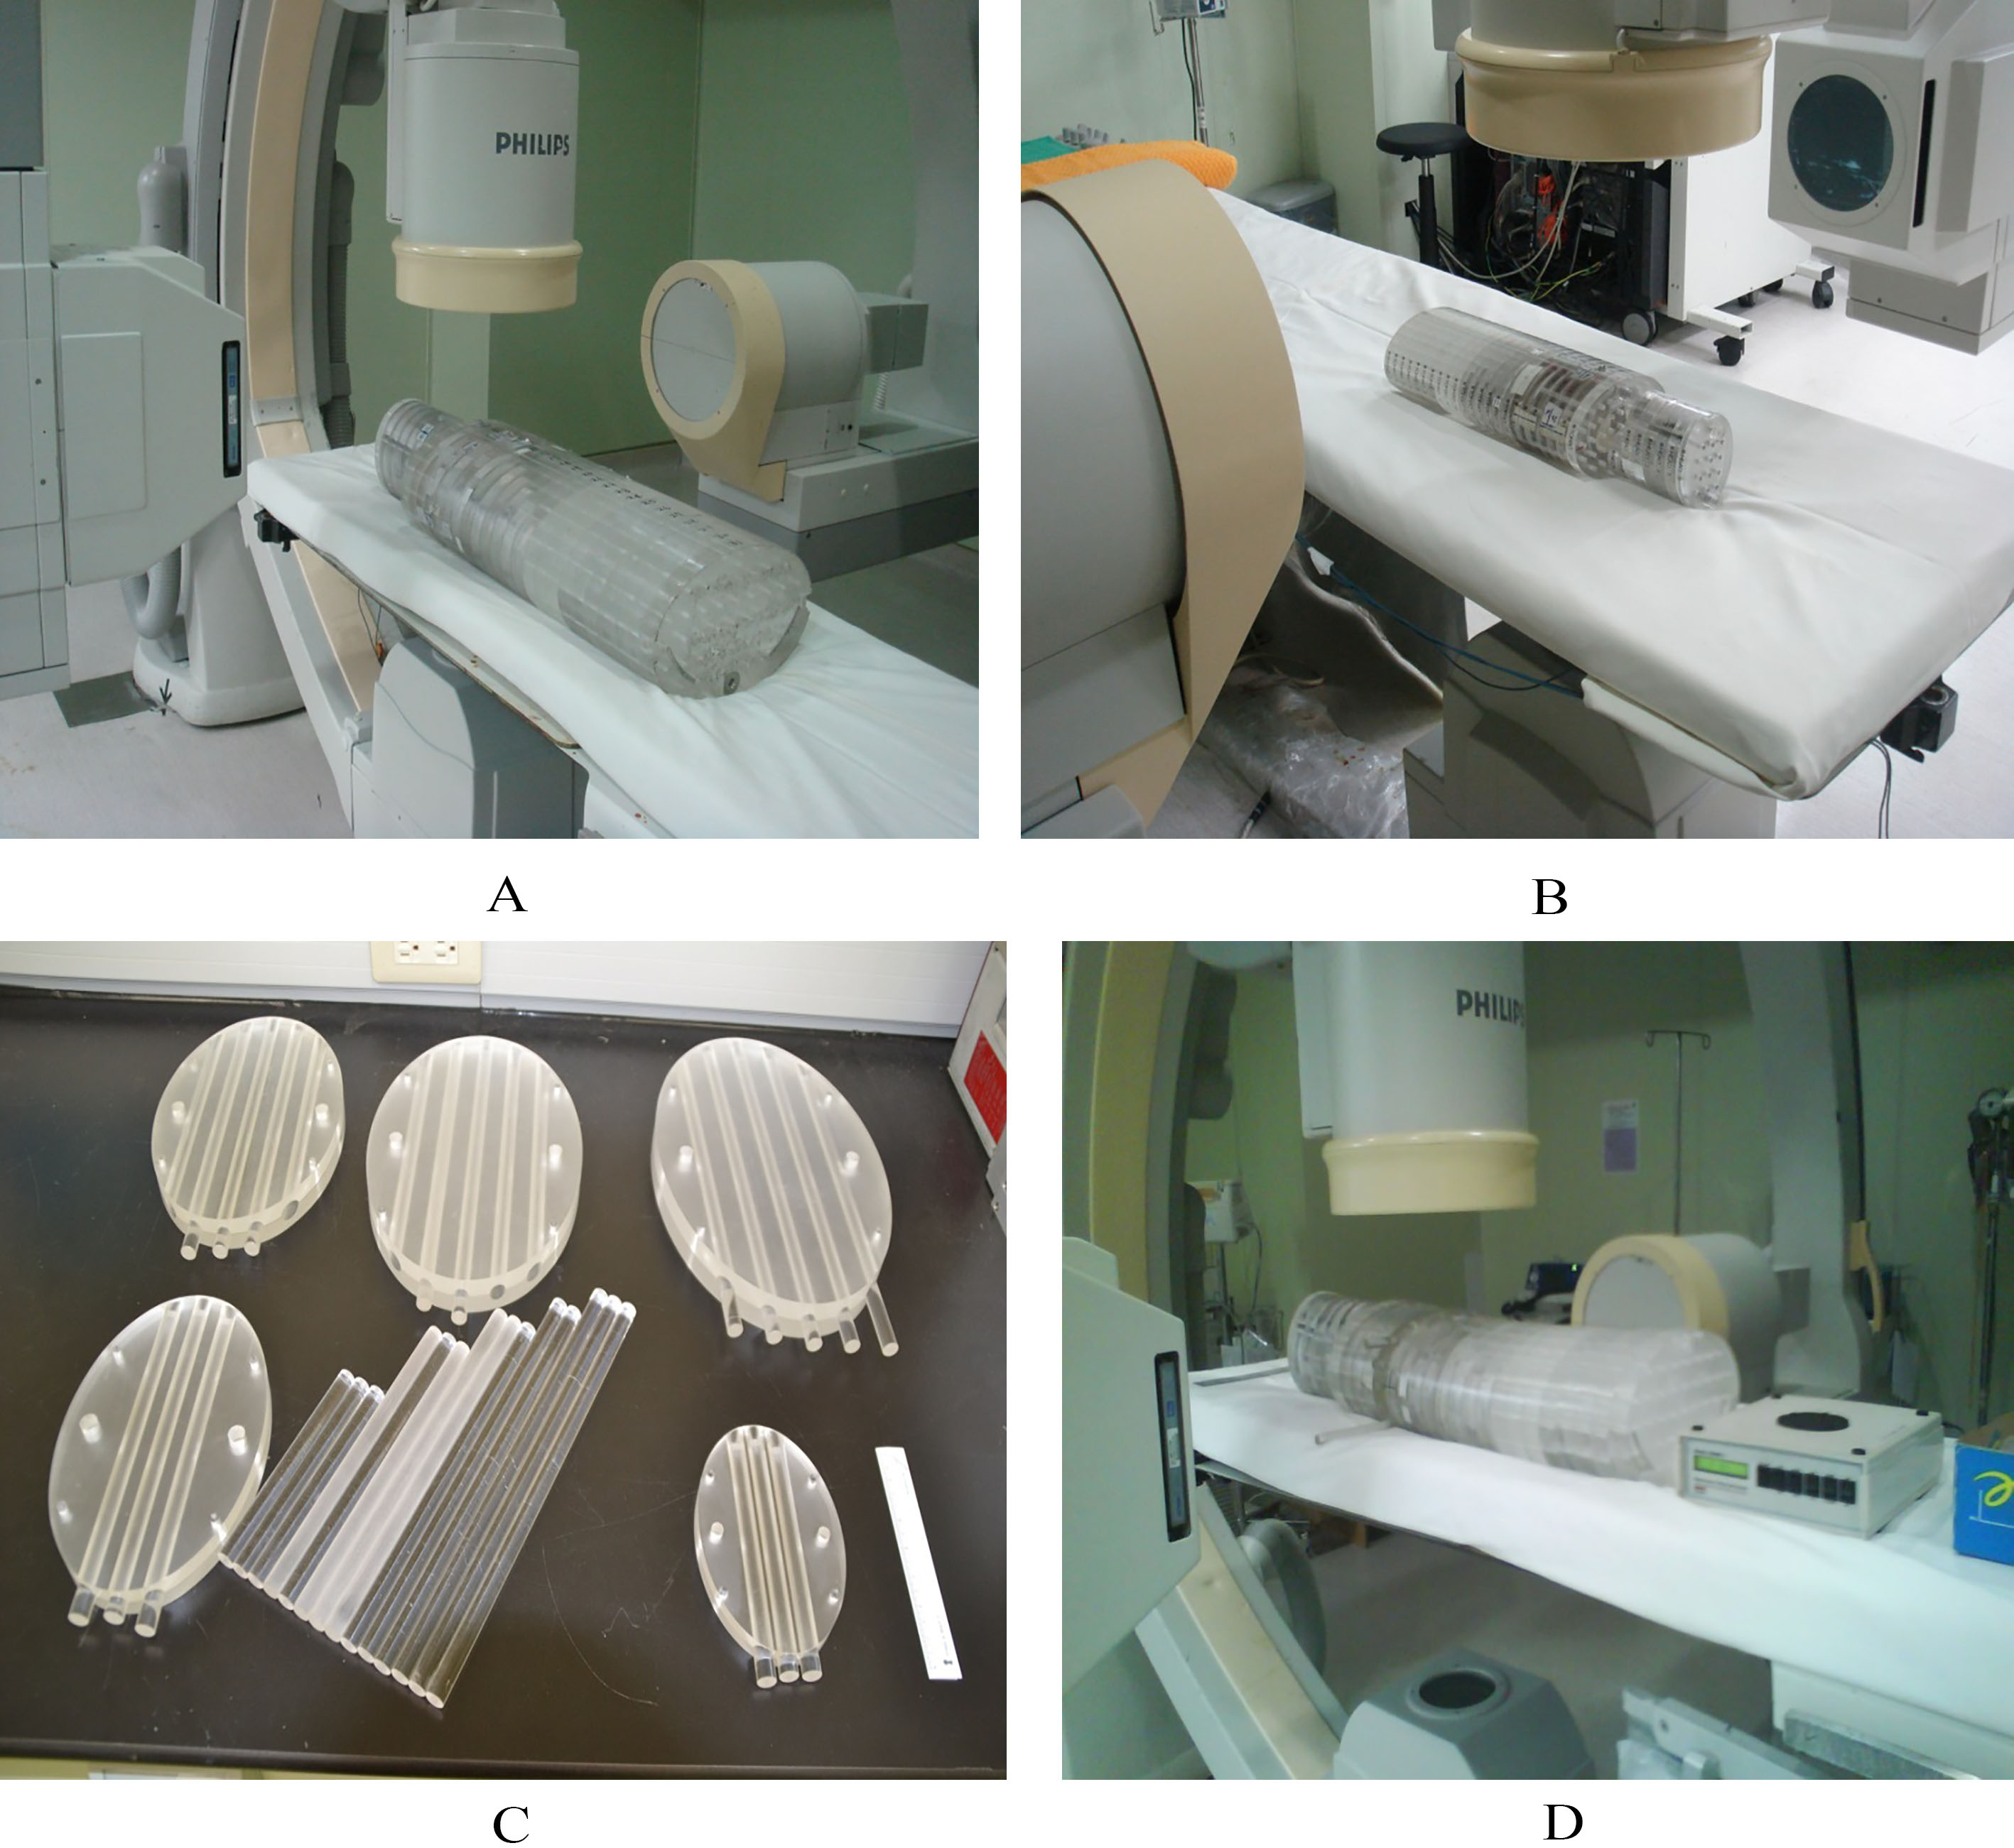
Figure 2.
(A) A 70 kg phantom was placed between two X-ray emitters, and the focal spots aiming at the back of phantom, (B) a 10 kg phantom, the photo was taken from the opposite side of (A), (C) five auxiliary plate with 3-5 through holes to insert the pencil-type ionization chamber for surveying the fluoroscopy dose. The size of an auxiliary plate equaled by the geometrical size to the respective phantom, which allowed one to insert it into any layers to replace the original one, and (D) a 90 kg phantom with auxiliary plate replacing the original 14
3.Results
3.1Effective and skin doses
Table 3 lists the relevant data derived in this work. The reported data for each specific case were averaged from three independent measurements. The TLDs were measured and then averaged to represent the particular assigned organ or tissue. The data were categorized by BMI and exposed time
Table 3
The reported data for each specific case were averaged from three independent measurements. The TLDs were measured and then averaged to obtain the values representing the assigned organ or tissue. The data were categorized by BMI and exposed time
| PMMA | E |
|
|
| Z | |||||||||||||||||||
|---|---|---|---|---|---|---|---|---|---|---|---|---|---|---|---|---|---|---|---|---|---|---|---|---|
|
| time (sec) |
|
|
|
|
|
|
| ||||||||||||||||
| 10 | 70 | 13.52 | 2606 | 226 | 1121 | 1512 | 128 | 220 | ||||||||||||||||
| 10 | 140 | 13.52 | 5275 | 427 | 1836 | 3075 | 191 | 329 | ||||||||||||||||
| 10 | 210 | 13.52 | 7949 | 605 | 2529 | 4547 | 258 | 444 | ||||||||||||||||
| 10 | 280 | 13.52 | 10555 | 815 | 3491 | 6059 | 321 | 553 | ||||||||||||||||
| 10 | 420 | 13.52 | 15830 | 1294 | 7990 | 9134 | 452 | 780 | ||||||||||||||||
| 30 | 70 | 16.46 | 9238 | 316 | 3375 | 2727 | 152 | 917 | ||||||||||||||||
| 30 | 140 | 16.46 | 18336 | 444 | 3690 | 5402 | 270 | 2205 | ||||||||||||||||
| 30 | 210 | 16.46 | 27579 | 669 | 5781 | 8113 | 371 | 3104 | ||||||||||||||||
| 30 | 280 | 16.46 | 36817 | 1029 | 8978 | 10840 | 458 | 4278 | ||||||||||||||||
| 30 | 420 | 16.46 | 55153 | 1441 | 12071 | 16242 | 705 | 6470 | ||||||||||||||||
| 50 | 70 | 21.64 | 35325 | 479 | 1687 | 3978 | 146 | 1118 | ||||||||||||||||
| 50 | 140 | 21.64 | 70773 | 811 | 4777 | 7890 | 271 | 2369 | ||||||||||||||||
| 50 | 210 | 21.64 | 106233 | 1084 | 5715 | 11886 | 379 | 3438 | ||||||||||||||||
| 50 | 280 | 21.64 | 141558 | 1704 | 10104 | 15864 | 526 | 4638 | ||||||||||||||||
| 50 | 420 | 21.64 | 212331 | 2378 | 12187 | 23753 | 772 | 6951 | ||||||||||||||||
| 70 | 70 | 24.22 | 44415 | 325 | 2237 | 5149 | 156 | 1467 | ||||||||||||||||
| 70 | 140 | 24.22 | 88314 | 922 | 4997 | 10238 | 277 | 3249 | ||||||||||||||||
| 70 | 210 | 24.22 | 132351 | 941 | 6200 | 15318 | 402 | 4979 | ||||||||||||||||
| 70 | 280 | 24.22 | 176766 | 1638 | 12118 | 20467 | 527 | 6766 | ||||||||||||||||
| 70 | 420 | 24.22 | 265080 | 2189 | 18567 | 30705 | 776 | 10302 | ||||||||||||||||
| 90 | 70 | 27.78 | 56191 | 344 | 1432 | 6026 | 143 | 2659 | ||||||||||||||||
| 90 | 140 | 27.78 | 111586 | 624 | 3436 | 12143 | 253 | 4892 | ||||||||||||||||
| 90 | 210 | 27.78 | 167751 | 1177 | 4345 | 18110 | 360 | 7133 | ||||||||||||||||
| 90 | 280 | 27.78 | 223942 | 1867 | 9780 | 24136 | 469 | 9352 | ||||||||||||||||
| 90 | 420 | 27.78 | 335528 | 2593 | 12670 | 36279 | 688 | 13848 | ||||||||||||||||
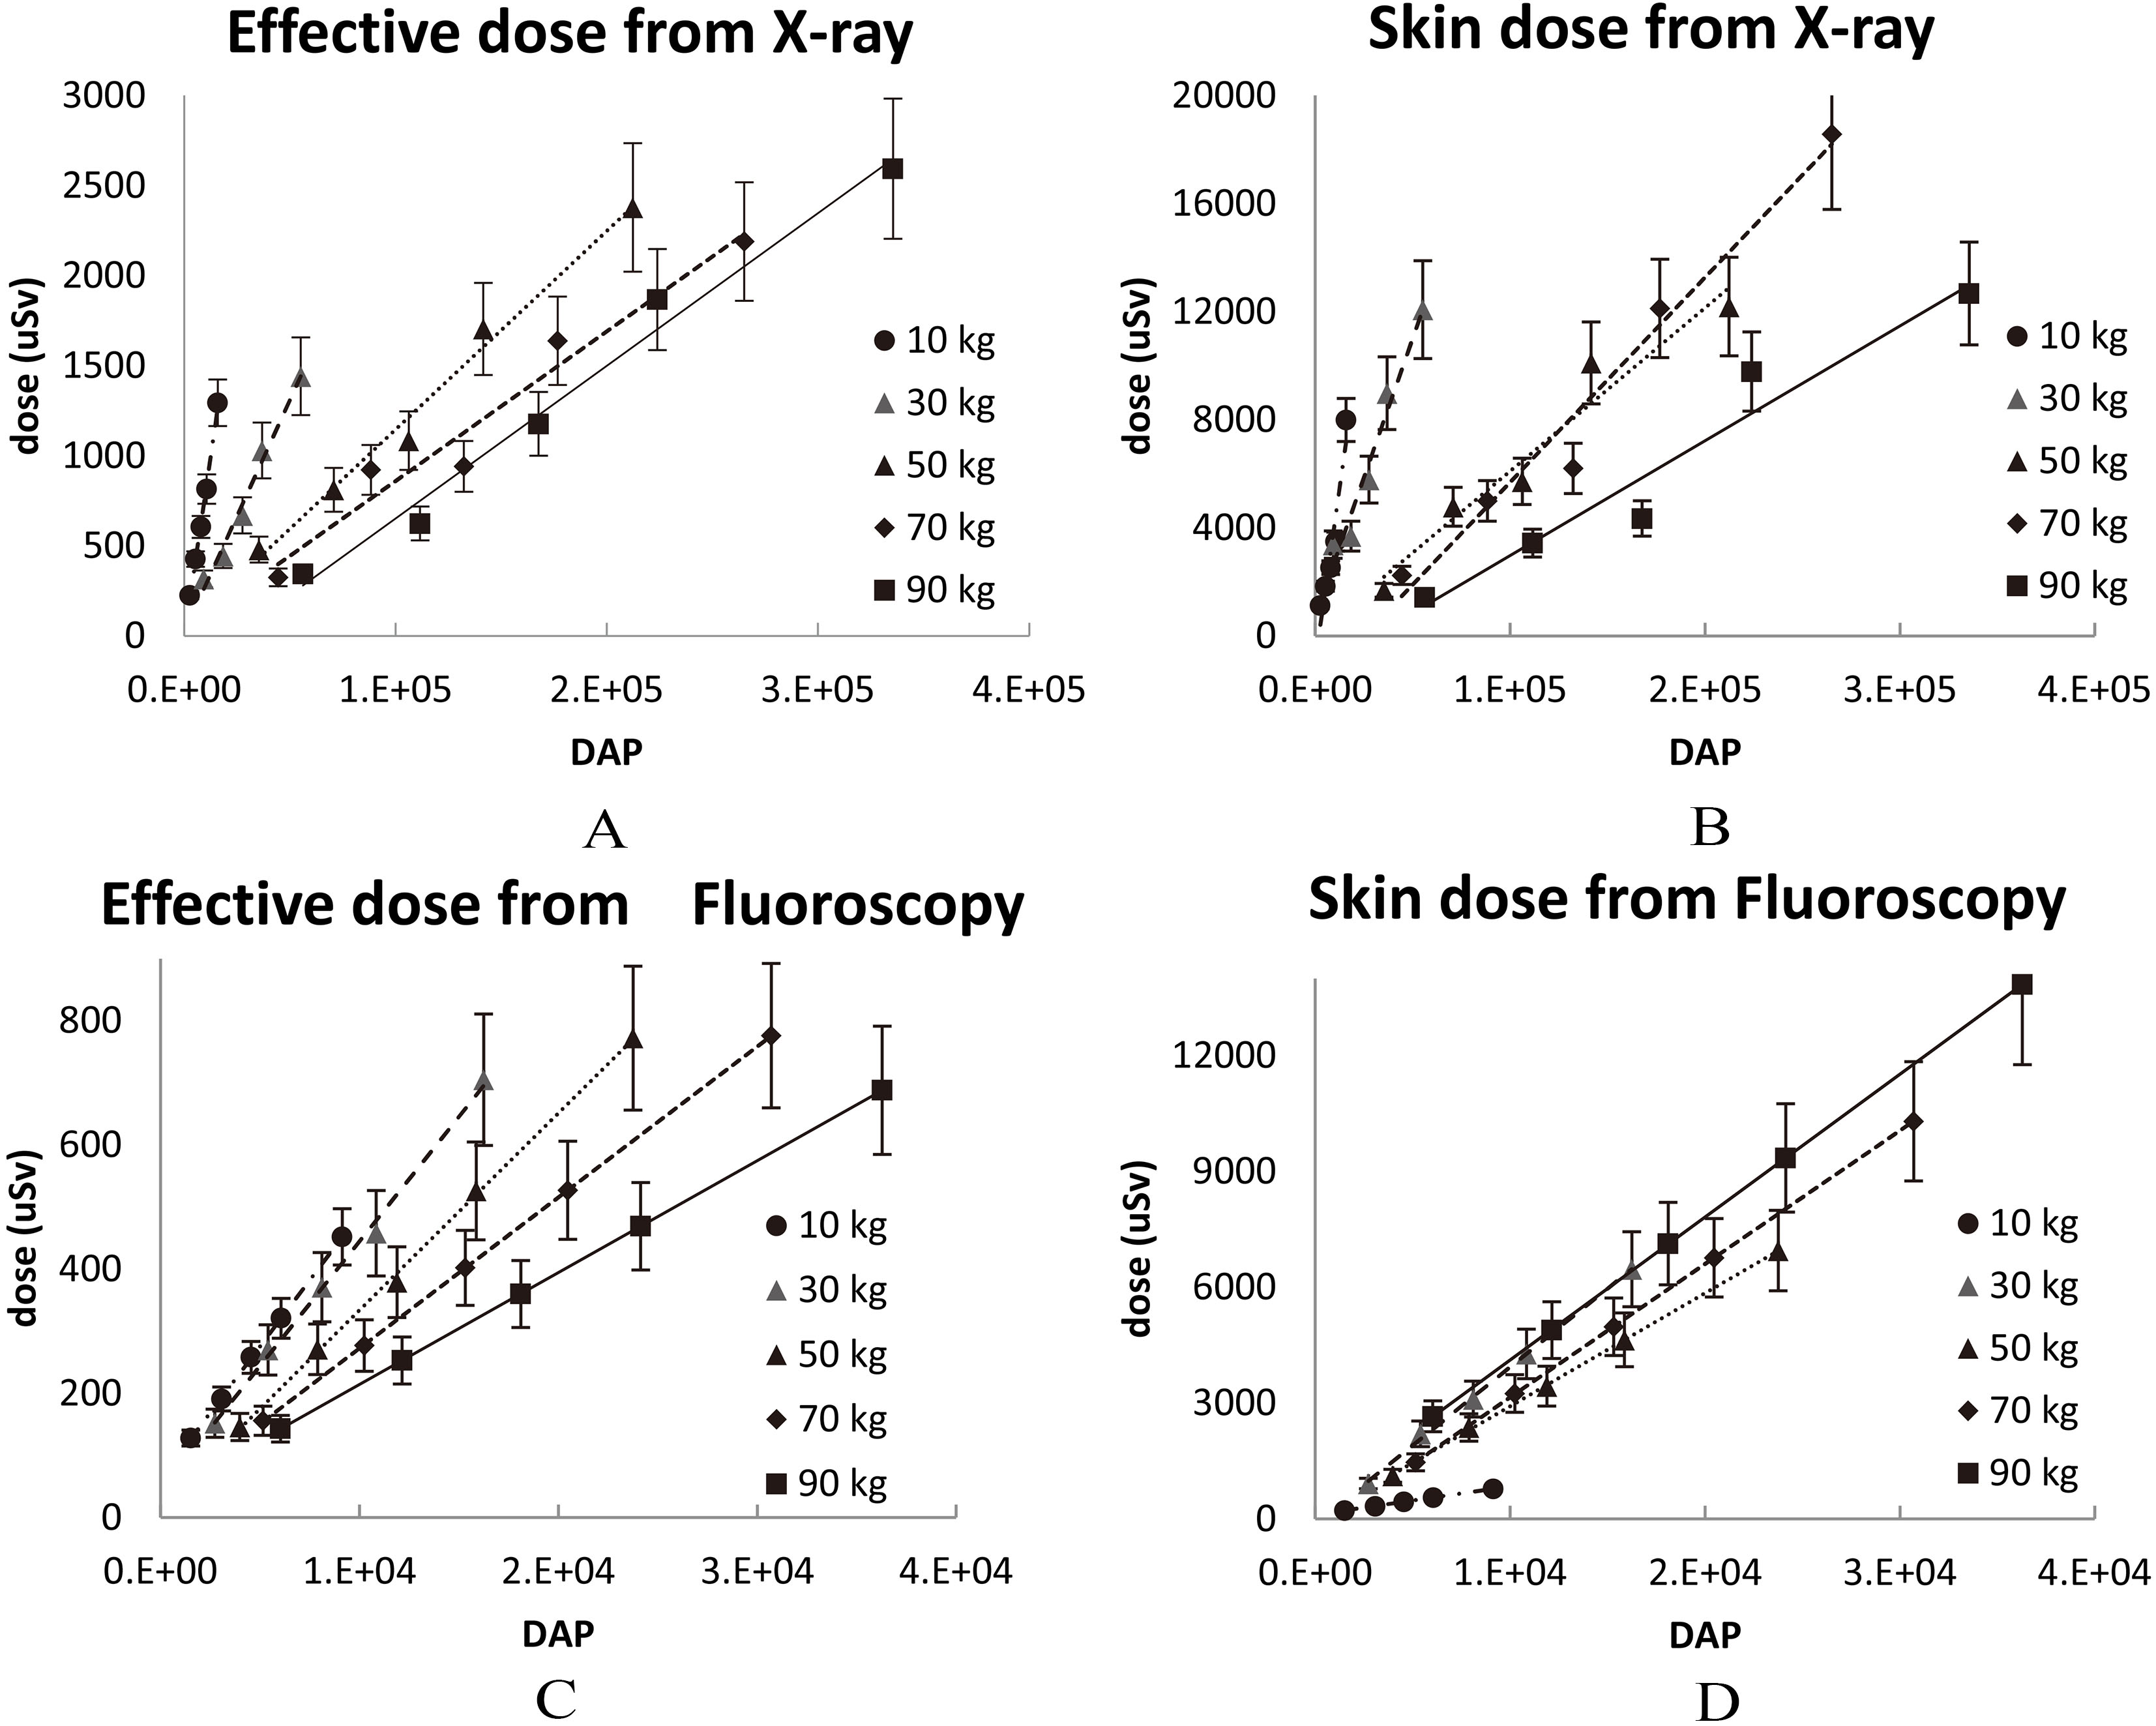
Figure 3.
Four correlations between DAP and dose using five phantoms of different weight. Thus, a thorough survey of effective or skin doses for five phantoms exposed to X-ray or fluoroscopy was accomplished in this work. (A) Effective dose from X-ray exposure, (B) skin dose from X-ray exposure, (C) effective dose from fluoroscopy, and (D) skin dose from fluoroscopy.
3.2Error treatment
The errors associated with the derived effective or skin doses for various X-ray/fluoroscopy exposure arrangements were calculated as the square root of the sum of squared individual errors,
Table 4
The errors associated with the derived effective or skin doses for various X-ray/fluoroscopy exposure arrangements. The total error was calculated as the square root of the sum of squared individual errors
| Source | Error (%) |
| Systematic | |
| | 5% |
| Non-tissue equivalent effect | 5% |
| Fluctuation of X-ray or Fluoroscopy | 3% |
| Internal normalization of TLD chip | 3% |
| Pencil type ion chamber dose conversion | 1.1% |
| Random | |
| TLD chips reading statistics | 2.7% |
| Pencil type ion chamber repeat statistics | 3.8% |
|
| 8.9% |
4.Discussion
4.1Optimal-fitting of a semi-empirical formula via STATISTICA program
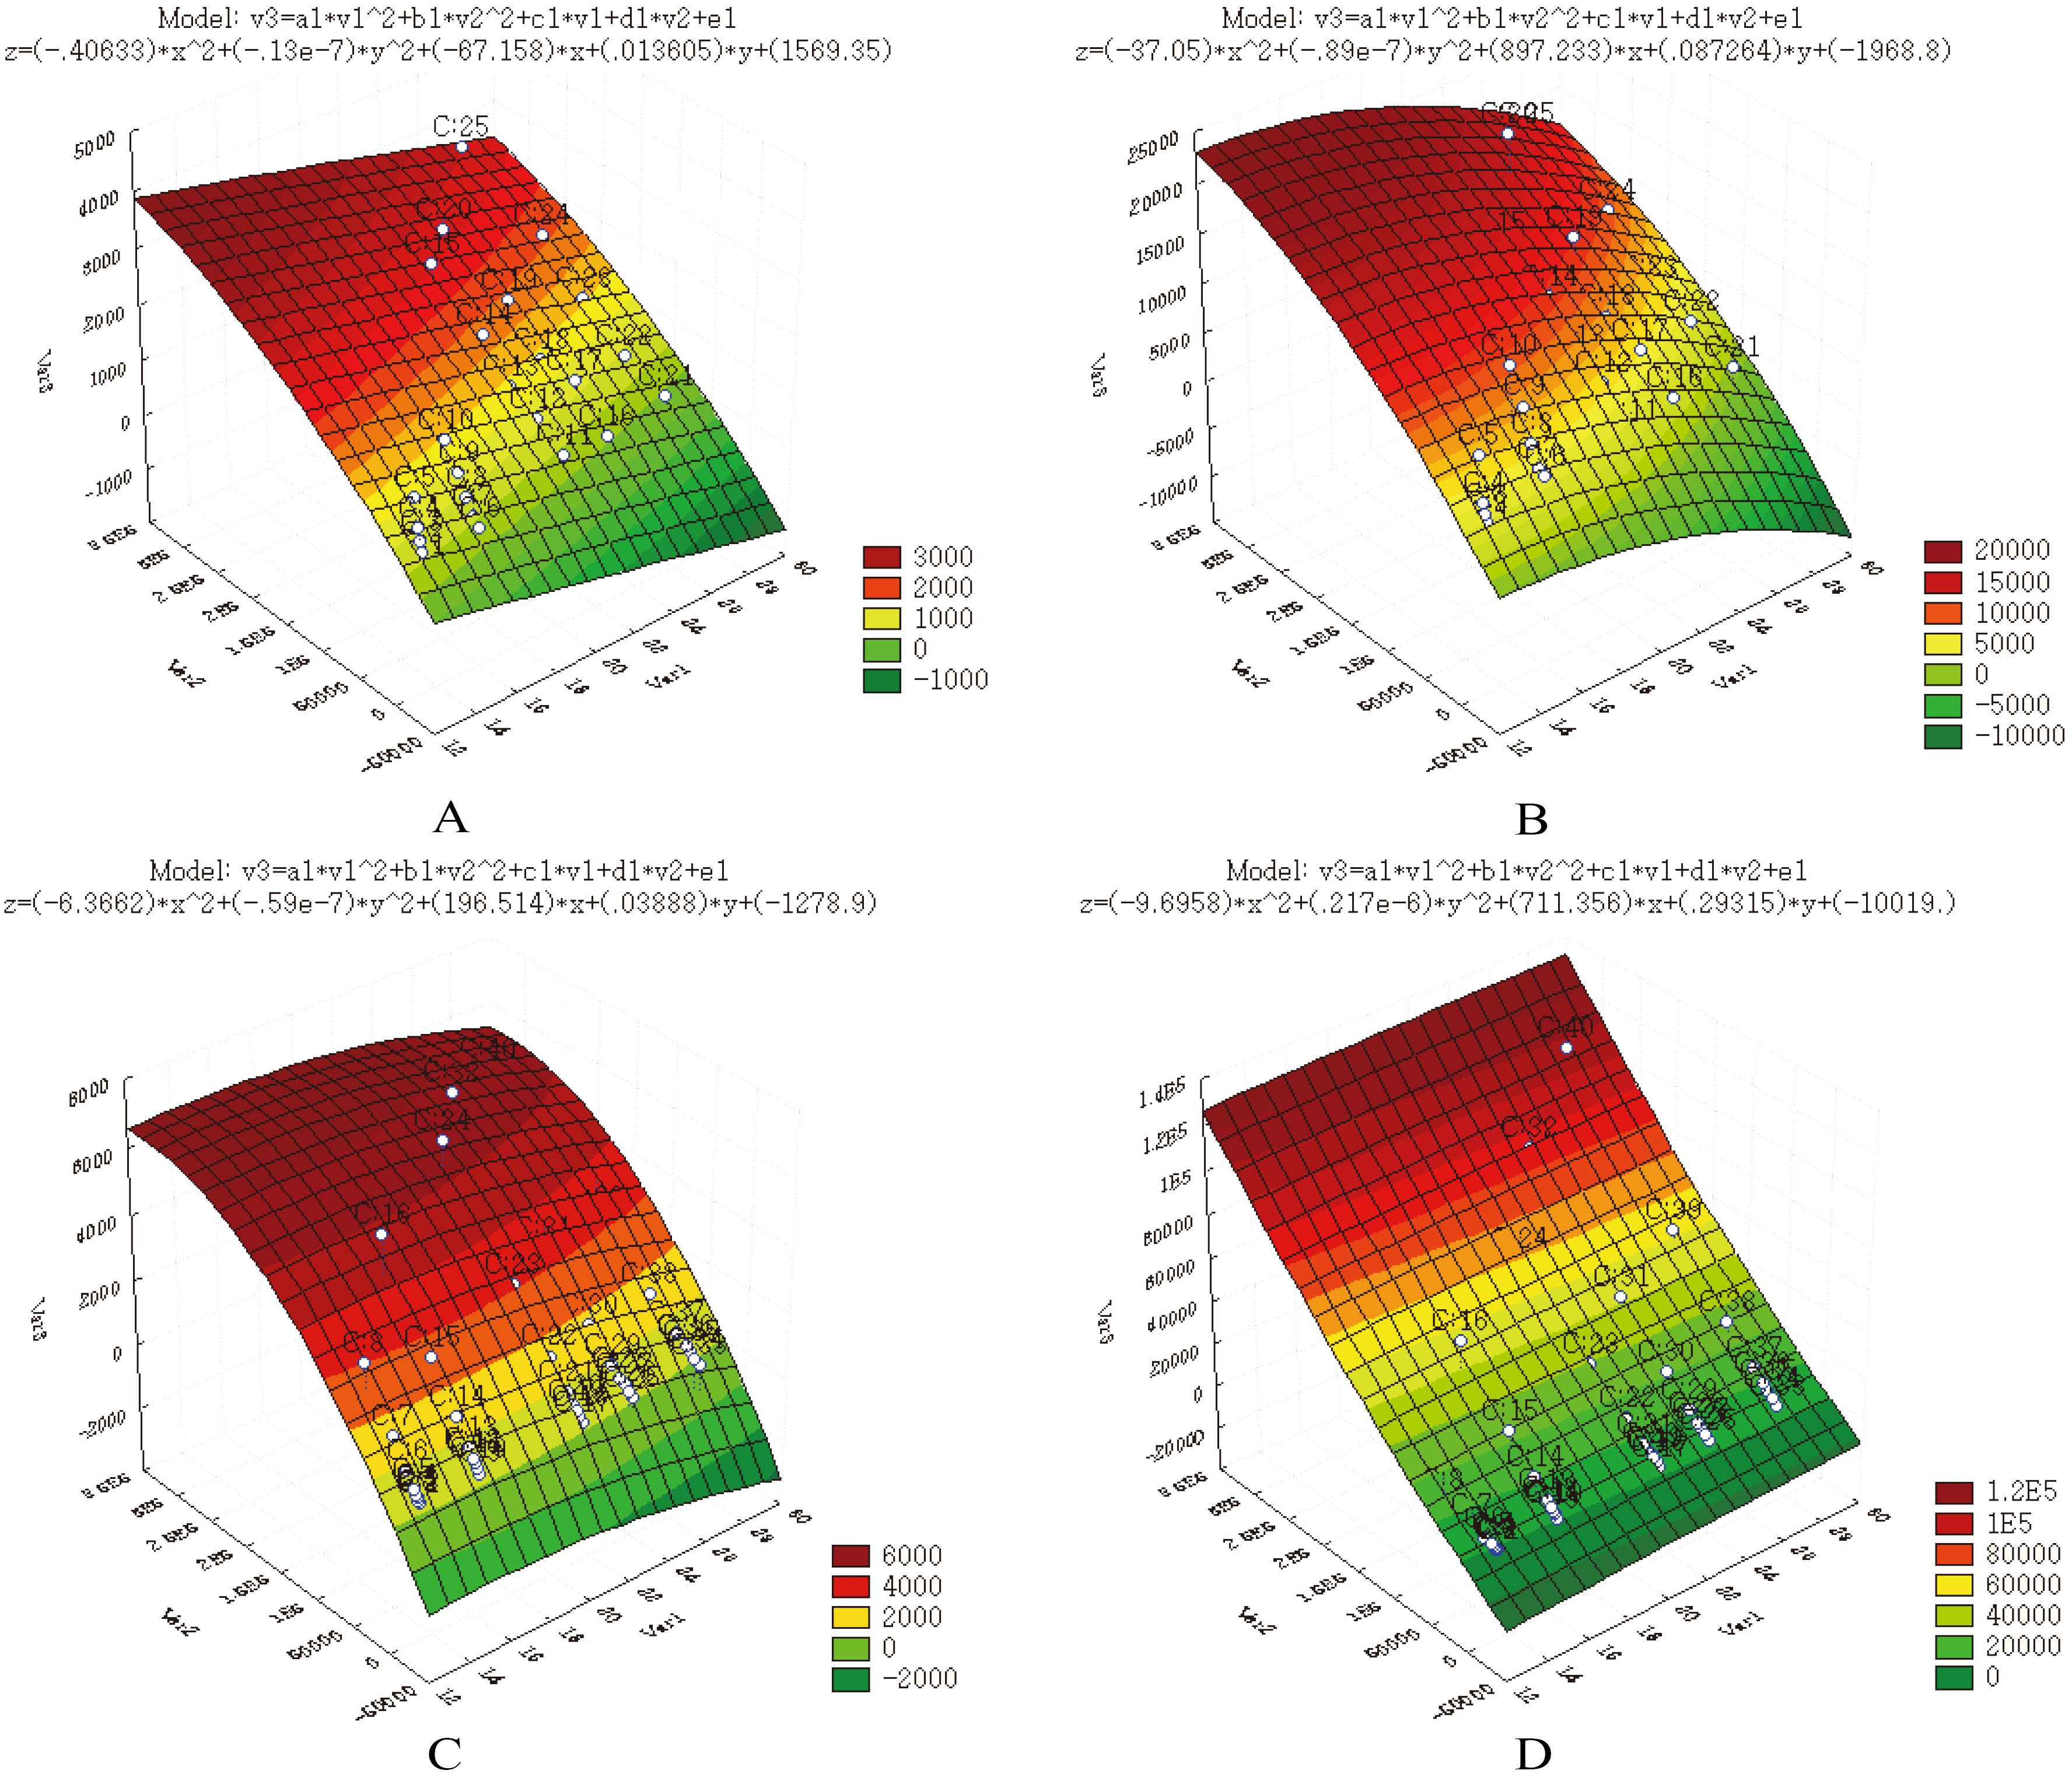
The correlation of DAP versus dose for various phantom weights (reduced to BMI) can be expressed by a semi-empirical formula defined as a binary quadratic equation to predict the exposure dose (effective or skin one) for patients that underwent the cardiac interventional examination (via X-ray or fluoroscopy) in CCL. In doing so, the coefficients of the semi-empirical formula can be derived with the STATISTICA program [10]. The correlations among the variables are determined and defined as nonlinear models, nonlinear estimations, and user-specified regressions with customized loss functions to perform the numerical analysis using the normalized data from the real measurement. The predicted effective or skin doses are the expectation values of the computational results. Therefore, five independent groups of 25 individual datasets each [5
(3)
Table 5
The derived coefficients
| Source | Dose | Dose | |||||
| A | B | C | D | E |
| ||
| X-ray | Effective | 0.000 | 0.014 | 1569.4 | 0.952 | ||
| Skin | 0.000 | 897.2 | 0.087 | 0.888 | |||
| Fluoroscopy | Effective | 0.000 | 196.5 | 0.039 | 0.977 | ||
| Skin | 0.000 | 711.4 | 0.293 | 0.986 | |||
Figure 4.
Plot of the expectation values predicted via the semi-empirical formulas, which was automatically constructed by the STATISTICA default feature. (A) effective dose from X-ray exposure, (B) skin dose from X-ray exposure, (C) effective dose from fluoroscopy, and (D) skin dose from fluoroscopy.
where Dose,
4.2Clinical verification using 30 cardiac interventional patients
The obtained binary quadratic equations were applied to predict the exposed dose for 30 patients who underwent the cardiac interventional examination. This was envisaged to verify the theoretical estimation accuracy. In doing so, thirty patients were asked to place three TLDs on their backs within the X-ray focal spot aiming region during the cardiac examination. The TLD chips had to be put along the cardiac edge to avoid any false imaging being made. The TLD chips were removed immediately after the examination and followed the same process of TLD reading to collect the clinical data. Table 6 lists the derived data and their comparison with the theoretical estimation. As seen in Table 6, these results are widely fluctuated. Only 12 out of 30 cases have a disagreement lower than 100%, whereas others exhibit even worse correlation. The possible reasons of such deviations might be (A) the focal spot aiming of the X-ray is moving according to instant response from the cardiac interventional examination. In contrast, the equation is calculated according to fixed DAP that is exposed by a steady focal spot aiming, thus, the prediction might under- or overestimate the dose on the basis of inappropriate DAP index, (B) the facility can show only combined DAP index rather than individual DAP by X-ray or fluoroscopy, respectively. Thus, the DAP is roughly divided into fifty-fifty contributions of fluoroscopy or X-ray. The assumption is concluded from a long-term in-situ statistics in the CCL from May 2016 to September 2017 and suggested a “fifty-fifty” rule of thumb. The X-ray has higher specific DAP than fluoroscopy (for 70 kg phantom, X-ray and fluoroscopy exhibited approx. 630 and 72 DAP/s, respectively; whereas the time sharing between X-ray and fluoroscopy reached the ratio of 1:9 in the regular CCL diagnosis. Thus, DAP fulfills the “fifty-fifty” rule in reality. In the routine examination, the CCL staff needs to step on the foot pedal of fluoroscopy for acquiring the tentative image and then refine the preset parameters for ensuring a precise image (since the machine operates only when there is pressure on the switch); whereas the X-ray is used to ascertain the cardiac interventional process for the diagnosis or to store the printed imaging for the follow-up study. In some special cases, the fluoroscopy is continuously adopted for the benefit of low-exposure dose, and then the DAP ratio changes to “forty-sixty”. Therefore, from the statistical viewpoint, the exact breakdown of DAP between fluoroscopy and X-ray is a complicated and fuzzy process. Yet, from the clinical viewpoint, the “fifty-fifty” option is always a good compromise. For example, if a 70-kg standard male patient receives 60,000 DAP during the cardiac interventional examination, it is roughly estimated that each source shares 30,000 DAP. Then, the derived values for X-ray effective/skin dose and fluoroscopy effective/skin dose are assessed as 125, 638, 916, and 10313
Table 6
The derived data according to the semi-empirical formula and compared to clinical data obtained. Only 12 out of 30 cases exhibit a good fit, while the remaining ones disagree by more than 100%
| X-ray | Fluoroscopy | Effective dose | Skin dose | |||||||||||||||||||||||||||||
|---|---|---|---|---|---|---|---|---|---|---|---|---|---|---|---|---|---|---|---|---|---|---|---|---|---|---|---|---|---|---|---|---|
| No. |
|
| Time |
| Time |
|
|
|
|
| ||||||||||||||||||||||
| 1 | 24.57 | 3132 | 285 | 182113 | 2847 | 206759 | 6938 | 82148 | 53606 | 53 | ||||||||||||||||||||||
| 2 | 20.70 | 402 | 37 | 15380 | 365 | 20209 | 1034 | 8614 | 5934 | 45 | ||||||||||||||||||||||
| 3 | 26.31 | 1686 | 153 | 113109 | 1533 | 123237 | 4272 | 46131 | 167972 | |||||||||||||||||||||||
| 4 | 20.90 | 354 | 32 | 13908 | 322 | 18084 | 906 | 7781 | 1175 | 562 | ||||||||||||||||||||||
| 5 | 24.05 | 54 | 5 | 2996 | 49 | 3451 | 342 | 936 | 1032 | |||||||||||||||||||||||
| 6 | 19.05 | 42 | 4 | 1251 | 38 | 1829 | 385 | 2338 | 3754 | |||||||||||||||||||||||
| 7 | 23.12 | 150 | 14 | 7604 | 136 | 9017 | 305 | 3535 | 1800 | 96 | ||||||||||||||||||||||
| 8 | 27.22 | 1254 | 114 | 89991 | 1140 | 96303 | 3108 | 34539 | 9027 | 283 | ||||||||||||||||||||||
| 9 | 21.73 | 270 | 25 | 11759 | 245 | 14704 | 621 | 6265 | 1500 | 318 | ||||||||||||||||||||||
| 10 | 21.10 | 1746 | 159 | 70390 | 1587 | 90614 | 3936 | 35190 | 3515 | 901 | ||||||||||||||||||||||
| 11 | 26.43 | 990 | 90 | 67027 | 900 | 72846 | 2350 | 25829 | 6955 | 271 | ||||||||||||||||||||||
| 12 | 20.64 | 498 | 45 | 18900 | 453 | 24913 | 1260 | 10355 | 1921 | 439 | ||||||||||||||||||||||
| 13 | 22.94 | 942 | 86 | 46883 | 856 | 55939 | 2293 | 21287 | 42788 | |||||||||||||||||||||||
| 14 | 27.68 | 1188 | 108 | 88063 | 1080 | 93457 | 2896 | 33010 | 17298 | 91 | ||||||||||||||||||||||
| 15 | 24.13 | 66 | 6 | 3688 | 60 | 4239 | 318 | 1177 | 576 | 104 | ||||||||||||||||||||||
| 16 | 24.17 | 168 | 15 | 9423 | 153 | 10817 | 330 | 3594 | 5321 | |||||||||||||||||||||||
| 17 | 21.51 | 288 | 26 | 12218 | 262 | 15427 | 689 | 6612 | 1406 | 370 | ||||||||||||||||||||||
| 18 | 20.24 | 468 | 43 | 16799 | 425 | 22651 | 1209 | 9613 | 5010 | 92 | ||||||||||||||||||||||
| 19 | 24.89 | 78 | 7 | 4664 | 71 | 5251 | 420 | 1041 | 1329 | |||||||||||||||||||||||
| 20 | 20.43 | 228 | 21 | 8407 | 207 | 11211 | 648 | 5406 | 1179 | 359 | ||||||||||||||||||||||
| 21 | 23.81 | 450 | 41 | 24408 | 409 | 28315 | 909 | 10364 | 2163 | 379 | ||||||||||||||||||||||
| 22 | 23.53 | 450 | 41 | 23761 | 409 | 27803 | 936 | 10323 | 3142 | 229 | ||||||||||||||||||||||
| 23 | 23.14 | 210 | 19 | 10668 | 191 | 12641 | 400 | 4866 | 1290 | 277 | ||||||||||||||||||||||
| 24 | 21.69 | 192 | 17 | 8323 | 175 | 10425 | 421 | 4711 | 2100 | 124 | ||||||||||||||||||||||
| 25 | 18.91 | 138 | 13 | 4011 | 125 | 5932 | 598 | 3810 | 434 | 778 | ||||||||||||||||||||||
| 26 | 24.15 | 234 | 21 | 13101 | 213 | 15048 | 439 | 5185 | 2352 | 120 | ||||||||||||||||||||||
| 27 | 17.02 | 228 | 21 | 4412 | 207 | 8048 | 899 | 4606 | 721 | 539 | ||||||||||||||||||||||
| 28 | 27.30 | 336 | 31 | 24251 | 305 | 25913 | 554 | 6894 | 5832 | 18 | ||||||||||||||||||||||
| 29 | 23.43 | 180 | 16 | 9412 | 164 | 11048 | 353 | 4118 | 1873 | 120 | ||||||||||||||||||||||
| 30 | 19.43 | 504 | 46 | 15994 | 458 | 22732 | 1315 | 9769 | 1010 | 867 | ||||||||||||||||||||||
5.Conclusions
The effective and skin dose for patients undergone cardiac interventional examination were assessed in this work using five PMMA phantoms and TLD/ionization chamber technique with the further clinical verification. Five PMMA phantoms (10, 30, 50, 70, and 90 kg) were customized to represent baby, child, adult female, adult male, and overweight adult, in compliance with ICRU-48 report. The data obtained from five phantoms were integrated into four semi-empirical formulas to describe the X-ray and fluoroscopy effective/skin doses with a high coefficient of determination. The predicted dose was later verified by the clinical survey, where 40% (12 cases of 30) revealed a good fit. Possible reasons for high deviations (over 100%) in the remaining 60% of cases could be attributed to the deviated focal spot aiming at patient’s back during the diagnosis or erroneous estimation of DAP shares corresponding to X-ray or fluoroscopy. These factors, as well as other ones reported by other authors (e.g., variations in the field size, focus-to-image intensifier distance, and focus-to-skin distance), have to be accounted for in further research efforts.
Acknowledgments
The authors would like to thank the National Defense-Medical Affairs Bureau (contract no. ND 106-A11) and the Ministry of Science and Technology of the Republic of China (contract no. MOST 106-2221-E-166-002) for the financial support of this research.
Conflict of interest
None to report.
References
[1] | Pan LF, Kittipayak S, Yen SL, et al. Evaluation of the occupational X-rays dose of the medical staff in a cardiac catheterization laboratory using an acrylic phantom and semiconductor dosimeter, Hellenic Journal of Nuclear Medicine. (2016) ; 19: (2): 140-146. |
[2] | McFadden S, Hughes C, Dhelft CI, et al. The establishment of local diagnostic reference levels for pediatric interventional cardiology, Radiography. (2013) ; 19: : 295-310. |
[3] | Wu JR, Huang TY, Wu DK, et al. Radiation exposure of pediatric patients and physicians during cardiac catheterization and balloon pulmonary valvuloplasty, American Journal of Cardiology. (1991) ; 68: (2): 221-225. |
[4] | Ector J, Dragusin O, Adriaenssens B, et al. Obesity is a major determinant of radiation dose in patients undergoing pulmonary vein isolation for atrial fibrillation, Journal of American College of Cardiology. (2007) ; 50: (3): 234-242. |
[5] | Chida K, Saito H, Otani H, et al. Relationship between fluoroscopic time, dose-area product, body weight, and maximum radiation skin dose in cardiac interventional procedures, American Journal of Roentgenology. (2006) ; 186: (3): 774-778. |
[6] | Hansson B, Karambatsakidou A. Relationships between entrance skin dose, effective dose and dose area product for patients in diagnostic and interventional cardiac procedures. Radiation Protection Dosimetry. (2000) ; 90: (1-2): 141-144. |
[7] | Mettler FA, Koenig TR, Wagner LK, et al. Radiation injuries after fluoroscopic procedures. Seminars in Ultrasound, CT, and MRI. (2002) ; 23: (5): 428-442. |
[8] | Koenig TR, Wolff D, Mettler FA, et al. Skin injuries from Fluoroscopically guided procedures Part 1, characteristics of radiation injury. American Journal of Roentgenology. (2001) ; 177: : 3-11. |
[9] | ICRU-48. Phantoms and computational models in therapy, diagnosis and protection, International commission on radiation units and measurement. (1992) ; https://academic.oup.com/jicru/issue/os25/1. |
[10] | STATISTICA version 10, 2017. Available at: http://www.statsoft.com/Products/STATISTICA-Features/Version-10. |
[11] | ICRP-60. Recommendations of the international commission on radiological protection Technical Report, International commission on radiation protection, (1991) ; http://www.icrp.org/publication.asp?id=icrp%20publication%2060. |
[12] | ICRP-26. Recommendations of the international commission on radiological protection Technical Report, International commission on radiation protection, (1977) ; http://www.icrp.org/publication.asp?id=ICRP%20Publication%2026. |
[13] | Chang ZK. To evaluate the effective dose for patient undergone cardiac angiography using five PMMA phantoms, Mater thesis, Dept. of medical imaging and radiological sciences, Central Taiwan University of Science and Technology. Taichung, Taiwan, (2013) . |
[14] | Chen CY, Yang KC, Pan LK. Bubble technique for evaluating effective dose of diagnostic X-rays: a feasibility study, J. Radiation Research, (2009) ; 50: : 449-456. |
[15] | Liu MT, Huang SS, Yeh DM, et al. Distribution of spatial photoneutrons inside a 70 kg water phantom via neutron activation analysis, Applied Radiation Isotopes. (2010) ; 68: : 1816-1821. |
[16] | Pan LF, Davaa O, Chen CY, et al. Quantitative evaluation of contrast-induced-nephropathy in vascular post-angiography patients: feasibility study of a semi-empirical model, Bio-Medical Materials and Engineering. (2015) ; 26: : s851-860. |
[17] | Pan LF, Chiu SW, Xiao MF, et al. Revised inverse problem algorithm-based prediction of coronary artery stenosis readings from the clinical data of patients with coronary heart diseases, Computer Assisted Surgery, (2017) . http//dx.doi.org/10.1080/24699322.2017.1379149. |


