
A novel method for dipper/non-dipper pattern classification in hypertensive and non-diabetic patients
Abstract
BACKGROUND:
In the classical process, it was proven that ABPM data were the most significant attributes both by physician and ranking algorithms for dipper/non-dipper pattern classification as mentioned in our previous papers. To explore if any algorithm exists that would let the physician skip this diagnosis step is the main motivation of the study.
OBJECTIVE:
The main goal of the study is to build up a classification model that could reach a high-performance metrics by excluding ABPM data in hypertensive and non-diabetic patients.
METHODS:
The data used in this research have been drawn from 29 hypertensive patients without diabetes in endocrinology clinic of Marmara University in 2011. Five of 29 patient data were later removed from the dataset because of null data.
RESULTS:
The findings showed that dipper/non-dipper pattern can be classified by artificial neural network algorithms, the highest achieved performance metrics are accuracy 87.5%, sensitivity 71%, and specificity 94%.
CONCLUSIONS:
This novel method uses just two attributes: Ewing-score and HRREP. It offers a fast and low-cost solution when compared with the current diagnosis procedure. This attribute reduction method could be beneficial for different diseases using a big dataset.
1.Introduction
Increased arterial blood pressure, also known as hypertension, is a major risk factor for coronary heart disease and ischemic as well as hemorrhagic stroke [1]. It is estimated to cause 7.5 million deaths, which constitute about 12.8% of all deaths [2]. World Health Organization has announced that, worldwide, approximately 40% of adults (which amounts to 1 billion people) aged 25 and over have hypertension in 2008 [3]. The mean expenditure including pharmacotherapy, ambulatory visits and care per person for the treatment of hypertension is $860 [4]. Hence, hypertension is both a prevalent and a high-cost disease. The high cost of hypertension is mostly due to cardiovascular damages given in the following: myocardial infarction; heart failure, sudden and premature death, stroke, kidney failure, and peripheral arterial disease, etc.
Patients with a blood pressure that does not decrease by 10% during night sleep compared to daytime are defined as “non-dippers”. It is known that target organ injury (which is a clinical or laboratory finding of early hypertensive damage in any vascular organ) occurs more severely in non-dipper hypertensive patients than dipper patients [5]. One of the methods to identify dipper or non-dipper pattern is Ambulatory Blood Pressure Monitoring (ABPM). ABPM is a non-invasive and ordinary process. However, the disadvantages that this method has (such as carrying an uncomfortable device during a whole day and night, time-consuming and high-cost procedures) caused the physician to want to skip this diagnosis step. This is the main motivation of the study to explore if any algorithm exists that would classify the same pattern by excluding the ABPM data.
Prospective studies have demonstrated that non-dipping status can be predicted excluding attributes of ABPM data for Diabetes Mellitus (DM) patients with normotensive [6]. The study of [7] focus on the evaluation of Tp-e interval and Tp-e/QT ratio on ECG signal in hypertensive patients whereas [8] demonstrates that patients with non-dipper hypertension had significantly higher Neutrophil to lymphocyte ratio (NLR) and platelet to lymphocyte ratio (PLR) compared to dipper hypertension, which has not been reported previously. In a recent study, it was found that red cell distribution width (RDW) significantly increased in patients with non-dipper hypertension compared to the dipper hypertension. Inflammatory activity was closely related to RDW in non-dipper hypertensive. RDW, as an easy and quick measurable tool, can predict non-dipping pattern in essential hypertension [9]. All studies except the one conducted by Altikardes et al. [6], need longer time, higher costs and have difficulties in the diagnosis process and most importantly cannot be regarded as specific findings.
The ABPM procedure, which is an ordinary and non-invasive technique, has several difficulties:
• The patient should have at least two visits to the outpatient clinic or the office at the beginning and at the end of the monitorization.
• Handling devices for 24 hours is a discomfort process (changing clothes, inability in having a bath, uncomfortable sleep, etc.) and patients worry about it and live in a stress. This could have a negative impact especially on sleep-quality and could lead to the incorrect measurement of the blood pressure.
• ABPM causes high expenses to medical insurance companies and the state.
• These devices are both expensive and therefore, they are limited in numbers and not available in every occasion.
• There is also a shortage in trained staff who are experts in using these devices such as putting it on the patients, making data transfer operations and analysis. Both the training and employment of these staff require high costs.
In this context, together with Marmara University School of Medicine, Hypertension and Atherosclerosis Centre, we carried out a joint study to reach the following purposes: 1) to eradicate difficulties mentioned above, 2) to exclude the use of ABPM in diagnosis process of dipper/non-dipper pattern, and 3) to find out the feasibility of estimation of dipper/non-dipper pattern relying on the patients’ parameters obtained mainly from clinical examination and laboratory tests without ABPM measurements.
2.Materials and methods
In machine learning, three important points were addressed: The first one is Classification and it can be explained as an identifying process that a new data belongs to which category among all others. This identification was obtained from the training set of data containing observations whose classes were known. On the other hand, there is no consensus about how to classify any given data set. The immense majority of procedures for classification are numerical in nature.
The second one is the learning style used in the classification problem. In machine learning algorithms, mostly used learning styles are as follows: Supervised, Unsupervised and Semi-Supervised learnings. To make an exact decision which method ideal to classify in a most accurate way in a problem case is not easy. In this study, supervised style is preferred. Because the previously marked labels by physicians (medical expert) were identified as the most important factor in training. Here, the success criteria has been defined as getting the same label from the trained model as the medical expert did. In other words, it was not aimed to catch medical expert-induced mistakes.
The last point is generalization: Generalization is the ability of a learning machine algorithm to perform accurately on new, unrecognised, unseen examples after training with a different data set. So, producing sufficiently accurate predictions for new cases is the most critical task if the proposed model will be used especially in the medical area. Starting from a small part of concrete examples, how can a model that could be general enough to describe all cases be deduced and how can it be explained that the model has this descriptive capacity [10]? To evaluate the descriptive capacity of the proposed model, it is not sufficient to consider only accuracy metrics. For a better model, accuracies for Positives and Negatives should be considered separately. This situation reveals the need to evaluate other two metrics which are called Sensitivity and Specificity. Especially if the created model will be used in the medical area, it is required to pay more attention to False Positive and False Negative criteria.
When the literature was reviewed especially for medical informatics, it has been seen that the following algorithms were used to address these aforementioned problems: linear classifiers such as Logistic regression Fisher’s linear discriminant, Perceptron, Naive Bayes classifier, and non-linear classifiers such as J48-Decision trees, Multi-Layer Perceptron (MLP) and Radial Basis Function (RBF) of Artificial Neural Networks (ANN), and etc. [11, 12, 13, 14, 15, 16, 17, 18].
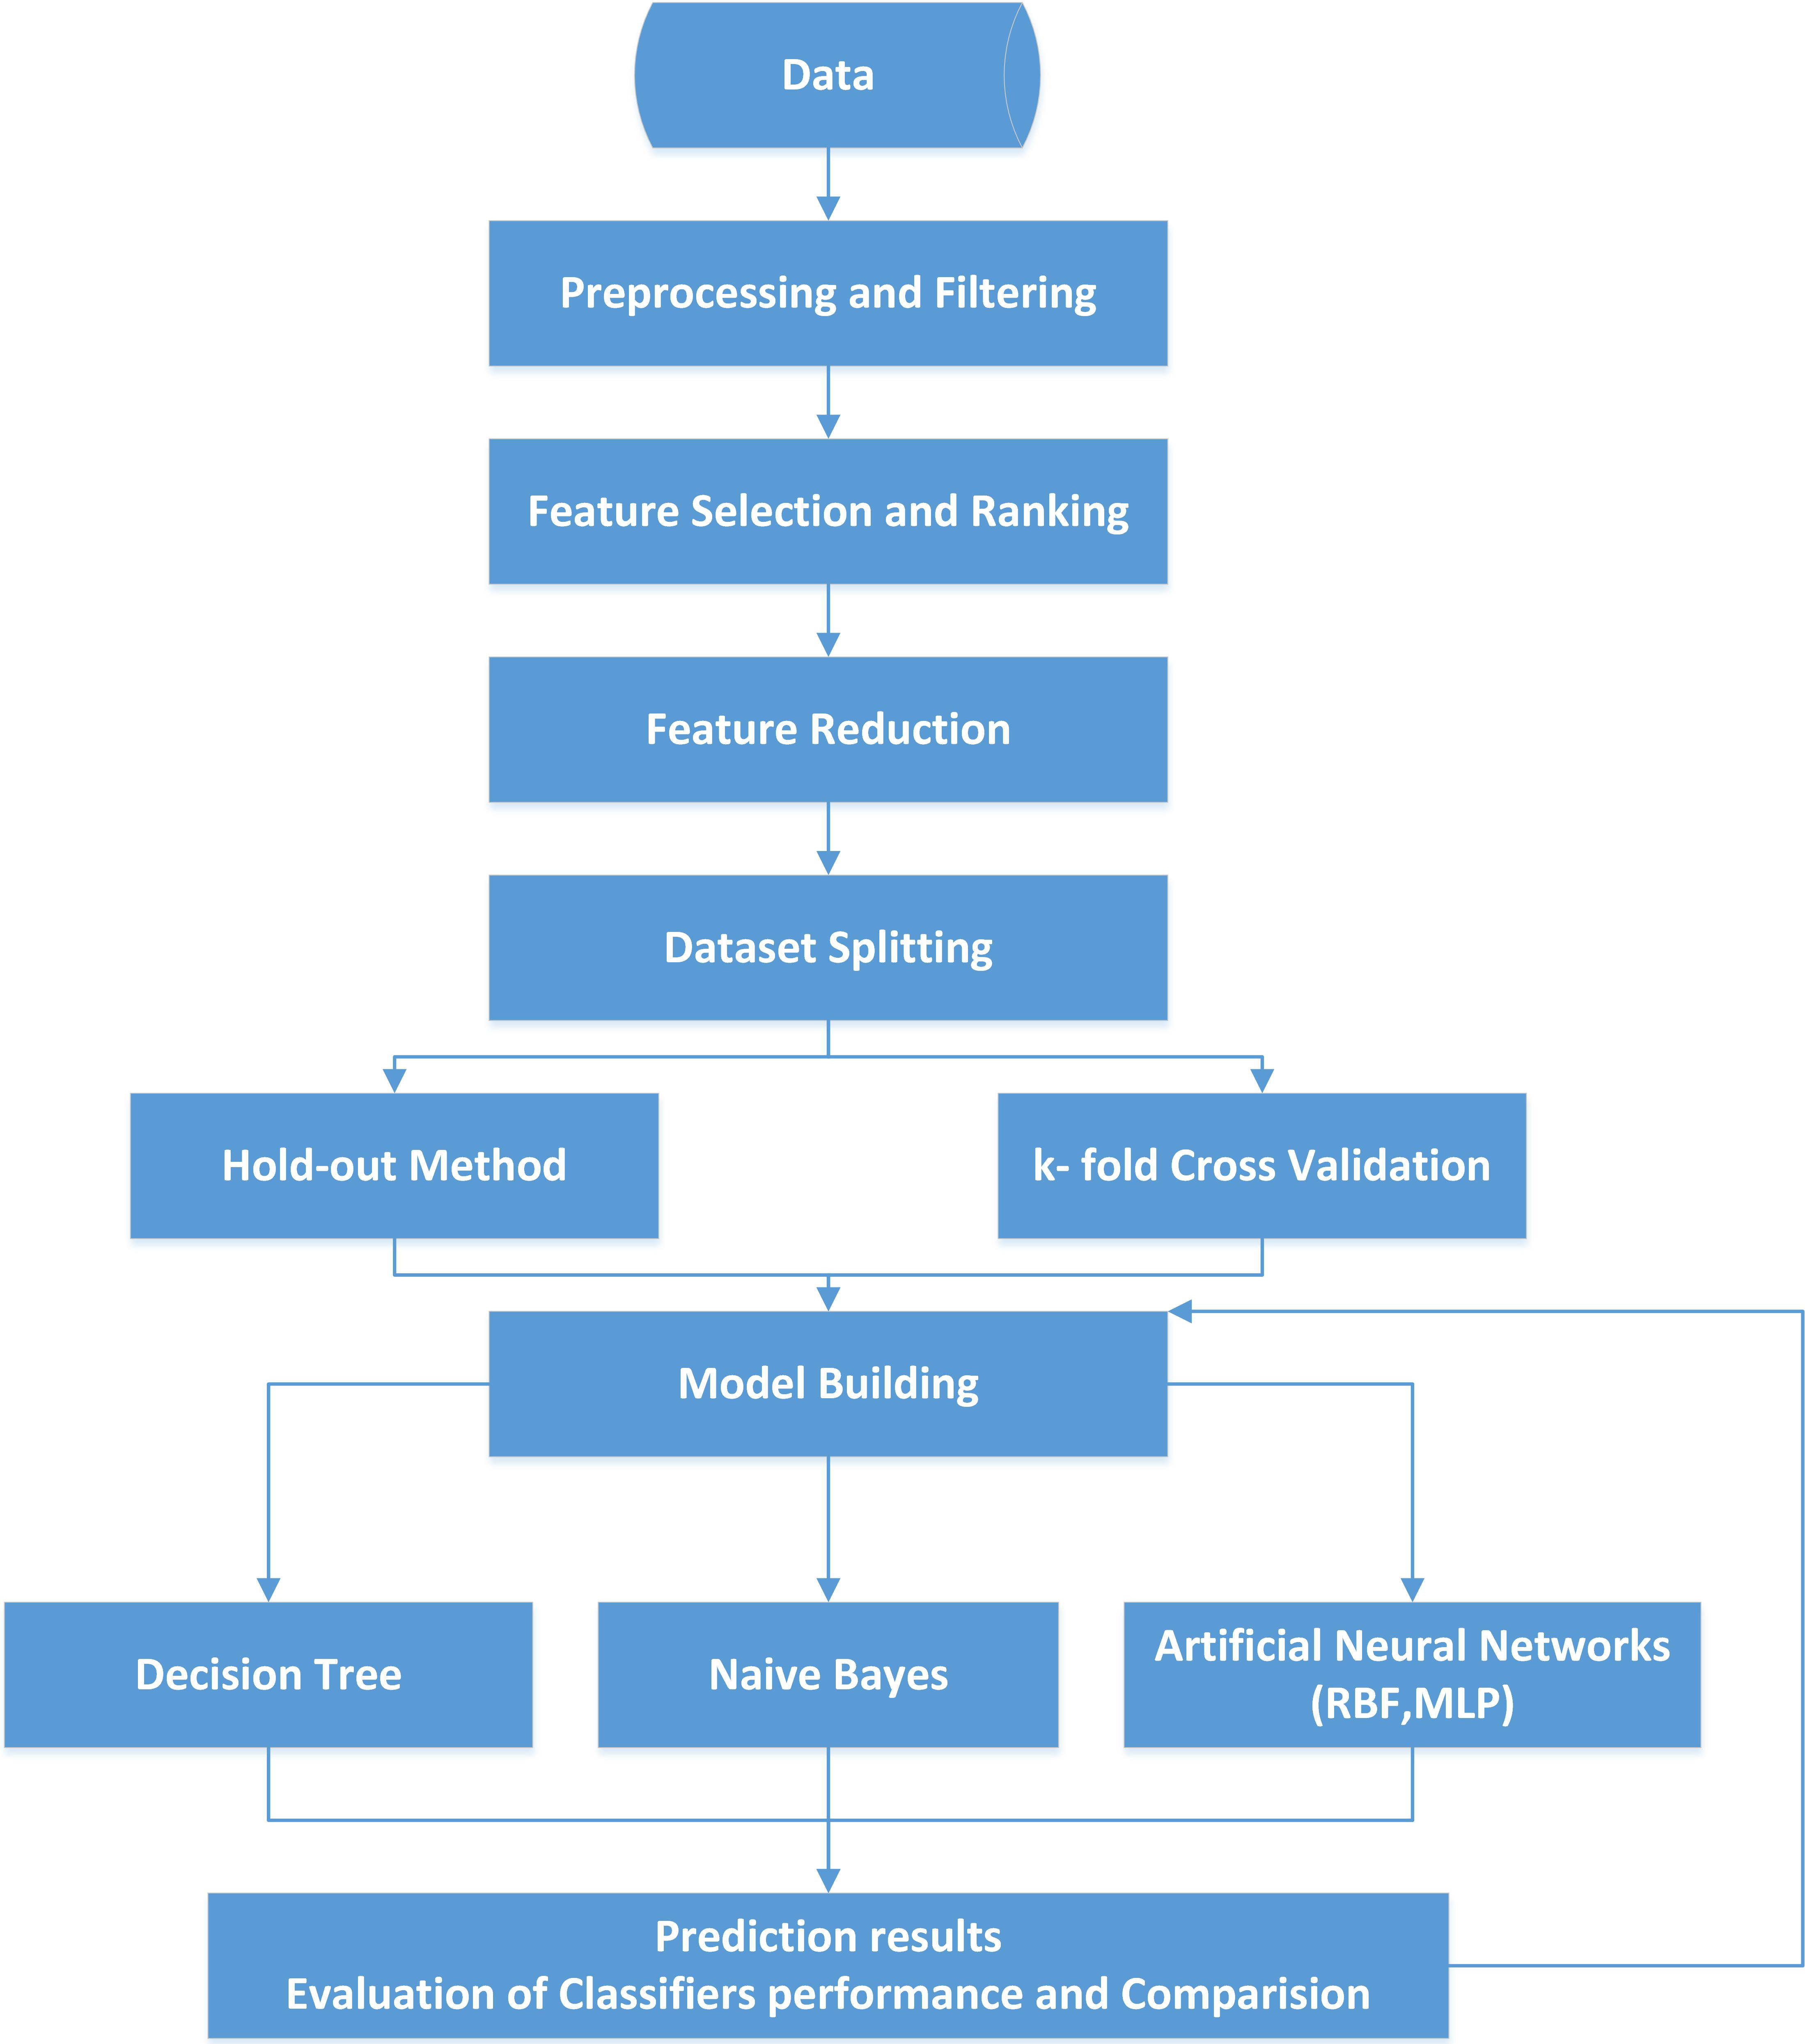
This study incorporates four algorithms (decision trees – J48, artificial neural network – MLP and RBF and Naïve Bayes). The goal of the study is to show that dipper/non-dipper pattern can be predicted as successful as in the previous works focusing on a different subject group by following the similar procedures (such as excluding the most relevant attributes). This work differs from our previously published papers in terms of patients’ characteristics. The previous papers have focused on the patients having T2 Diabetes with Normotensive. However, in this case, the focused group has the opposite characteristic (Non-Diabetic with hypertension). Thus, in the first step, the significance rankings of features were computed for various cases by different algorithms for feature selection on WEKA software. In the second step, the feature reduction process was performed by excluding ABPM data. In the third step, four different classification algorithms were set to run. At the next step, ratios of classifiers’ accuracy, sensitivity, and specificity were obtained to compare each other for all cases. The steps including the whole classification process can be seen in Fig. 1.
Figure 1.
Steps of the whole classification process.
2.1Data collection
The participants of this study are 29 patients in the Department of Internal Medicine at Marmara University Hospital. Required ethic approvals were provided by Ethics Committee in Faculty of Medicine in Marmara University (approval no: MAR-YÇ-2009-0166, date 90.09.2011-0108). All the required data were gathered for each patient in clinics and laboratories for four weeks. As shown in Table 1, the total number of attributes categorized under 4 sub-titles used in classification is 36. Participation criteria were to be 18+ years old non-user of antihypertensive medicines and to have normal office blood pressure. In the dataset, after patients’ data, as they had null values of some features, the total number is 24 and 17 of them has been labelled as dipper and 7 of them has been labelled as non-dipper.
Table 1
Attributes list used in dipper/non-dipper pattern classification
| All |
| ||||
| Demographic data | Gender | Male: 14 | – | – | |
| Female: 10* | |||||
| Age (years) | 52 | 16.27 | 4.13317E-14 | ||
| Height (cm) | 165 | 153.38 | 3.9685E-36 | ||
| Weight (kg) | 74.98 | 41.41 | 4.15355E-23 | ||
| WC (cm) | 103.17 | 51.95 | 2.38764E-25 | ||
| BSA (m | 1.82 | 74.30 | 6.65872E-29 | ||
| BMI (kg/m | 27.61 | 42.94 | 1.82379E-23 | ||
| Lab data-1 | Creatinin (mg/dlt) | 0.77 | 17.15 | 1.34602E-14 | |
| Fasting Glucose (mg/dlt) | 90.08 | 31.21 | 2.48758E-20 | ||
| CAN tests | V1 | 1.39 | 19.46 | 8.81416E-16 | |
| V2 | 1.40 | 20.78 | 2.08893E-16 | ||
| V5-6 | 1.37 | 15.98 | 6.03134E-14 | ||
| HRRR (pulse/minutes) | 9.96 | 14.06 | 8.78482E-13 | ||
| HRRV | 1.15 | 51.22 | 3.29551E-25 | ||
| HRREP | 0.71 | 7.56 | 1.11275E-07 | ||
| BPREP | 23.58 | 14.48 | 4.80794E-13 | ||
| BPdRGH | 1.27 | 10.20 | 5.25907E-10 | ||
| Ewing-Score | 0.85 | 5.70 | 8.27719E-06 | ||
| ECHO | SWth (mm) | 11.53 | 33.62 | 4.64797E-21 | |
| PWth (mm) | 10.17 | 33.00 | 7.10631E-21 | ||
| LVEDD (mm) | 48.69 | 50.11 | 5.41911E-25 | ||
| LVESD (mm) | 28.55 | 29.02 | 1.27564E-19 | ||
| ME (m/s) | 0.74 | 27.89 | 3.10749E-19 | ||
| MA (m/s) | 0.80 | 15.68 | 9.04375E-14 | ||
| MDT (m/s) | 175.38 | 21.25 | 1.28308E-16 | ||
| AoIVRT (m/s) | 99.62 | 12.75 | 6.5736E-12 | ||
| LVM (g) | 478.36 | 20.84 | 1.97588E-16 | ||
| LVMI (g/m | 264.1 | 19.67 | 6.95603E-16 | ||
| LA (mm) | 40.04 | 50.43 | 4.70003E-25 | ||
| Ao | 30.53 | 34.95 | 1.94456E-21 | ||
| ABPM | Dtsys (mmHg) | 138.04 | 35.18 | 1.66629E-21 | |
| Dtdias (mmHg) | 85.75 | 33.74 | 4.28955E-21 | ||
| Ntsys (mmHg) | 124.5 | 29.18 | 1.12329E-19 | ||
| Ntdias (mmHg) | 74.54 | 32.17 | 1.25423E-20 | ||
| sysD% | 9.84 | 6.86 | 5.4254E-07 | ||
| diasD% | 12.86 | 8.71 | 9.59975E-09 | ||
Data are given as mean
ABPM data was recorded with certain intervals automatically for 24 hours from all patients. Spacelabs Holter ABPM devices were used during the measurements. Blood pressure was recorded every 30 minutes during awake time and once an hour during sleep-time. 1) Systolic blood pressure (known as the blood pressure during the contraction of the heart), 2) diastolic blood pressure (known as the blood pressure recorded during the relaxation period of the heart) and 3) heart rate was recorded. Dipper and non-dipper pattern are derived as before regarding the ratio of decline in the sleep-time versus awake-time either systolic or diastolic blood pressure levels as seen on the most right column in Table 1.
Cardiovascular autonomic function tests (CAN): These tests were performed as described by Deyneli et al. in a previous study [19]. Briefly, heart rate or blood pressure changes were recorded in all study subjects during the following five tests:
1. Heart rate response during deep respiration (HRRR).
2. Heart rate response during Valsalva maneuver (HRRV).
3. Heart rate response upon achieving sudden erect position (HRREP).
4. Blood pressure response upon achieving sudden erect position (BPREP),
5. Diastolic blood pressure response during the handgrip test (BPdRHG).
Each test when normal is a given a score of 0, borderline 0.5 and abnormal 1. A final score was then achieved called the Ewing-score and CAN was accepted to be normal if Ewing-score was less than 1; abnormal if the score is in between 1 and 2; autonomic failure was accepted to exist if Ewing-score is greater than 2.
These CAN tests together with ECHO parameters were thought to act as predictors of “non-dipper” pattern as target organ predictors as well.
As seen in Table 1, some attributes are acquired from the echocardiogram device. These attributes include wall thickness, chamber sizes and filing properties of the heart and all are used in clinical anatomic size, shape and physiologic functions of the heart. The abnormalities of these attributes are accepted as findings of “hypertensive cardiac damage” in patients with hypertension.
2.2Data filtering
WEKA includes algorithms for learning different types of model, methods, feature selection schemes and pre-processing which is called as “Filter” [18, 20]. Collected dataset from patients was prepared to be processed by WEKA Explorer. As shown in Table 1, the number of attributes of entire data with ABPM was 36 at the beginning. All attributes’ data were numeric but only two attributes (Gender and HRREP) were transformed from nominal to binary by a pre-processing tool in WEKA software.
The dataset was split into two parts called as train and test data by using the the following methods: The first one is the ratio of train set and test set is 66% and 34% by default. The other one is the cross-validation (CV) method sometimes called rotation-estimation, is a model validation technique for assessing how the results of a statistical analysis will generalize to an independent data set. CV is accepted as a standard procedure for performance assessment and selection of the classifier model [21]. In k-fold CV, the original sample is randomly partitioned into k equal sized subsamples. When the relevant literature is reviewed, it seems that it is a general assumption to define k as 10. CV involves using
2.3Feature selection
Various attribute selection algorithms such as Best First, Greedy stepwise, Linear Forward Selection and Gain Ratio Attribute Eval-Ranker were run on WEKA Explorer Platform to emphasize the importance of ABPM data in classification as a primary purpose, and for secondary, to reduce the remaining data after excluding ABPM data. Both results showed that the Ewing-score and HRREP had the highest order after ABPM scoring.
Table 2
The highest four attribute scores
| Methods | Ranks % | |||
|---|---|---|---|---|
| Dias D% | Sys D% | HRREP | Ewing-score | |
| m1 | 70 | 59 | 23 | 15 |
| m2 | 100 | 100 | 80 | 30 |
| m3 | 100 | 100 | 80 | 30 |
| m4 | 100 | 100 | 80 | 30 |
| m5 | 77 | 61 | 28 | 17 |
Results of the attribute ranking algorithms are given in Table 2. Five different methods are run in this study as seen in Table 2.
Here:
m1 is an Attribute ranking run under from Information Gain Eval, m2 is Bestfirst ranking method, m3 is Linear Forward Selection method m4 is Greedy Stepwise method and m5 is a Ranker Search run under from Gain Attribute Eval. m2, m3, and m4 were chosen from CFs Subset Eval type.
Nevertheless, Classifier and CfsSubsetEval methods were selected for attribute evaluation algorithm. As seen in Table 2 even if the evaluation algorithm changes, the order of the ranks for given attributes does not change.
2.4Feature reduction
The novelty of the proposed method is to build up a model to classify dipper/non-dipper pattern by excluding ambulatory blood pressure measurement data. As seen in Table 2, the first two data daytime diastolic and daytime systolic blood pressure are ABPM data and the next highest rank belongs to Heart rate response upon achieving sudden erect position (HRREP). The next rank belongs to Ewing-Score. It is demonstrated that attribute ranking is not affected whether to use full training set or CV method for all attributes. Results are the same for both of them. The attribute ranks, which are close to 0, are not considered in Table 2 [13].
To find the correlation between the most distanced ones, attributes which are connected to each other were reduced to just one attribute. On the other hand, the selection and reduction processes (decreasing from 36 to 2) have been advanced by obtaining approval from the medical expert. In addition, the medical expert was evaluated the results and stated that remaining 2 data (HRREP and Ewing-score) shows consistency with medical facts for dipper/non-dipper classification [23].
3.Experiments and results
During the study, J48, Naïve Bayes, MLP, and RBF algorithms were performed singly in WEKA Classifier Interface. J48 algorithm is a simple C4.5 decision tree for classification. It creates a binary tree. The decision tree approach has the most useful one in classification problems [17, 18, 24]. The Naive Bayes algorithm is a simple probabilistic classifier that calculates a set of probabilities by counting the frequency and combinations of values in a given dataset [25]. Multi-Layer Perceptron (MLP) and Radial Basis Function (RBF) are the most popular algorithms in Artificial Neural Networks (ANN). The MLP can be trained by a back- propagation algorithm. The RBF, which is multilayer and feed-forward, is often used for strict interpolation in multi-dimensional space [6]. Experiments showed that the WEKA software set the number of neurons in the hidden layer to 2 automatically.
In addition, a user interface is developed to enter and store data in a local database and also to present the prediction results. After several trials conducted, it was seen that a sufficiently high accuracy percentage can be reached for prediction. Besides this knowledge, opinion and approval of a medical expert was taken, too. And finally, the number of attributes was reduced from 36 to 2 (Ewing-score and HRREP)
Performance evaluation parameters were calculated by using Eqs (1)–(3).
(1)
(2)
(3)
Table 3
Performance comparison of algorithms (before and after attribute reduction)
| Algorithms | Accuracy (%) | |||
|---|---|---|---|---|
| ABPM included | ABPM excluded | |||
| CV (k:10) | %66 Train set | CV (k:10) | %66 Train set | |
| J48 | 91.67 | 75.00 | 54.17 | 62.50 |
| Naïve bayes | 79.17 | 50.00 | 70.83 | 50.00 |
| MLP | 70.83 | 75.00 | 70.83 | 75.00 |
| RBF | 79.17 | 62.50 | 75.00 | 50.00 |
Table 3 shows the comparison of trials to indicate the significance of ABPM data. As seen in the table, the accuracy decreased when ABPM data were excluded for all algorithms except for MLP. MLP was found to have the most consistent results for each case. J48 has the highest accuracy when ABPM data were included although it has the lowest accuracy when ABPM data were excluded.
It was also emphasized that when the percentage split (66% for train set) was run for 2 attributes, all scores (accuracy, sensitivity, and specificity) were 100% for each algorithm. The reason why such a high score is obtained can be explained by the fact that the standard deviations and means scores of two attributes (Ewing-score and HRREP) are very close to each other as seen in Table 1. The second reason can be attributed to the number of patients involved in clinical trials. In order to avoid effects rising from limited number of patients, 10-fold CV was performed.
Table 4
Prediction performances after reduction
| Algorithms | Accuracy (%) | Sensitivity (%) | Specificity (%) |
|---|---|---|---|
| J48 | 75.00 | 71.00 | 76.00 |
| Naïve bayes | 79.16 | 71.00 | 82.00 |
| MLP | 87.50 | 71.00 | 94.00 |
| RBF | 83.33 | 71.00 | 88.00 |
Table 5
Comparison of diagnosed vs predicted results for MLP and RBF
| Patient | Diagnosis | Prediction | MLP probability | RBF probability |
|---|---|---|---|---|
| 1 | Non-dipper | Non-dipper | 1 | 0.954 |
| 2 | Dipper | Dipper | 0.8 | 0.886 |
| 3 | Non-dipper | Non-dipper | 0.642 | 0.815 |
| 4 | Non-dipper | Non-dipper | 1 | 0.954 |
| 5 | Dipper | Dipper | 1 | 0.886 |
| 6 | Dipper | Dipper | 0.8 | 0.886 |
| 7 | Dipper | Dipper | 0.8 | 0.886 |
| 8 | Dipper | Dipper | 0.633 | 0.840 |
As seen in Table 4, CV calculates the 1st cluster of parameters separately from the 2nd cluster parameters. The highest performance of classifiers is MLP after reduction of the features from 30 to 2. RBF, which has benefits of adaptive and self-learning capability, has the second highest performance.
The prediction results of MLP and RBF algorithms match well with diagnosis results of clinicians as seen in Table 5. In this table, it has been observed that although the probability of the prediction for each patient changes according to the algorithms used, the probability of non-dipper prediction consistently has the highest score.
4.Discussion
This study shows that it is feasible to develop a self-learning model with over 85% of accuracy to classify dipper/non-dipper pattern in hypertensive and non-diabetic patients by excluding ABPM data. Because a non-dipper pattern is a significant prognostic sign, it is accepted to be an important finding for decision making and ABPM is widely used as a clinical tool in hypertensive patients [26]. However, as mentioned earlier, although ABPM is a non-invasive method, it has practical challenges especially when considered sleep quality of the patient. There are some recent studies using new models to skip such problems, as dealed in [15, 27]. By using the proposed model, it is thought that the aforementioned challenges can be eliminated. The developed model offers to skip some procedures of diagnosis, in this way, to reduce the clinical costs by simplifying and accelerating the process. So, patients’ life quality can be preserved. All the demographic and clinical attributes (excluding Ewing-score and related attributes) included in our model actually were used in routine clinical practice by the physicians in each hypertensive patient.
In this study, four algorithms (J48, Naïve Bayes, RBF, and MLP) were run during the model development, and their performances were compared. ANN algorithms show higher classification metrics than other algorithms. However, there is no one solution in data mining. Because data mining is an experimental science, the highest scores on the focused problem will identify the best method. Concordantly, ANN shows to be the best algorithm for this particular problem of dipper/non-dipper classification in our study.
It has been discovered in the rankings of selection algorithms that the attributes have the highest ranks used in the models take place in ABPM data. It has also been identified that Ewing-score and HRREP attributes take part in each trial by models. The developed system also identified that the data was obtained by autonomic tests is important in determining of dipper/non-dipper pattern.
As a medical diagnosis, the harms of false negative (FN) are greater than false positive (FP) aforementioned before. This is why higher sensitivity performance is better than the specificity performance [28]. Physicians state that the rate of 70% is an acceptable limit for a diagnosis sensitivity in decision making [29].
5.Future works
The sensitivity score of all algorithms used in this study was the same. Since the success was mostly measured by the false negative (FN) rate, further studies will focus on improving the FN percentage. Other ANN algorithms such as Random Forest, Neuro-Fuzzy and probabilistic methods can be run to improve the reliability of the prediction. This study could be enhanced by gathering more data through increasing the number of patients and by considering the range of Ewing-score and HRREP data. On the other hand, it will also be beneficial if the focus is on development of a model to estimate dipper/non-dipper pattern by excluding the data which depends on physical activity such as autonomic dysfunction and orthostatic hypotension.
6.Conclusion
In this study, we developed a novel method to estimate dipper /non-dipper pattern without ABPM data and by reducing attributes. The technical aspects of the method are summarized as follows:
1. Accuracy is over 85%, Sensitivity is 71% and specificity is over 90%.
2. Compared to the traditional diagnosis method with ABPM, it requires fewer attributes just Ewing-score and HRREP, and it offers a fast and low-cost solution.
3. If supported by larger studies it could be applied to different diseases to predict risks like diabetes, cardiovascular, and it can be deployed to big data set, which needs feature reduction.
Acknowledgments
This work was supported by the Research Fund of Marmara University (Project no. FEN-C-DRP-110908-0225). This study was approved by the Ethics Committee in Faculty of Medicine in Marmara University (Approval no. MAR-YÇ-2009-0166, date 90.09.2011-0108).
Conflict of interest
The authors declare that there is no conflict of interest regarding the publication of this paper.
Abbreviations
| SWth | Left ventricular septal wall thickness |
| PWth | Left ventricular posterior wall thickness |
| LVEDD | Left ventricle end-diastolic diameter |
| LVESD | Left ventricle end-systolic diameter |
| ME | Mitral early flow |
| MA | Mitral late flow |
| MDT | Mitral deceleration time |
| AoIVRT | Aortic isovolumic relaxation time |
| LVM | Left ventricular mass |
| LVMI | Left ventricular mass index |
| LA | Left atrium |
| Ao | Aortic root |
| Dtsys | Awake time systolic blood pressure |
| Ntsys | Sleep time systolic blood pressure |
| Dtdias | Awake time diastolic blood pressure |
| Ntdias | Sleep time diastolic blood pressure |
| sysD% | The ratio of decline in the sleep-time versus awake-time systolic blood pressure |
| sysD% | |
| diasD% | The ratio of decline in the sleep-time versus awake-time diastolic blood pressure |
| diasD% |
References
[1] | Jozef Bulas MP, Ján M, Katarína K, Ján L, Martin Č. Central Systolic Hypertension in Patients with Well-Controlled Hypertension, BioMed Research International. (2017) ; 2017: : 10. doi 10.1155/2017/8158974 |
[2] | World Health Organization. Global Health Observatory (GHO) data. Raised blood pressure Situation and trends: World Health Organization; 2016 [Available from: http//www.who.int/gho/ncd/risk_factors/blood_pressure_prevalence_text/en/. [Accessed 9th May 2016] |
[3] | World Health Organization. A Global Brief on Hypertension: World Health Organization; 2013 [Available from: http://appswho.int/iris/bitstream/handle/10665/79059/WHO_DCO_WHD_2013.2_eng.pdf;jsessionid=4FA9DC8ED3ACC23D59908CA3ECE5B835sequence=1]. [Accessed 9th; May 2016] |
[4] | Davis KE. Expenditures for hypertension among adults age 18 and older. 2008: Estimates for the US civilian noninstitutionalized population. Medical Expenditure Panel Survey (Agency for Healthcare Research and Quality). (2011) : 2. |
[5] | Pickering T. The clinical significance of diurnal blood pressure variations. Dippers and nondippers. Circulation. (1990) ; 81: (2): 700-2. |
[6] | Altikardes ZA, Erdal H, Baba AF, Fak AS, Kokmaz H, editors. Performance evaluation of classification algorithms by excluding the most relevant attributes for dipper/non-dipper pattern estimation in Type-2 DM patients. Intelligent Systems Design and Applications (ISDA), 2015 15th International Conference on; 2015: IEEE. doi 10.1109/ISDA.2015.7489197 |
[7] | Demir M, Uyan U. Evaluation of Tp-e interval and Tp-e/QT ratio in patients with nondipper hypertension. Journal of the American College of Cardiology. (2013) ; 62: (18 Supplement 2): : C13. |
[8] | Sunbul M, Gerin F, Durmus E, Kivrak T, Sari I, Tigen K, et al. Neutrophil to lymphocyte and platelet to lymphocyte ratio in patients with dipper versus non-dipper hypertension. Clinical and Experimental Hypertension. (2014) ; 36: (4): 217-21. |
[9] | Özcan F, Turak O, Durak A, İşleyen A, Uçar F, Giniş, et al. Red cell distribution width and inflammation in patients with non-dipper hypertension. Blood Pressure. (2013) ; 22: (2): 80-5. |
[10] | Kodratoff Y. Introduction to machine learning: Elsevier, (2014) . |
[11] | Salama MA, El-Bendary N, Hassanien AE, Revett K, Fahmy AA, editors. Interval-based attribute evaluation algorithm. Computer Science and Information Systems (FedCSIS), 2011 Federated Conference on; (2011) : IEEE. |
[12] | Kannan SS, John SM, Sundaravadivel P, Ilangovan S, Kumar AVA. Performance evaluation of classification algorithms C4. 5 and SMO on Microarray gene-set data. International Journal of Research and Technology. (2013) ; 2: : 5. |
[13] | Ren W, Hu L, Zhao K, Chu J, Jia B. Intrusion classifier based on multiple attribute selection algorithms. JCP. (2013) ; 8: (10): 2536-43. doi. 10.4304/jcp.8.10.2536-2543 |
[14] | Parveen HHIaENSK AN. Performance analysis of unsupervised feature selection methods. 2012 International Conference on Computing, Communication and Applications; February, 2012: IEEE; (2012) . p. 1-7. |
[15] | Chaves HC, Valença M, de Souza FMC, editors. A constructive neural network for detecting left ventricular hypertrophy. Hybrid Intelligent Systems, 2005 HIS’05 Fifth International Conference on; 2005: IEEE. doi 10.1109/ICHIS.2005.4 |
[16] | Zheng J, Jiang Y, Yan H, editors. Committee machines with ensembles of multilayer perceptron for the support of diagnosis of heart diseases. Communications, Circuits and Systems Proceedings, 2006 International Conference on; 2006: IEEE. doi 10.1109/ICCCAS.2006.285080 |
[17] | Westra BL, Dey S, Fang G, Steinbach M, Kumar V, Oancea C, et al. Interpretable predictive models for knowledge discovery from home-care electronic health records. Journal of Healthcare Engineering. (2011) ; 2: (1): 55-74 doi 10.1260/2040-2295.2.1.55 |
[18] | Hijazi H, Chan C. A classification framework applied to cancer gene expression profiles. Journal of Healthcare Engineering. (2013) ; 4: (2): 255-83. doi 10.1260/2040-2295.4.2.255 |
[19] | Deyneli O, Ersöz H, Yavuz D, Fak A, Akalin S. QT dispersion in type 2 diabetic patients with altered diurnal blood pressure rhythm. Diabetes, Obesity and Metabolism. (2005) ; 7: (2): 136-43. doi 10.1111/j.1463-1326.2004.00378.x |
[20] | David SK, Saeb A, Al Rubeaan K. Comparative analysis of data mining tools and classification techniques using weka in medical bioinformatics. Computer Engineering and Intelligent Systems. (2013) ; 4: (13): 28-38. |
[21] | Ravi G, Ankush M, Kuldip S. A time-series-based feature extraction approach for prediction of protein structural class. EURASIP Journal on Bioinformatics and Systems Biology. (2008) ; 2008: (1): 235451. |
[22] | Refaeilzadeh P, Tang L, Liu H. Cross-Validation. In: Liu L, Özsu MT, editors. Encyclopedia of Database Systems. Boston, MA: Springer US; (2009) ; p. 532-8. doi 10.1007/978-0-387-39940-9_565 |
[23] | Altikardes Z. Expert system design to predict 24-hour ambulatory blood pressure features in Type-2 Diabetes Mellitus patients [R&D]. Istanbul, Turkey: Dissertation, Marmara University, (2012) . |
[24] | Dunham MH. Data mining: Introductory and advanced topics: Pearson Education India, (2006) . |
[25] | Dimitoglou G, Adams JA, Jim CM. Comparison of the C4. 5 and a Naïve Bayes classifier for the prediction of lung cancer survivability. arXiv preprint arXiv:12061121. (2012) . |
[26] | Bilgin D. Masked with and without hypertension hypertensive organ damage in patients with Type-2 Diabetes Mellitus [MD Dissertation]. Istanbul: Marmara University; (2010) . |
[27] | Magdás A, Szilágyi L, Belényi B, Incze A. Ambulatory monitoring derived blood pressure variability and cardiovascular risk factors in elderly hypertensive patients. Bio-Medical Materials and Engineering. (2014) ; 24: (6): 2563-9. doi 10.3233/BME-141071 |
[28] | Mena L, Gonzalez JA, Maestre G. Extracting new patterns for cardiovascular disease prognosis. Expert Systems. (2009) ; 26: (5): 364-77. doi 10.1111/j.1468-0394.2009.00498.x |
[29] | Fak AS. Medical interpretation of project results. In: Altıkardeş ZA, editor. Project Number: FEN-C-DRP-110908-0225. Istanbul: Marmara University; 2009-2012. |


