
Hybrid clustering based health decision-making for improving dietary habits
Abstract
BACKGROUND:
Humans supply a variety of nutrients to their body in dietary life, which are directly related to health. Chronic diseases are long accumulated in the body on account of heredity or living habits, and draw attention as a main issue in the era of disease-controlled longevity. Therefore, it is essential to make health care continuously through the improvement in dietary habits.
OBJECTIVE:
By recommending alternative food products whose diet and nutrition structure is similar to that of the food products positively influencing users’ health conditions, it is possible to satisfy user’s health and preference.
METHOD:
We used the hybrid clustering based food recommendation method that uses chronic disease based clustering, diet and nutrition ontology, diet and nutrition knowledge base. Active users are classified into the chronic disease based cluster that has the nearest euclidean distance. According to the classified clusters, food products are recommended to users, and similar food products are also recommended with the use of food clustering and knowledge base. Food products are clustered with the uses of k-means algorithm and food and nutrient data system. Based on the created food clusters and food preference data, diet and nutrition knowledge base is generated. It is composed of food cluster filter, food similarity filter, universal preference filter, and user feedback filter. The universal preference filter represents the similarity weight between diet and nutrition, and user preference. The user feedback filter has the similarity weight between active user preference and diet and nutrition. They continue to be updated through associated feedback.
RESULT:
The proposed health decision-making method takes into account each user’s health condition so that the method has more precision than an existing recommendation method. In addition, the proposed method brings about better evaluation results than a general user-by-user health context information based recommendation method.
CONCLUSION:
By recommending the food products related to users’ chronic diseases through the proposed hybrid clustering, it is possible to help out their healthcare. In addition, by letting users receive satisfying feedback flexibly, it is possible to improve their dietary habits.
1.Introduction
In today’s busy modern society, there are a growing number of people who prefer simple snacks and instant foods. Accordingly, it is becoming difficult to intake dietary nutrition for health. The obesity caused by instant and fast food products can lead to chronic diseases like diabetes, hyperlipidemia, and high blood pressure. A nutrient intake is one of the fundamental factors for human survival. Humans supply a variety of nutrients to the body in dietary life, which are directly related to health [1]. Improper dietary life causes physical problems in a short or long term. Today, with changes in living environments and family structure, more people need diet and nutrition management. The prevalence of chronic diseases such as diabetes, hypertension, and dyslipidemia due to obesity is continuously increasing due to erroneous dietary nutrition management. In addition, an increase in life expectancy, a change in lifestyles, and other factors have become the main causes of chronic diseases in overall society [2]. A health condition continuously changes depending on individuals’ healthcare habits. Chronic diseases are long accumulated in the body on account of on account of genetic or living habits, and receive attention as a main issue in the era longevity. Therefore, continuous health care through dietary life management is essential in the era longevity [1, 2, 3]. All food products include general functions according to which they are classified into the 1st, the 2nd, and the 3rd functions [4]. The 1st nutrition function is directly related to life and health maintenance. The 2nd function means the function according to humans’ preferences like smell, color, and taste. The 3rd function means the function of maintaining or improving through biological control. General food is basically the 1st food products, and are classified into rice, bread, noodle, soup, stew, grill, and fry by manufacturing types or main ingredients. Favorite food is the 2nd food products, and are classified into biscuit, beverage, and ice cake. Health food is generally referred to as the food products that do not require any approval or procedure for production or distribution and are considered to influence health positively. Health functional food, as the 3rd food products, includes functional ingredients according to a certain procedure based on rules [4, 5]. As such, human health has the close relationship with food products. In particular, it is necessary to manage the 1st and 2nd food product groups which mostly account for human food intakes. The extent to which certain foods affect their health in daily life has been passed along with folk medicine from past experience. This method universally gives positive effect on health. However, if it is misused or abused, it is possible to cause a problem. Particularly, humans with chronic diseases need an appropriate dietary therapy. For example, apple is found to positively influence health in terms of diet, enterokinesia, anti-ageing, respiratory diseases, heart diseases and diabetes. However, if you have skin diseases such as atopic dermatitis or eczema, you should be careful about intake them because they can cause the disease [6]. As such, taking in food products fitting one’s health condition is a critical issue in the era of disease-controlled longevity, and there has been much research and development in the medical science and healthcare areas. Human health conditions are changed by infinite causes so that it is hard to take into account all situations [7]. Accordingly, various methods of recommending food products personalized have been researched. Therefore, it is necessary to make continuous improvements in convergence of a universal method and an individual method in the healthcare area. Most people somewhat recognize their own health conditions or the health conditions that their acquaintances have. So they sometimes recommend or suggest some food products. In this case, it is likely that recommendation or suggestion will be applied in a meaningless, depending on the food preference of the person recommended [8]. So, it is important to improve appropriate dietary habits for users’ long-term healthcare. To improve users’ dietary habits that have been made for a long time, it is necessary to recommend diet and nutrition in consideration of their preference. Therefore, dietary nutrition recommendations that take into account user preferences are needed rather than merely recommending health-related diets. This study proposes the hybrid clustering based health decision-making for improving dietary habits.
The rest of this paper is organized as follows. Section 2 provides information on healthcare for medical decision-making and healthcare service for lifecare. Section 3 provides information on hybrid clustering based health decision making for improving dietary habits and Section 4 provides an evaluation. Finally, conclusions are given in Section 5.
2.Related work
2.1Healthcare for medical decision-making
The period and frequency of visits to medical institutions differ depending on individuals. People who suffer from similar diseases, such as flu, gastritis, enteritis, or chronic diseases can be guided in similar ways in terms of treatment, care, and prevention. For this reason, patients with similar disease can be prescription through classification.
Delias et al. [9] developed the medical care decision-making support model using log clustering. The developed model is able to cluster activity logs of patients, extract knowledge, and improve and monitoring process. Accordingly, the patients with similar activity are clustered and classified as related chronic diseases. In this way, it is possible to predict the workload per activity in association with an estimate of the statistical distribution of diseases. In addition, it is possible to give the medical staff the information to optimize the operation of medical guidelines. Based on a variety of information including the relations between activity and diseases, it is necessary to cluster them and extract useful information.
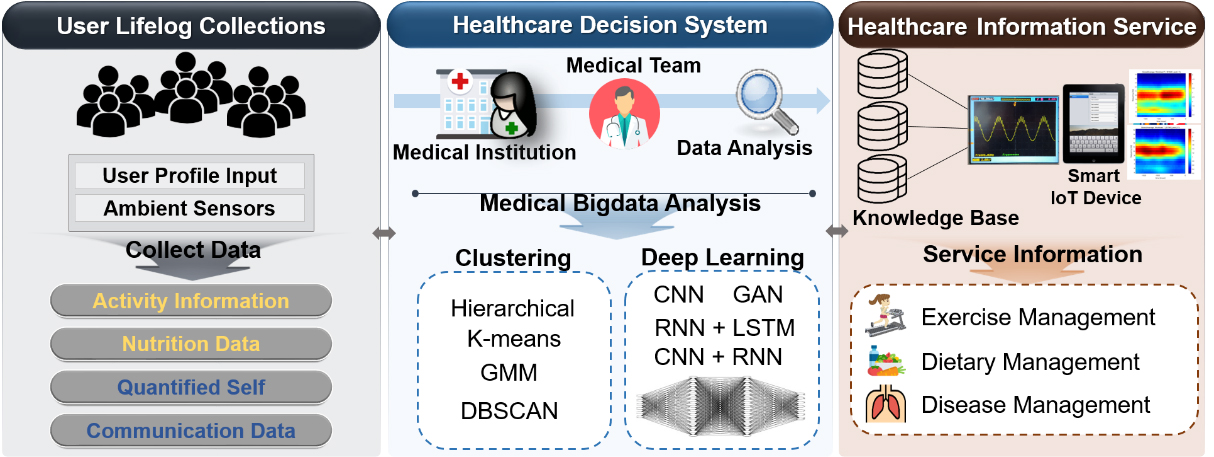
Figure 1.
Healthcare for medical decision-making.
Jenkins et al. [10] proposed the clustering method based on chronic obstructive pulmonary disease (COPD). The developed method clustered clinical test records of the adults with COPD. According to the clustering, the symptom of anxiety related symptom were found to be a common subject in a clusters of psychological symptoms. It is useful for managing the patients with different symptoms and making statistical approach. However, there were different results depending on the selection of analysis tools. Respiratory difficulty was found in the clusters with respiratory symptoms, but some had meaningless results from clustering. Accordingly, clustering the symptoms related to COPD and the factors influencing health is required to be consistent with a lapse of time.
For health decision-making, deep learning method, such as LSTM, CNN
In Fig. 1, users’ lifelogs are collected for medical decision-making. Lifelogs are activity information, nutrition data, self-measured data, and social data. The medical platform for health decision-making analyzes personal medical records with which medical staff show users’ health conditions. As analysis methods, clustering and such deep learning as CNN, RNN, Mask R-CNN, GAN, and RNN+LSTM are used. As the result of the analysis, knowledge base is generated, and a variety of health information including exercise management, dietary management, potential risk of diseases, and disease association, are provided to each user through ambient IoT devices.
2.2Health service for lifecare
In modern society, the number of people with chronic diseases increases due to westernized dietary habits, stress, and irregular lifestyles in their life. Therefore, it is necessary to improve improper dietary habits and manage diet and nutrition for the quality of healthy life. In addition, it is required to provide services to obtain reliable healthcare information easily. Accordingly, a variety of healthcare services are developed at country and abroad.
Welltizen [11] developed the calorie manager mobile service. The calorie manager provides in real-time information on calories and nutrition of the food products to take in through mobile. In addition, the service can manage customized diets for weight control by individual users. Nutrients are different depending on a food recipe. For this reason, the calorie manager provides limited information. Therefore, it is necessary to find a plan for providing the diets and nutrition of diverse recipes.
Asan Medical Center [12] provides health contents that general users and medical staff can easily understand. Medication Application offers drug information to patients and general users. In the service, users are able to search for prescribed drugs at hospital by name, shape, and color. In addition, drug efficacy, side effects, and other information are provided. In this way, it is possible to increase patients and general users’ reliability of prescribed drugs. The personalized application helps patients receive their history of diseases, test results, drug injection management information, and personal healthcare information. By letting chronic disease patients regularly enter their lifelog for their continuous management of diabetes, blood pressure, and weight, it is possible to provide their body mass index and disease information and help them care for health and diseases. Such application has the limitations of service hospitals and users. Therefore, it is necessary to develop the application with which everyone can receive medical service.
In Japan, SUZUKEN [13] provides a health creation service in which general users are able to receive dietary management support, health information, and hospital search results on their mobile for a healthy life. In addition, it offers such services as walking, personal health data collection, diet simulation, diary, body check, health questions, hospital search, and dietary information. It had the advantages of convenience and continuance, since it supports healthcare at any times and any places. Nevertheless, it still provides healthcare contents which are similar to those of other products so that differentiated services need to be offered. Figure 2 shows the configuration of context knowledge mining analysis for lifecare.
Figure 2.
Configuration of context knowledge mining analysis for lifecare.
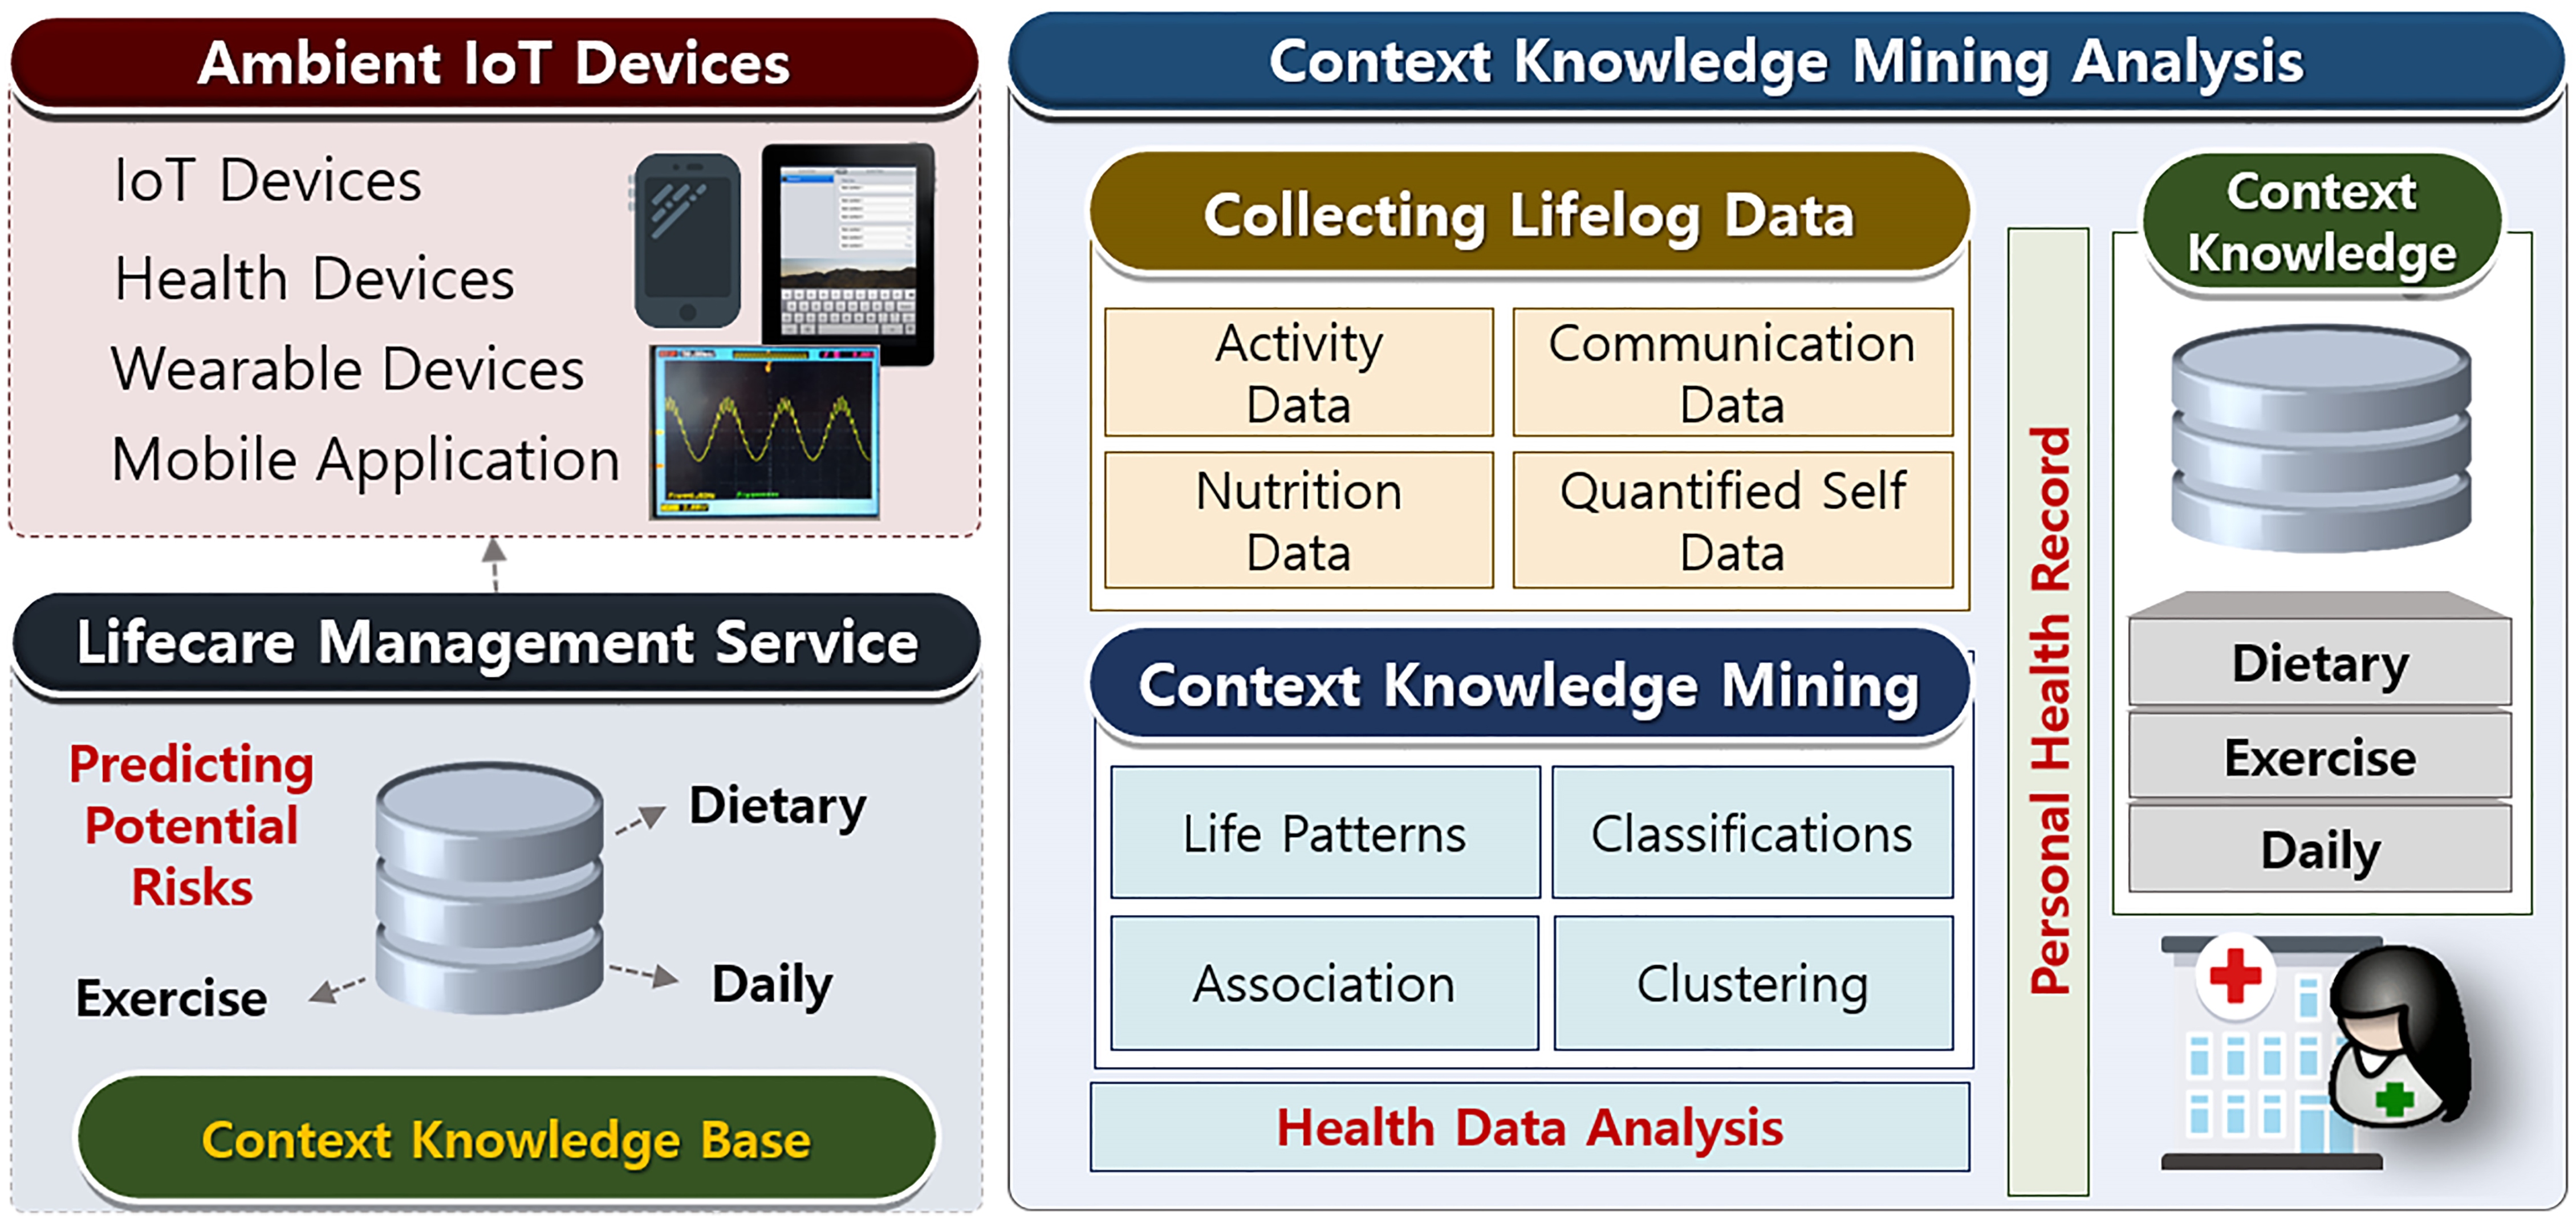
In Fig. 2, the lifecare service is had composition to three type: dietary management, exercise management, and daily management. It is through mobile applications and IoT based wearable devices, it is possible to collect and monitor lifelogs generated in everyday life. With the use of the collected data, pattern analysis, correlation analysis, and potential health risk analysis are conducted. As a result, a personalized service for dietary habit management and exercise management is offered depending on a user’s health condition. Users with high potential health risks can have medical examination and treatment at any times and any places through telemedicine. In addition, in terms of dietary habit management, a variety of information on food products, such as calories, nutrients, and recipes, can be offered differently depending on chronic diseases. In terms of exercise management, exercise effects of cycling, jogging, weighting, yoga, stretching, soccer, and others, and exercise guidelines are offered. In this case, weight, blood pressure, blood sugar, and sleep hours are monitored personalized to manage lifecare in a customized way. Given all, many different social issues, including ageing acceleration, rapidly rising medical cost, and poor medical infrastructure, are solved by telemedicine platform and healthcare solution.
3.Hybrid clusering based health decision-making for improving dietary habits
3.1Chronic disease clustering based dietary nutrition ontology
Appropriate dietary habits can be determined differently depending on personal health conditions, and it is necessary to take into account user’s chronic diseases. In order to analyze the correlations between dietary habits and chronic diseases, context knowledge mining is used so as to find the factors that positively influence health conditions. As for the health data of chronic diseases, the raw data [15] of National Health and Nutrition Examination Survey [14] are used. They include a variety of data about chronic diseases, including obesity, diabetes, dyslipidemia, and high blood pressure. In addition, with the use of information on weight, height, waist line, body mass index, fasting blood sugar, glycated hemoglobin cholesterol, regularity of heart rate variability, and pulse rate, it is possible to predict whether to have a chronic disease [15, 16]. Clustering can occur by extracting the characteristics and representative values though the context knowledge mining. Raw data has variety attributes of context information. In this study, the health data about typical chronic diseases, including obesity, diabetes, dyslipidemia, and high blood pressure, are preprocessed. Table 1 shows the properties of chronic disease data. It is possible to predict obesity with 5 attributes, diabetes with 3 attributes, dyslipidemia with 6 attributes, and high blood pressure with 13 attributes.
Table 1
Properties of chronic disease data [14]
| Disease | Properties | Description |
|---|---|---|
| Obesity | HE_ht | Height |
| HE_wt | Weight | |
| HE_wc | Waist circumference | |
| HE_BMI | BMI (Body mass index) | |
| HE_obe | Obesity prevalence | |
| 1. Low weight, 2. Normal, 3. Obesity | ||
| Diabetes | HE_glu | Fasting glucose |
| HE_HbA1c | Glycosylated hemoglobin | |
| HE_DM | Diabetes prevalence | |
| 1. Normal, 2. Fasting glucose insufficiency, 3. Diabetes | ||
| Dyslipidemia | HE_chol | Total cholesterol |
| HE_HDL_st2 | HDL cholesterol | |
| HE_TG | Triglyceride | |
| HE_LDL_drct | LDL-cholesterol | |
| HE_HCHOL | Hypercholesterolemia prevalence | |
| 0. None, 1. Yes | ||
| HE_HTG | Hypertriglyceridemia prevalence | |
| 0. None, 1. Yes | ||
| High blood pressure | HE_rPLS | Pulse regularity |
| HE_PLS | 15 second pulse rate | |
| HE_mPLS | 60 sec pulse rate | |
| HE_nARM | Blood pressure measuring arm | |
| HE_sbp1 | Primary systolic blood pressure | |
| HE_dbp1 | Primary diastolic blood pressure | |
| HE_sbp2 | Secondary systolic blood pressure | |
| HE_dbp2 | Secondary diastolic blood pressure | |
| HE_sbp3 | Third systolic blood pressure | |
| HE_dbp3 | Tertiary diastolic blood pressure | |
| HE_sbp | Final systolic blood pressure | |
| HE_dbp | Final diastolic blood pressure | |
| HE_HP | Hypertension prevalence | |
| 1. Normal, 2. Pre-Hypertension, 3. Hypertension |
In this study, we used
Table 2
Chronic disease characteristics of each cluster according to properties
| Cluster | C1 | C2 | C3 | C4 | C5 | C6 | C7 | C8 | C9 | C10 | C11 | |
|---|---|---|---|---|---|---|---|---|---|---|---|---|
| Obesity | Low weight |
|
|
|
|
|
|
|
|
|
|
|
| Normal |
|
|
|
|
|
|
|
|
|
|
| |
| Obesity |
|
|
|
|
|
|
|
|
|
|
| |
| Diabetes | Normal |
|
|
|
|
|
|
|
|
|
|
|
| Fasting glucose insufficiency |
|
|
|
|
|
|
|
|
|
|
| |
| Diabetes |
|
|
|
|
|
|
|
|
|
|
| |
| Dyslipidemia | Normal |
|
|
|
|
|
|
|
|
|
|
|
| Abnormality |
|
|
|
|
|
|
|
|
|
|
| |
| High blood pressure | Normal |
|
|
|
|
|
|
|
|
|
|
|
| Pre-hypertension |
|
|
|
|
|
|
|
|
|
|
| |
| High blood pressure |
|
|
|
|
|
|
|
|
|
|
| |
With the uses of the characteristics of clusters and the diet and nutrition service ontology [18], food products are recommended to each cluster. The diet and nutrition service ontology has the relations between chronic diseases and food products. With the service ontology, it is possible to recommend the food products for nutrition therapy, nutrition treatment, and dietary therapy which are helpful to chronic disease patients. It expresses that the food products analyzed by persons with socially experimental knowledge or researchers positively or negatively influence chronic diseases. With the use of the rules inferred from the diet and nutrition service ontology, it is possible to recommend diet and nutrition and guidelines which are expected to give positive influence to the health of each cluster. Figure 3 shows the diet and nutrition service ontology [18, 19].
Figure 3.
Diet and nutrition service ontology.
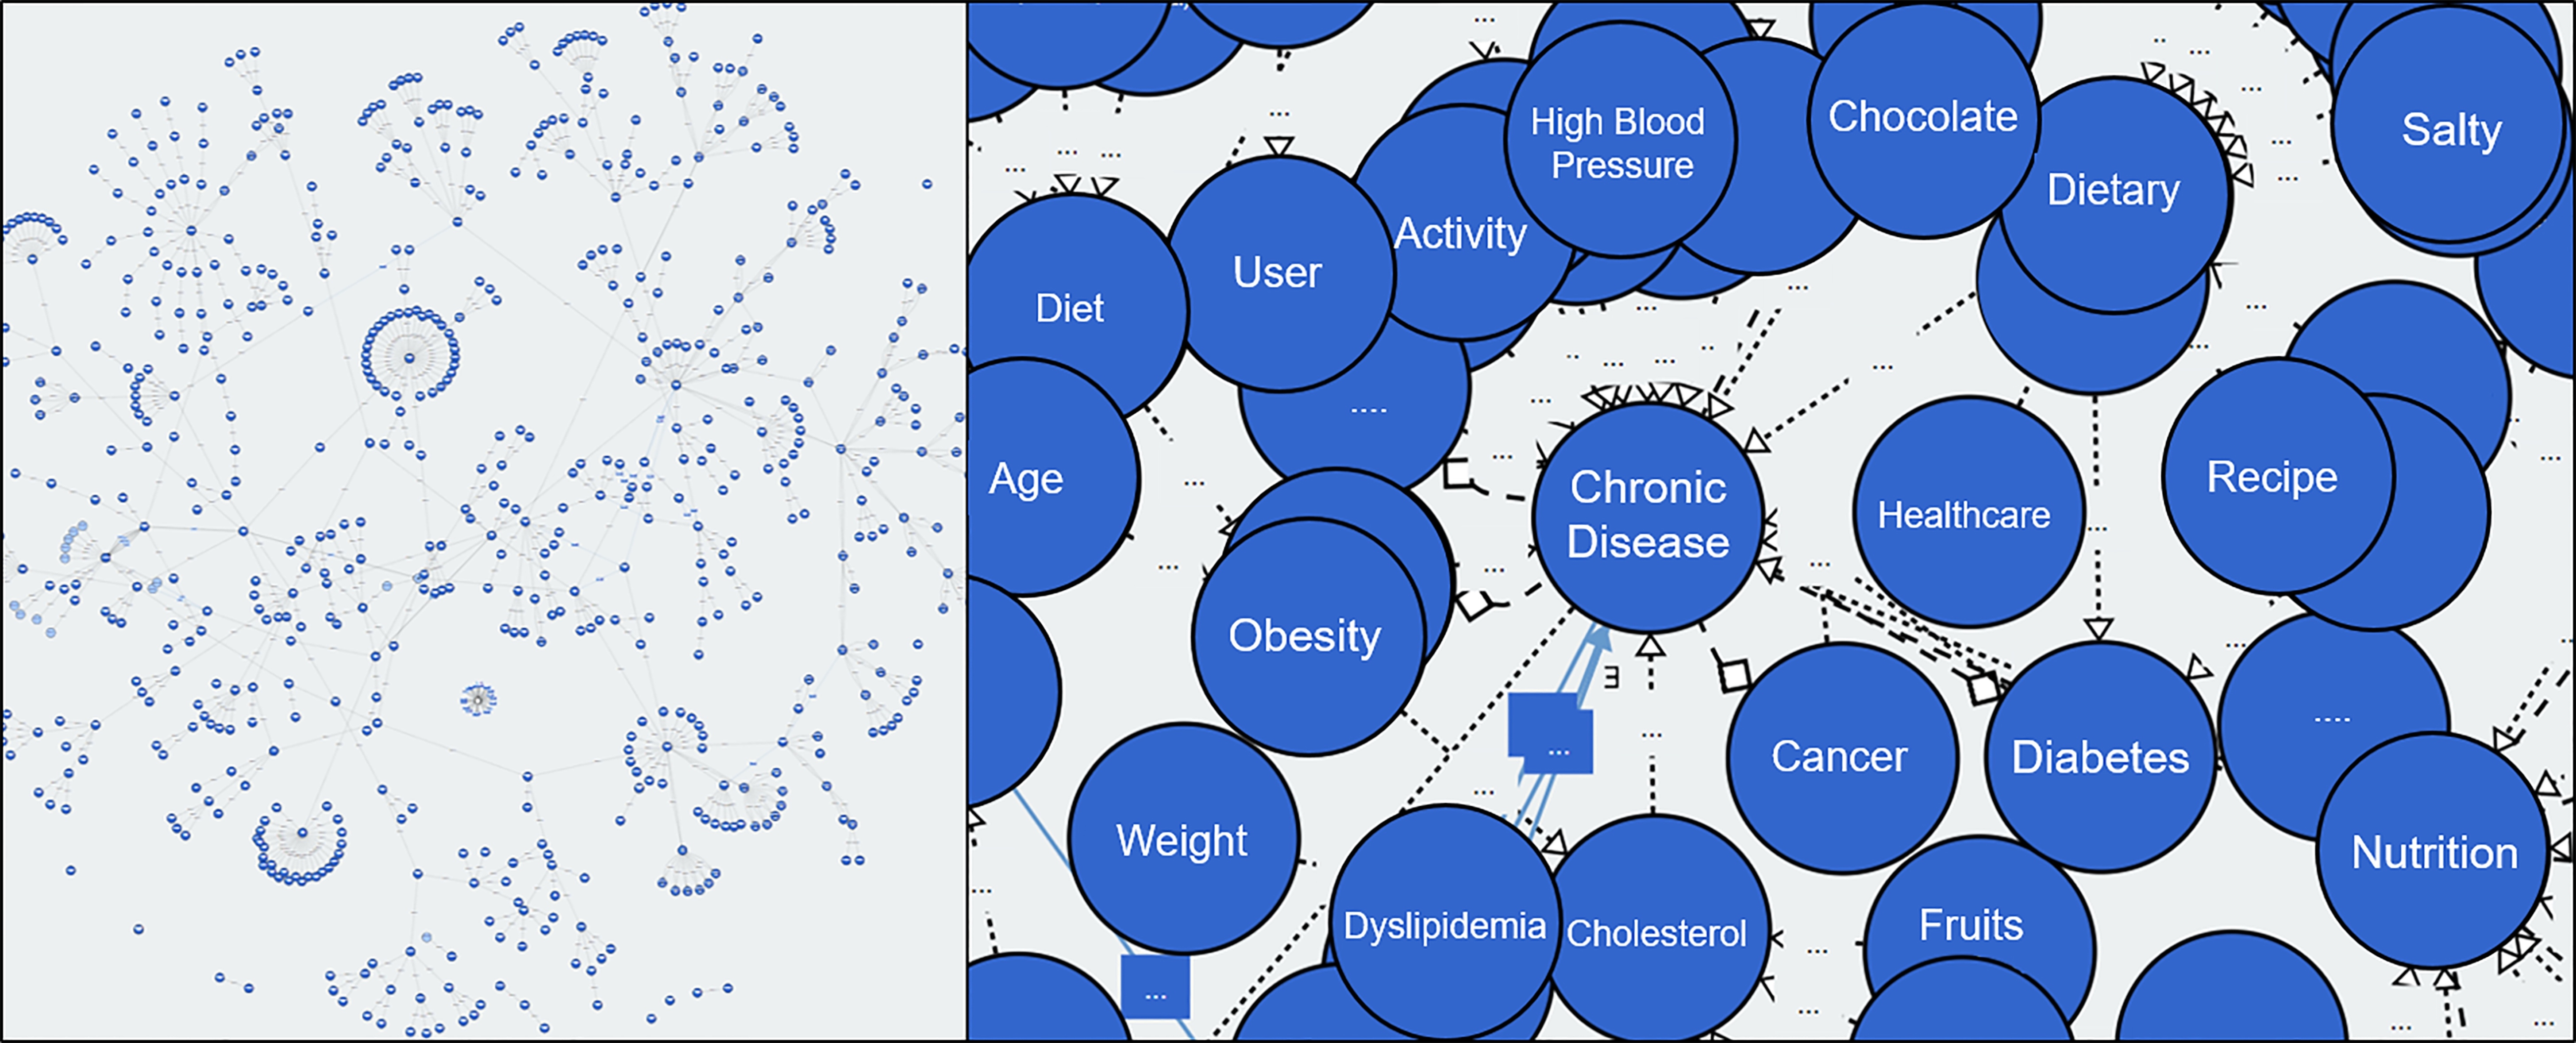
In Fig. 3, an objective is classified into Class and Property. With the use of the relations between class and class, and between class and property, a variety of information on food products, diet and nutrition, and health condition is presented. The diet and nutrition service ontology expresses the complicated relation between class and property with the uses of health context and diet and nutrition information.
3.2Classification of chronic disease patients according to health status
Based on the clusters of chronic disease data, it is possible to classify the clusters which have the most similarity with active users. In other words, with the use of similarity scale, the cluster that has the closest with an active user’s property value becomes the user’s cluster. As similarity scale, euclidean distance is used. An euclidean distance [20, 21] represents the distance between two properties, which can easily be measured two-dimensionally or three-dimensionally. The smaller the value is, the closer two properties are and the more they have similarity. Active users are classified with the cluster that has the nearest euclidean distance value. Table 3 shows cluster classification of users on the basis of euclidean distance. In the table, User1 has the nearest distance with the cluster C3. User1 is classification into the cluster C3. As shown in Table 2, the person is highly likely to have normal weight in terms of obesity, fasting glucose insufficiency of diabetes, abnormal dyslipidemia, and normal blood pressure. It means that the classified users have the prevalence of chronic diseases mainly found in clusters or have the high possibility of prevalence. Accordingly, with the use of diet and nutrition service ontology [18], it is possible to recommend users to the food products customize the chronic diseases mainly found in their cluster. In this way, it is possible to drawn the dietary habit that positively influences a particular user’s health condition. In fact, this is the stereotypical food recommendation method that fails to consider a user’s preference. Therefore, an active user has difficulty maintaining the recommended diet or food intake, often. Accordingly, a user’s preference is additionally taken into account through chronic diseases clustering, the diet and nutrition service ontology, and food clustering based hybrid clustering.
Table 3
Cluster classification of users on the basis of euclidean distance
| Cluster | C1 | C2 | C3 | C4 | C5 | C6 | C7 | C8 | C9 | C10 | C11 |
|---|---|---|---|---|---|---|---|---|---|---|---|
| User1 | 87.5 | 75.5 | 52.0 | 73.8 | 217.2 | 58.5 | 82.3 | 75.8 | 84.3 | 254 | 272.5 |
| User2 | 29.9 | 53.4 | 46.1 | 71.2 | 195.8 | 68.2 | 30.9 | 49.3 | 68.6 | 244.7 | 249.6 |
| User3 | 59.7 | 59.9 | 52.0 | 60.7 | 141.8 | 71.1 | 52.9 | 60.0 | 76.2 | 195.2 | 195.7 |
| User4 | 146.7 | 99.5 | 133.8 | 95.4 | 107.6 | 124.4 | 135.2 | 130.5 | 92.9 | 137.4 | 328.5 |
| User5 | 44.0 | 96.9 | 75.0 | 112.3 | 229.0 | 101.0 | 54.4 | 71.4 | 116.4 | 283.9 | 283.6 |
| User6 | 572.6 | 542.1 | 552.8 | 526.6 | 383.0 | 548.9 | 564.6 | 559.0 | 537.3 | 341.1 | 328.5 |
| … | … | … | … | … | … | … | … | … | … | … | … |
3.3Food cluster according to dietary composition
Food intakes are directly related to health in everyday life [1]. Appropriate food intakes help to supply essential nutrients for physical activity. Food products are classified into general food, health food, and health functional food by manufacturing type, main ingredients, and use. General food means the food products taken basically in everyday life. It has the highest intake frequency in human life so that managing general food leads to healthcare. The components of food include calorie, carbohydrates, proteins, fats, sugars, and sodium. Although food products have different ratios of components depending on ingredients, they share common factors. Chronic diseases need to be cared for continuously, and accordingly, appropriate nutrient intakes are of importance [1, 2, 3, 4, 5, 6]. It is hard or easy to take food products helpful for health promotion depending on users’ preference. Therefore, it is necessary to recommend alternative food whose nutrition structure is similar to that of the food for user’s health promotion [8]. In conventional data, food is classified into rice, soup, grilled food, braised food, and other types of food by main ingredients and recipes. A food product has a calorie and such contents as carbohydrates and proteins fats differently depending on the ratio of main ingredients and sub ingredients. Therefore, the classification method does not include diet and nutrition. To analyze the diet and nutrition components of food products, groups of similar food products are clustered. For the data for clustering, the food and nutrient database [23] provided by the portal site of Food Safety Korea [22] is used. It consists of 4,577 food data, and particular food products have representative values of regions, which can be considered to be data duplication. In this study, such duplication is unnecessary for clustering food products and, therefore, 3,153 food data are clustered without duplication. A food product can have different diet and nutrition depending on its one-time offering amount. To analyze how much components of food products are similar, calories (kcal) are applied to the normalization of 1,000, equally, and then cluster analysis is conducted with the use of
Table 4
Food product clusters on the basis of components of diet and nutrition
| Cluster | Item | Carbohydrate | Protein | Fat | Sugars | Natrium | Cholesterol | Saturated fat | Trans fat |
|---|---|---|---|---|---|---|---|---|---|
| 0 | 137 | 100.82 | 51.78 | 43.92 | 16.03 | 1713.06 | 38.48 | 20.82 | 0.13 |
| 1 | 43 | 149.76 | 48.23 | 23.55 | 51.93 | 17528.02 | 21.38 | 2.71 | 0.05 |
| 2 | 66 | 213.33 | 12.88 | 12.25 | 183.85 | 376.09 | 152.36 | 5.40 | 0.02 |
| 3 | 38 | 36.92 | 149.26 | 28.83 | 7.04 | 6292.32 | 869.80 | 6.19 | 0.27 |
| 4 | 13 | 40.85 | 145.07 | 28.43 | 4.25 | 5724.99 | 1935.57 | 6.59 | 0.13 |
| 5 | 243 | 102.47 | 15.65 | 60.72 | 66.97 | 437.55 | 285.79 | 32.65 | 0.50 |
| 6 | 94 | 76.28 | 74.71 | 46.07 | 3.78 | 2677.87 | 20.49 | 2.13 | 0.05 |
| 7 | 91 | 0.67 | 15.94 | 0.87 | 48.24 | 563.11 | 0.00 | 38.71 | 0.00 |
| 8 | 127 | 0.45 | 24.93 | 4.42 | 20.87 | 1418.21 | 0.00 | 9.06 | 0.00 |
| 9 | 129 | 2.09 | 55.98 | 9.90 | 12.74 | 915.10 | 0.00 | 6.83 | 0.00 |
| 10 | 266 | 0.22 | 53.23 | 0.56 | 14.10 | 1560.48 | 1.79 | 18.57 | 0.00 |
| … | … | … | … | … | … | … | … | … | … |
| 24 | 171 | 204.22 | 24.80 | 19.33 | 28.85 | 1717.01 | 30.60 | 2.87 | 0.42 |
| Full data | 3152 | 62.70 | 40.64 | 20.54 | 32.58 | 1666.06 | 89.85 | 15.96 | 0.14 |
3.4Knowledge base-based healthcare for improving dietary habits
The diet and nutrition knowledge base includes weights for recommending the food products customized each user’s health condition and their similar food products. It has four filters. Through each filtering, the final food products are recommended to users. Figure 4 shows the structure of the diet and nutrition knowledge base. As filters, there are food cluster filter, food similarity filter, universal preference filter, and user feedback filter.
Figure 4.
Structure of diet and nutrition knowledge base.
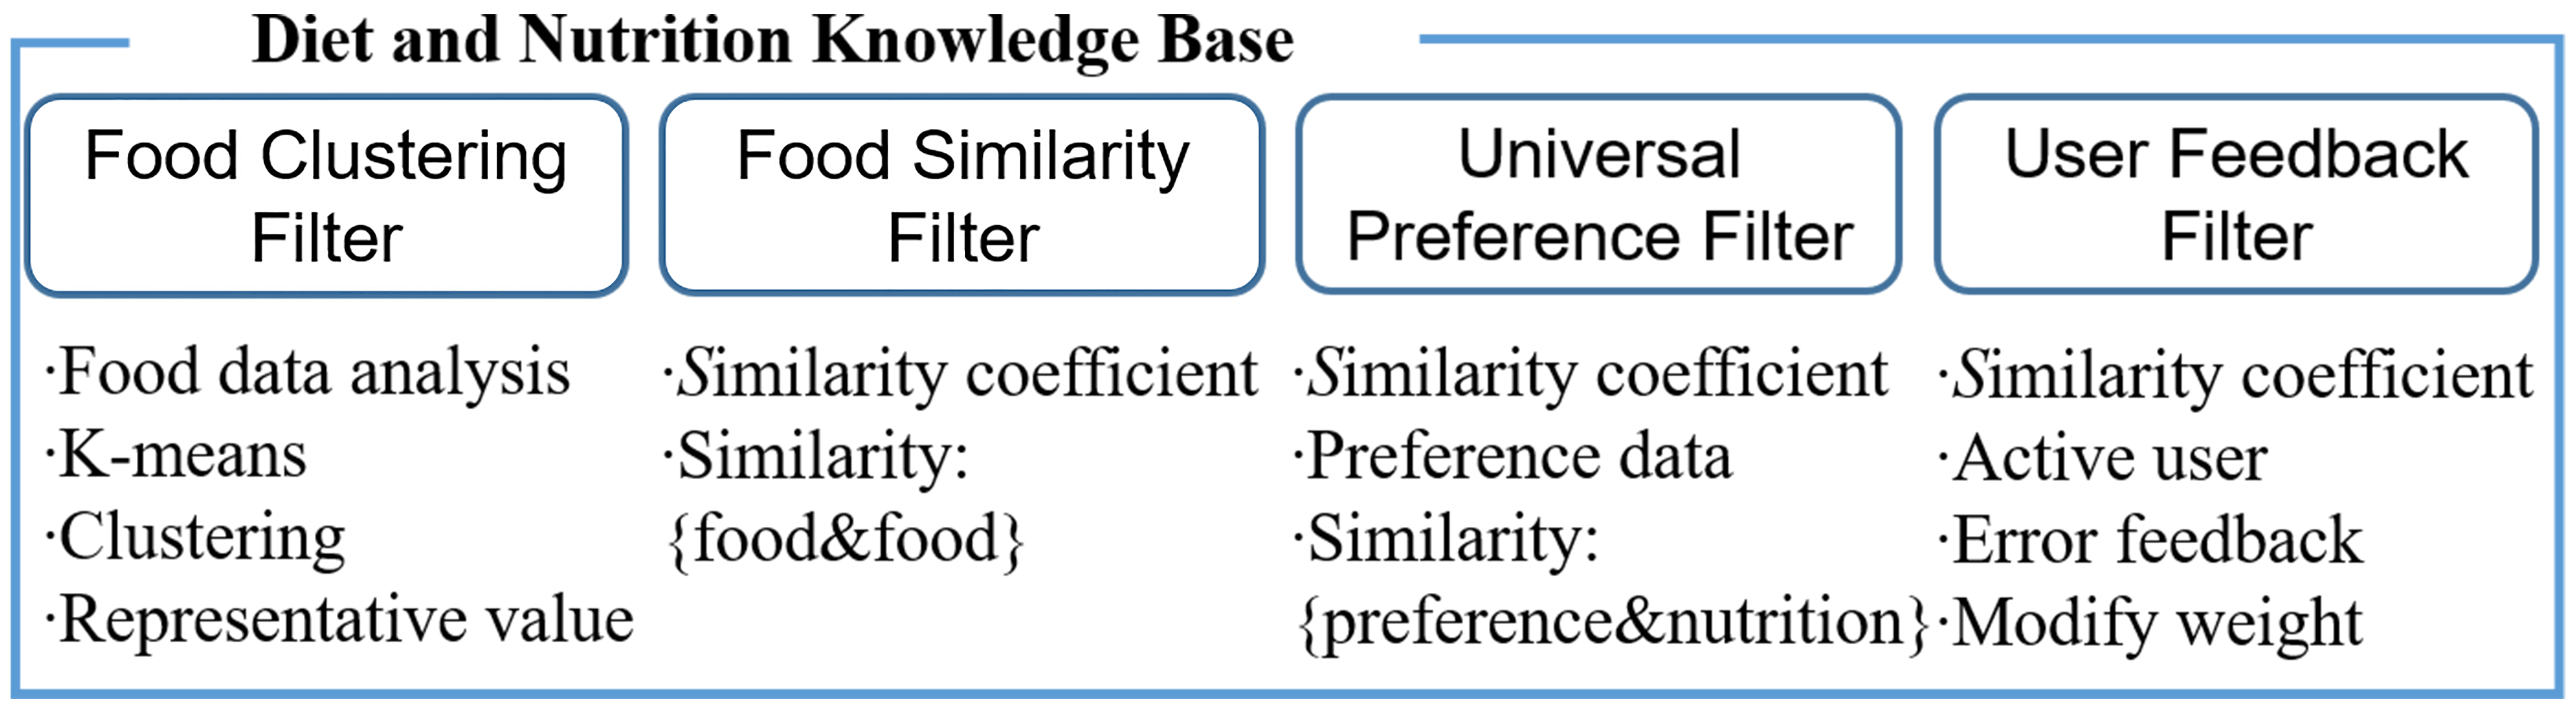
The food cluster filer means the representative value of the 25 food product clusters classified by the components of the diet and nutrition (Table 4). The food similarity filter means the filter of a similarity coefficient between food products in each one of 25 clusters. As a similarity coefficient, Pearson correlation coefficient (also known as Pearson’s
(1)
Table 5
Evaluation results of precision and average preference
| Method | HCbFR | RbFR | CFbFR | CbFR |
|---|---|---|---|---|
| RMSE | 0.681 | 0.910 | 0.662 | – |
| Average preference | 4.113 | – | – | 2.914 |
The universal preference filter is the preference weight for the food products that Korean people mainly have in their everyday life according to a questionnaire survey. The preference data for the universal preference filter is based on the preference of Korean people’s representative food products collected in the survey [25, 26]. The data are collected from 197 persons who gave answers with sincerity among 250 questionnaire participants in the online and offline environments. Of the 3,940 preference data of 20 food products evaluated by 197 participants, 2,758 (70%) are used in order to make a preference filter, and the rest (30%) is used for performance evaluation. With the use of the preference for food products in the collected data, it is possible to predict users’ preference on the basis of food components. A Pearson’s
(2)
In the Eq. (2), the relation between diet and nutrition and preference is calculated. And then, collaborative filtering is applied to the calculated result in order to predict user’s universal preference for new food products. The Eq. (3) presents the collaborative filtering for predicting food preference. In the equation,
(3)
The user feedback filter means the preference weight filter continuously updated through active user’s recommendation and feedback. It presents the preference weight of the food product evaluated by an active user, which is also found in the universal preference filter [29, 30, 31]. The user feedback filter displays the goodness-of-fit of each recommended alternative food, and lets the model adjust their weight in order for the next recommendation. With the use of the Eq. (2), the initial weight is calculated in the same way as the universal preference. An active user and the weight of the diet and nutrition property are presented with
(4)
4.Evaluation
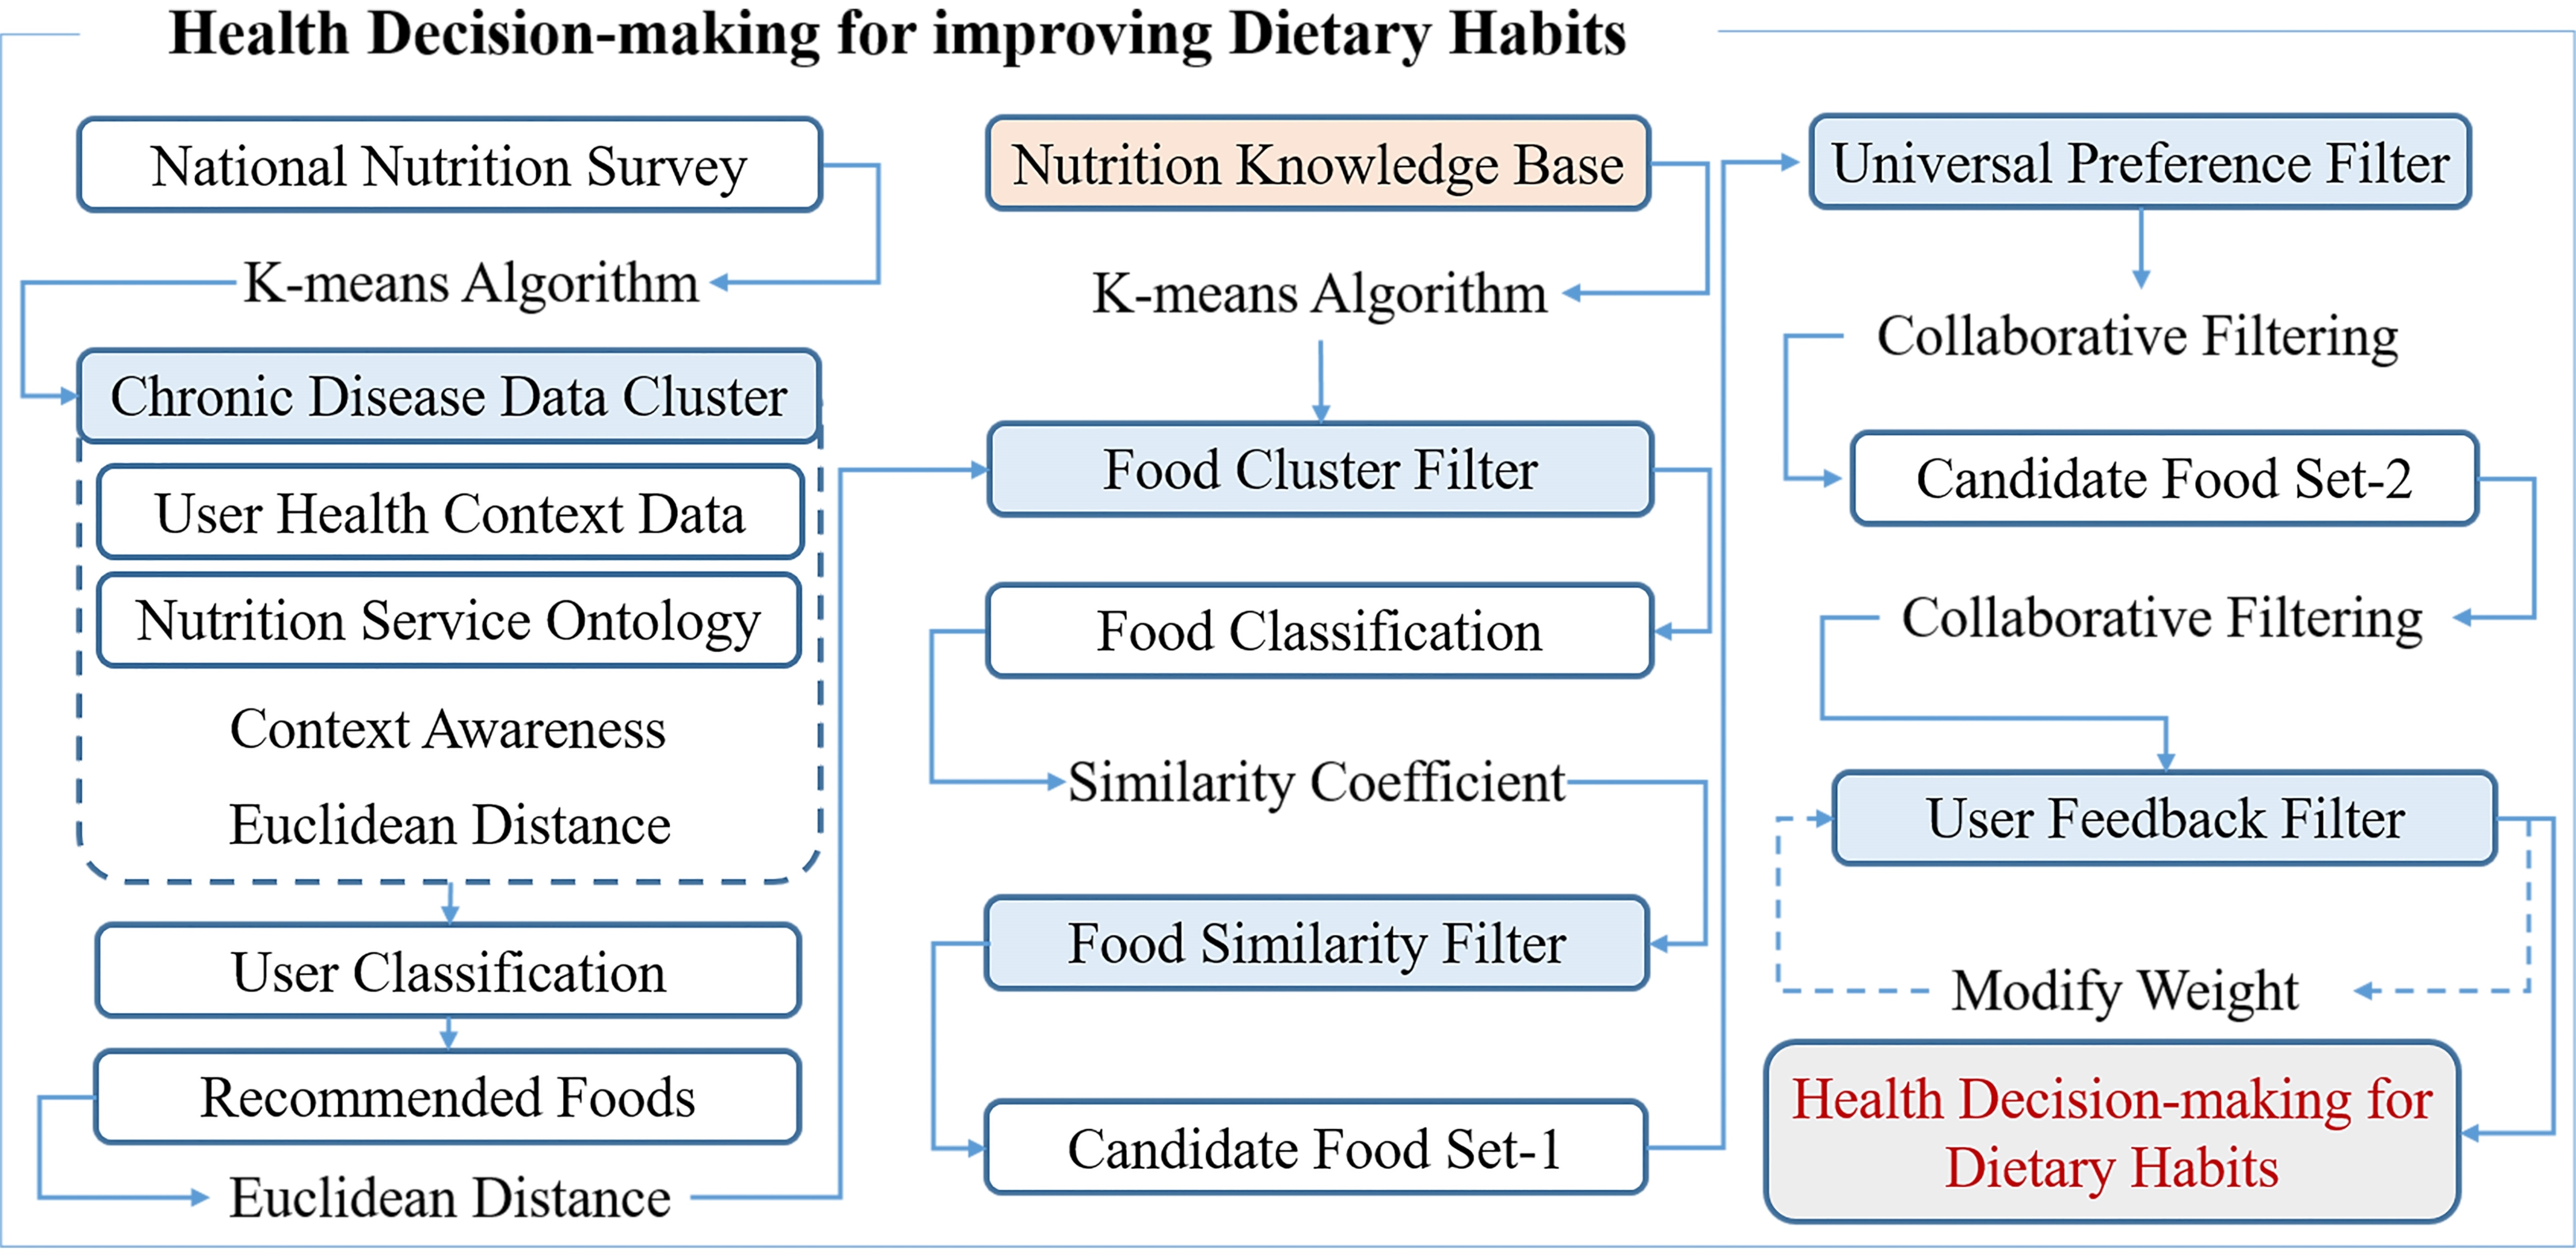
The proposed hybrid clustering based health decision-making for improving dietary habits makes use of user clustering, classification, ontology, food clustering, and similarity coefficient in the diet and nutrition knowledge base. It recommends food products after user classification and food preference prediction. Hybrid clustering utilizes the diet and nutrition service ontology for user classification and food preference prediction so as to connect multiple clusters. In user classification, active user data for 27 properties in National Health and Nutrition Examination Survey are entered. The active user data are classified into clusters based on similarity with the uses of disease clustering and euclidean distance [31, 32]. For food preference prediction, the diet and nutrition service ontology is utilized in order to select the recommend food products for classified active user clusters as candidate food. Four filters of the knowledge base are applied to the selected food products. Food cluster filter utilizes euclidean distance in order to find the food cluster of recommended food products. Based on the classified food products, the food products that have a similar diet and nutrition structure are searched for with the use of Pearson’s
Table 6
RMSE according to feedback counts
| Feedback counts | 0 | 5 | 10 | 15 | 20 | 25 |
|---|---|---|---|---|---|---|
| RMSE | 0.672 | 0.668 | 0.676 | 0.671 | 0.665 | 0.658 |
Figure 5.
Hybrid clustering based health decision-making for improving dietary habits.
For the performance of the proposed method, precision and average preference are evaluated. To evaluate precision, RMSE (Root Mean Square Error) based error rate is analyzed. RMSE is used to evaluate the error variation of a predictive value, and to measure a difference between an actual value and a predictive value [33, 34]. The smaller RMSE value, the more precision. The Eq. (5) presents RMSE. In the equation,
(5)
The preference data used for evaluation are 1,182 food preference data after the exception of 2,758 data (70%) from the already collected food preference data [25]. For the evaluation of precision, the proposed hybrid clustering based food recommendation (HCbFR) is compared with regression based food recommendation (RbFR) and collaborative filtering based food recommendation (CFbFR) in terms of RMSE. RbFR makes use of a simple regression model to predict a user’s preference for recommended food. CFbFR utilizes similarity coefficients of users in order to present the predictive error of an active user’s preference. Average preference is evaluated differently depending on the selection method of recommended food. The proposed method is compared with cluster based food recommendation (CbFR). Based on user clusters and the diet anmd nutrition service ontology, CbFR presents the preference for recommended food. Table 5 shows the evaluation results of precision and average preference. As shown the evaluation results, the preference error between the proposed method and CFbFR is the lowest. CFbFR fails to take into account users’ health conditions. CbFR recommends food products without consideration of users’ food preference so that user’s overall food preference is low.
The proposed method continuously updates the weights of similarity through user feedback filter, and evaluates according to the count of user feedback. The proposed model is applied to 20 healthcare empirical subjects, and five food products are recommended to each one. This process is performed five times repeatedly. Table 6 shows RMSE according to the feedback count. According to the evaluation, precision can be less depending on recommended food, but the error rate tends to decrease with a rise in the feedback count.
5.Conclusions
This study proposed the hybrid clustering based health decision-making for improving dietary habits. Hybrid clustering combines user clusters and food clusters with the use of the diet and nutrition service ontology. The proposed method makes use of the hybrid clustering to recommend food products in consideration of user’s health conditions and their food preference. For chronic disease based clustering, 27 properties are selected from the raw data of National Health and Nutrition Examination Survey, and then users are clustered. To recommend food products in consideration of chronic diseases, user clusters and the diet and nutrition service ontology are used. To satisfy user preference, food products are clustered and then recommended products and the products whose diet and nutrition is similar to that of the recommended ones are selected. In this food recommendation method, users can have difficulty following the method, given their usual living habits or food preference. Accordingly, by recommending alternative food products whose diet and nutrition structure is similar to that of the food products recommended in the ontology, it is possible to induce users to manage their diet and nutrition appropriately. For food clustering, the additional operations in diet and nutrition knowledge base are taken into account, and the
Acknowledgments
This research was supported by the MSIT (Ministry of Science and ICT), Korea, under the ITRC (Information Technology Research Center) support program (IITP-2018-0-01405) supervised by the IITP (Institute for Information and Communications Technology Planning and Evaluation). Additionally, this work was supported by Kyonggi University’s Graduate Research Assistantship 2019.
Conflict of interest
None to report.
References
[1] | Leech R, Worsley A, Timperio A, McNaughton S. Understanding meal patterns: Definitions, methodology and impact on nutrient intake and diet quality. Nutrition Research Reviews (2015) ; 28: (1): 1-21. |
[2] | Kim S, Chung K. Emergency situation monitoring service using context motion tracking of chronic disease patients. Cluster Computing (2015) ; 18: (2): 747-759. |
[3] | Wen L, Yang S, Lee B. Cloud platform based mobile service for aging generation healthcare management. International Journal of Multimedia and Ubiquitous Engineering (2016) ; 11: (11): 235-246. |
[4] | Santiago-Rodriguez T, Cano R, Jiménez-Flores R. Potential applications of metagenomics to assess the biological effects of food structure and function. Food and Function (2016) ; 7: (10): 4160-4169. |
[5] | Green H, Siwajek P, Roulin A. Use of nutrient profiling to identify healthy versus unhealthy snack foods and whether they can be part of a healthy menu plan. Journal of Nutrition and Intermediary Metabolism (2017) ; 9: : 1-5. |
[6] | Chiauzzi E, Rodarte C, DasMahapatra P. Patient-centered activity monitoring in the self-management of chronic health conditions. BMC Medicine (2015) ; 13: (1): 77. |
[7] | Subramaniyaswamy V, Manogarna G, Logesh R, Vijayakumar V, Chilamkurti N, Malathi D, Senthilselvan N. An ontology-driven personalized food recommendation in IoT-based healthcare system. The Journal of Supercomputing (2018) ; 1-33. |
[8] | Mozar A, RushikeshChonde S, SangramJadhav D. Recipe recommendation using ingredient recognition. International Journal of Current Trends in Science and Technology (2017) ; 7: (12): 20517-20519. |
[9] | Delias P, Doumpos M, Grigoroudis E, Manolitzas P, Matsatsinis N. Supporting healthcare management decisions via robust clustering of event logs. Knowledge-Based Systems (2015) ; 84: : 203-213. |
[10] | Jenkins A, Athilingam P, Jenkins A. Symptom clusters in chronic obstructive pulmonary disease: A systematic review. Applied Nursing Research (2019) ; 45: : 23-29. |
[11] | Weltizon, http://www.welltizen.com/. Accessed 15 Jan 2019. |
[12] | Asan Medical Center, http://eng.amc.seoul.kr/. Accessed 2 Feb 2019. |
[13] | SUZUKEN, https://www.suzuken.co.jp/. Accessed 16 Jan 2019. |
[14] | KCDCP ((2018) )Korea Centers for Disease Control and Prevention (online), http://www.cdc.go.kr/CDC/eng. Accessed 29 Jan 2019 |
[15] | National Nutrition Survey, https://knhanes.cdc.go.kr/. Accessed 29 Jan 2019. |
[16] | Kadziński M, Greco S, Slowinski R. Selection of a representative value function in robust multiple criteria ranking and choice. European Journal of Operational Research (2012) ; 217: (3): 541-553. |
[17] | Yu S, Chu S, Wang C, Chan Y, Chang T. Two improved K-means algorithms. Applied Soft Computing (2018) ; 68: : 747-755. |
[18] | Jung H, Chung K. Knowledge-based dietary nutrition recommendation for obese management. Information Technology and Management (2016) ; 17: (1): 29-42. |
[19] | WebVOWL: Web-based Visualization of Ontologies, http://vowl.visualdataweb.org/. Accessed 5 Feb 2019. |
[20] | Huang A. Similarity measures for text document clustering. Newzealand Computer Science Research Student Conference (2008) ; 19-56. |
[21] | Horrbet E, Ottaviani G, Sturmfels B, Thomas R. The euclidean distance degree of an algebraic variety. Foundations of Computational Mathematics (2016) ; 16: (1): 99-149. |
[22] | Ministry of Food and Drug Safety, https://www.foodsafetykorea.go.kr/. Accessed 5 Jan 2019. |
[23] | Yoon MO, Lee HS, Kim K, Shim JE, Hwang JY. Development of processed food database using Korea National Health and Nutrition Examination Survey Data. Journal of Nutrition and Health (J Nutr Health) (2017) ; 50: (5): 504-518. |
[24] | Kim N, Park S, Lee J, Choi J. Load profile extraction by mean-shift clustering with sample pearson correlation coefficient distance. Energies (2018) ; 11: (9): 2397. |
[25] | Lee I, Jung S, Hong G. An analysis on nutrition knowledge level and food preference according to the food-related lifestyle tendency-focus on housewives in the Seoul and Gyeonggi area. Journal of the Korean Society of Food Culture (2016) ; 31: (1): 33-41. |
[26] | Mentaschi L, Besio G, Cassola F, Mazzino A. Problems in RMSE-based Wave model validations. Ocean Modelling (2013) ; 72: : 53-58. |
[27] | Liang Z, Zhang G, Huang J, Hu Q. Deep learning for healthcare decision making with EMRs. IEEE (2014) ; 556-559. |
[28] | Yoo H, Chung K. Heart rate variability based stress index service model using bio-sensor. Cluster Computing (2018) ; 21: (1): 1139-1149. |
[29] | Kim J, Chung K. Depression index service using knowledge based crowdsourcing in smart health. Wireless Personal Communication (2017) ; 93: (1): 255-268. |
[30] | Kim JC, Chung K. Prediction model of user physical activity using data characteristics-based long short-term memory recurrent neural networks. KSII Transactions on Internet and Information Systems (2019) ; 13: (4): 2060-2077. |
[31] | Chung K, Yoo H. Blockchain network based topic mining process for cognitive manufacturing. Wireless Personal Communications (2019) ; 105: (2): 583-597. |
[32] | Kim JC, Chung K. Mining based time-series sleeping pattern analysis for life big-data. Wireless Personal Communications (2019) ; 105: (2): 475-489. |
[33] | Kim JC, Chung K. Mining health-risk factors using PHR similarity in a hybrid P2P network. Peer-to-Peer Networking and Applications (2018) ; 11: (6): 1278-1287. |
[34] | Yoo H, Chung K. PHR based diabetes index service model using life behavior analysis. Wireless Personal Communications (2017) ; 93: (1): 161-174. |


