
The pulmonary damage caused by smoking: A longitudinal study
Abstract
BACKGROUND:
Smoking for a long period is known to cause several harms to the human body, chiefly associated with serious pulmonary damage.
OBJECTIVE:
The purpose of this study was to evaluate the difference in the pulmonary damage between current smokers and ex-smokers, through measuring the bronchial parameters and the extent of emphysema, in order to further illustrate the harm of smoking and the need to stop smoking.
METHODS:
Using the FACT-Digital lung TM software quantitatively analysis of CT images, including the WT, WA%, LD, LV, PD, and %LAA-950 was performed. The percentage of low attenuation areas less than -950 Hounsfield units (%LAA-950) was defined as the extent of emphysema. The longitudinal data in the two consecutive years of these current smoker group and ex-smoker group were compared by paired t-test.
RESULTS:
The LV, %LAA-950, WT and WA% of current smokers increased more rapidly each year than that of ex-smokers. The PD and LD of current smokers declined more rapidly each year than that of ex-smokers.
CONCLUSIONS:
This study shows that pulmonary damage caused by smoking related to the smoking status, can be measured. Smoking cessation has a positive role in alleviating the progress of pulmonary damage.
1.Introduction
Numerous respiratory diseases are associated with prolonged exposure to hazardous substances, especially closely related to smoking. Due to the long-term stimulation by the harmful substances in tobacco, the airway, and lung tissue chronic inflammatory response increase year by year, resulting in airway wall thickening, stenosis, emphysema and other damage, thereby leading to the elastic retraction of the lung, and limiting airflow to a varying degree. Unceasing smoking is known to not only increase the airway inflammation and airway remodeling but also makes patients less sensitive to glucocorticoid therapy [1]. There is no other more known effective method for lung protection among the smokers, other than the cessation of smoking [2, 3]. Many prospective studies have shown that the lung function in the smokers improves after quitting smoking, the most commonly used indicator was FEV1% (forced expiratory volume in one second, FEV1) [4]. In this study, the selected indicators of the airway changes other than FEV1%, such as bronchial wall thickness, bronchial diameter, etc. have been evaluated. There is a large number of smokers in China, especially among the male population, and the effect of different sex on the susceptibility of smoking is diverse, hence in this study, only the male subjects were selected to avoid the interference of gender factors.
2.Materials and methods
2.1Research materials
This study prospectively collected the data of 123 subjects who come from the similar district (males, aged 40–75 years old) using multi-slice spiral Computed tomographic (CT) scanning images, and excluded non-compliant patients. Among the subjects, 82 cases were current smokers and 41 cases were ex-smokers (66.6% vs. 33.4%).
Figure 1.
The flow chart of 3D CT quantitative measurements.
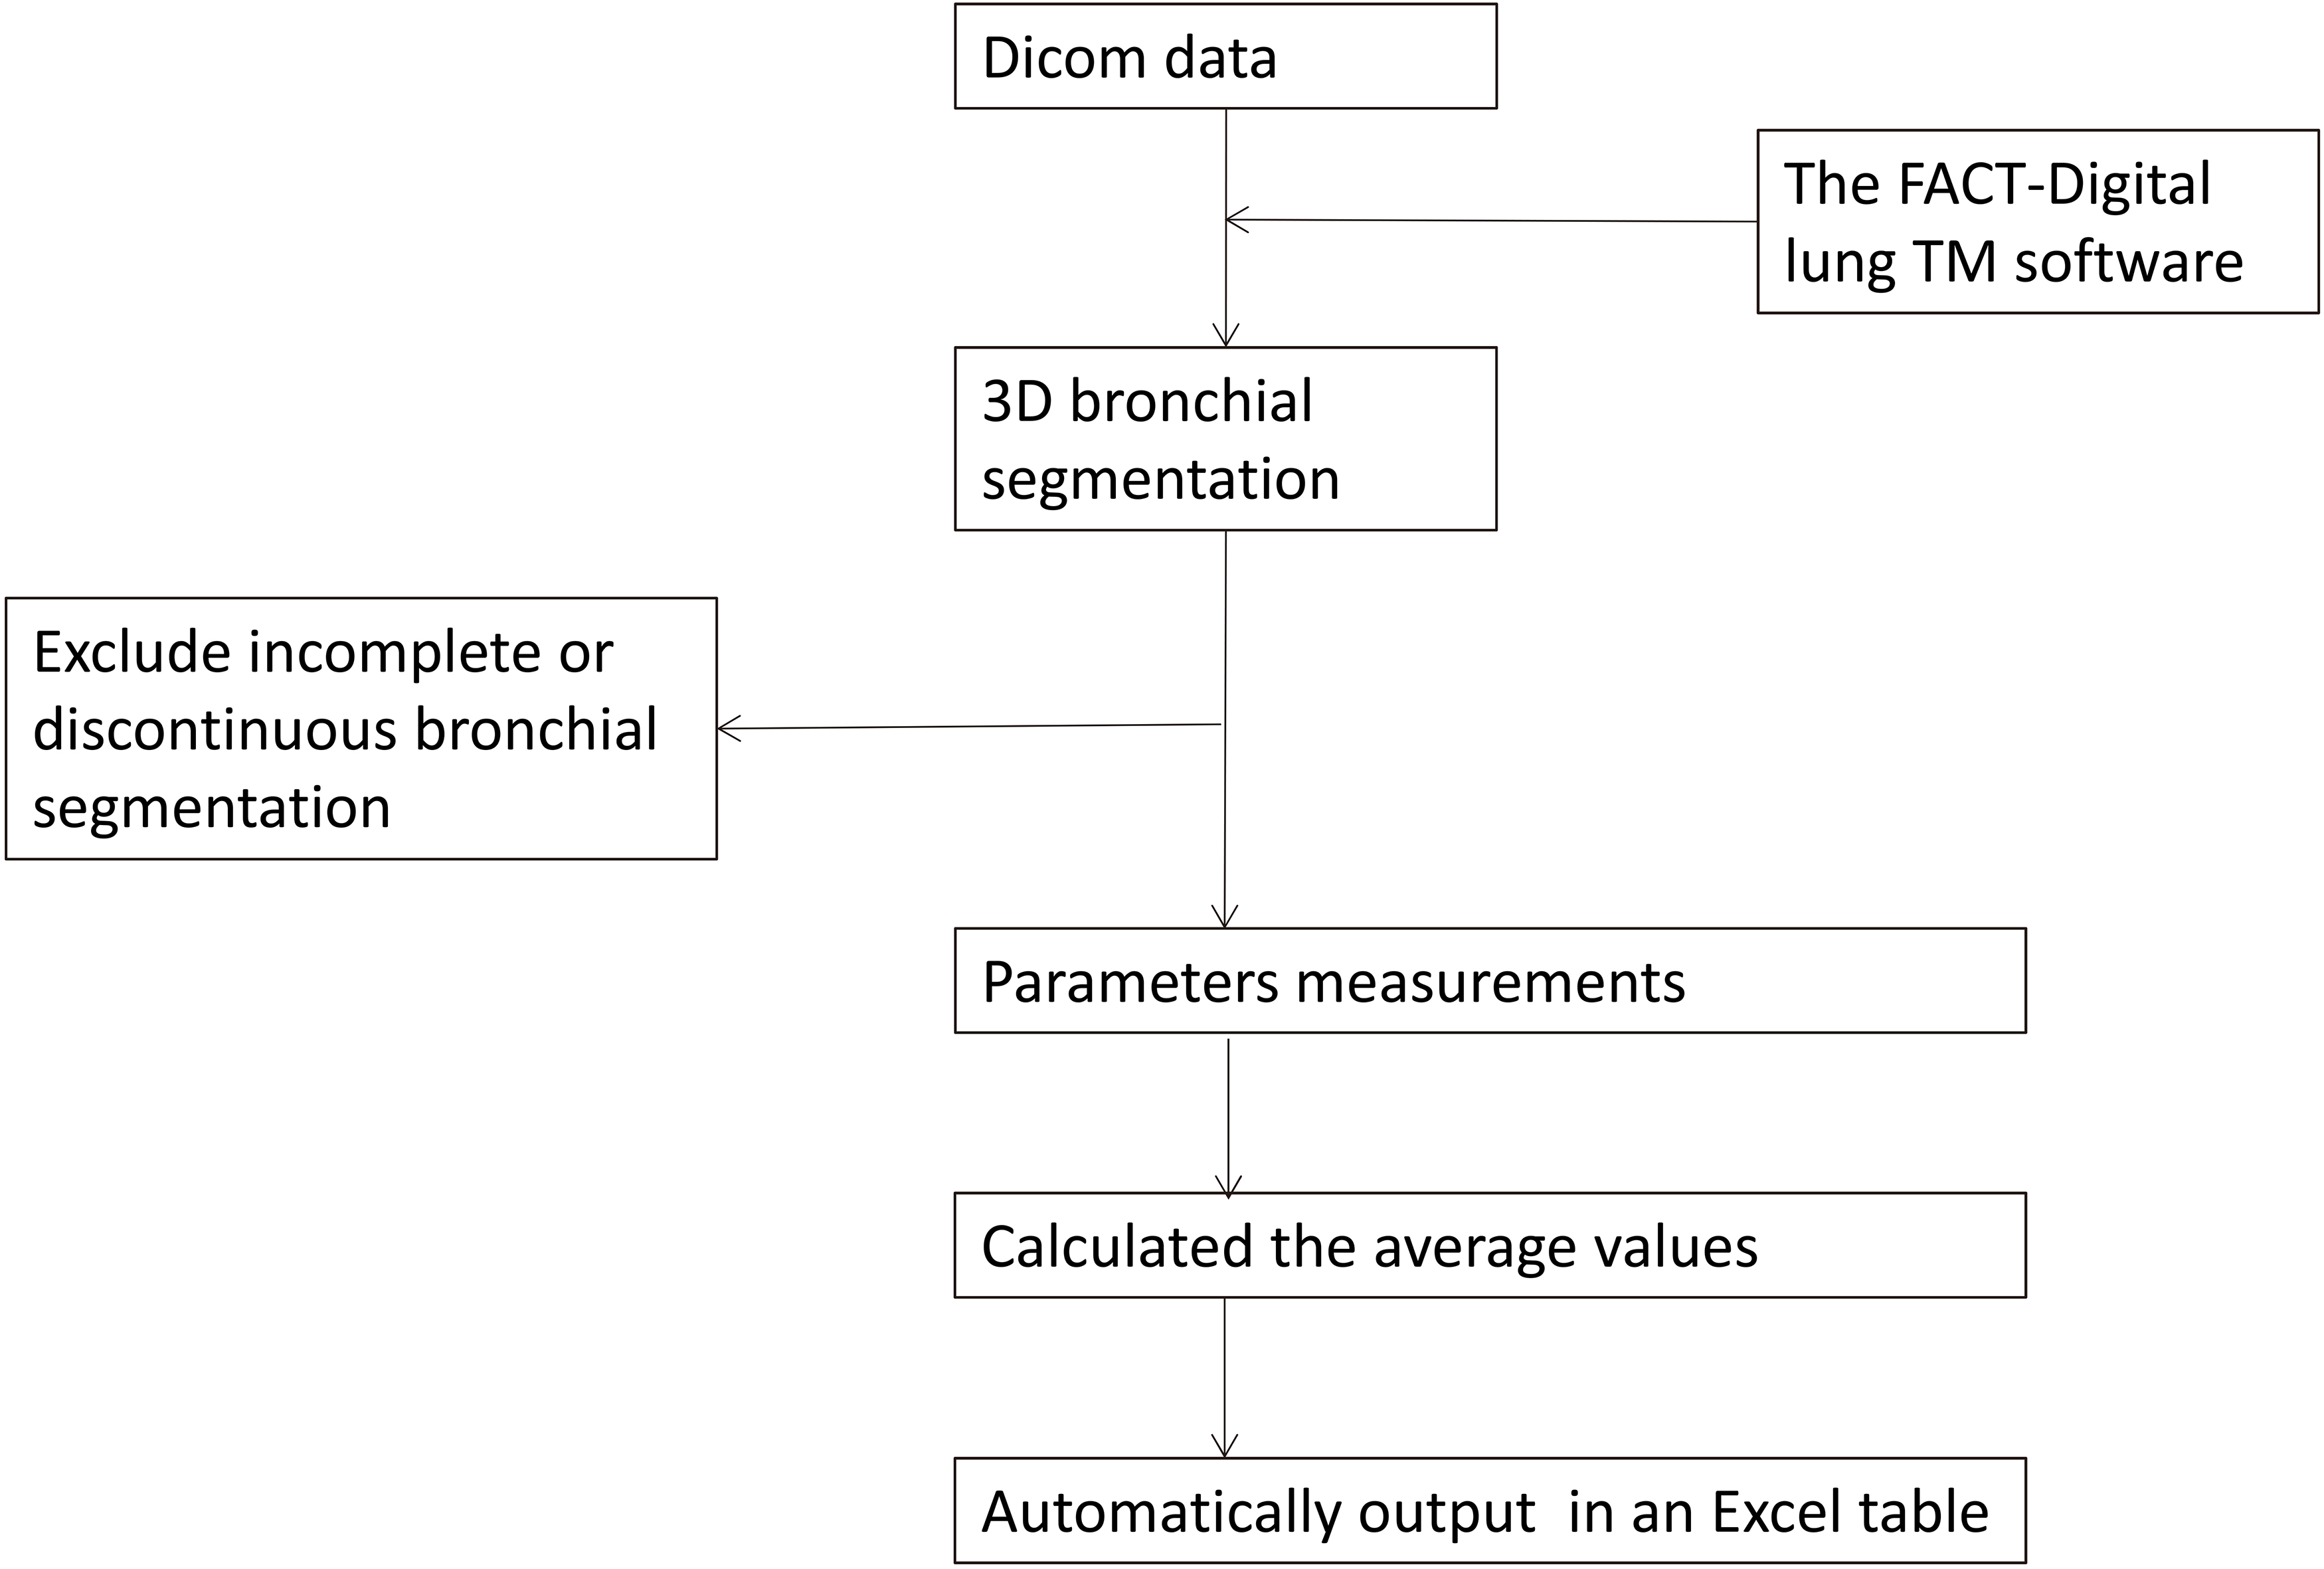
Smoking was defined as smoking more than 10 packs per year [5]. Smoking cessation was defined as having discontinued smoking for longer than one year [6]. Exclusion criteria included basic pulmonary disease, thoracic surgery, a chemotherapy history, incomplete or discontinuous bronchial segmentation, or a failure of segmentation to generation seven.
In this study, the volunteers that smoked were given one-year quitting intervention. The subjects that completed 1 year after quitting smoking were included in the smoking cessation group, and those who continued to smoke were included in the smoking group. The subjects that did not completely cease smoking were excluded from the study. The differences in airway parameters and lung injury were compared between the smoking group and the smoking cessation group. The study was approved by the the Chinese Clinical Trials Registry Center and the Institutional Ethics Committee of the First Affiliated Hospital of Xi’an Jiaotong University. And its registration number was ChiCTR-OCH-14004935. The written informed consent was received from all patients.
2.2Quantitative CT measurements
The CT examination was performed using a 64-slice multi-detector row CT system (Philips Gemini TF 64 PET/CT; Philips Healthcare, Best, the Netherlands). The subjects were placed in the supine position and allowed to take a fully inspired breath. The scan covered the whole lungs. Images were got at settings of 120 kV and 200 mA. Images were reconstructed using a standard algorithm with a 0.625-mm slice thickness and 0.625-mm interval.
Figure 2.
The following steps of CT quantitative analysis of measurement parameters: a depict the bronchial auto-segmentation diagram; b depit the range of %LAA-950; c, d, and e are the axial, coronal, and sagittal images respectively; f is bronchial straightening; g depicts the bronchial in the visual field; h and i show measurement parameters.
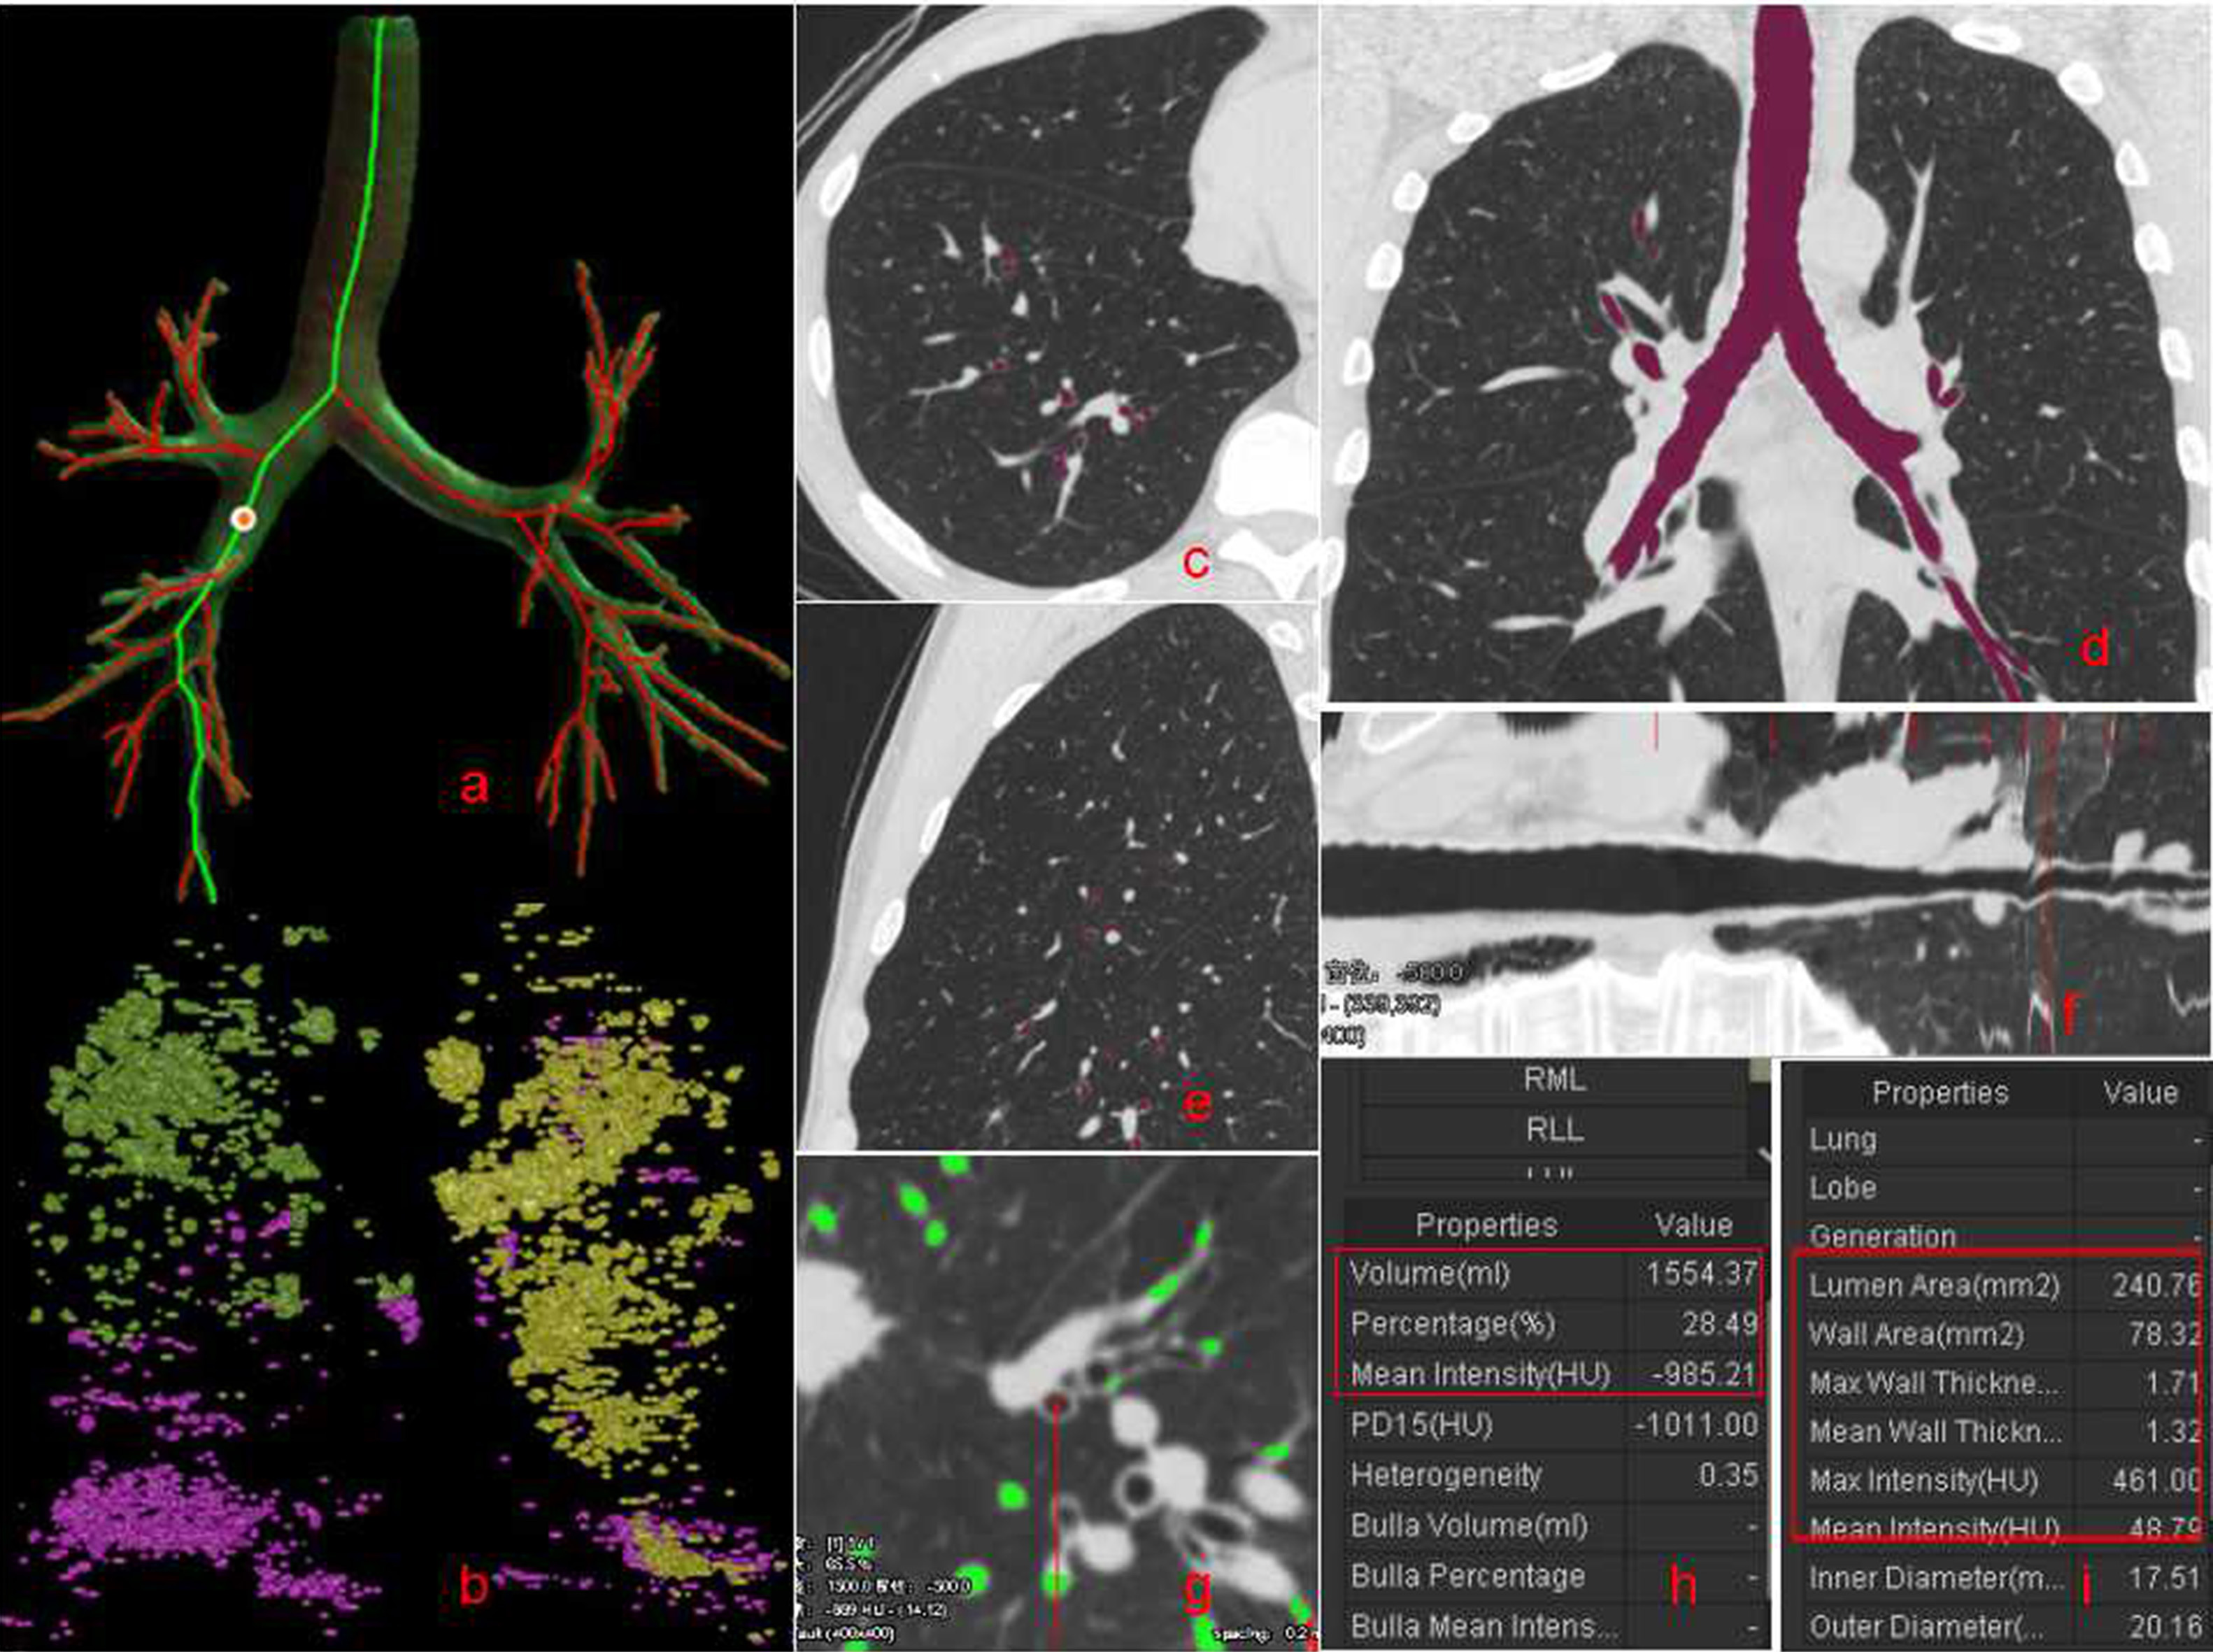
The FACT-Digital lung TM software (DeXin, Xi’an, China) was used to perform fully automated 3D CT quantitative measurements for the bronchial tree, and the flow chart was Fig. 1. The following steps were taken in Fig. 2: (1) The skeleton extraction algorithm was used to perform a 3D bronchial segmentation. The skeletons of all tested bronchial generations were automatically extracted and exhibited as a bronchial tree (Fig. 2a). The area of emphysema was shown in color (Fig. 2b) (2) Virtual bronchoscopy was used to synchronously display the cursor position in the axial, coronal and sagittal images, and the bronchial straightened image (Fig. 2c–f). The enlarged axial view of the bronchus (Fig. 2g) was synchronously displayed along with eleven measurements, including the LV, %LAA-950, PD (Fig. 2h), WT, LD, LA and WA (Fig. 2i). The accuracy of the measurements was validated by modeling [7]. (3) The average values of the measurements for all the points of a bronchial generation (the beginning of a bronchial generation to the bifurcation for the next generation) were automatically calculated and the output was recorded in an Excel table. The detailed descriptions of these computerized approaches have been reported elsewhere [8]. The generated bronchi were evaluated using measurement parameters like WT, LD, WA% (WA/(WA
Table 1
General characteristics of subjects belonging to the current smokers group
| Smokers, % | 66.6% ( | |||||
| Age, years | 61.80 | |||||
| Smoking amount, pack-years | 360.44 | |||||
| Height, cm | 173.42 | |||||
| Weight, kg | 75.06 | |||||
| Baseline | Second year | P-value | ||||
| Volume, ml | 5413.27 | 5613.27 | 0.006 | |||
| %LAA-950 | 0.49 | 0.64 | 0.020 | |||
| PD, HU | 0.046 | |||||
| WT, mm | 1.12 | 1.17 | 0.0003 | |||
| LD, mm | 4.00 | 3.52 | 0.0004 | |||
| WA% | 0.58 | 0.60 | 0.001 | |||
| Right upper lobe (RUL) | Volume, ml | 1087.80 | 1137.65 | 0.018 | ||
| %LAA-950 | 0.33 | 0.42 | 0.008 | |||
| PD, HU | 0.064 | |||||
| WT, mm | 1.34 | 1.39 | 0.020 | |||
| LD, mm | 2.92 | 2.62 | 0.043 | |||
| WA% | 0.70 | 0.75 | 0.039 | |||
| Right middle lobe (RML) | Volume, ml | 541.76 | 561.22 | 0.061 | ||
| %LAA-950 | 0.28 | 0.38 | 0.023 | |||
| PD, HU | 0.030 | |||||
| WT, mm | 1.09 | 1.14 | 0.130 | |||
| LD, mm | 3.07 | 2.94 | 0.320 | |||
| WA% | 0.63 | 0.67 | 0.027 | |||
| Right lower lobe (RLL) | Volume, ml | 1284.77 | 1338.24 | 0.060 | ||
| %LAA-950 | 0.27 | 0.32 | 0.088 | |||
| PD, HU | 0.042 | |||||
| WT, mm | 0.97 | 1.02 | 0.112 | |||
| LD, mm | 6.29 | 5.85 | 0.009 | |||
| WA% | 0.42 | 0.45 | 0.026 | |||
| Left upper lobe (LUL) | Volume, ml | 1341.65 | 1387.96 | 0.042 | ||
| %LAA-950 | 0.35 | 0.42 | 0.032 | |||
| PD, HU | 0.001 | |||||
| WT, mm | 1.20 | 1.25 | 0.042 | |||
| LD, mm | 4.10 | 3.75 | 0.002 | |||
| WA% | 0.60 | 0.64 | 0.001 | |||
| Left lower lobe (LLL) | Volume, ml | 1176.77 | 1214.93 | 0.172 | ||
| %LAA-950 | 0.33 | 0.39 | 0.032 | |||
| PD, HU | 0.053 | |||||
| WT, mm | 1.00 | 1.06 | 0.023 | |||
| LD, mm | 4.80 | 4.50 | 0.092 | |||
| WA% | 0.49 | 0.52 | 0.003 | |||
2.3Statistical analysis
Paired t-tests were used to compare the differences in WT, LD, WA%, LV, PD and %LAA-950 between the baseline and the second year in the smoking group and smoking cessation group. A value of
Table 2
General characteristics of subjects belonging to the ex-smokers group
| Ex-smokers, % | 33.4% ( | |||||
| Age, years | 61.06 | |||||
| Height, cm | 173.68 | |||||
| Weight, kg | 75.56 | |||||
| Baseline | Second year | P-value | ||||
| Volume, ml | 5453.27 | 5491.10 | 0.682 | |||
| %LAA-950 | 0.51 | 0.64 | 0.080 | |||
| PD, HU | 0.927 | |||||
| WT, mm | 1.10 | 1.12 | 0.097 | |||
| LD, mm | 4.30 | 4.19 | 0.112 | |||
| WA% | 0.58 | 0.59 | 0.206 | |||
| Right upper lobe (RUL) | Volume, ml | 1083.80 | 1101.65 | 0.352 | ||
| %LAA-950 | 0.39 | 0.55 | 0.136 | |||
| PD, HU | 0.930 | |||||
| WT, mm | 1.30 | 1.31 | 0.741 | |||
| LD, mm | 3.09 | 2.92 | 0.210 | |||
| WA% | 0.70 | 0.71 | 0.991 | |||
| Right middle lobe (RML) | Volume, ml | 539.04 | 553.69 | 0.184 | ||
| %LAA-950 | 0.66 | 0.72 | 0.479 | |||
| PD, HU | 0.703 | |||||
| WT, mm | 1.06 | 1.09 | 0.169 | |||
| LD, mm | 3.14 | 2.99 | 0.324 | |||
| WA% | 0.65 | 0.68 | 0.044 | |||
| Right lower lobe (RLL) | Volume, ml | 1286.24 | 1300.17 | 0.627 | ||
| %LAA-950 | 0.28 | 0.33 | 0.204 | |||
| PD, HU | 0.829 | |||||
| WT, mm | 0.95 | 0.97 | 0.264 | |||
| LD, mm | 6.38 | 6.12 | 0.066 | |||
| WA% | 0.41 | 0.43 | 0.072 | |||
| Left upper lobe (LUL) | Volume, ml | 1349.45 | 1375.96 | 0.249 | ||
| %LAA-950 | 0.72 | 0.97 | 0.106 | |||
| PD, HU | 0.970 | |||||
| WT, mm | 1.19 | 1.20 | 0.594 | |||
| LD, mm | 4.05 | 3.81 | 0.030 | |||
| WA% | 0.61 | 0.63 | 0.003 | |||
| Left lower lobe (LLL) | Volume, ml | 1173.54 | 1180.77 | 0.806 | ||
| %LAA-950 | 0.52 | 0.62 | 0.169 | |||
| PD, HU | 0.964 | |||||
| WT, mm | 0.98 | 1.00 | 0.407 | |||
| LD, mm | 5.06 | 4.87 | 0.351 | |||
| WA% | 0.49 | 0.51 | 0.146 | |||
3.Results
The median age of the 123 people enrolled in this study was 57 years (45–75 years). Among them, 82 cases were current smokers and 41 were ex-smokers (66.6% vs. 33.4%). The parameters of all current smokers and ex-smokers at baseline were observed in the first and the second year. The annual increase in LV was more rapid in current smokers (additional 200 ml per year,
4.Discussion
Currently, the quantitative CT lung imaging technology is a major research [9] and is used to determine the lung volume, mean lung density, emphysema index and other indicators, which will be abnormal in the progression of pulmonary damage [10]. Smoke-induced airway stenosis is mainly located in the small airway, which is not currently available for the direct measurement of the small airways using CT, but studies have shown [11] that the measurement of larger airways can be used to roughly assess and reflect small airway lesions. This study shows that the use of the relevant CT software can be used to measure the airway diameter, assess the airway wall thickness, effective ventilation lumen area, and other indicators of the pathological changes in the airway of smokers and former smokers can be studied in-depth [12]. Some scientific study often select the measurement of different bronchial parts [13], leading to a wide variation in the results obtained, hence this study selected the average of bronchial measurements.
In this study, 66.6% of the subjects were persistent smokers, while 33.4% were quit smokers. There was no significant difference in age, height, and weight between smokers and quit smokers, thus the differences in the lung tissue and bronchi caused by age, height, and weight were excluded.
High-resolution CT (HRCT) scans display the level of secondary pulmonary lobules, and can more clearly distinguish the characteristics of the microstructure of the lesion by visually observing the air retention area thereby estimating its range [14]. In this study, the parameter %LAA-950 was used to quantify the extent of air retention. Many studies have shown that the emphysema region is mainly located in the upper lobe of the lungs [15], which are consistent with the results of this study.
The parameters selected in this study included lung volume, %LAA-950, PD, WT, LD, and WA%. From the results of the study, it can be seen that the lung volume and %LAA-950 increased, while PD decreased statistically significantly in the second year amongst the continuous smokers than in the first year. In the ex-smokers, a statistically insignificant increase in the lung volume and %LAA-950, and a decrease in the PD was observed, indicating that the lung tissue damage of persistent smokers was more serious than quit smokers, consistent with previous reports. The WT and WA% increased, while LD decreased in the second year than the first year, amongst the continuous smokers, which was statistically significant. The former smokers also showed a slight increase in WT and WA%, and decrease in LD, but not statistically significant indicating that the bronchial damage of persistent smokers was more severe than ex-smokers, which was consistent with the airway remodeling pathology caused by chronic inflammation.
In the past, many studies were conducted only on the overall changes in lung tissue and bronchi. The analysis software used in this study measured quantitatively in whole or in part. This study showed that the parameters of the second year were significantly on a higher scale when compared to the parameters of the first year, consistent with the previous research reports.
The advantage of this study was the use of CT to determine the lung damage of smokers, not only from the morphology of the lung tissue lesions but also from the quantitative measurement of bronchial parameters that helped in identifying the location and extent of lesions. The pulmonary damage caused by smoking can be measured and related to the smoking status. Smoking cessation has a positive role in alleviating the progress of pulmonary damage. Combined CT image information can provide a certain supplement for clinical and pulmonary function. There were shortcomings and limitations of this study: less sample size in this study; failure to analyze by age.
Acknowledgments
This work was supported by the Public Science and Technology Research Funds of China (201402 013).
Conflict of interest
None to report.
References
[1] | Li LB, Leung DY, Martin RJ, Goleva E. Inhibition of histonedeacetylase 2 expression by elevated glucocorticoid receptor beta in steroid-resistant asthmaAm. J Respir Crit Care Med. (2010) ; 182: (7): 877-883. |
[2] | Zhao YN, Wang GF. Smoking and chronic obstructive pulmonary disease. Chinese Journal of the Frontiers of Medical Science. (2012) ; 4: (1): 16-19. |
[3] | Liu T, Cai BQ. Introduction to the Global Strategy for the Diagnosis, Treatment and Prevention of Chronic Obstructive Pulmonary Disease (Revised 2011). Chin J Respir Crit Care Med. (2012) ; 11: (1): 1-12. |
[4] | Willemse BW, Postma DS, Timens W, ten Hacken NH. The impact of smoking cessation on respiratory symptoms, lung function, airway hyperresponsiveness and inflammation. Eur Respir J. (2004) ; 23: (3): 464-466. |
[5] | Pu J, Fuhrman C, Good WF, Sciurba FC, Gur D. A differential geometric approach to automated segmentation of human airway tree. IEEE Trans Med Imaging. (2011) ; 30: (2): 266-278. |
[6] | Kim YI, Schroeder J, Lynch D, Newell J, Make B, Friedlander A. Gender differences of airway dimensions in anatomically matched sites on CT in smokers. NIH-PA. (2011) ; 8: (4): 285-292. |
[7] | Wang SF, Zhang Q, Zhang B, Song HH, He QY. Effects of smoking cessation on clincal symptoms and respiratory function in patients of different gender with chronic obstructive pulmonary disease. Chinese General Practice. (2013) ; 16: (2): 136-139. |
[8] | Kligerman SJ, Lahiji K, Galvin JR, Stokum C, White CS. Missed pulmonary emboli on CT angiography: assessment with pulmonary embolism computer-aided detection. AJR Am J Roentgenol. (2014) ; 202: (1): 65-73. |
[9] | Yang XD, Lu XD. CT observation of lung function. Chinese Journal of Medical Imaging Technology. (2004) ; 20: (1): 156-158. |
[10] | Zhang J, Yu TL, Wu Q, Ye N, Cao Y, Zhang J, et al. Quantitative MSCT study of lung attenuation in patients with chronic obstructive pulmonary disease. Chinese Journal of Medical Imaging Technology. (2008) ; 24: (10): 1611-1614. |
[11] | Xin XY, He W, Tan CT. Correlation study on airway wall thickness with lung function and severity in patients with bronchial asthma assessed by high-resolution CT. Chinese Journal of Medical Imaging Technology. (2006) ; 22: (11): 1665-1667. |
[12] | Yu H, Jiang HL, Fan L, Guan Y, Xia Y, Xiao XS, et al. Comparative study on HRCT quantitative analysis of the small airways between chronic obstructive pulmonary disease and normal volunteers. Journal of Practical Radiology. (2013) ; 29: (5): 726-729. |
[13] | Matsuoka S, Kurihara Y, Nakajima Y, Niimi H, Ashida H, Kaneova K. Serial change in airway lumen and wall thickness at thin-section CT in asymptomatic subjects. Radiology. (2005) ; 234: (2): 595-603. |
[14] | Stern EJ, Webb WR, Gamsu G. Dynamic quantitative computed tomography. A predictor of pulmonary function in obstructive lung diseases. Invest Radiol. (1994) ; 29: (5): 564-569. |
[15] | Takasug JE, Godwin JD. Radiology of chronic obstructive pulmonary diseaseRadiol. Clin North Am. (1998) ; 36: (1): 29-55. |


