
Development of capacitive sensor for automatically measuring tumbler water level with FEA simulation
Abstract
BACKGROUND:
Drinking water has several advantages that have already been established, such as improving blood circulation, reducing acid in the stomach, etc. However, due to people not noticing the amount of water they consume every time they drink, most people drink less water than the recommended daily allowance.
OBJECTIVE:
In this paper, a capacitive sensor for developing an automatic tumbler to measure water level is proposed. Different than in previous studies, the proposed capacitive sensor was separated into two sets: the main sensor for measuring the water level in the tumbler, and the reference sensor for measuring the incremental level unit.
METHODS:
In order to confirm the feasibility of the proposed idea, and to optimize the shape of the sensor, a 3D model of the capacitive sensor with the tumbler was designed and subjected to Finite Element Analysis (FEA) simulation. According to the simulation results, the electrodes were made of copper and assembled in a tumbler manufactured by a 3D printer. The tumbler was filled with water and was subjected to experiments in order to assess the sensor’s performance.
RESULTS:
The comparison of experimental results to the simulation results shows that the measured capacitance value of the capacitive sensor changed linearly as the water level varied. This proves that the proposed sensor can accurately measure the water level in the tumbler. Additionally, by use of the curve fitting method, a compensation algorithm was found to match the actual level with the measured level.
CONCLUSIONS:
The experimental results proved that the proposed capacitive sensor is able to measure the actual water level in the tumbler accurately. A digital control part with micro-processor will be designed and fixed on the bottom of the tumbler for developing a smart tumbler.
1.Introduction
People have to drink water every day in order to rehydrate. In addition, drinking moderate amounts of water has several advantages, which have already been demonstrated, such as maintaining the balance of bodily fluids, controlling calories, maintaining good skin quality, etc. According to the results of a survey by the National Nutrition Survey, South Korean men and women drink approximately 945 mL and 766 mL of water, respectively, per day. These results show that the amount of water consumed daily is less than the recommended volume by approximately 1.5 L to 2 L. However, people cannot easily monitor the amount of water they drink each time. Therefore, developing a smart device, which will automatically measure the daily amount of consumed water is necessary for improving water drinking habits.
Recently, several products have been developed for recording the daily amount of consumed water. A smart tumbler called 8Cups was developed by a Korean venture company, and used a light sensor to measure water level. Because of the light sensor being limited by the color of the liquid, and since external light can affect sensor performance, the tumbler cannot be made in the transparent shell [1, 2, 3]. Additionally, almost smart tumblers, such as Ozmo Java
Figure 1.
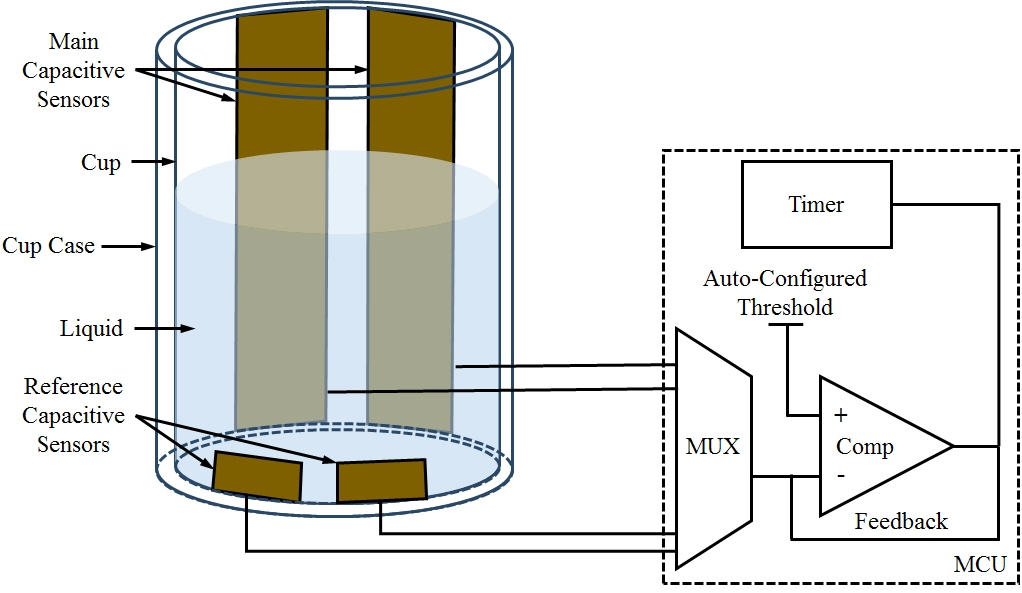
Basic concept of proposed capacitive sensor for automatic water level measurement in the tumbler.
1.1Basic idea for the proposed system
Figure 1 shows the basic concept of the proposed capacitive sensor in the tumbler for automatic water level measurement. The capacitive sensor was designed with two pairs of electrodes of the same width, where the large pair is the main sensor for water level measurement, and the small pair is the reference sensor for the incremental unit measurement of the water level. The main sensor has to be as high as the maximum permissible water level due to the capacitance value of the main sensor being proportional to water height. By measuring the capacitance value, the measurement water level can be calculated by the capacitance value of the main sensor, which is proportional to the capacitance value of the reference sensor and multiplied by the reference sensor height, as shown in Eq. (1).
(1)
The two pairs of electrodes were fixed face to face on the outside surface of the tumbler in order to prevent electric field interference from the electrode set [14]. The measured data was delivered to the micro control unit (MCU) for analyzing the measured capacitance value and for performing digital data conversion.
Figure 2.
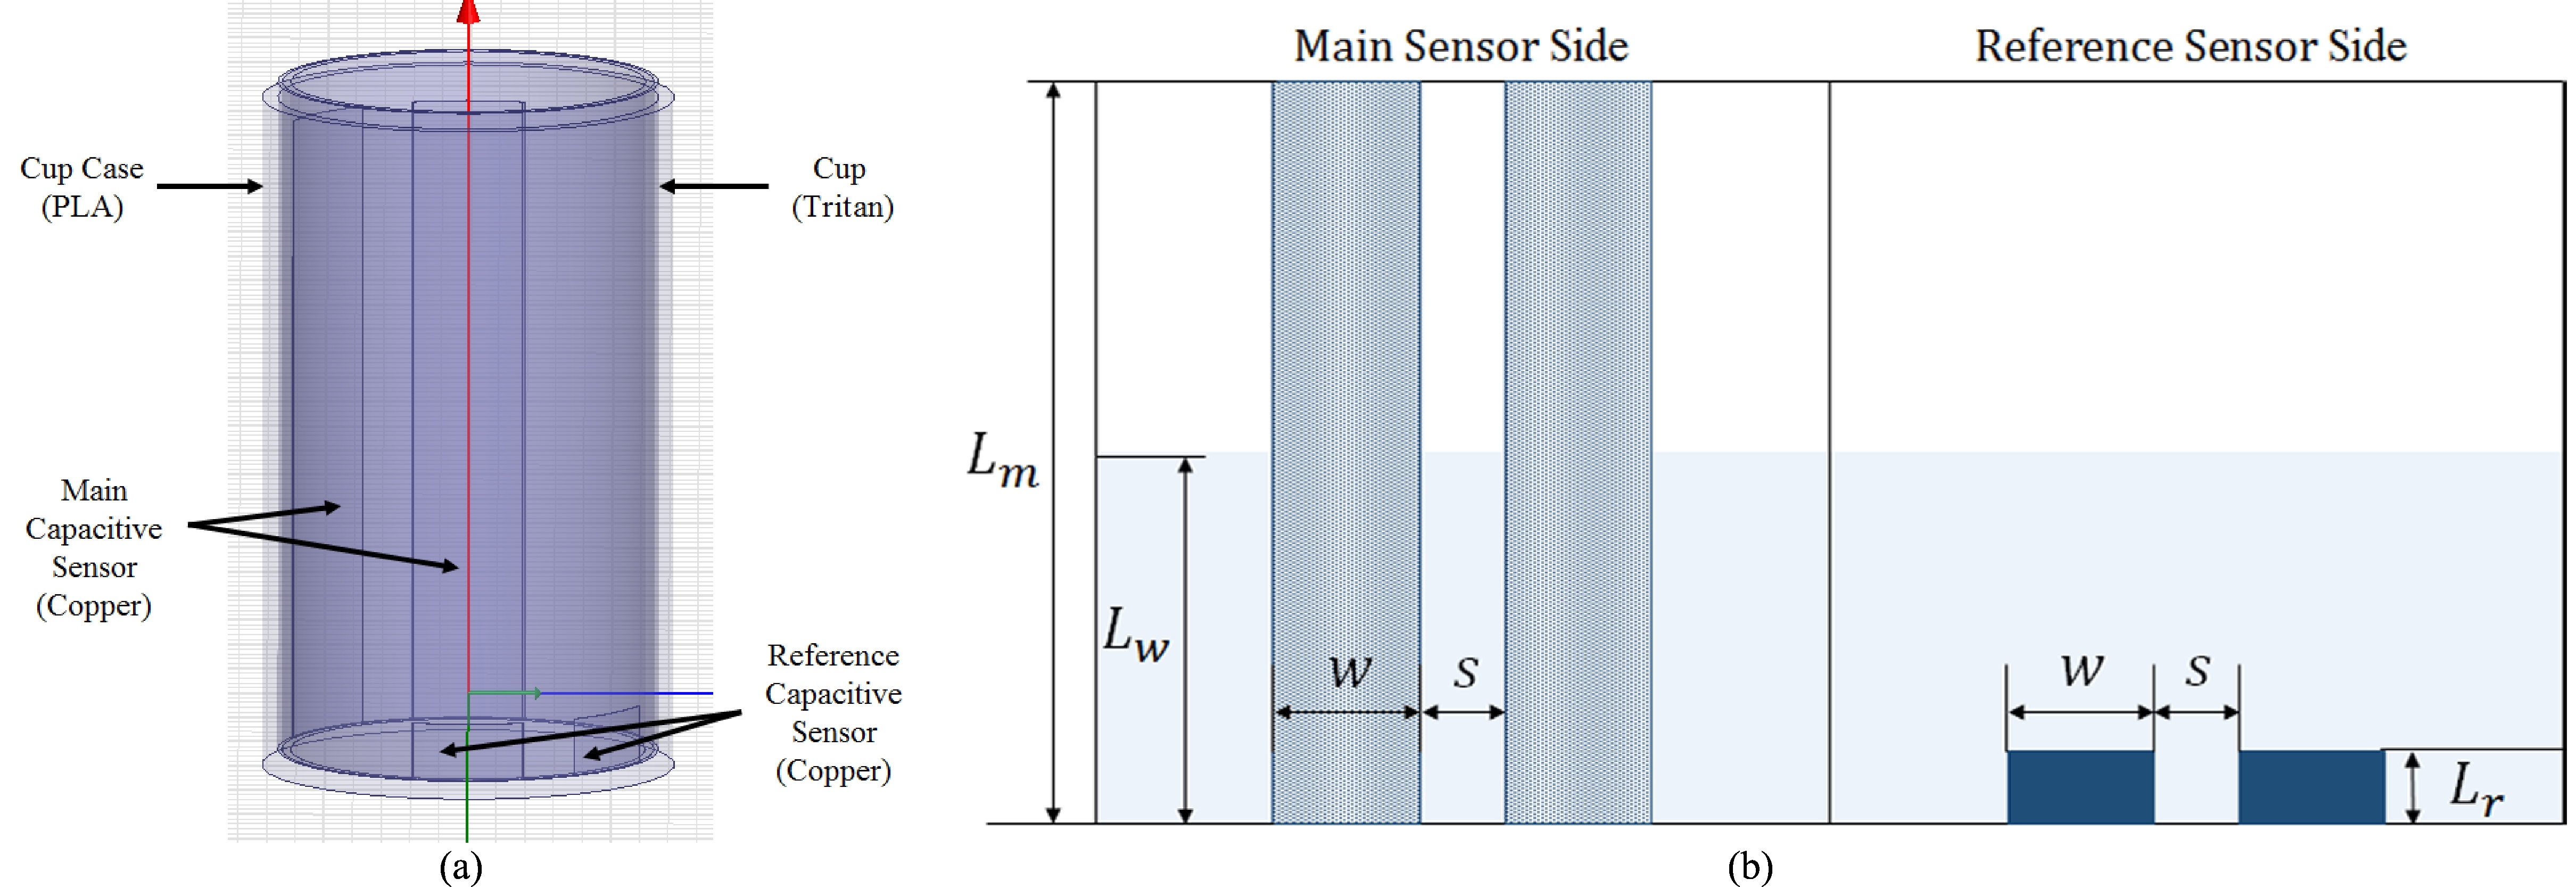
The proposed capacitive sensor with tumbler was subjected to FEA simulation. (a) 3D model of tumbler with capacitive sensor; (b) plan of designed capacitive sensor electrode dimensions.
1.2Using FEA simulation for sensor design
In this study, a FEA simulation was used to estimate the feasibility of the proposed idea and to find the optimal geometrical dimension of the capacitive sensors. The 3D model of the proposed capacitive sensor in the tumbler was created in the Maxwell (Ansoft, USA) [15] FEA simulation software. This software is the leading electromagnetic field simulation software used in the design and analysis of 2D and 3D structures, such as motors, transformers and other electric and electromechanical devices common in automotive, military/aerospace, and industrial systems. By implementing the FEA method, Maxwell can accurately solve static, frequency-domain and time varying electromagnetic and electric fields. Therefore, in this study, the problem could be solved in a 3D electrostatic environment. As shown in Fig. 2a, the 3D modeling consisted of four layers. Water and air in the innermost layer were contained in a right circular cylindrical Tritan cup of the second layer; the height of the cup was 10 cm and its diameter was 5 cm. In the third layer, four electrodes for the proposed capacitive sensor were fixed on the outside surface of the cup. The tumbler shell with PLA (Polylactic Acid) material was designed to encase the cup and capacitive sensor in the outermost layer. The height of the tumbler shell was designed with 10 cm height and a thickness of 1 mm. The relative permittivity of the Tritan cup was set to 2.5, while its conductivity was set to 1E
The dimensional plan of the proposed capacitive sensor is shown in Fig. 2b. According to the tumbler height, the main electrode was designed with a height (
In order to isolate the model from other voltage or charge sources, the boundary conditions for the simulated space acted as a charge balloon. Excitations were set to positive 1.0 V and negative 1.0 V for each electrode, in order to create a potential difference between the two electrodes. The maximum error of the solution was set to 0.01% [16].
Figure 3.
A cross-sectional view of the electric field distribution of the tumbler filled with air and water obtained from the 3D FEA simulation. (a) Full of air; (b) full of water.
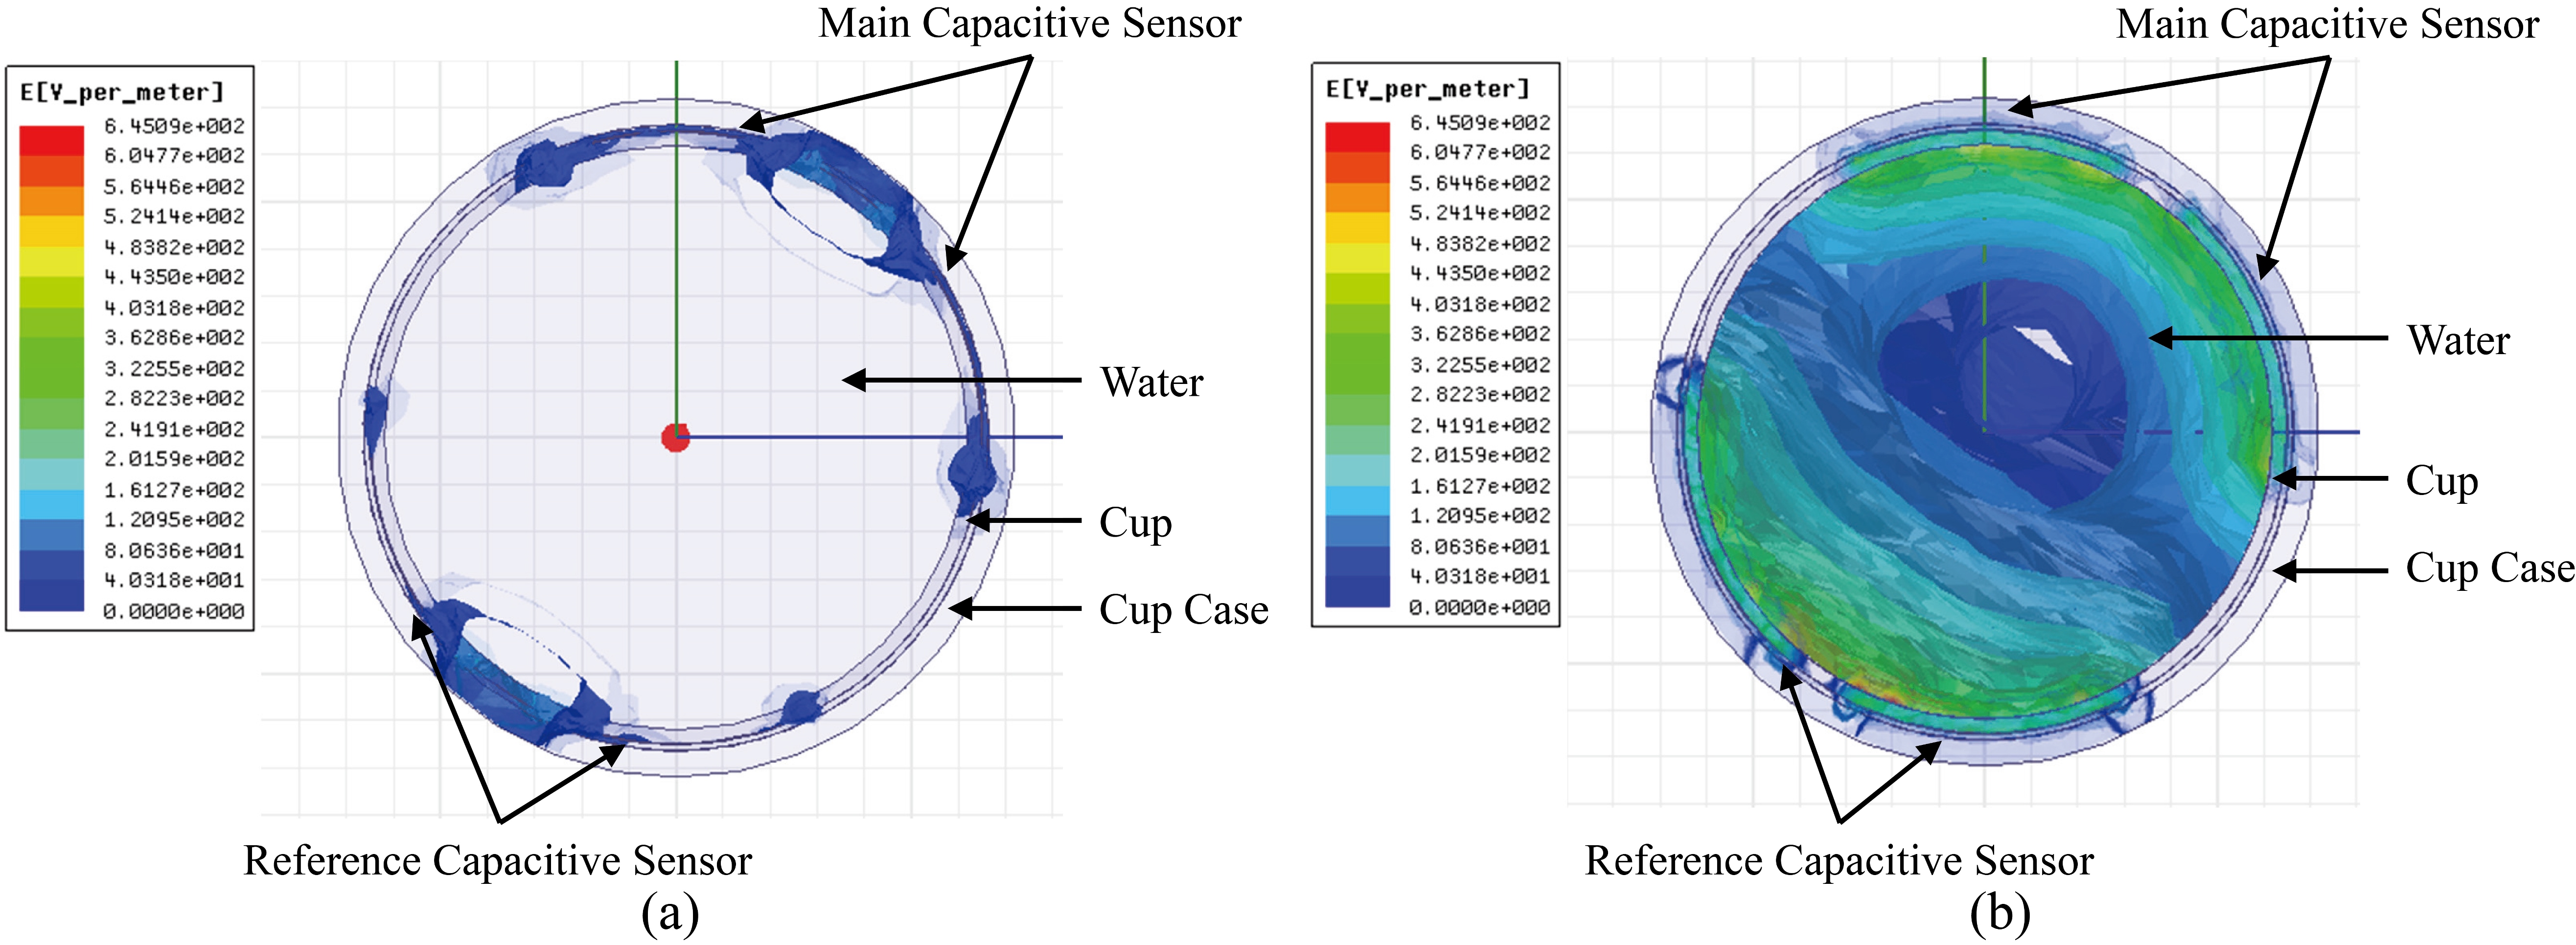
Figure 4.
Pictures of the simulation result for the electrical field intensity variation of the capacitive sensor in the 3D FEA simulation as the water level increased. (a) 0 cm; (b) 3 cm; (c) 6 cm; (d) 10 cm.
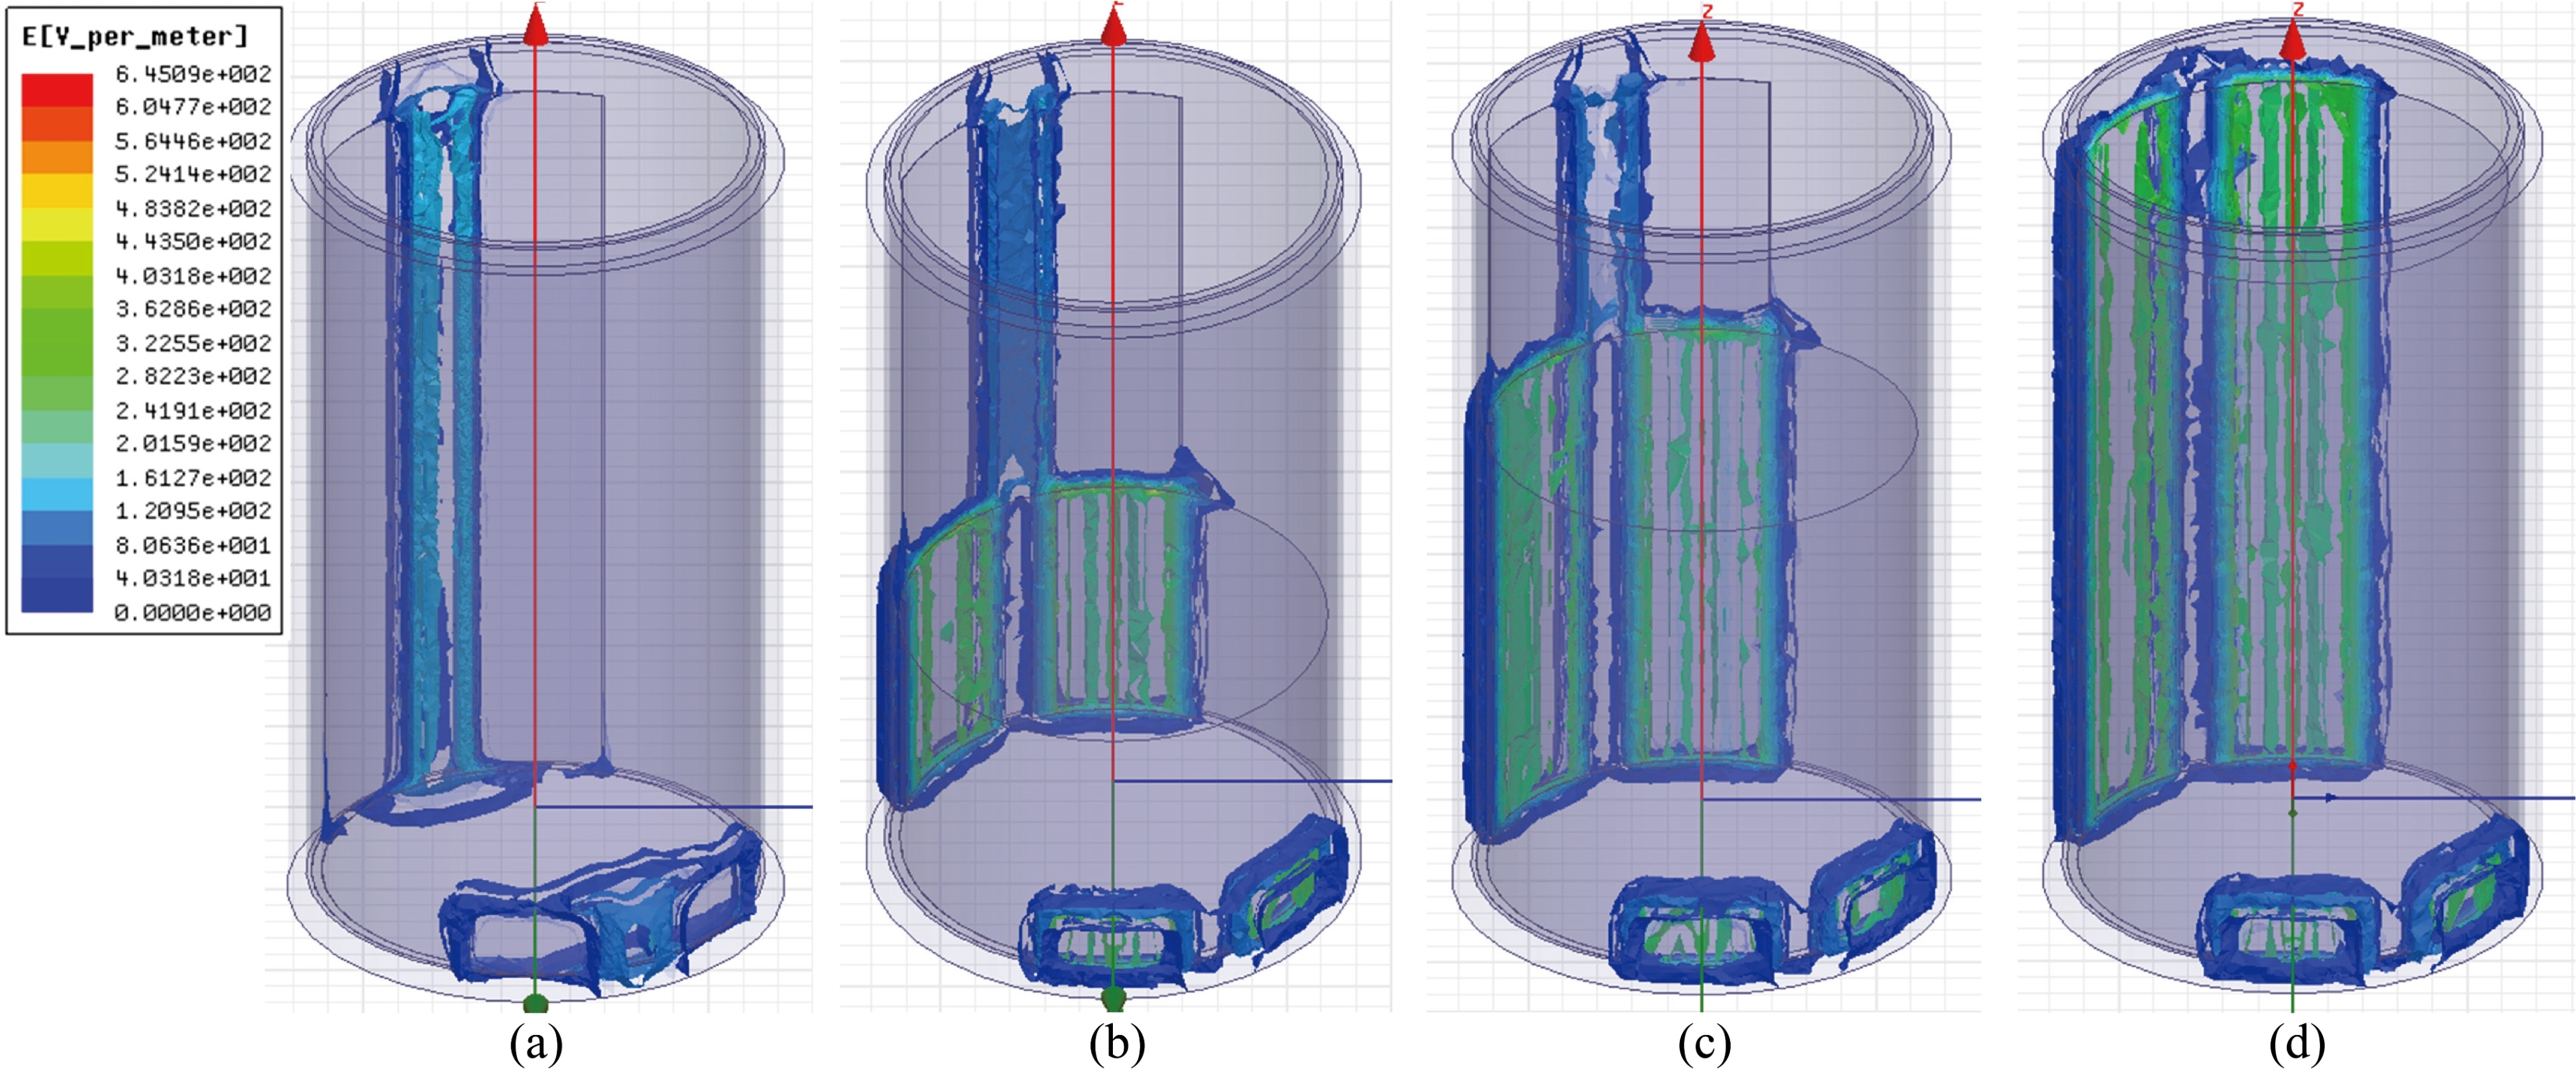
Figure 5.
Graph of the capacitance value of the capacitive sensor width variation in the FEA simulation.
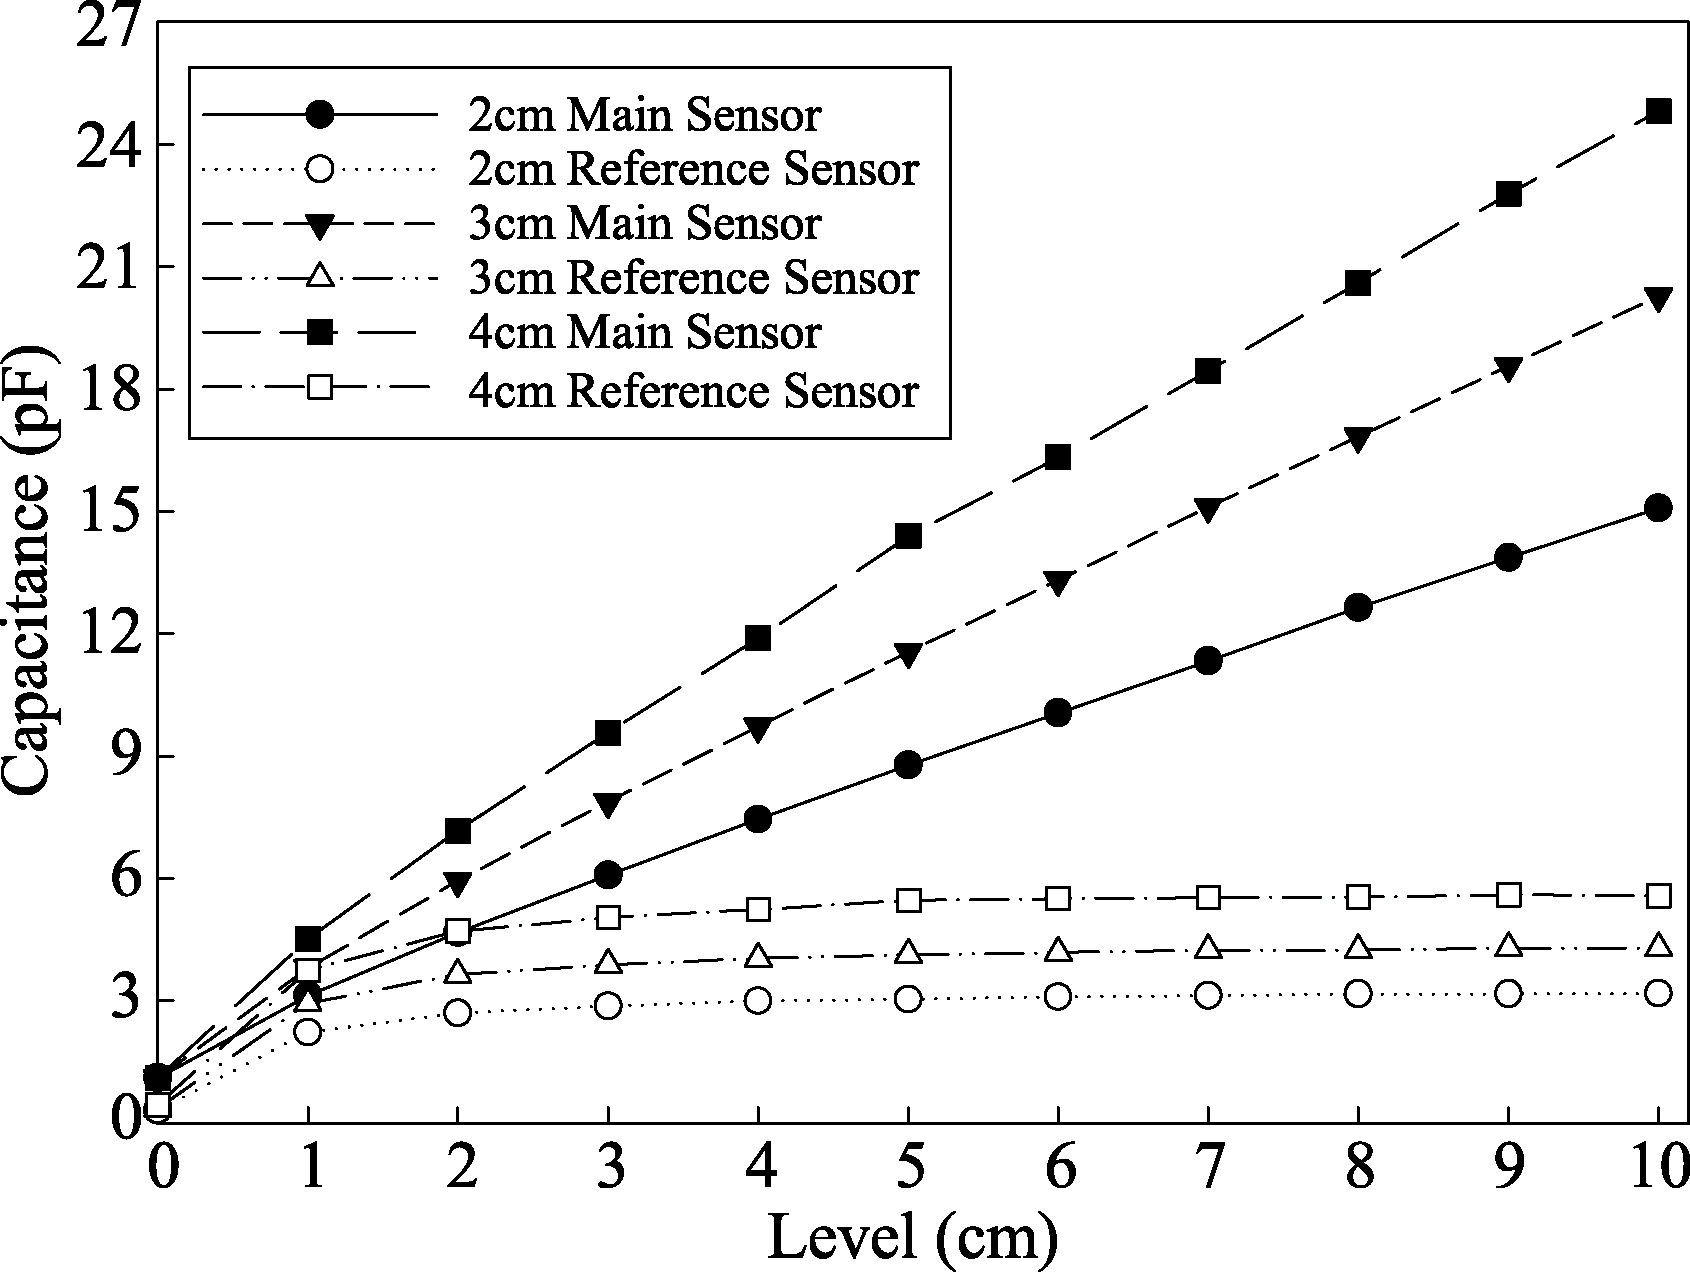
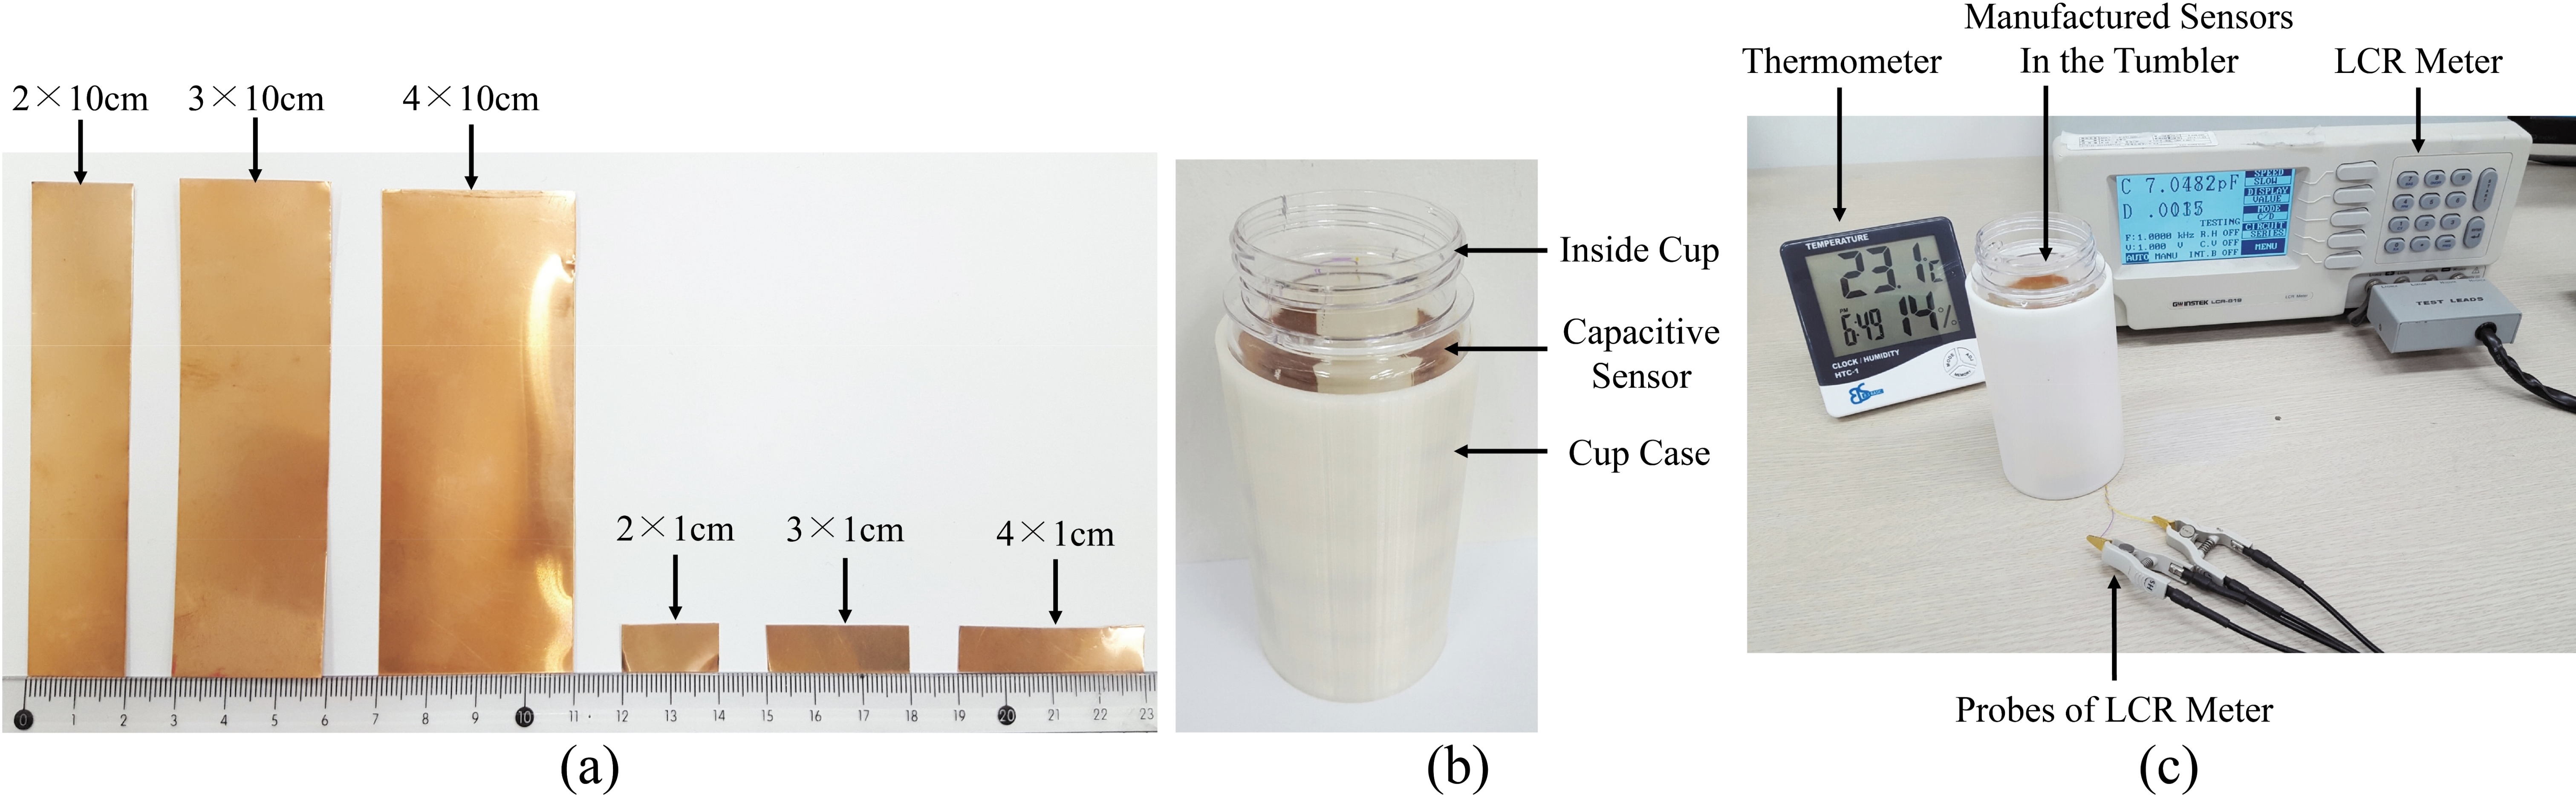
Figure 6.
Pictures of the fabricated capacitive sensor assembled with the tumbler to conduct the performance test. (a) Manufactured variety width of electrodes for capacitive sensor; (b) capacitive sensor assembled in the tumbler; (c) assembled tumbler connected with an LCR to acquire the capacitance value.
1.3FEA simulation results
The tumbler was filled with air and water and a cross-sectional view of its electric field distribution was obtained from the FEA simulation as shown in Fig. 3. This was an output of the finite element models for the designed capacitive sensor in the 3D tumbler model. The electric field is represented by a set of curves and field lines, which are aligned along the local field direction with spacing inversely proportional to field intensity. Because the water’s permittivity and conductivity were higher than those of air, the electric field intensity of the tumbler with water was much higher, when compared to the tumbler with air. Additionally, by observing the electric field between the main and reference sensors, the designed position of the two sets of electrodes could avoid interference from adjacent electrodes.
Figure 4 shows the electric field intensity variation of the capacitive sensor as the water level increased in the 3D FEA simulation. The electric field intensity of the main sensor increased as the water level increased [17]. However, because the height of the reference sensor was only 1 cm lower than the main sensor, the electrical field intensity of the reference electrodes increased until the reference sensor was submerged. Subsequently, there was no variation observed in the electric field distribution.
The capacitance value of the electrode width variation was acquired from the FEA simulation as shown in Fig. 5. With regard to the relationship between the capacitance value and the water level, as the water level increased, the capacitance value of the main sensor increased almost linearly. The capacitance of the reference sensor increased quickly, before the water level rose to 1 cm and submerged the sensor exactly, and then remained unchanged until the tumbler was full of water. These results are in agreement with the electric field intensity variation as shown in Fig. 4. Additionally, the simulation results show that the capacitive sensor with larger size has a much larger capacitance value. Because all of the sensors have the same space between the two electrodes, the capacitance value obtained from the 4 cm width electrodes is obviously greater than the value obtained from other sizes.
Figure 7.
Experimental results of capacitance value measured by various sizes of sensor electrodes. (a) Capacitance value measured by various sensor electrode sizes; (b) difference in capacitance value between main sensor and reference sensor.
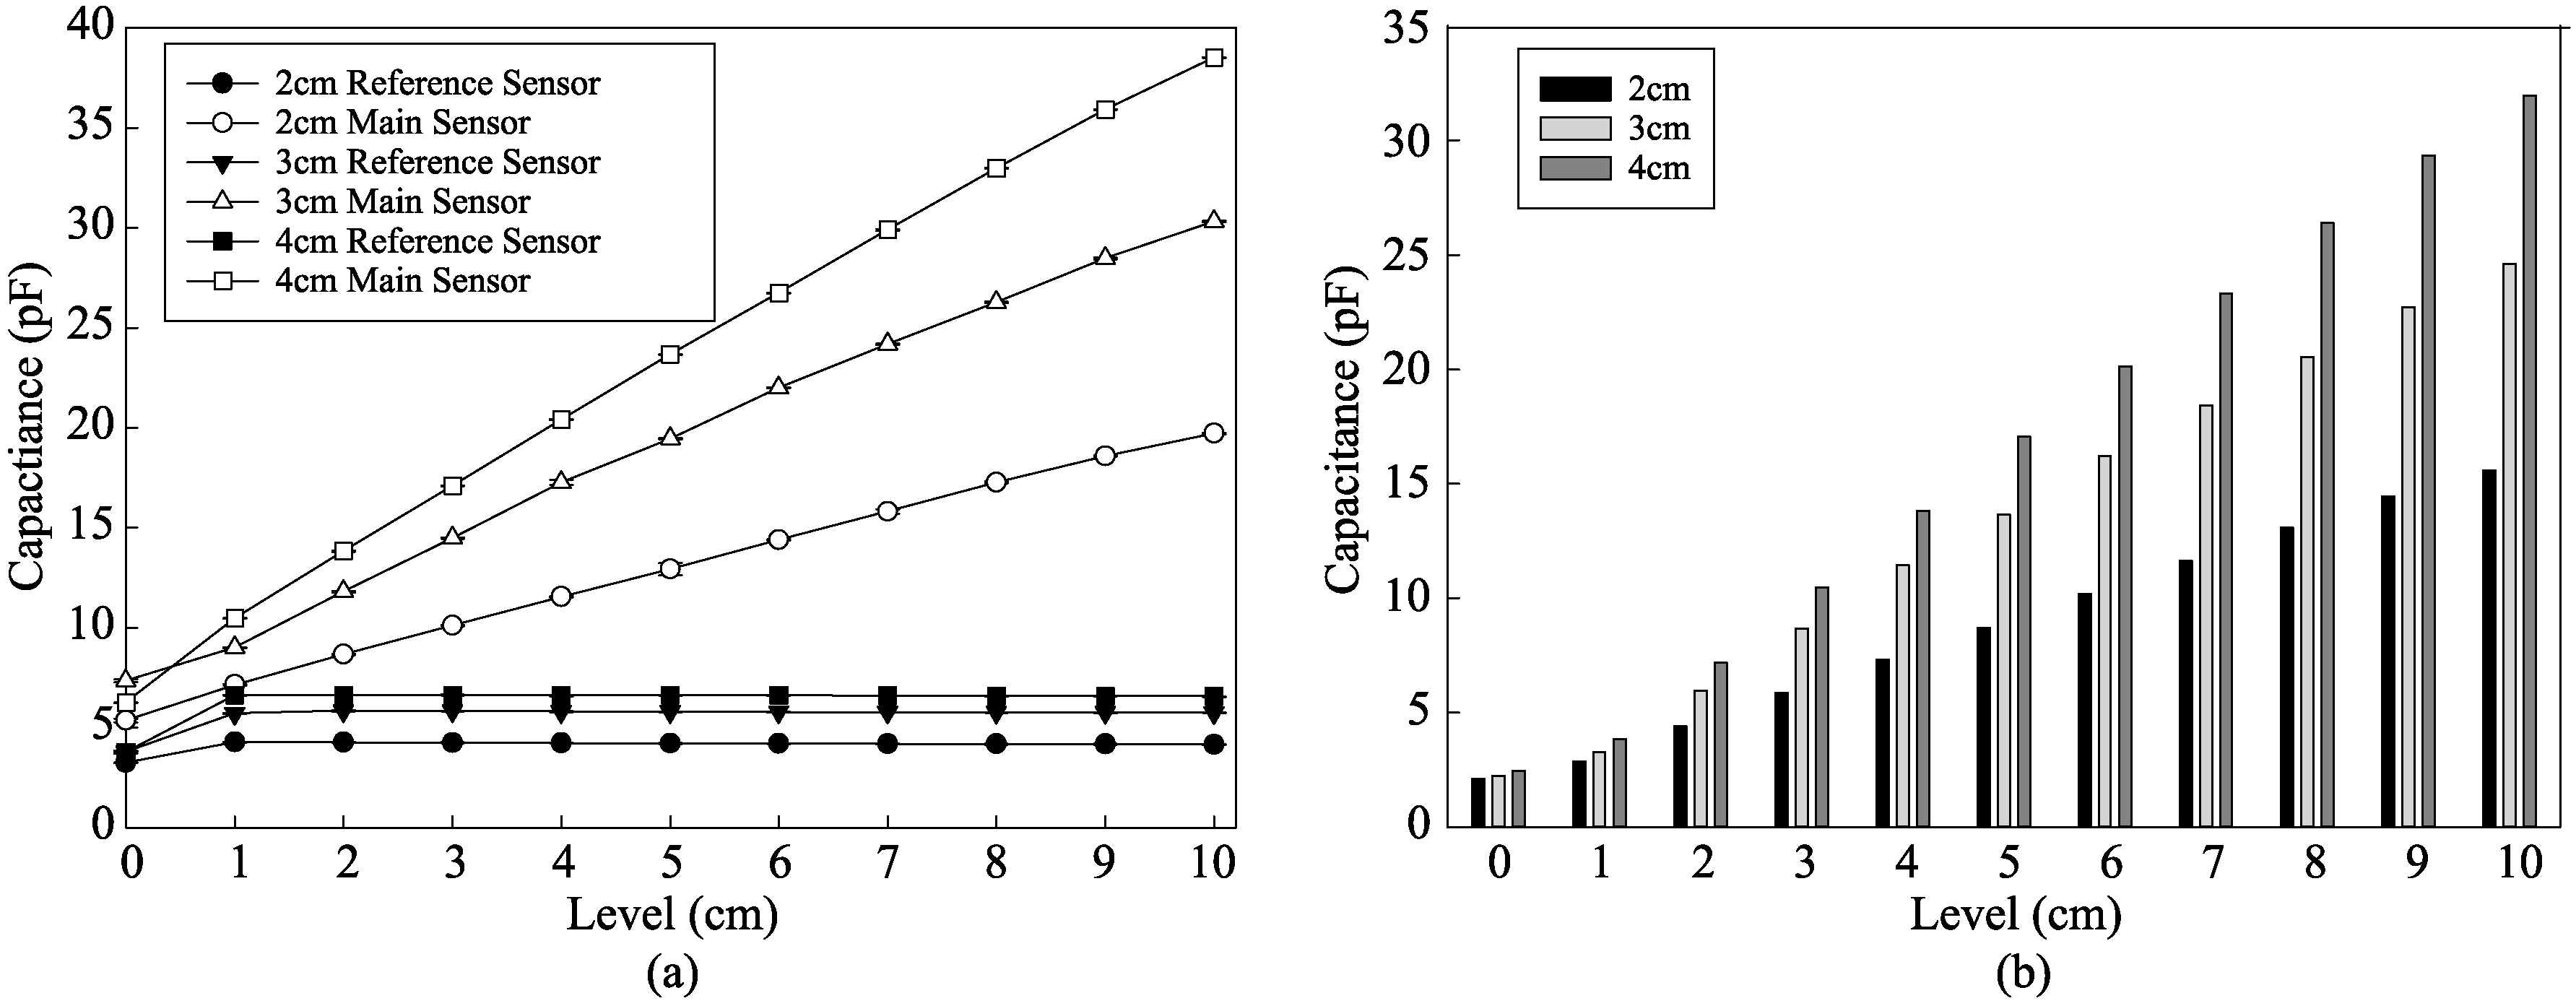
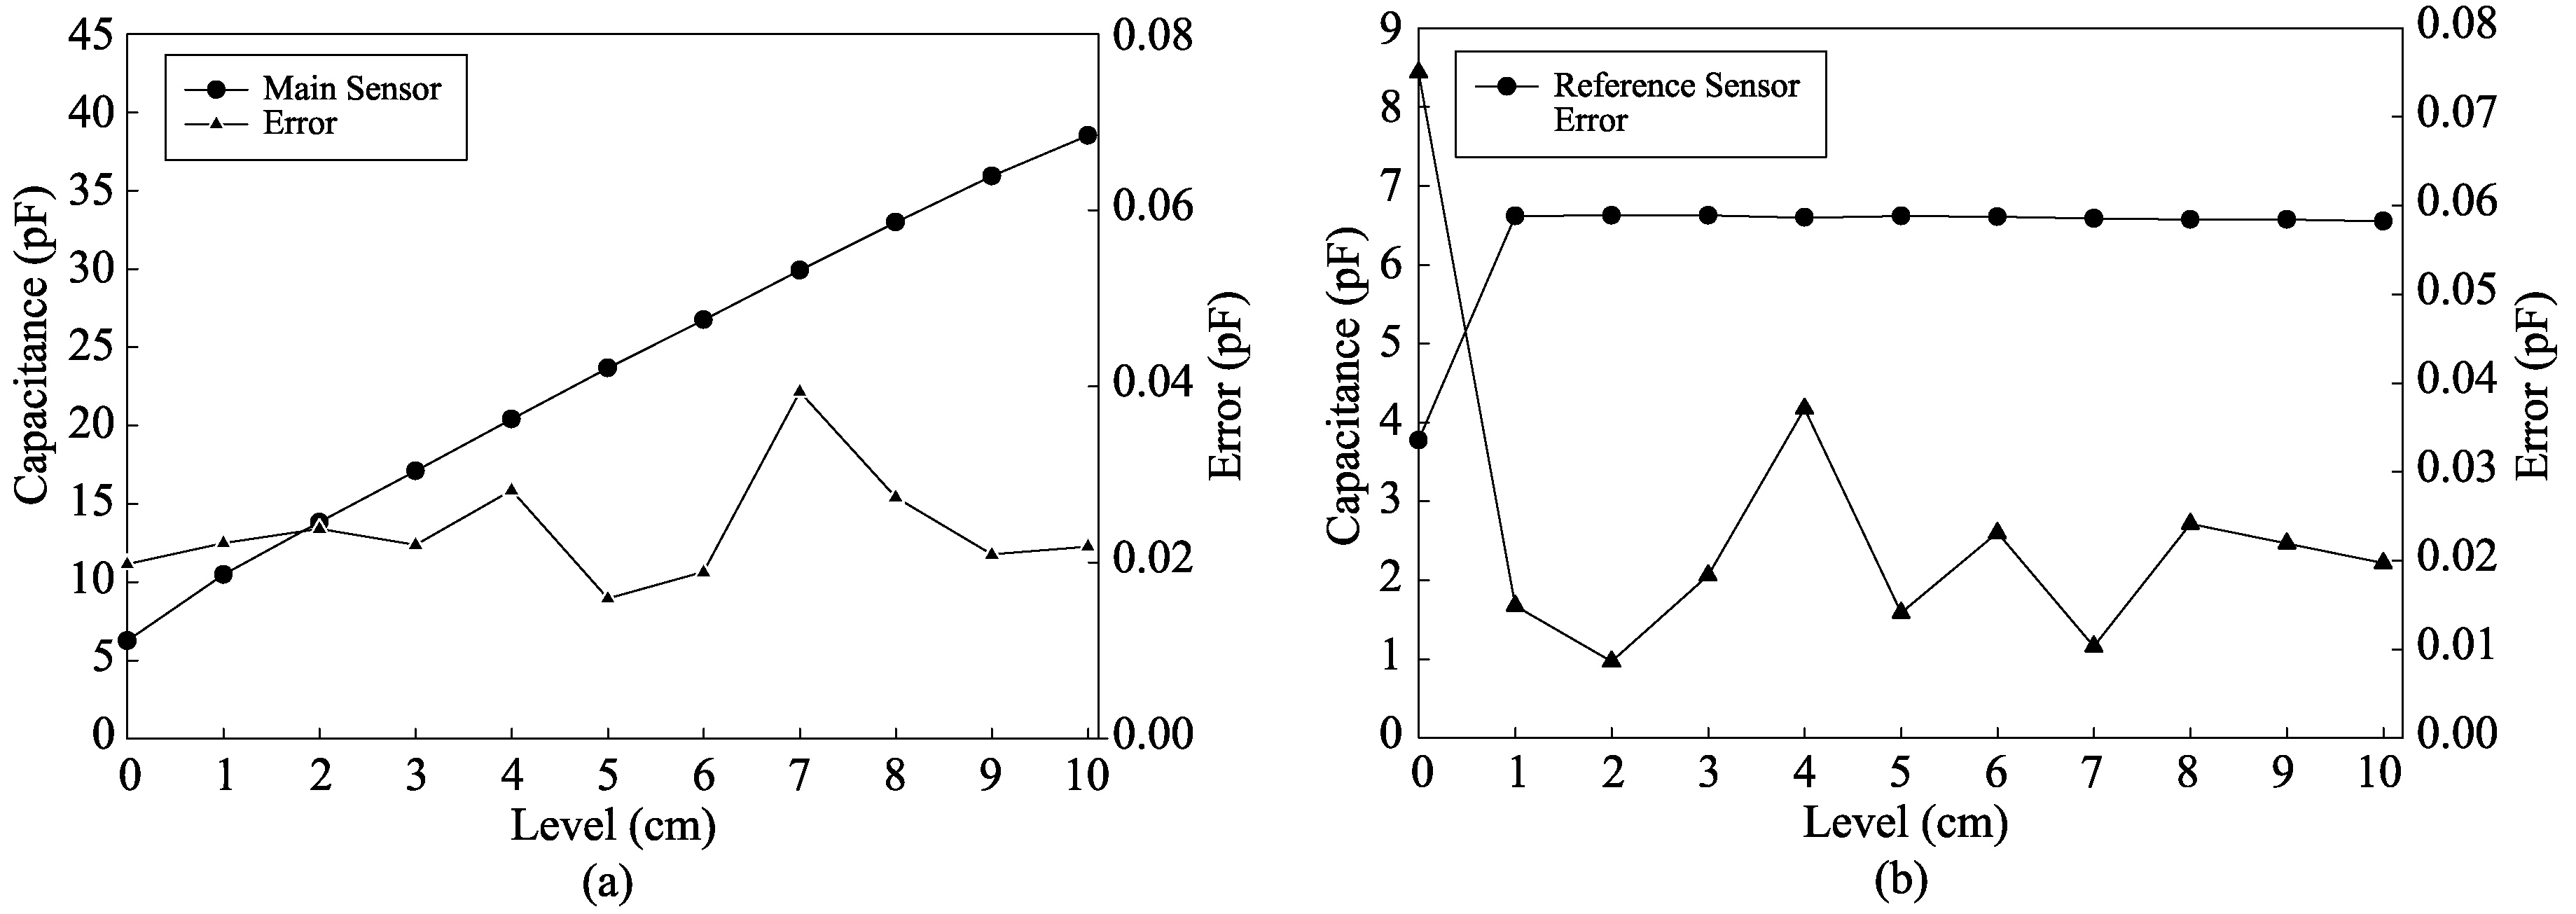
Figure 8.
Graph of capacitance value measured by the 4 cm width sensor electrode. (a) Capacitance value of main sensor; (b) capacitance value of reference sensor.
2.Sensor fabrication and performance test
According to the FEA simulation results, the capacitive sensor includes the main sensor and reference sensor both made of copper plates, as shown in Figure 6a. The copper plate thickness was 1 mm, which made the copper easy to bend for fixing the electrodes on the surface outside of the round Tritan cup. The height of the main and reference sensors was 10 cm and 1 cm, respectively. The width of the electrodes was 2 cm, 3 cm and 4 cm, respectively, and the spacing between the copper electrodes was 1 cm. The design considerations were the same as the conditions of the capacitive sensor in the FEA simulation.
As shown in Fig. 6b, the main sensor and reference sensor were fixed face to face on the outside of the Tritan cup by insulating tape. The tumbler shell was 3D printed with PLA material. For the experiment, the implemented capacitive sensor was connected to an LCR meter (LCR-819, Taiwan), which was used in this performance test in order to acquire the capacitance value. After the LCR meter was calibrated to zero, two LCR meter probes were connected to each sensor for measuring the capacitance variation of the capacitive sensor [18]. The range of the test frequency sweep was set to 1 kHz and applied voltage was set to 1 V. The water added to the tumbler followed the level scale in order to observe the capacitance variation Temperature and humidity were controlled at approximately 23
Figure 9.
Graph of capacitance value measured with varieties water temperature.
3.Results and discussion
Figure 7 shows the capacitance value variations of the manufactured capacitive sensors assembled in the tumbler measured by the LCR meter. The hollow and solid dots show the capacitance values of the main sensor and reference sensor respectively. The capacitance value of the main sensor increases linearly as the water level increases from 0 cm to 10 cm. In addition, the capacitance value of the reference sensor increased substantially from 3 pF to 6 pF before the water level was 1 cm, which was lower than the height of the reference sensor. Beginning from 1 cm, the capacitance value stayed at approximately 5–6 pF until the tumbler filled with water. Moreover, the experimental results also show that the larger electrodes acquired a larger capacitance value. In the experiments, the largest sensor electrode width of 4 cm acquired the maximum capacitance value. The largest electrode width had the largest value of capacitance difference between the main and reference sensor and was more suitable to accurately detecting the water level. The experimental results are in agreement with the results of the FEA simulation; however, the capacitance values of the experimental results were larger than the capacitance values in the FEA simulation. It was assumed that this was due to the purity of materials used in the capacitive sensor and tumbler fabrication. The conductivity and permittivity of the materials was different between the FEA simulation and the experiments. Figure 8 shows the capacitance values of the capacitive sensor’s 4 cm width electrode, main sensor and reference sensor respectively. The capacitance value of the main sensor increased linearly from approximately 6 pF to 38 pF as the water level rose from 0 cm to 10 cm. The capacitance value of the reference sensor increased from 3.8 pF to 6.8 pF as the water level rose from 0 cm to 1 cm. The capacitance value was kept at approximately 6.8 pF until the tumbler filled with water up to 10 cm. The error values of the capacitance measurement were assessed by the standard deviation from the average values of every data. The variation of the capacitance value measured with the several temperature of the water was shown in Fig. 9. The capacitance value overall increased as the water temperature increased. However, the variation rate is very small that can be ignored. It is assumed that the dielectric constants as permittivity and conductivity increased very small as the water temperature increased [19].
Figure 10.
Comparison of the developed compensation algorithm and actual level through the measured capacitance value. (a) Water level calculated by Eq. (1) versus using Eq. (2); (b) error value comparison of Eqs (1) and (2).
Figure 11.
The graph of measured water volume versus actual water volume.
However, due to the capacitance value of the main and reference sensors for each water level interval, variations could exist [20]. In order to match the actual level to the measurement water level, Eq. (2) based on the 1
(2)
(3)
4.Conclusion
In this paper, we presented the results of a study on designing a capacitive sensor for developing an automatic water level measuring tumbler. The proposed design differs from a traditional capacitive sensor with one pair of electrodes, because it has two pairs of electrodes as the main sensors for measuring the capacitance value of the water level in the tumbler, and a reference sensor for measuring the incremental unit of the main sensor. The feasibility and optimized shape of the proposed capacitive sensor were verified and established by a 3D model, which was subjected to FEA simulation. According to the simulation results, the capacitive sensor was made of copper and assembled with a 3D printed tumbler. By using a high precision LCR meter, the performance of the capacitive sensor on automatically measuring the water level in the tumbler was tested. The experimental results show that the main sensor is able to measure water level variation by the acquired capacitance value of the main electrode, which is proportional to water height. By using the capacitance value of the reference sensor, the water level can be converted by the measured capacitance value. Additionally, in this study, a 1
Acknowledgments
This research was supported by the Bisa Research Grant Program of Keimyung University in 2016.
Conflict of interest
None to report.
References
[1] | Khaliq S, James SW, Tatam RP. Fiber-optic liquid-level sensor using a long-period grating. Optics Letters (2001) ; 26: (16): 1224. |
[2] | Raatikainena P, Kassamakovb I, Kakanakovb R, Luukkalaa M. Fiber-optic liquid-level sensor. Sens, Actuators, A (2009) ; 58: (2): 685. |
[3] | Chengning Y, Shiping C, Guoguang Y. Fiber optical liquid level sensor under cryogenic environment. Sens, Actuators, A (2001) ; 94: (1-2): 69. |
[4] | Doeblin EO. Measurement System Application and Design. 4th ed. New York: McGraw-Hill; (1989) . |
[5] | Liptak BG, Venczel K. Process Measurement and Analysis. 3rd ed. Oxford: Butterworth Heinemann; (1999) . |
[6] | Bently JP. Principles of Measurement Systems. 3rd ed. Singapore: Longman Pub Group; (1995) . |
[7] | Nikolov GT, Nikolova B. Virtual techniques for liquid level monitoring using differential pressure sensors. Recent (2008) ; 9: (2): 49. |
[8] | Burt A, Lehmkuhl M, Burt CM, Syles SW. Water level sensors and datalogger testing and demonstration. Bioresource and Agricultural Engineering (1998) ; 99: (2): 195. |
[9] | Golnabi H. Design and operation of a fiber optics sensor for liquid level detection. Opt Lasers Eng (2004) ; 41: (5): 801. |
[10] | Chih-Wei L, Yu-Lung L, Jiahn-Piring Y, Chin-Ho C. Application of fiber bragg grating level sensor and Fabry-Pérot pressure sensor to simultaneous measurement of liquid level and specific gravity. IEEE Sensors Journal (2012) ; 12: (4): 827. |
[11] | Sakharov VE, Kuznetsov SA, Zaitsev BD, Kuznetsova IE, Joshi SG. Liquid level sensor using ultrasonic Lamb waves. Ultrasonics (2003) ; 41: (4): 319. |
[12] | Vargas E, Ceres R, Martin JM, Calderon L. Ultrasonic sensor for liquid-level inspection in bottles. Sens Actuators A: Physical (1997) ; 61: (1-3): 256. |
[13] | Toth FN, Meijer GCM, Van der Lee M. A planar capacitive precision gauge for liquid-level and leakage detection. IEEE Transactions on Instrumentation and Measurement (1997) ; 46: (2): 644. |
[14] | Canbolat H. A novel level measurement technique using three capacitive sensors for liquids. IEEE Transactions on Instrumentation and Measurement (2009) ; 58: (10): 3762. |
[15] | Nassr AA, Ahmed WH, EI-Dakhakhni WW. Coplanar capacitance sensors for detecting water intrusion in composite structures. Measurement Science and Technology (2008) ; 19: (7): 075702. |
[16] | Qun W, et al. The design of a wireless flexible capacitive sensor detection system to detect liquid level in plastic bag intravenous drip sets. Biomedical Engineering Letters (2011) ; 1: (4): 247. |
[17] | MDemori M, Ferrari V, Strazza D, Poesio P. A capacitive sensor system for the analysis of two-phase flows of oil and conductive water. Sens Actuators A: Physical (2010) ; 163: (1): 172. |
[18] | Tianming C, Bowler N. Analysis of a capacitive sensor for the evaluation of circular cylinders with a conductive core. Measurement Science and Technology (2012) ; 23: (4): 045102. |
[19] | Malmberg CG, Maryott AA. Dielectric constant of water from 0∘C to 100∘C. Journal of Research of the National Bureau of Standards (1956) ; 56: (1): 1. |
[20] | Chetpattananondh K, Tapoanoi T, Phukpattaranont P, Jindapetch N. A self-calibration water level measurement using an interdigital capacitive sensor. Sensor and Actuators A: Physical (2014) ; 209: : 175. |


