
Temperature dependent of viscoelasticity measurement on fat emulsion phantom using acoustic radiation force elasticity imaging method
Abstract
During the past two decades, tissue elasticity has been extensively studied and has been used in clinical disease diagnosis. But biological soft tissues are viscoelastic in nature. Therefore, they should be simultaneously characterized in terms of elasticity and viscosity. In addition, the mechanical properties of soft tissues are temperature dependent. However, how the temperature influences the shear wave dispersion and the viscoelasticity of soft tissue are still unclear. The aim of this study is to compare viscoelasticity of fat emulsion phantom with different temperature using acoustic radiation force elasticity imaging method. In our experiment, we produced four proportions of ultrasonic phantom by adding fat emulsion gelatin. Through adjusting the component of the fat emulsion, we change the viscoelasticity of the ultrasonic phantom. We used verasonics system to gather data and voigt model to fit the elasticity and viscosity value of the ultrasonic phantom we made. The influence of temperature to the ultrasonic phantom also measured in our study. The results show that the addition of fat emulsion to the phantom can increase the viscosity of the phantom, and the shear wave phase velocity decreases gradually at each frequency with the temperature increases, which provides a new material for the production of viscoelastic phantom.
1.Background
Over the past two decades, many elastograpy methods which are based on ultrasound or magnetic resonance imaging have been developed. Magnetic resonance elastography (MRE) has outstanding performance for liver fibrosis staging [1, 2]. It can quantify tissue elasticity over a relatively large area of the liver. However, MRE is not widely available and the associated cost is relatively high, thus its clinical use is limited. As ultrasonic elasticity imaging is non-invasive, painless, easy to operate and good reproducibility, it is widely used in medical imaging. By using local acoustic radiation force to vibrate the soft tissue and measuring the responses of soft tissue, techniques based on acoustic radiation force can measure mechanical properties of soft tissue noninvasively and quantitatively [3]. The main methods of elastic imaging include the shear wave elasticity imaging (SWEI) [4], supersonic shear imaging (SSI) [5], acoustic radiation force impulse imaging (ARFI) [6, 7], harmonic motion imaging (HMI) [8, 9], shearwave dispersion ultrasound vibrometry (SDUV) [10], and shear wave spectroscopy (SWS) [11]. At present, among these methods, several methods, such as ARFI and SSI, have been converted to commercial products and used in clinic studies, such as diagnosis of liver diseases.
Nonalcoholic fatty liver disease (NAFLD) is one of the most common liver diseases in many countries. It is clinically important to noninvasively and accurately assess the severity of hepatic steatosis. NAFLD is a complex disorder which accompanies various histologic abnormalities, including hepatic steatosis, inflammation, and fibrosis. Some studies have been conducted to staging liver steatosis using shear wave velocity dispersion [12, 13]. However, the results of these studies are discrepant when using viscoelastic parameter for staging liver steatosis. The reason for the discrepant results from the previous studies is not clear and it may be caused by many experimental factors, including different techniques, species differences, limited sizes of the species utilized, differences in the shear wave frequencies, and different experimental conditions. Moreover, in clinical or animal model situation, all abnormalities such as steatosis, inflammation and fibrosis may combine with each other and contribute to the change in shear wave dispersion.
Ultrasonic phantom is generally used for calibration of imaging method. Currently, there have been commercial phantoms on the market for ultrasound elastography. The QA049 elastic phantom, which is produced by CIRS Company, is a popular phantom and has been used by many researchers to assess the measurement accuracy of various shear wave elasticity imaging method. However, it can only provide reference value of elastic parameter [14], and the viscous property of the tissue phantom is not fully studied. Since the biological tissue is a viscoelastic, the propagation of the shear wave shows dispersion characteristic [15, 16]. Because liver steatosis always presents as different degrees of lipid accumulation, the characterization of the viscosity may vary between livers at the different stages of liver steatosis. The features of the shear wave velocity dispersion are found to be significantly correlated with different lipid percentages when gelatin phantoms are used [17, 18]. The fat emulsion is made up of soybean oil, medium chain triglycerides, egg lecithin, glycerol, and water for injection. Compared with vegetable oil and animal oil, fat emulsion provides the body’s energy and essential fatty acids, and it is one of the parenteral nutrition that can better simulate the human liver features. In daily life, malnutrition to protein deficiency is an important cause of fatty liver, more common in inadequate feeding or digestive disorders and cannot be synthesized apolipoprotein, so that triglycerides accumulation of liver, and the formation of fatty liver. Therefore, to understand the mechanical properties of the phantom of fat emulsion has a great help for the research of fatty liver, cirrhosis. In addition, the temperature of measurement is an important factor that must be considered. Many studies have shown that the complex modulus will change with the measurement temperature [19, 20, 21]. However, as far as we know, the temperature dependence of viscoelasticity as determined by measuring shear wave dispersion is still poorly studied.
In this paper, we mainly fabricated new viscoelastic phantom which main component is fat emulsion to investigate relationship of the temperature dependent of viscoelasticity in various phantom with different percentages of fat emulsion.
2.Objective
The shear wave generated by local acoustic radiation force can be detected by ultrasonic pulse echo method. The echo signal is received and demodulated to estimate the velocity and displacement of the particle vibration. Then the phase velocity of the shear wave at multiple frequencies can be estimated and the viscoelasticity of the medium can be obtained by fitting the phase velocities at multi frequencies with a given viscoelastic model.
The particle vibration velocity can be estimated from the RF (radio frequency) echo signal through the correlation algorithm [22]. As the Eq. (1),where
(1)
After estimating the particle velocity of the vibration, the particle velocity is accumulated in the slow time to obtain the displacement
(2)
The Fourier transform is used to calculate the phases of the vibration time curve at different spatial positions, so that the phase difference between the different spatial positions during the propagation of the shear wave can be calculated.
The phase velocity can be obtained by:
(3)
Assuming the soft tissue as homogeneous, it can be described by some models, such as the Kelvin-Voigt model, the Maxwell model, or the Zener model. The Kelvin-voigt model is the most commonly used model which is formed by a viscous damper and an elastic spring connected in parallel, as shown in Fig. 1.
Figure 1.
Voigt model.
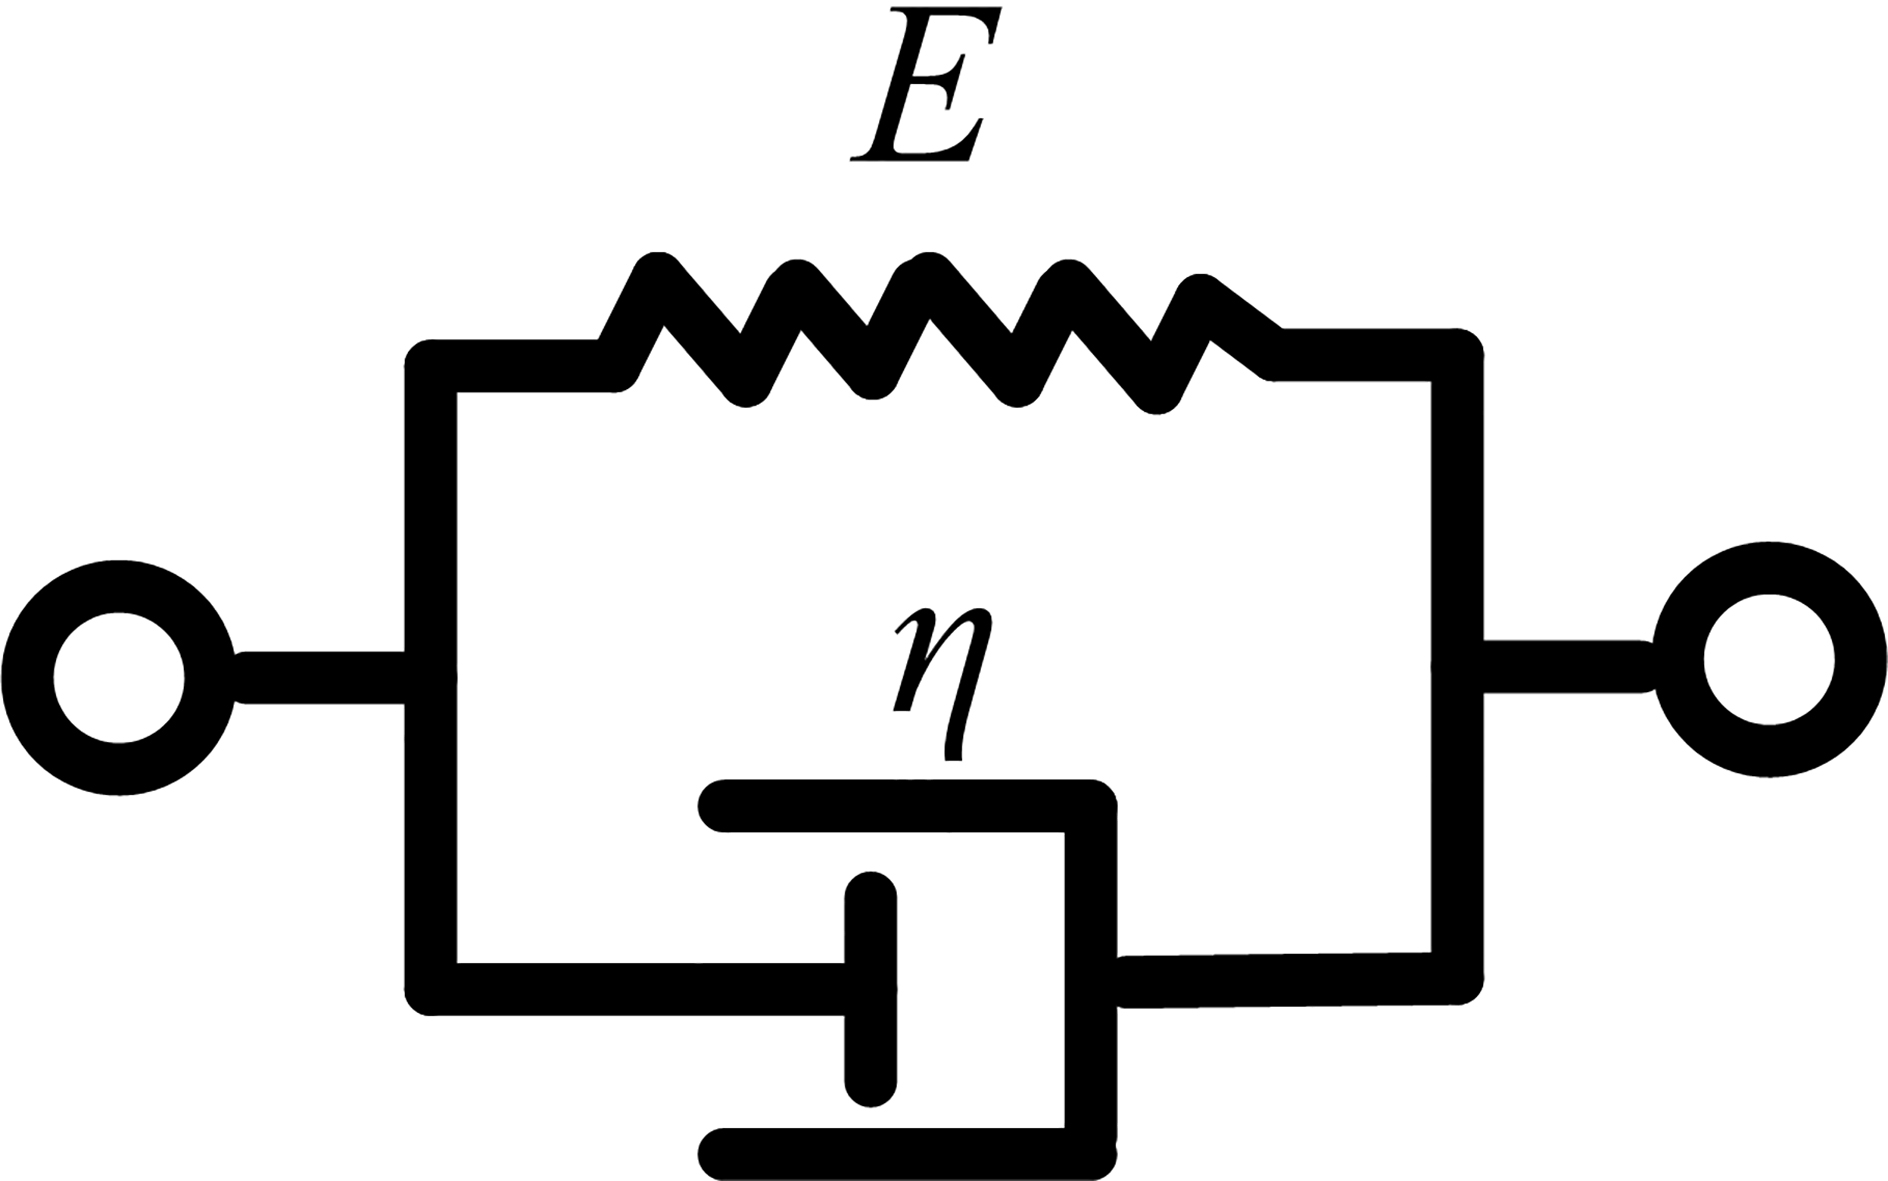
The complex shearing of the Voigt model is shown [23]:
(4)
Where
The phase velocity and complex shear modulus are related to [23]:
(5)
Where
(6)
Where
3.Methods
3.1Fabrication of viscoelastic phantom
The materials used to make the phantoms are shown in Table 1, which included fat emulsion, gelatin powder, cellulose, n-propanol, water, active agent, and preservative. Four proportions of fat emulsion phantom tissue models are needed. Medium and Long Chain Fat Emulsion Injection(C6
Table 1
Material components of the fabricated viscoelastic phantom of fatty liver
| Phantom type | Fat emulsion | Pigskin powder | Cellulose | n-propanol | Water | Active agent | Preservative |
|---|---|---|---|---|---|---|---|
| (%) | (%) | (%) | (%) | (%) | (%) | (%) | |
| ⟀ | 0 | 10 | 1 | 7 | 73 | 8 | 1 |
| ⟁ | 20 | 10 | 1 | 7 | 53 | 8 | 1 |
| ⟂ | 40 | 10 | 1 | 7 | 33 | 8 | 1 |
| ⟃ | 60 | 10 | 1 | 7 | 13 | 8 | 1 |
3.2ARFI experiment
The experiment was based on verasonics vantage 256 system. The ultrasonic transducer used was L7-4v (Philips Healthcare, Andover, MA) with a center frequency of 5 MHz. Programming on a verasonics system and the B-mode imaging system was integrated with the shear wave measurement system, where it provided accurate coordinates for the shear wave measurement system. In the experiment, when the region of interest was selected, the ultrasonic transducer generated the acoustic radiation force to the center of interest and transmitted the excitation wave. At each emission, a time interval of 300
In this experiment, four proportions of viscoelastic phantom are made. For each experimental sample, the temperature of the phantom is monitored by means of a contact thermometer (FLUKE 52) after taking out from the refrigerator. The phantom is measured and the IQ data in the region of interest is used for off-line processing.
4.Results
The displacements curves away from the vibration center are displayed in Fig. 2. It can be seen that the amplitudes of the shear wave decrease with the increasing propagation distance of shear wave.
Figure 2.
The displacement of phantom at the right 6 channels of the point away from the vibration center 0.888 mm, 1.184 mm, 1.48 mm, 1.776 mm, 2.072 mm, 2.368 mm respectively.
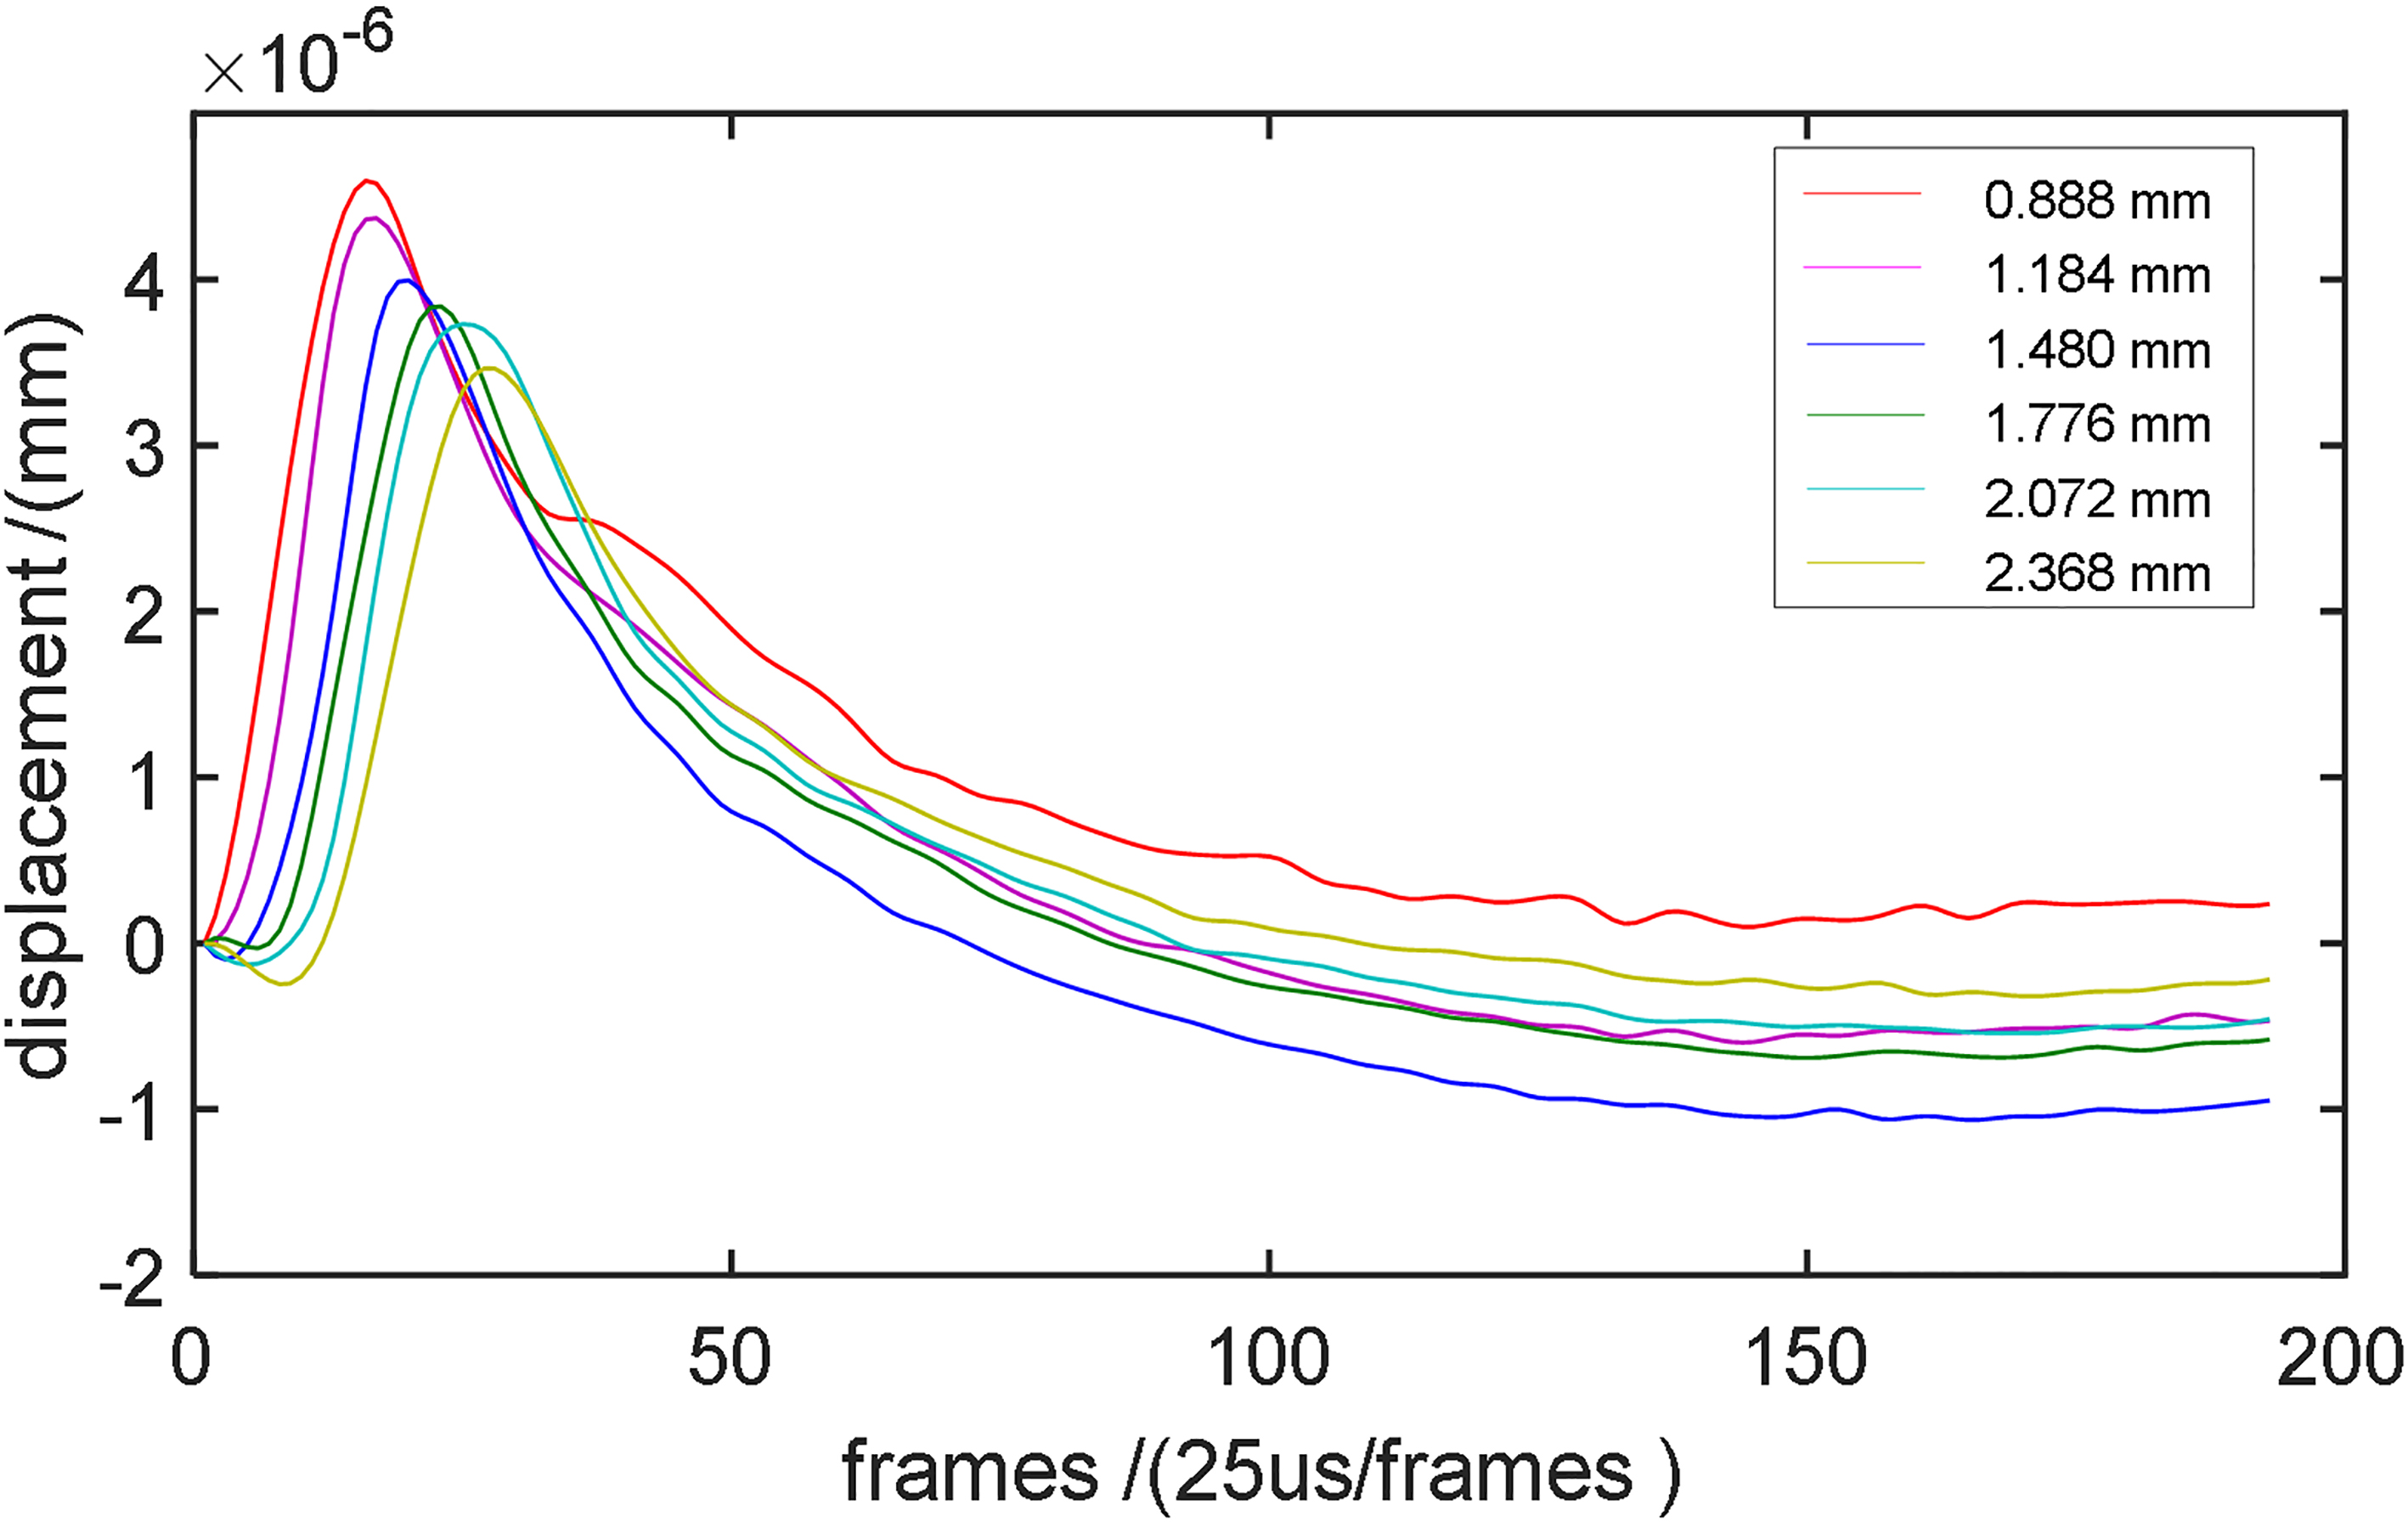
Figure 3.
The dispersion characteristics of the four proportions of fat emulsion phantom when the temperature at 16
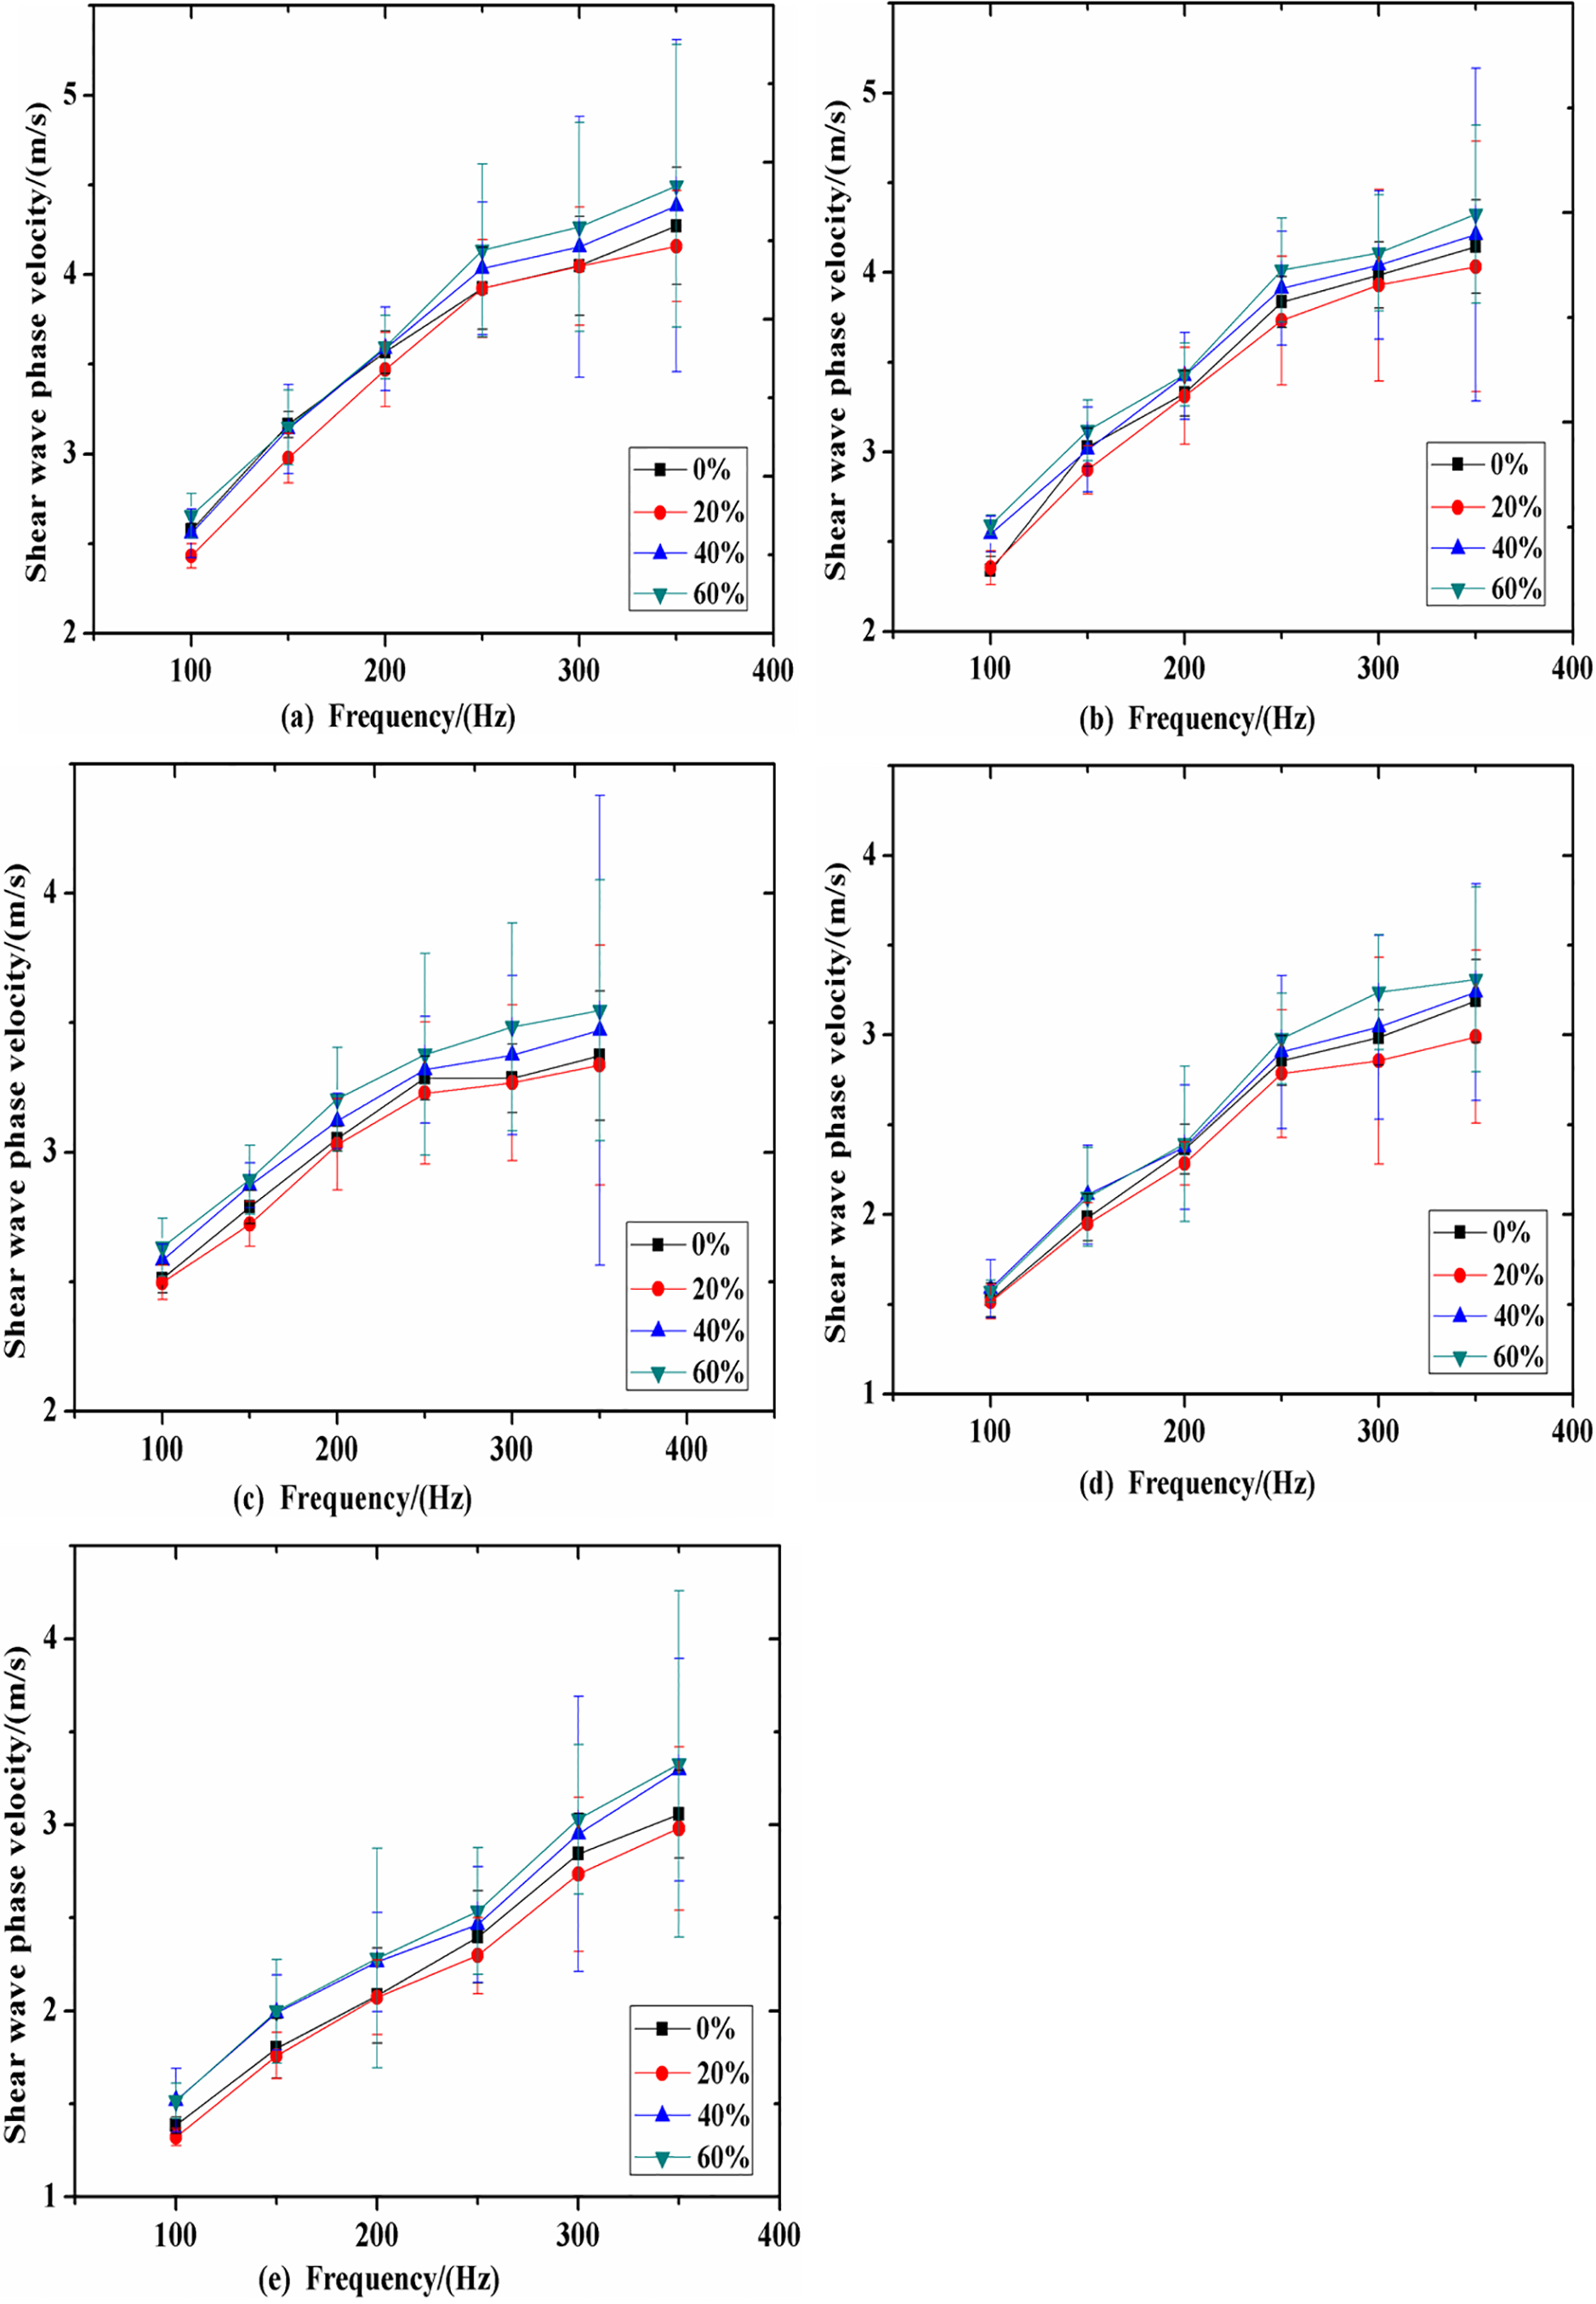
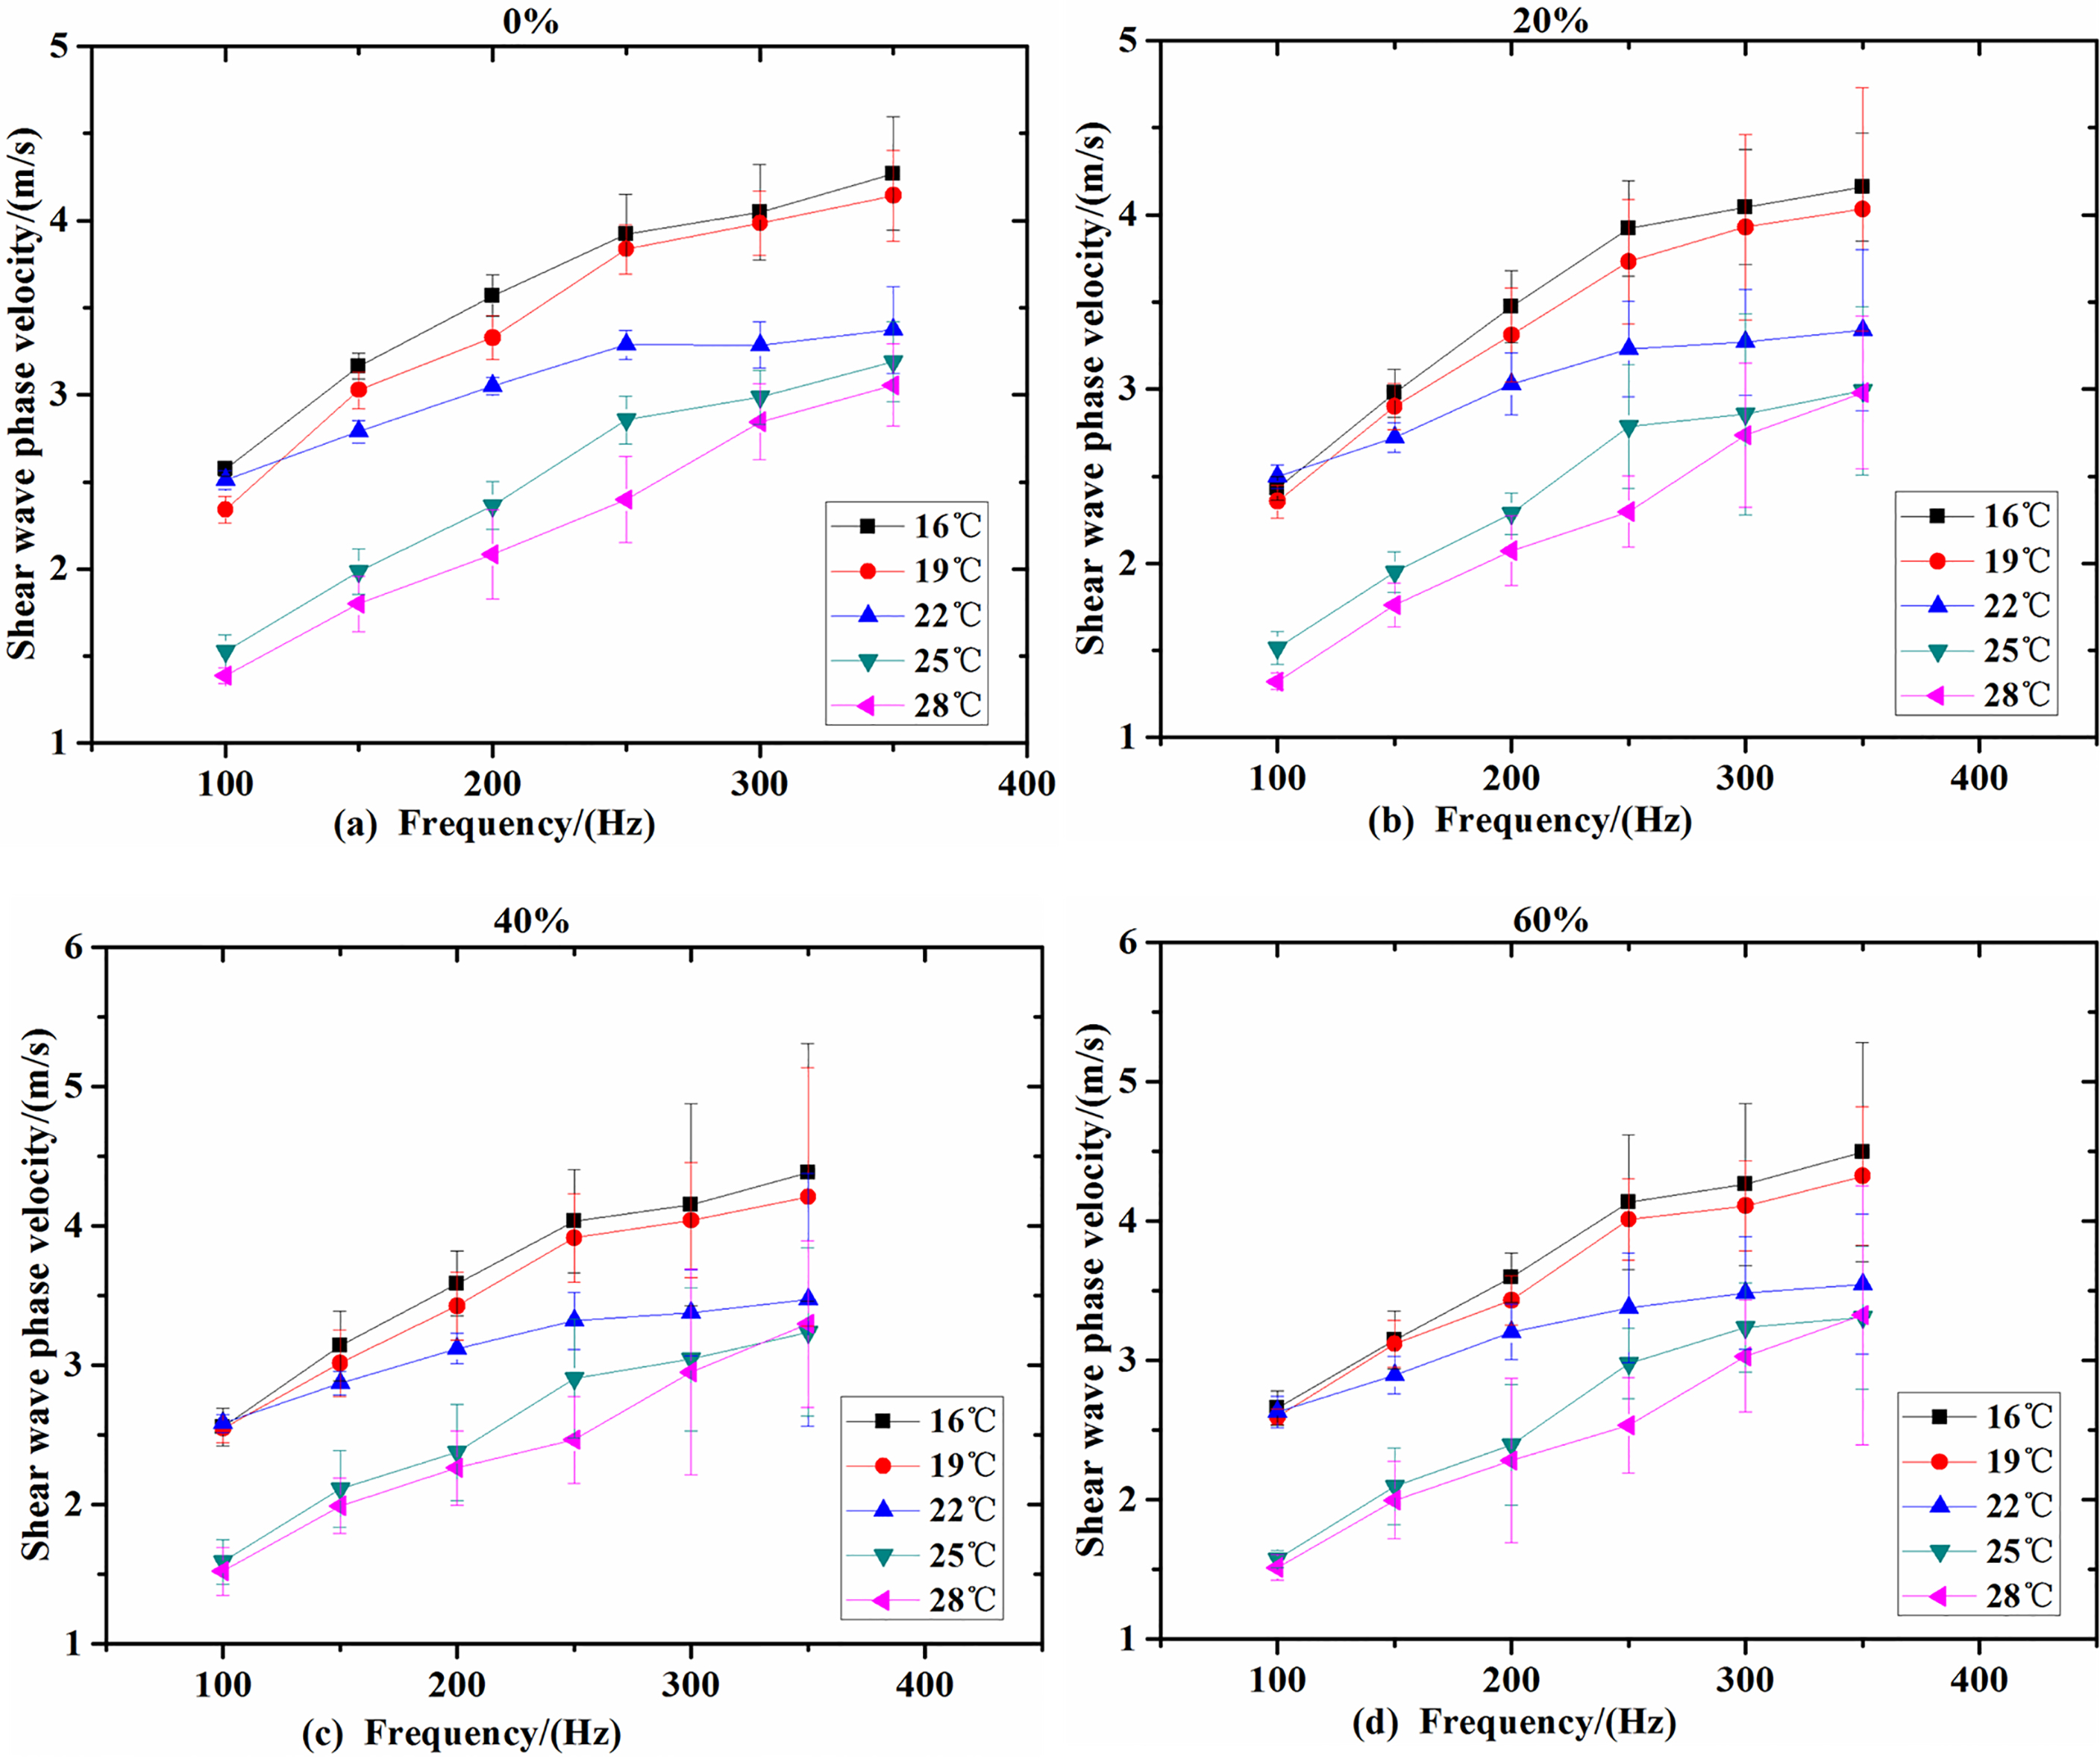
Figure 4.
The shear wave phase velocities of the four proportions of fat emulsion phantoms at different temperatures. (a) The shear wave phase velocities of 0% fat emulsion phantom. (b) The shear wave phase velocities of 20% fat emulsion phantom. (c) The shear wave phase velocities of 40% fat emulsion phantom. (d) The shear wave phase velocities of 60% fat emulsion phantom.
To get the amplitude and phase shift of shear wave at each spatial locations, the displacement of each spatial locations were transformed to the k-f domain, using a Fourier transform. The phase velocity at the 100–350 Hz could be calculated. Figure 3 shows the dispersion characteristics of the four proportions of phantom when the temperature at 16
Overall, adding the fat emulsion can increase the dispersion properties of the viscoelastic phantom. Figure 4 shows the shear wave velocity curves obtained by measuring the viscoelastic phantom at different temperatures. It can be seen that, when the temperature increases, the shear wave phase velocity decreases gradually at each frequency, and this change is more significant in the high range of frequency. In addition, it can be seen that, when the frequency increases, the shear wave phase velocity estimation standard deviation also gradually increases. This is because the shear wave gradually decays with the distance increases, resulting in a larger standard deviation of the high-frequency shear wave velocity estimation.
The viscoelastic values corresponding to the data are fitted by the Voigt model. The 20 groups of viscoelastic data are shown in Table 2, and the R-squared coefficients are used to represent the degree of fit between estimated value and the data.
Table 2
The viscoelasticity of four proportions of phantoms
| Ttemperature | Elasticity (kPa) | Viscosity(Pa.s) | R-squared coefficients | |||
|---|---|---|---|---|---|---|
| Mean | Variance | Mean | Variance | |||
| phantom⟀ | 16 | 1.45 | 0.11 | 2.93 | 0.30 | 0.91 |
| 19 | 1.41 | 0.10 | 2.53 | 0.32 | 0.88 | |
| 22 | 1.26 | 0.13 | 1.63 | 0.03 | 0.92 | |
| 25 | 1.09 | 0.08 | 1.49 | 0.03 | 0.94 | |
| 28 | 1.08 | 0.18 | 1.10 | 0.029 | 0.85 | |
| phantom⟁ | 16 | 1.21 | 0.01 | 1.47 | 0.05 | 0.89 |
| 19 | 1.20 | 1.59 | 1.35 | 0.08 | 0.94 | |
| 22 | 0.98 | 0.24 | 1.34 | 0.11 | 0.92 | |
| 25 | 0.96 | 0.12 | 1.33 | 0.03 | 0.83 | |
| 28 | 0.95 | 0.05 | 0.87 | 0.04 | 0.81 | |
| phantom⟂ | 16 | 1.60 | 0.37 | 2.78 | 0.29 | 0.84 |
| 19 | 1.58 | 0.30 | 2.48 | 0.12 | 0.85 | |
| 22 | 1.40 | 0.08 | 2.21 | 0.04 | 0.82 | |
| 25 | 1.38 | 0.05 | 1.80 | 0.01 | 0. 80 | |
| 28 | 0.97 | 0.13 | 1.32 | 0.02 | 0.85 | |
| phantom⟃ | 16 | 2.05 | 0.17 | 2.99 | 0.20 | 0.83 |
| 19 | 1.95 | 0.18 | 2.83 | 0.11 | 0.81 | |
| 22 | 1.80 | 0.13 | 2.46 | 0.13 | 0.79 | |
| 25 | 1.44 | 0.22 | 2.43 | 0.02 | 0.81 | |
| 28 | 1.24 | 0.08 | 2.37 | 0.03 | 0.82 | |
In Table 2, it can be seen that after adding fat emulsion, shear elasticity of the phantom will increase with the increasing concentration of fat emulsion.
The shear elasticity of the phantom will reach a minimum value when the percentage of emulsion is 20% and reach a maximum value when the percentage of fat emulsion is 60%. At the same time, we also see that the elasticity and viscosity of the phantom decreases with the increasing of temperature, which also shows that the temperature has a certain influence on the viscoelastic property of fat emulsion phantom.
5.Conclusions
In this paper, we measure the dispersion properties of the viscoelastic phantom, which simulate the fatty liver of human and study the effect of temperature on the viscoelasticity measurement. The temperature has a great influence on the measured results, and the dispersion curves of the shear wave velocity show different results at different temperatures for each phantom. At the same frequency, with the increase of temperature, the shear wave phase velocity, elastic value, and viscosity decrease gradually. The real cause of the effect of temperature on shear wave phase velocity, elastic value, and viscous value is not yet clear and need to be studied. In this study, we found that proper increase in the ratio of fat emulsion can increase the elastic value and viscosity value. The values of elasticity and viscosity are highest when the concentration of fat emulsion are in the range of 40% to 60%. However, lower and higher levels of fat emulsion may lead to a decrease in viscoelasticity, so further studies need to find the most appropriate concentration of fat emulsion and to obtain a suitable balance, that we can better research the properties of the fatty liver.
Acknowledgments
This work was supported by the National Natural Science Foundation of China (Grant No. 81601510, 81471735, 81570552, 61427806, 61372006, 61101025), National Natural Science Foundation of Guangdong Province (Grant No. 2016A030310047).
Conflict of interest
None to report.
References
[1] | Huwart L, Peeters F, Sinkus R, Annet L, Salameh N, ter Beek LC, Horsmans Y, Van Beers BE. Liver fibrosis: non-invasive assessment with MR elastography[J]. Nmr in Biomedicine, (2006) , 19: (2): 173-179. |
[2] | Nguyen TM, Couade M, Bercoff J, Tanter M. Assessment of viscous and elastic properties of sub-wavelength layered soft tissues using shear wave spectroscopy: Theoretical framework and in vitro experimental validation[J]. Ultrasonics Ferroelectrics & Frequency Control IEEE Transactions on, (2011) , 58: (11): 2305. |
[3] | Nightingale K. Acoustic Radiation Force Impulse (ARFI) Imaging: A Review[J]. Current Medical Imaging Reviews, (2011) , 7: (4): 328. |
[4] | Shiina T, Nightingale KR, Palmeri ML, et al. WFUMB guidelines and recommendations for clinical use of ultrasound elastography: Part 1: basic principles and terminology[J]. Ultrasound in Medicine & Biology, (2015) , 41: (5): 1126. |
[5] | Bercoff J, Tanter M, Fink M. Supersonic shear imaging: a new technique for soft tissue elasticity mapping[J]. Ultrasonics Ferroelectrics & Frequency Control IEEE Transactions on, (2004) , 51: (4): 396. |
[6] | Doherty JR, Trahey GE, Nightingale KR, et al. Acoustic radiation force elasticity imaging in diagnostic ultrasound[J]. IEEE Transactions on Ultrasonics Ferroelectrics & Frequency Control, (2013) , 60: (4): 685-701. |
[7] | Nightingale K, Soo MS, Palmeri M, et al. Imaging tissue mechanical properties using impulsive acoustic radiation force[C]// IEEE International Symposium on Biomedical Imaging: Nano To Macro. IEEE, Vol. 1: , (2004) : pp. 41-44. |
[8] | Konofagou EE, Hynynen K. Localized harmonic motion imaging: theory, simulations and experiments[J]. Ultrasound in Medicine & Biology, (2003) , 29: (10): 1405-1413. |
[9] | Maleke C, Konofagou EE. In vivo feasibility of real-time monitoring of focused ultrasound surgery (FUS) using harmonic motion imaging (HMI)[J]. IEEE Trans Biomed Eng, (2010) , 57: (1): 7-11. |
[10] | Greenleaf JF, Urban MW, Chen S. Measurement of tissue mechanical properties with shear wave dispersion ultrasound vibrometry (SDUV)[C]// Engineering in Medicine and Biology Society, 2009. EMBC 2009 International Conference of the IEEE. IEEE, (2009) : pp. 4411-4414. |
[11] | Nguyen TM, Couade M, Bercoff J, et al. Assessment of viscous and elastic properties of sub-wavelength layered soft tissues using shear wave spectroscopy: Theoretical framework and in vitro experimental validation[J]. Ultrasonics Ferroelectrics & Frequency Control IEEE Transactions on, (2011) , 58: (11): 2305. |
[12] | Barry CT, Mills B, Hah Z, et al. Shear wave dispersion measures liver steatosis[J]. Ultrasound in Medicine & Biology, (2012) , 38: (2): 175-182. |
[13] | Barry CT, Hah Z, Partin A, et al. Mouse liver dispersion for the diagnosis of early-stage Fatty liver disease: a 70-sample study[J]. Ultrasound in Medicine & Biology, (2014) , 40: (4): 704-713. |
[14] | Madsen EL, Hobson MA, Shi H, et al. Tissue-mimicking agar/gelatin materials for use in heterogeneous elastography phantoms[J]. Physics in Medicine & Biology, (2005) , 50: (23): 5597. |
[15] | Nightingale K, Rouze N, Rosenzweig S, et al. Derivation and analysis of viscoelastic properties in human liver: impact of frequency on fibrosis and steatosis staging[J]. IEEE Transactions on Ultrasonics Ferroelectrics & Frequency Control, (2015) , 62: (1): 165-75. |
[16] | Deffieux T, Gennisson JL, Bousquet L, et al. Investigating liver stiffness and viscosity for fibrosis, steatosis and activity staging using Shear Wave Elastography[J]. Journal of Hepatology, (2015) , 62: (2): 317-24. |
[17] | Liu Z, Bilston L. On the viscoelastic character of liver tissue: experiments and modelling of the linear behaviour[J]. Biorheology, (2000) , 37: (3): 191-201. |
[18] | Zhu Y, Dong C, Yin Y, et al. The Role of Viscosity Estimation for Oil-in-gelatin Phantom in Shear Wave Based Ultrasound Elastography[J]. Ultrasound in Medicine & Biology, (2015) , 41: (2): 601-9. |
[19] | Liu YL, Li GY, He P, et al. Temperature-dependent elastic properties of brain tissues measured with the shear wave elastography method[J]. Journal of the Mechanical Behavior of Biomedical Materials, (2017) , 65: : 652. |
[20] | Tran HTK, Manh T, Johansen TF, et al. Temperature effects on ultrasonic phase velocity and attenuation in Eccosorb and PMMA[C]// Ultrasonics Symposium. IEEE, (2016) : pp. 1-4. |
[21] | Kiss MZ, Daniels MJ, Varghese T. Investigation of temperature-dependent viscoelastic properties of thermal lesions in ex vivo animal liver tissue[J]. Journal of Biomechanics, (2009) , 42: (8): 959-66. |
[22] | Deng Y, Rouze NC, Palmeri ML, et al. Ultrasonic Shear Wave Elasticity Imaging Sequencing and Data Processing Using a Verasonics Research Scanner[J]. IEEE Transactions on Ultrasonics Ferroelectrics & Frequency Control, (2016) , 64: (1): 164-176. |
[23] | Klatt D, Hamhaber U, Asbach P, et al. Noninvasive assessment of the rheological behavior of human organs using multifrequency MR elastography: a study of brain and liver viscoelasticity[J]. Physics in Medicine & Biology, (2007) , 52: (24): 7281-94. |


