
Diabetic macular edema grading in retinal images using vector quantization and semi-supervised learning
Abstract
BACKGROUND:
Diabetic macular edema (DME) is one of the severe complication of diabetic retinopathy causing severe vision loss and leads to blindness in severe cases if left untreated.
OBJECTIVE:
To grade the severity of DME in retinal images.
METHODS:
Firstly, the macular is localized using its anatomical features and the information of the macula location with respect to the optic disc. Secondly, a novel method for the exudates detection is proposed. The possible exudate regions are segmented using vector quantization technique and formulated using a set of feature vectors. A semi-supervised learning with graph based classifier is employed to identify the true exudates. Thirdly, the disease severity is graded into different stages based on the location of exudates and the macula coordinates.
RESULTS:
The results are obtained with the mean value of 0.975 and 0.942 for accuracy and F1-scrore, respectively.
CONCLUSION:
The present work contributes to macula localization, exudate candidate identification with vector quantization and exudate candidate classification with semi-supervised learning. The proposed method and the state-of-the-art approaches are compared in terms of performance, and experimental results show the proposed system overcomes the challenge of the DME grading and demonstrate a promising effectiveness.
1.Introduction
Diabetic macular edema (DME), an advanced symptom of Diabetic Retinopathy (DR), is the major causes of vision loss in diabetic patients and even leads to blindness in severe cases [1]. It is caused by one of the DR lesions, called as exudate, encroaching on the macula in the retina, which is the part of the eye that is responsible for the clear, sharp and detailed vision [2]. The exudates appear as yellow or white structures with varying size, shape and position and often occur in clusters, and occur when the fluid rich in fat begins to leak from the damaged blood vessels and gets deposited. When any exudate occurs near or on the macula, the macula begins to thicken, swell and the patient’s vision becomes to blur. In the retinal images, these DME often has no early warning signs and a patient doesn’t realize his condition until the disease is intensified, so early diagnosis and treatment are critical to prevent progress of disease and vision loss. Currently, the assessment of the severity of DME is based on the distances of the exudate to the macula. The closer the exudate is to the macular, the more the risk increases. DME consists of two types: non-clinically significant macular edema (non-CSME) and clinically significant macular edema (CSME) [2]. The definition of grading criteria is shown in Table 1 in the MESSIDOR database (http://messidor.crihan.fr/index-en.php, updated 2016 November 8). DME are normally detected and graded manually from fundus photographs by clinicians with a time-consuming and laborious intensive process. In addition, the increased prevalence of diabetes and the scarcity of eye care specialists cause a bottleneck to meet the requirement of DME screening. An automatic screening system for grading of the severity of DME is a potential solution to this problem.
Table 1
Criterion for grading of diabetic macular edema
| Grade | Grading criterion | Class |
|---|---|---|
| 0 | No visible exudates | Normal |
| 1 | Shortest distance between macula and exudates | Non-CSME |
| 2 | Shortest distance between macula and exudates | CSME |
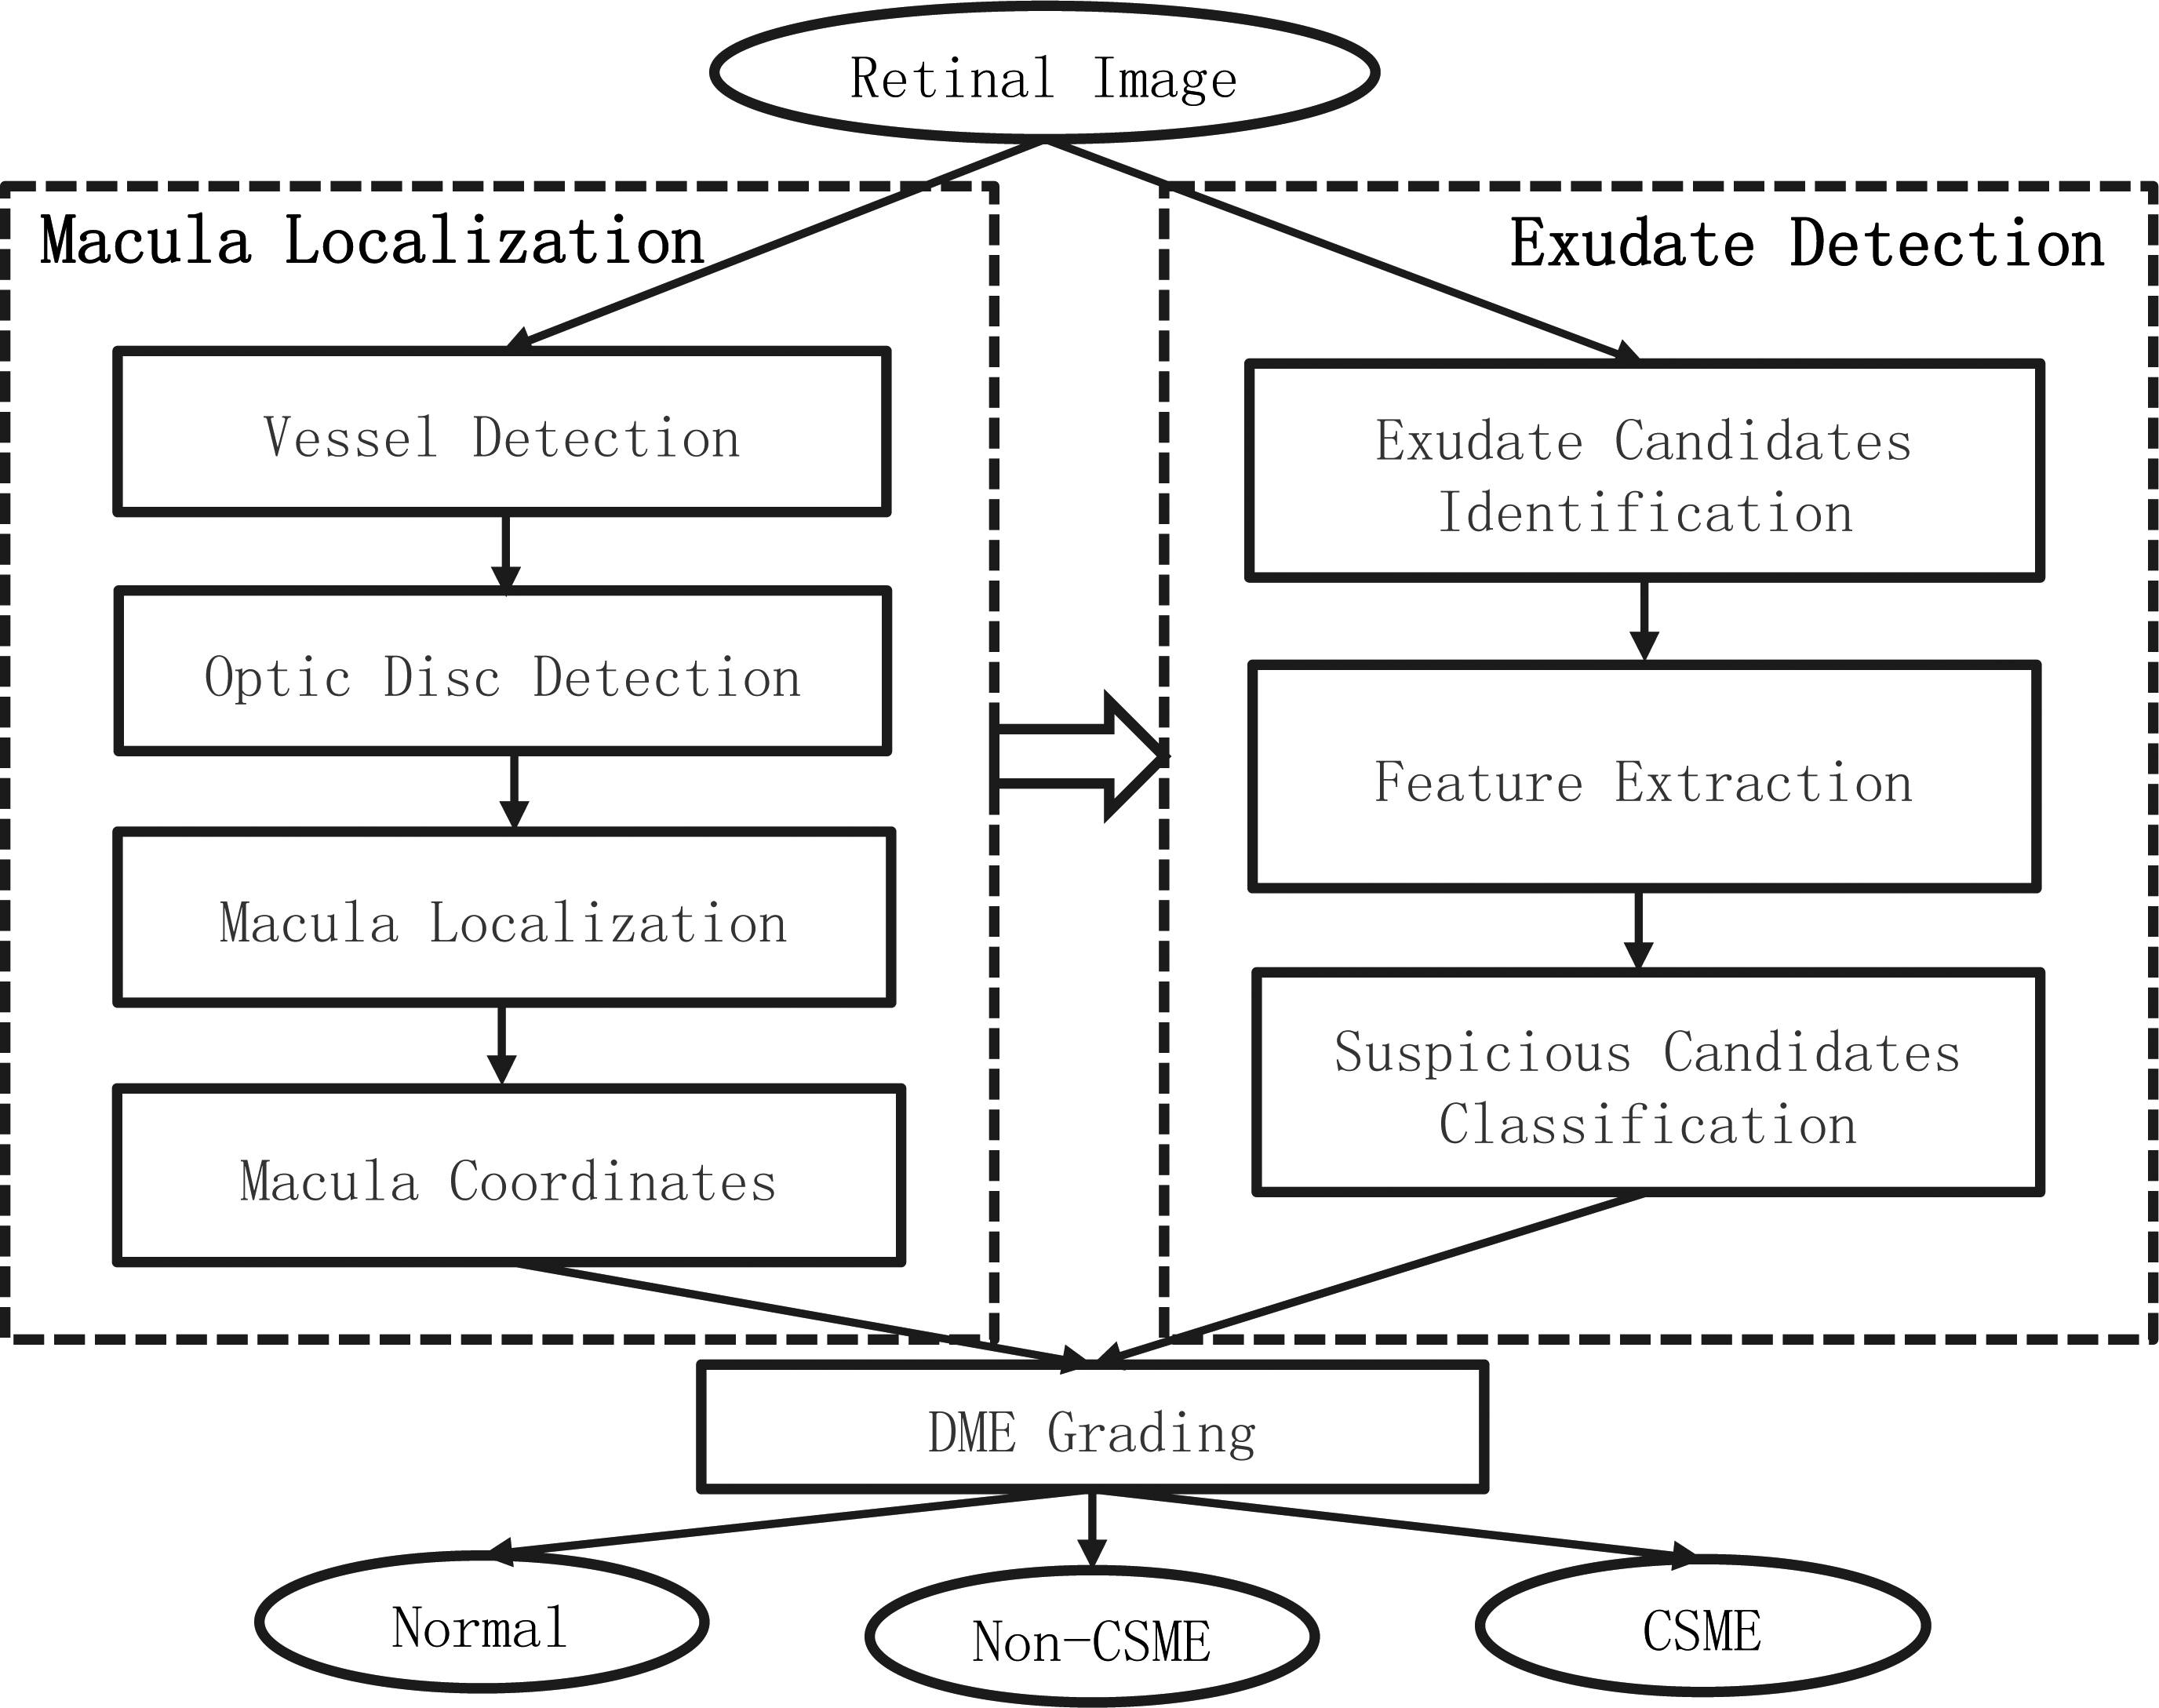
Figure 1.
The flowchart of the proposed algorithm for grading DME.
In a computer aided diagnostic system for DME, automated detection of macula and exudates is a vital task [2, 3, 4]. Recently, many kernel based methods with faster optimization speed or stronger generalization performance have been proposed and investigated with theoretic analysis and experimental evaluation [5, 6]. For example, SVM is used to grade the diabetic maculopathy in [2]. An improved fuzzy C-means along with SVM are utilized for the detection of exudates [7]. Moreover, neural network-based approaches are proposed to automatically detect exudates in retina images [8]. Although a number of methods have been proposed for the macula and exudate detection, there are still some unsolved issues. The major issue is the existence of false positive regions for exudates and macula. Most of the exudate detection methods in DME grading system is generally based on supervised learning algorithms, which need sufficient training dataset with label information. However, there is no publicly available dataset with label of both grading and exudate lesions. For example, the MESSIDOR dataset contains the grading information for DME but no ground-truth location of exudate, whereas E-ophtha dataset (http://www.adcis.net/en/Download-Third-Party/E-Ophtha.html, updated 2014 May 25) contains the location information of exudate without the grading label. In order to deal with the issue of such weakly labeled data, an automatic screening system with semi-supervised learning [9] for DME grading is presented in this study. In the proposed system, multiple features of macula are considered to improve the accuracy of macula detection. Then, during the exudate detection phase a novel vector quantization based detection algorithm is proposed. Finally, a semi-supervised learning method is used to leverage the auxiliary labeled data from a source dataset to improve the generalization ability of classification.
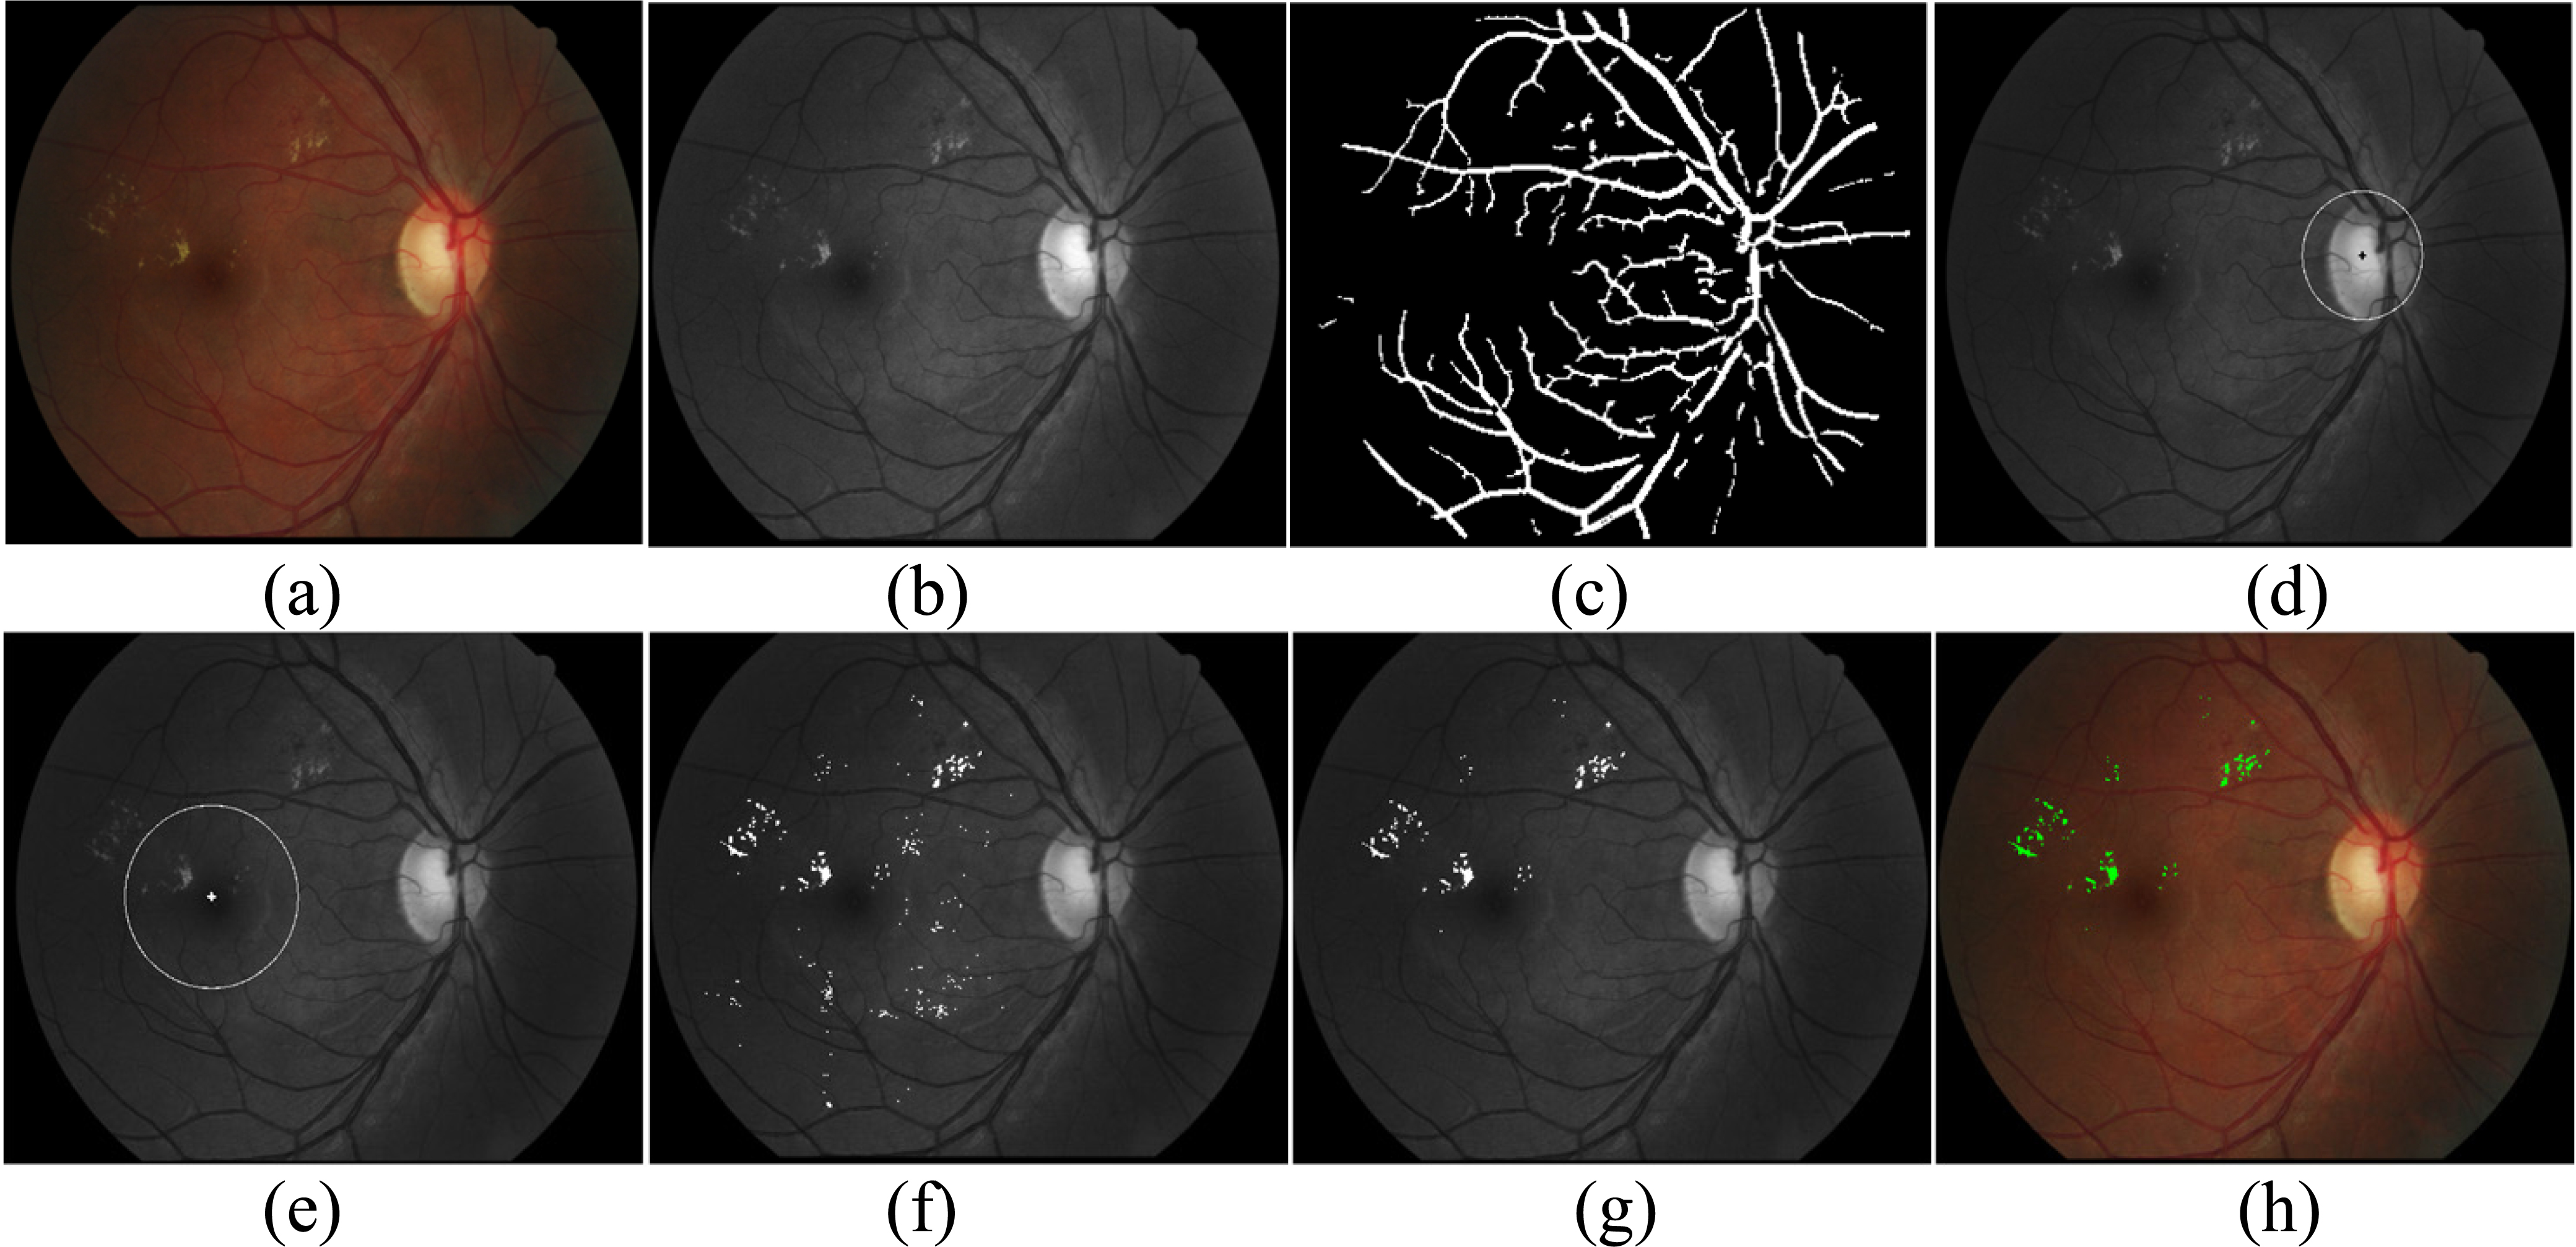
Figure 2.
An example of the proposed procedure. (a) Original image, (b) the green channel image, (c) outputs of main vessel segmentation, (d) OD localization and defection, (e) macula localization and coordinates, (f) outputs of exudate candidates, (g) outputs of exudate classification, (h) the final outputs of exudate in RGB image.
2.Proposed methodology
2.1Overview
The proposed screening system for grading of DME presented can be schematically described by the block diagram in Fig. 1. It consists of three main processing stages: 1) macula localization, containing several main retina tissue detection, i.e. vessel, optic disc and macula; 2) exudate detection, containing three steps of exudate candidates’ identification, feature extraction and suspicious candidates classification; 3) grading of diabetic macular edema, according to macular coordinates and location of exudates to classify the input image into one of the status: normal, Non-CSME and CSME. Once the exudates and macular coordinates are obtained, the grading of DME can be done according to the grading criteria shown in Table 1. The following sections mainly describe the detection methods of macula and exudate in detail.
2.2Macula localization
In the retinal image, macula is the darkest circular region and locates at a specific distance from optic disc (OD). According to the criterion, many methods are proposed [10]. However they fail to detect the macula when the retina contains large dark lesions, i.e. hemorrhages. In this study, a method based on considering multiple features is proposed and achieves a better performance. It is critical to detect the retinal blood vessels and the optic disc prior to localizing the macula.
The method [11] was adopted to assess the size of the OD, and a morphological top-hat operation combined with thresholding technique is employed to segment the main vessels of the retina in the green channel. Then, the OD is detected by using a line operator filter. Following this, a candidate region of interest is defined as the ring area with a radius of 2 to 3 times as the optic disc diameter (DD) from the center of the optic disc [10]. Within the ring area, a circle template with a diameter of about 2/3 of DD [12] is designed and applied to select macula candidates by template matching. Furthermore, two statistic values in the ROI, the mean intensity (
Figure 3.
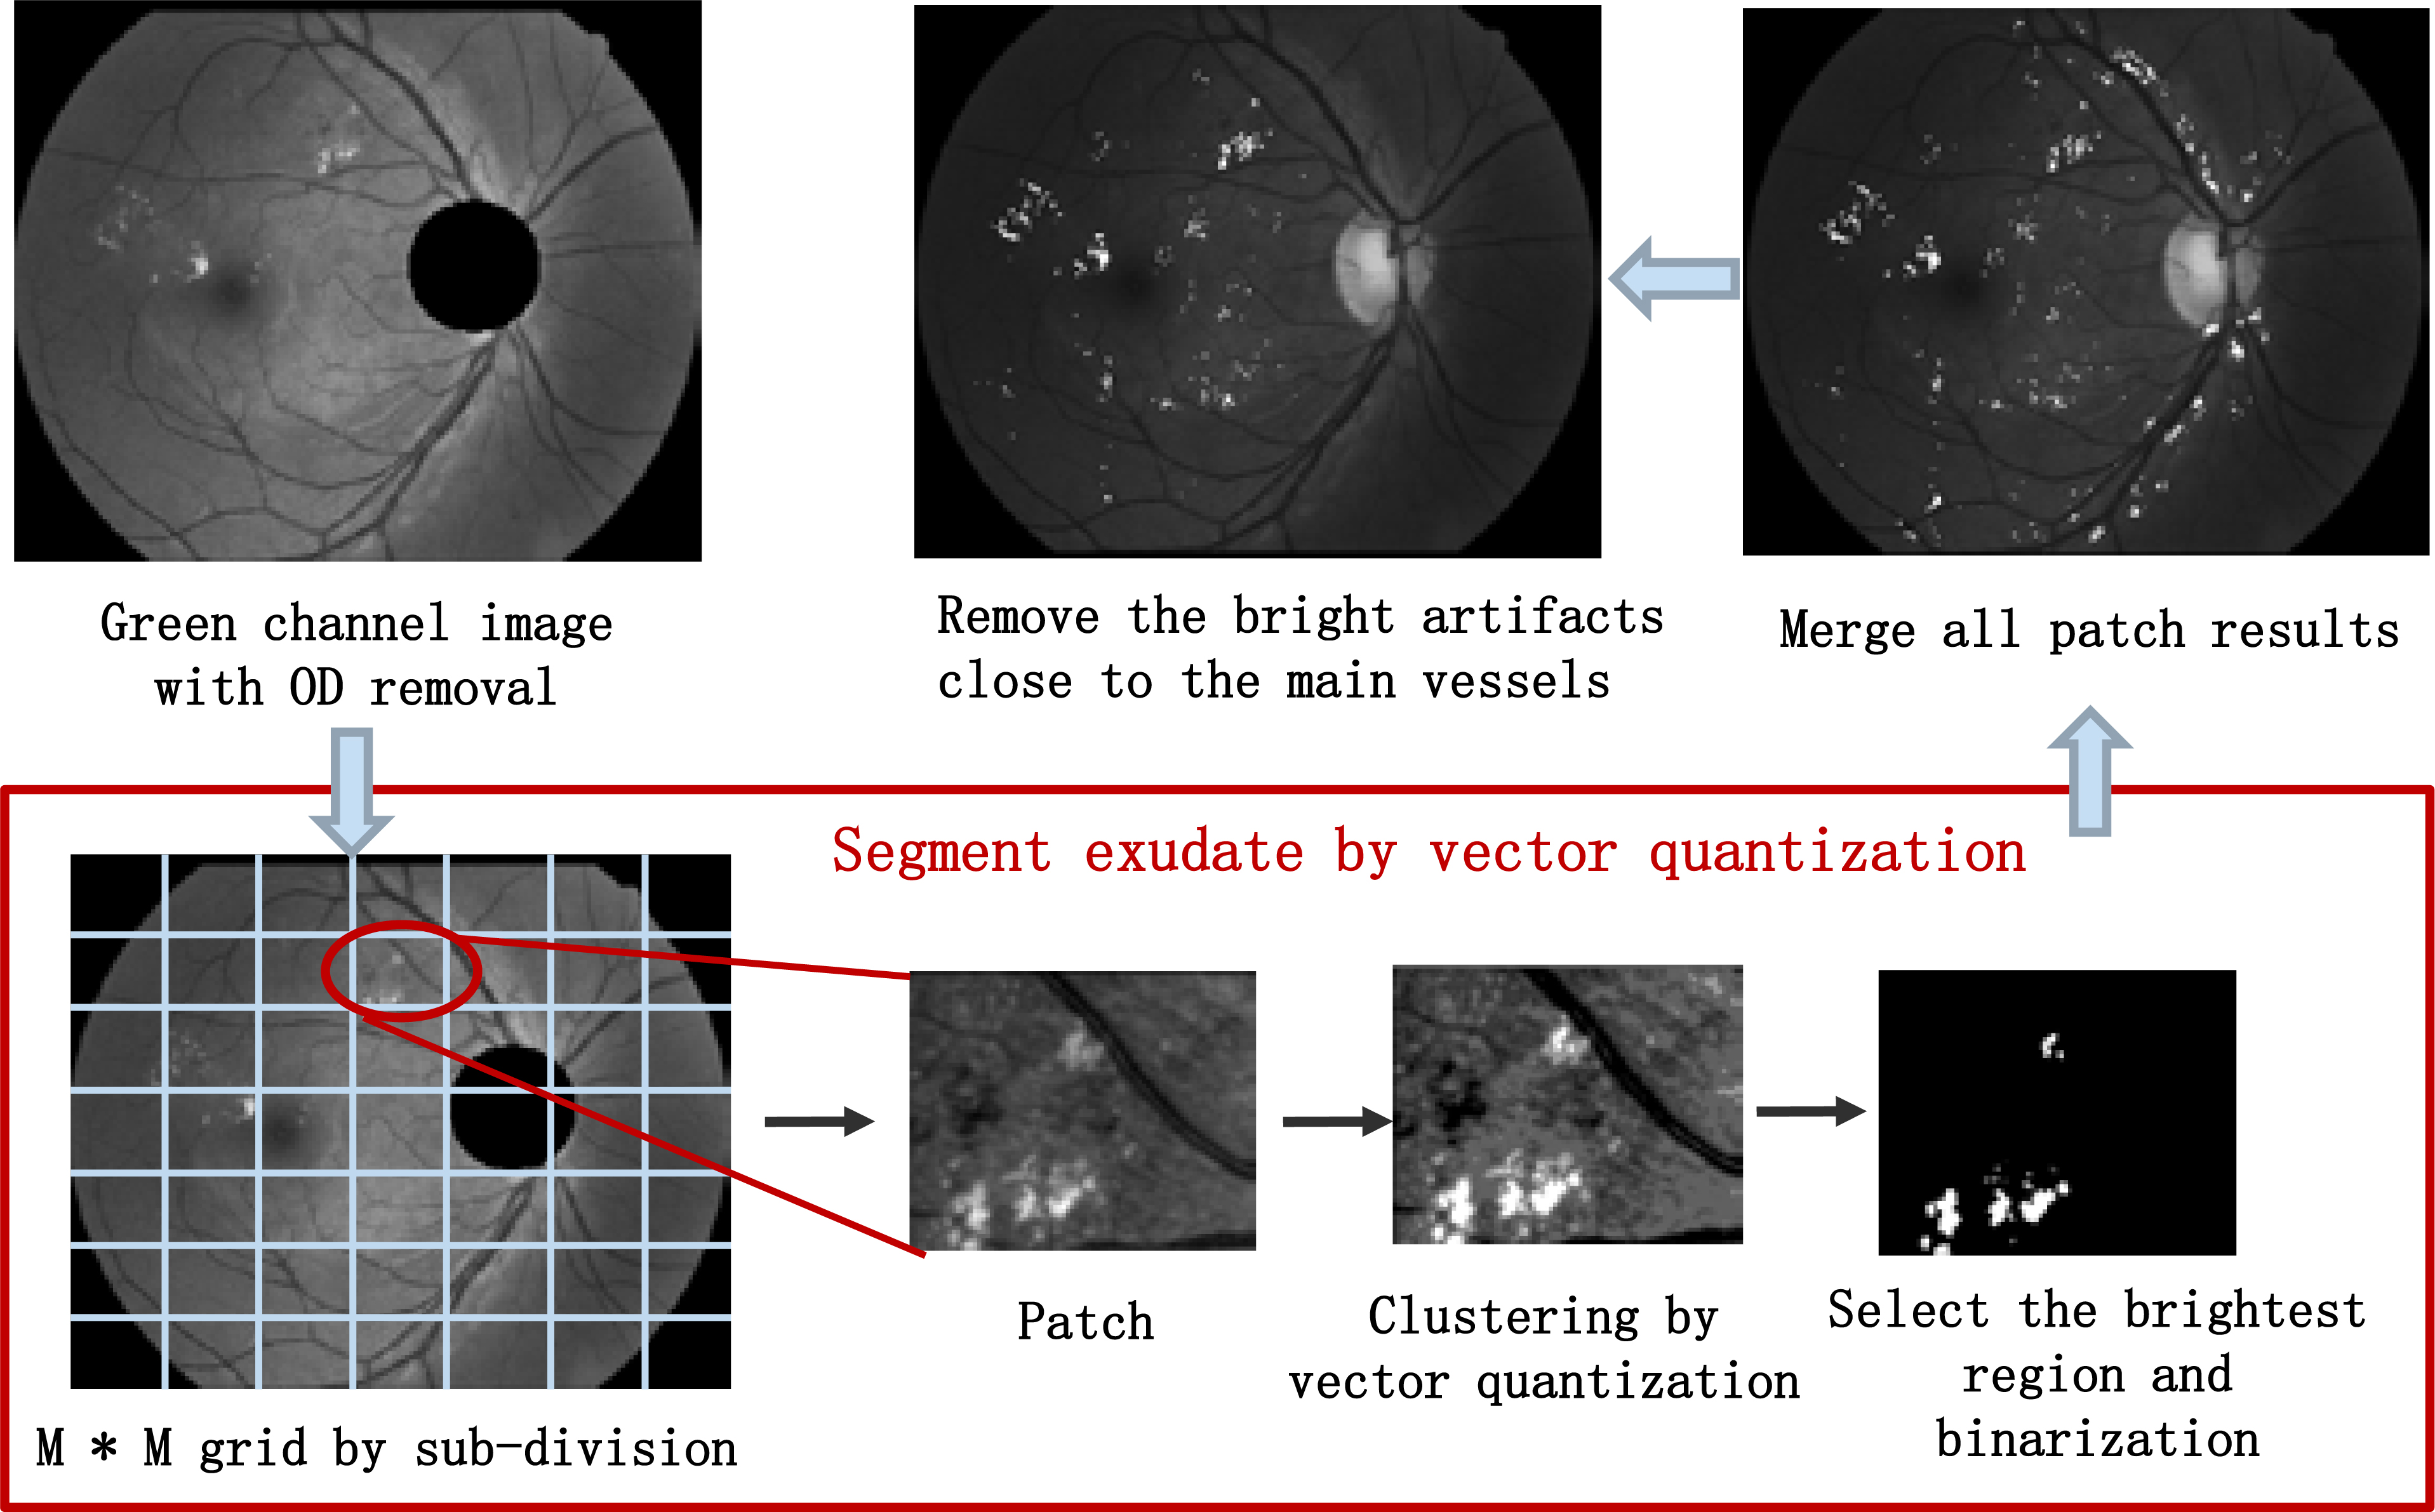
The procedure of the exudate candidates’ identification.
2.3Vector quantization for exudate candidates’ identification
In retinal images, which are usually two-dimensional 24-bit color images obtained through a digital fundus camera, exudates generally appear as bright regions with variable brightness, sizes, locations and shapes. Accurate exudate segmentation is a challenging task due to the large variety in size, intensity, shape and contrast. In this study, the vector quantization (VQ) technique is introduced to segment the exudates. VQ [13] is an efficient technique for data compression, and it can be defined as a mapping function that maps
Intensity inhomogeneity and uneven illumination hinder the segmentation of the exudates. To solve it, a local region-based segmentation is adopted to segment the image into a number of homogeneous sub-images before the clustering. A region-based segmentation scheme is presented in Fig. 3. Firstly, the OD is removed from the green channel image. Then, the image is partitioned into patches with same size by the grid of
(1)
where
2.4Semi-supervised learning for exudate candidates classification
Features extraction is critical for classification. Since exudates appear as yellow or white areas with different size and shape in the retina, color features are extracted from gray level image, the G as well as R channels of RGB color space and the L channel of CIElab color space. Exudates have strong and sharp edges, thus the mean, standard deviation, minimum, maximum of the gradient are calculated on the candidate regions to capture the local gradient information. Entropy is also calculated by including all pixels in bounding square around candidate region to measure the context information of candidate regions. In addition, another two contextual features, the distance to the closest candidate and the number of the nearby candidates, based on the spatial relation with surrounding similar lesions are also taken into account since exudates often occur in clusters and a particular slightly suspect candidate has a higher chance of being a true exudate when another more obvious exudate is present nearby. In total, a 23 dimensional feature is extracted for each candidate exudate.
After extracting features for all candidates, the following phase is to classify them into exudates or non-exudates by machine learning. The traditional classification methods require a sufficiently large number of training datasets with label information. Nevertheless, manually annotating labels for these exudate candidates is difficult. There is no such a publicly available database containing both ground truth of DME diagnosis at an image label and exudate segmentation at a lesion label. Although training a supervised classifier can be done on another datasets with ground truth of exudate, the difference between datasets may lead to a decline in the performance of DME grading. Fortunately, semi-supervised learning (SSL) can provide a suitable solution for this problem. SSL aims to utilize unlabeled data and the limited available labeled data to learn better supervised models with good generalization ability. This study adopt a graph-based semi-supervised learning approach in [9] which defines a similarity graph where vertices are the labeled as well as unlabeled examples, and edges indicate the similarities of pairs of vertices. Let
(2)
where
The first term is the log conditional probability for labeled data, which is defined as:
(3)
where
Table 2
The comparison among different lp using the proposed method for the DME grading on MESSIDOR dataset
| lp | Accuracy | Sensitivity | Specificity | F1-score |
|---|---|---|---|---|
| 20% | 0.889 | 0.797 | 0.915 | 0.786 |
| 40% | 0.912 | 0.842 | 0.931 | 0.831 |
| 60% | 0.945 | 0.894 | 0.958 | 0.887 |
| 80% |
0.975 |
0.946 |
0.982 |
0.942 |
| 100% | 0.927 | 0.865 | 0.943 | 0.855 |
The unsupervised loss is usually defined with the log loss
(4)
Therefore, according to Eqs (3) and (4), the function
(5)
In the optimization phase, stochastic gradient descent (SGD) is applied to train the above model and the result images of suspicious exudates classification are shown as Fig. 2g and h.
3.Results and discussion
The performance of grading the severity of DME is evaluated on 500 images from the publicly available MESSIDOR dataset which only provides the DME diagnosis label. These images were captured at different sizes: 1440
Table 3
The comparison among the state-of-the-art semi-supervised classifiers and DME grading methods on MESSIDOR dataset
| Method | Accuracy | Sensitivity | Specificity | F1-score |
|---|---|---|---|---|
| Neural network | 0.909 | 0.830 | 0.931 | 0.820 |
| Self-training [14] | 0.951 | 0.894 | 0.961 | 0.891 |
| Co-training [15] | 0.960 | 0.890 | 0.960 | 0.879 |
| Lim et al. [3] | 0.852 | 0.809 | 0.902 | Not reported |
| Sreejini and Govindan [4] | 0.945 | 0.91 | 0.98 | Not reported |
| Akram et al. [2] | 0.973 | 0.926 | 0.978 | Not reported |
| Proposed |
0.975 |
0.946 |
0.982 |
0.942 |
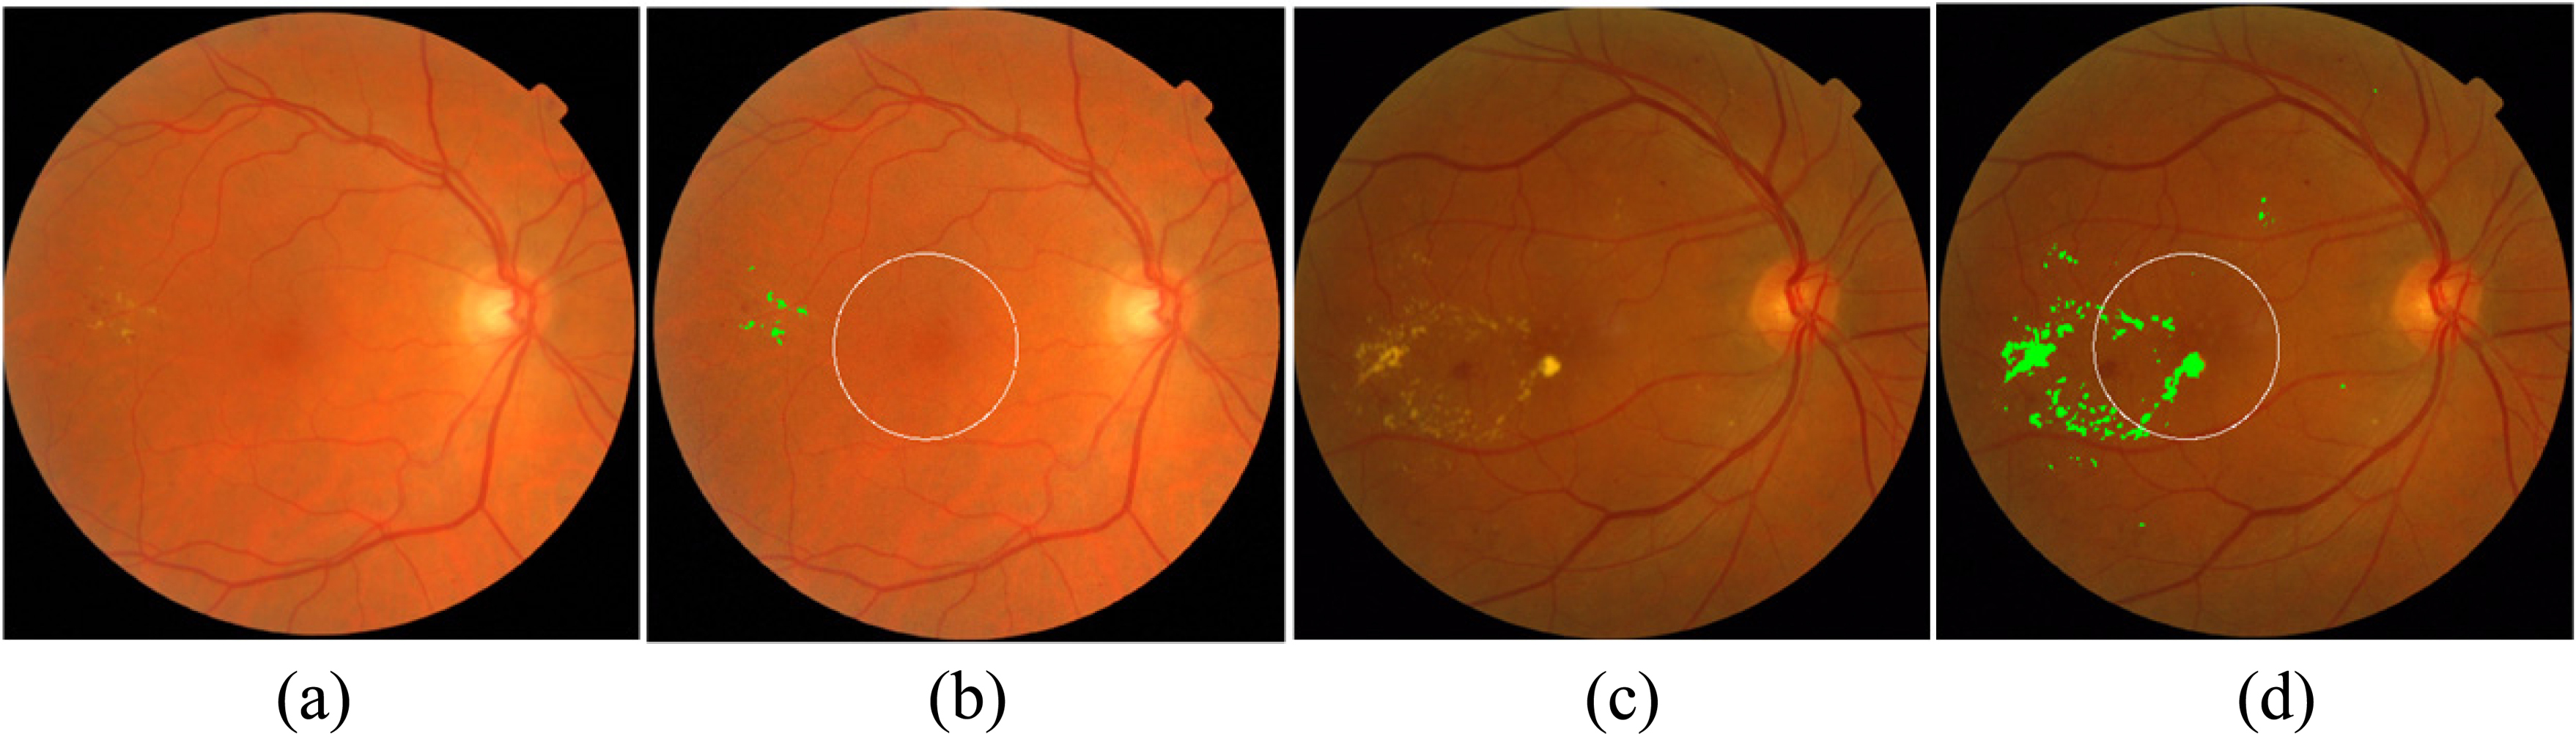
Figure 4.
Examples of macular edema detection for MESSIDOR database. (a) and (b): Original and result of exudate detection and macular coordinates images of a non-CSME example, (c) and (d): Original and result of exudate detection and macular coordinates images of a CSME example, the detected exudates are labelled in green.
The performance of the proposed method is assessed with respect to sensitivity, specificity, accuracy and F1-score (balanced F Score).
where TP is true positives, FP is false positives, FN is false negatives, TN is true negatives,
Ten trials of 5-fold nested cross-validation are adapted to evaluate the performance of proposed algorithm. The parameters (
In Table 3, the performances of DME grading are shown by using supervised neural network classifier, self-training, co-training, the proposed classifier and the methods of the existing system of DME grading. In all the SSL methods neural network is chosen as the base classifier. For three comparable SSL methods,
4.Conclusion
Diabetic macular edema (DME) is an advanced symptom of diabetic retinopathy and can lead to irreversible vision loss. In this study, a computerized assist system for automated macular edema grading is presented. The main contributions of proposed system are macula localization, exudate candidate identification with vector quantization and exudate candidate classification with semi-supervised learning. The proposed method and the state-of-the-art approaches are compared in terms of performance, and experimental results show our system overcomes the challenge of the DME grading and demonstrate a promising effectiveness.
Acknowledgments
This research was supported by the National Natural Science Foundation of China (No. 61502091), the Fundamental Research Funds for Shenyang Municipal Science and Technology Bureau (No. 17-134-8-00) and the Fundamental Research Funds for the Central Universities (No. N161604001 and N150408001).
Conflict of interest
None to report.
References
[1] | Zhang X, Thibault G, Decencière E, et al. Exudate detection in color retinal images for mass screening of diabetic retinopathy. Medical Image Analysis (2014) ; 18: (7): 1026. |
[2] | Akram MU, Akhtar M, Javed MY. An automated system for the grading of diabetic maculopathy in fundus images. International Conference on Neural Information Processing, Springer-Verlag (2012) ; 36-43. |
[3] | Lim ST, Zaki WMDW, Hussain A, et al. Automatic classification of diabetic macular edema in digital fundus images. Humanities, Science and Engineering, IEEE (2012) ; 265-269. |
[4] | Sreejini KS, Govindan VK. Severity grading of DME from retina images: A combination of PSO and FCM with Bayes classifier. International Journal of Computer Applications (2014) ; 81: (16): 11-17. |
[5] | Gu B, Sheng VS. A robust regularization path algorithm for ν-support vector classification. IEEE Transactions on Neural Networks and Learning Systems (2016) . |
[6] | Gu B, Sheng VS, Tay KY, et al. Incremental support vector learning for ordinal regression. IEEE Transactions on Neural Networks and Learning Systems (2015) ; 26: (7): 1403-1416. |
[7] | Zhang X, Chutatape O. Top down and bottom up strategies in lesion detection of background diabetic retinopathy. IEEE Computer Society Conference on Computer Vision and Pattern Recognition (2005) ; 422-428. |
[8] | Schaefer G, Leung E. Neural networks for exudate detection in retinal images. International Conference on Advances in Visual Computing (2007) ; 298-306. |
[9] | Yang Z, Cohen WW, Salakhutdinov R. Revisiting semi-supervised learning with graph embeddings. ICML (2016) ; 40-48. |
[10] | Sinthanayothin C, Boyce JF, Cook HL, et al. Automated localisation of the optic disc, fovea, and retinal blood vessels from digital colour fundus images. British Journal of Ophthalmology (1999) ; 83: (8): 902-910. |
[11] | Ren F, Li W, Yang J, et al. Automatic optic disc localization and segmentation in retinal images by a line operator and level sets. Technology & Health Care Official Journal of the European Society for Engineering & Medicine (2016) ; 24: (s2). |
[12] | Grading diabetic retinopathy from stereoscopic color fundus photographs – an extension of the modified Airlie House classification. ETDRS report number 10, Early Treatment Diabetic Retinopathy Study Research Group, Ophthalmology (1991) ; 98: : 786. |
[13] | Jaspreet K, Amita C. Comparison of several contrast stretching techniques on acute Leukemia images. International Journal of Engineering and Innovative Technology (IJEIT) (2012) ; 2: (1): 332-335. |
[14] | Yarowsky D. Unsupervised word sense disambiguation rivaling supervised methods. Proceedings of Annual Meeting of the Association for Computational Linguistics (1995) ; 189-196. |
[15] | Blum A, Mitchell T. Combining labeled and unlabeled data with co-training. Eleventh Conference on Computational Learning Theory, ACM (1998) ; 92-100. |


