
Efficient use of mobile devices for quantification of pressure injury images
Abstract
Pressure Injuries are chronic wounds that are formed due to the constriction of the soft tissues against bone prominences. In order to assess these injuries, the medical personnel carry out the evaluation and diagnosis using visual methods and manual measurements, which can be inaccurate and may generate discomfort in the patients. By using segmentation techniques, the Pressure Injuries can be extracted from an image and accurately parameterized, leading to a correct diagnosis. In general, these techniques are based on the solution of differential equations and the involved numerical methods are demanding in terms of computational resources. In previous work, we proposed a technique developed using toroidal parametric equations for image decomposition and segmentation without solving differential equations. In this paper, we present the development of a mobile application useful for the non-contact assessment of Pressure Injuries based on the toroidal decomposition from images. The usage of this technique allows us to achieve an accurate segmentation almost 8 times faster than Active Contours without Edges (ACWE) and Dynamic Contours methods. We describe the techniques and the implementation for Android devices using Python and Kivy. This application allows for the segmentation and parameterization of injuries, obtain relevant information for the diagnosis and tracking the evolution of patient’s injuries.
1.Introduction
Pressure injuries are defined as skin lesions; in advanced states they compromise the underlying tissues such as muscles. These injuries are originated from the built-up pressure between bone prominences and skin tissue, for prolonged periods of time, resulting in a disturbance of the normal blood flow through the affected area, and thus in the progressive decomposition of the skin [1]. These chronic wounds reduce the quality of life from patients and their treatment is expensive [2, 3].
The Pressure Injuries are common wounds in disabled and elderly patients, nearly 18% of patients referred to hospitals in Europe suffer from this type of skin injuries, from this group of patients, 7 out of ten are elderly people, moreover half of those will develop a pressure injury within the first weeks of being admitted to the medical center [4, 5, 6, 7]. The patients who developed a pressure injury portrayed a death probability of 25%. Nonetheless, when proper treatment is done on a convenient time, nearly 95% of death case can be avoided [6].
These pressure injuries, can be encountered in four states, for which in the first state, a coloration of the skin begins to appear, turning the skin into a redder or pink color, and has the looks of a rash, however, there is no skin loss. Nonetheless for the second state, skin loss is present, and the injury appears to be blister-like lesion, in the third state the skin has lost its thickness, and the subcutaneous tissues will become visible. On the fourth state of these lesions, it is possible to appreciate other body tissues appearing, such as tendons, and in some extreme cases bone structures [1].
Several image processing techniques have been used in order to aid in the diagnosis and to monitor the evolution of patients in the healthcare system. Mobile devices have proved over the years to provide an adequate tool for fast assessment and tracking of patient status [8, 9, 10].
In this paper, we describe the methodology for the development of a mobile application for the segmentation and assessment of Pressure Injuries, without direct contact between the medical personnel and the affected area, thus reducing the patient discomfort, and the risks of the injury developing any infection, therefore helping to the speedy recovery of the patient. This application aids in the diagnosis and follow up of injuries and its parametrization. The test images used in this development where provided by IGURCO Hospital in the Basque Country-Spain, and where considered as case study to evaluate time and accuracy in the devices.
2.Methods
The system was designed in three stages: Pre-processing, image decomposition and segmentation by morphological operations. On the first stage, images are pre-process in order to conditioning them for the synthesis by reducing the artifacts that degrades the information when samples are taken. The second stage consists of decomposing the image in different contrast level, which allows defining structures over the images as edges by using the Otsu’s threshold method as a variational problem. The final step uses morphological operations over these contours in order to segment the image.
2.1Image preprocessing
The image preprocessing is composed of six steps to allow for the reduction of the information to process and the artifacts that result from image acquisition. Figure 1 presents the image pre-processing flow chart with the respective parameters selected for each technique. The first step is related to the data acquisition and loading the image. The image to process must be in RGB color space where each color channel will be represented by a matrix with the dimensions of the image, and each matrix contains the amplitude values that range from 0 to 255 for each channel.
The second step is to resize the image in order to reduce the information to process. If the height and width of the image are greater than
Due to the definition of the decomposition the third step consists in transformation of the image from an RGB color space, to gray scale values. Here the image is reduced from the three channels of color to just one, with amplitude values between 0 and 255 for each pixel.
The fourth and fifth steps are used to reduce high frequency elements and blur the texture in the image. Here an erosion operation is done with the objective to reduce the texture effect. To do this, a disk structure element with radius of 5 pixels is used, then a Gaussian filter with parameter
Figure 1.
Preprocessing flow chart.
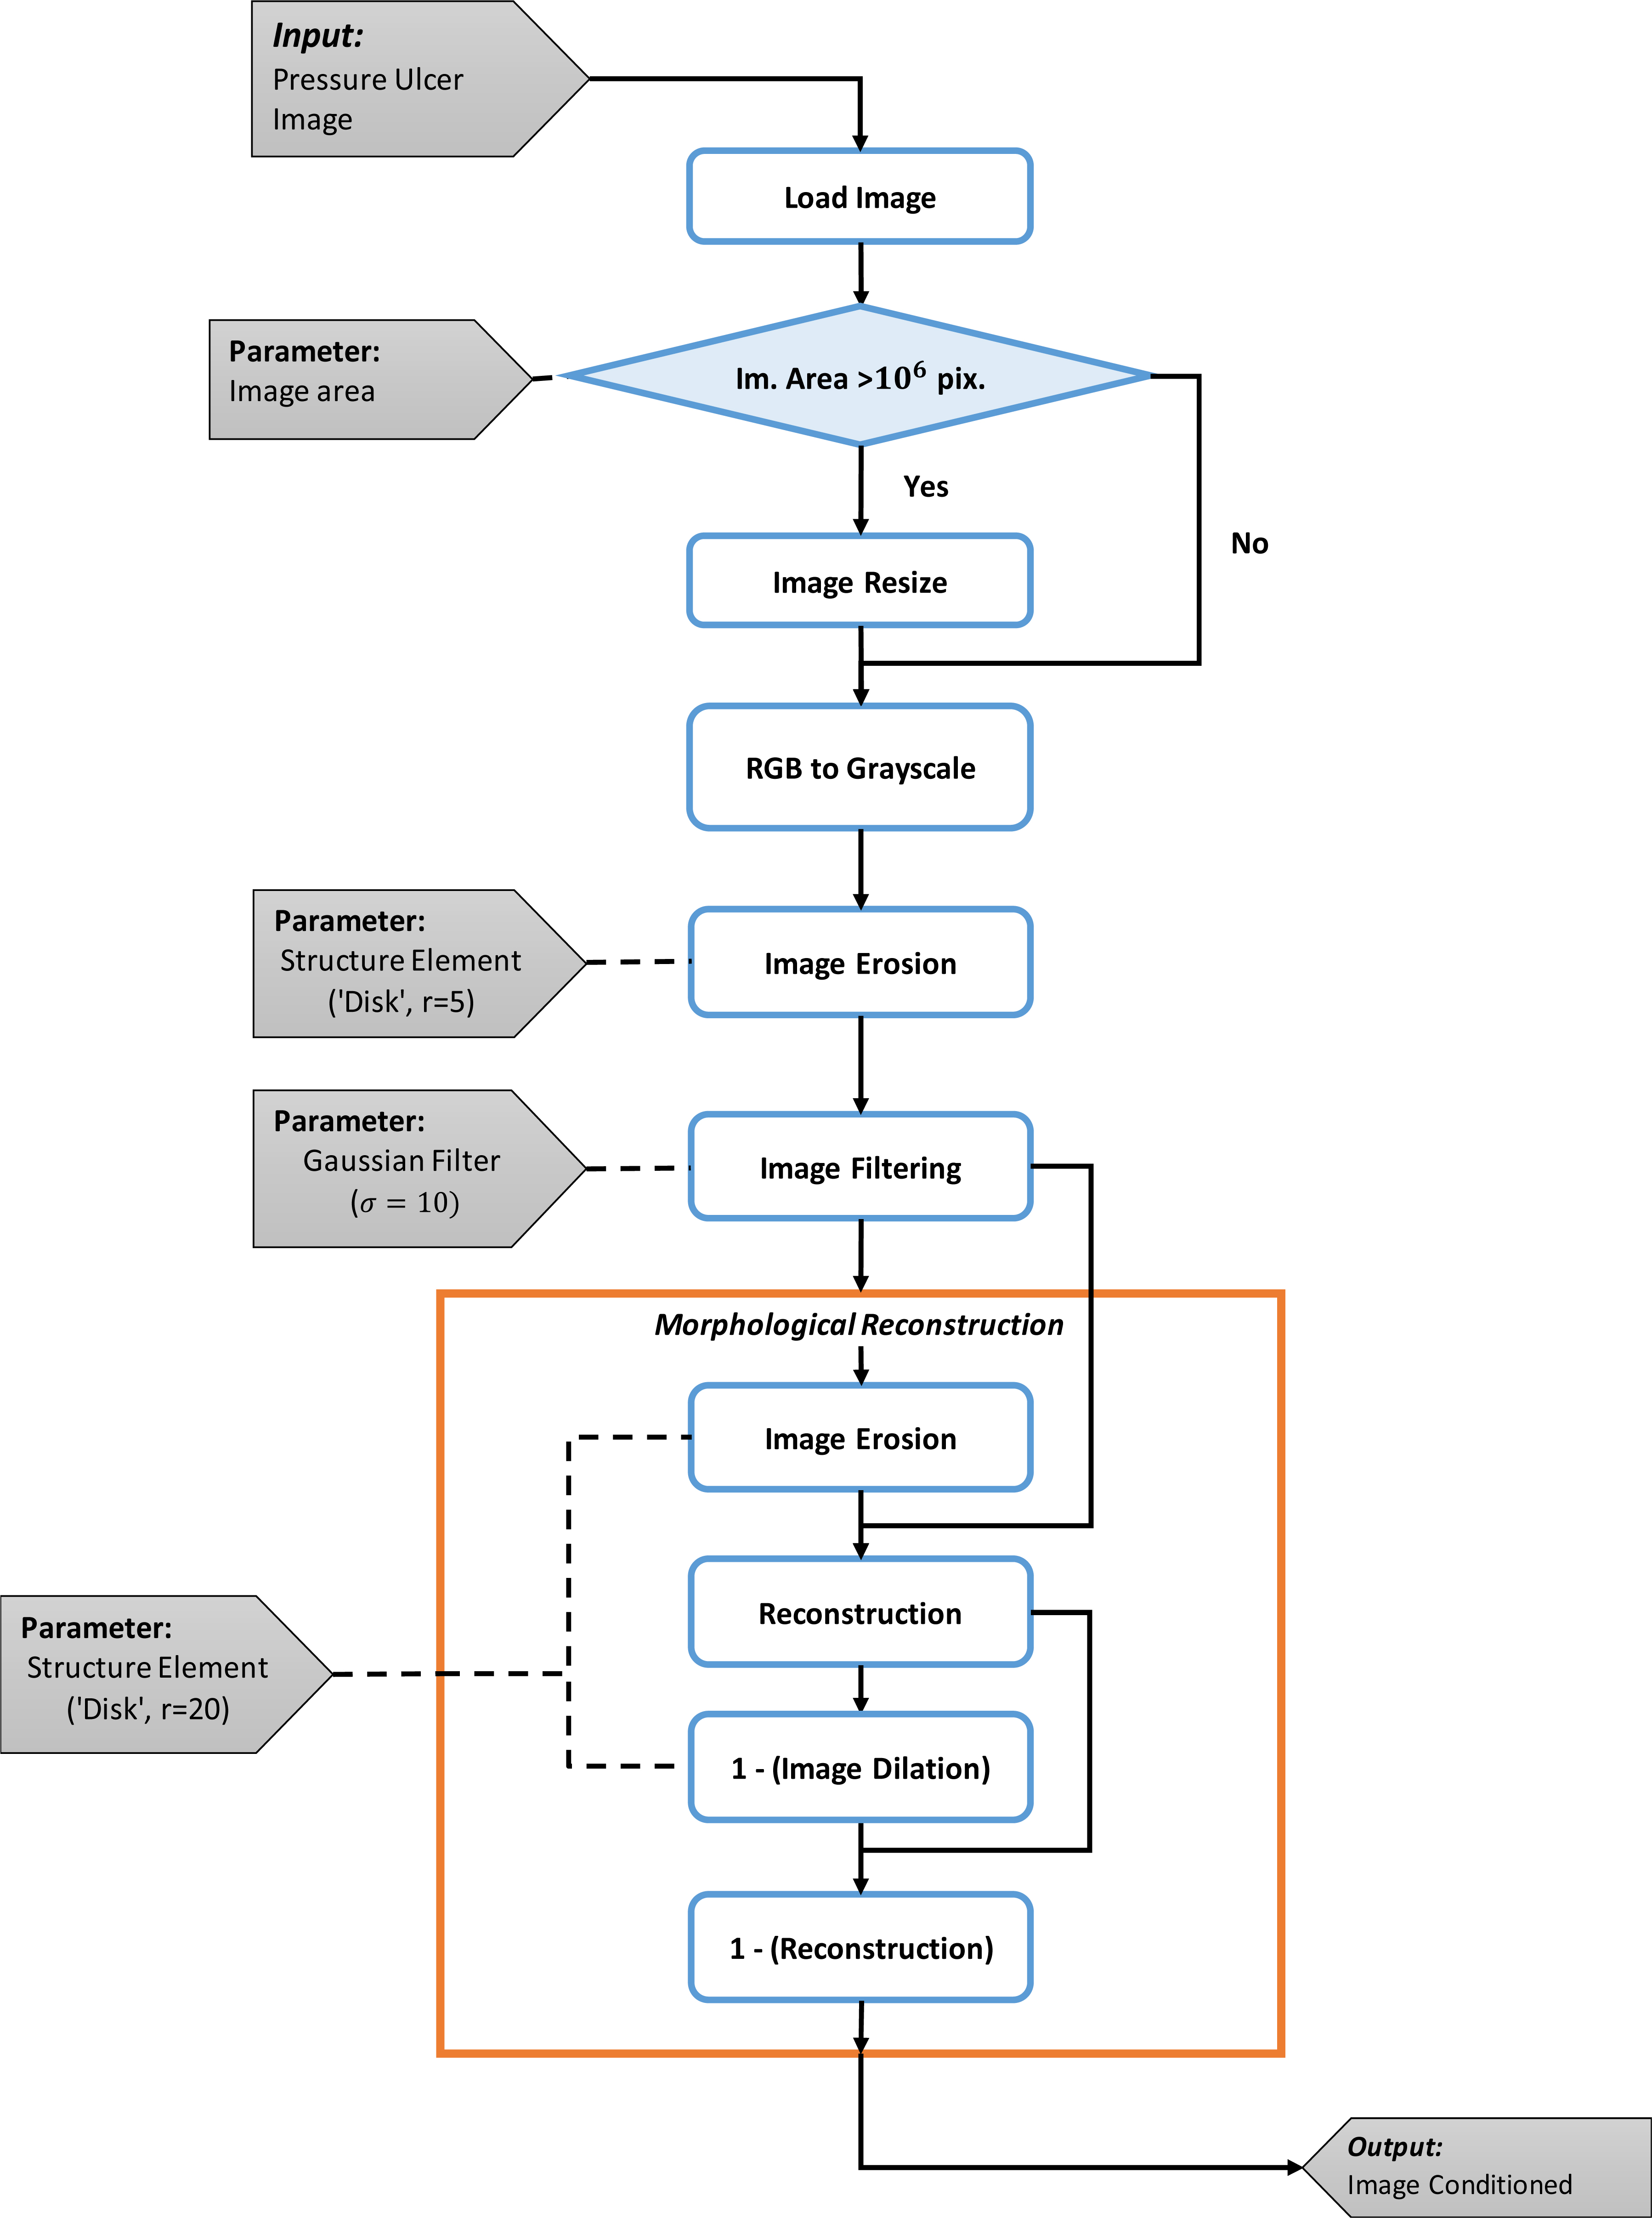
The last step constitutes the morphological reconstruction. The objective of this is to transform the filtered image for extracting meaningful information about shapes over the image. For this a disk structure element is used with a radius of 20 pixels. This morphological operation is made in different stages: first the filtered images is eroded and then reconstructed. Here the mask is the filtered image and the marker is the eroded. Then the reconstructed image is dilated, which becomes the new marker and the previously reconstructed image becomes the mask. This series of steps allows for determine the shapes in the image. With the last step, the image is conditioned for been processed.
2.2Image decomposition
Once the image is pre-processed is then decomposed into different contrast levels. The decomposition is made iteratively for each frequency parameter value and the result are the contours of the objects in the image as described in [7]. The first step is to generate the domains
Toroidal decomposition is a transformation defined as
(1)
In this equation
(2)
where TVD is the Toroidal Vertical Decomposition, THD is the Toroidal Horizontal Decomposition and
(3)
In the second step, the value of the parameter
Figure 2.
Image decomposition flow chart.
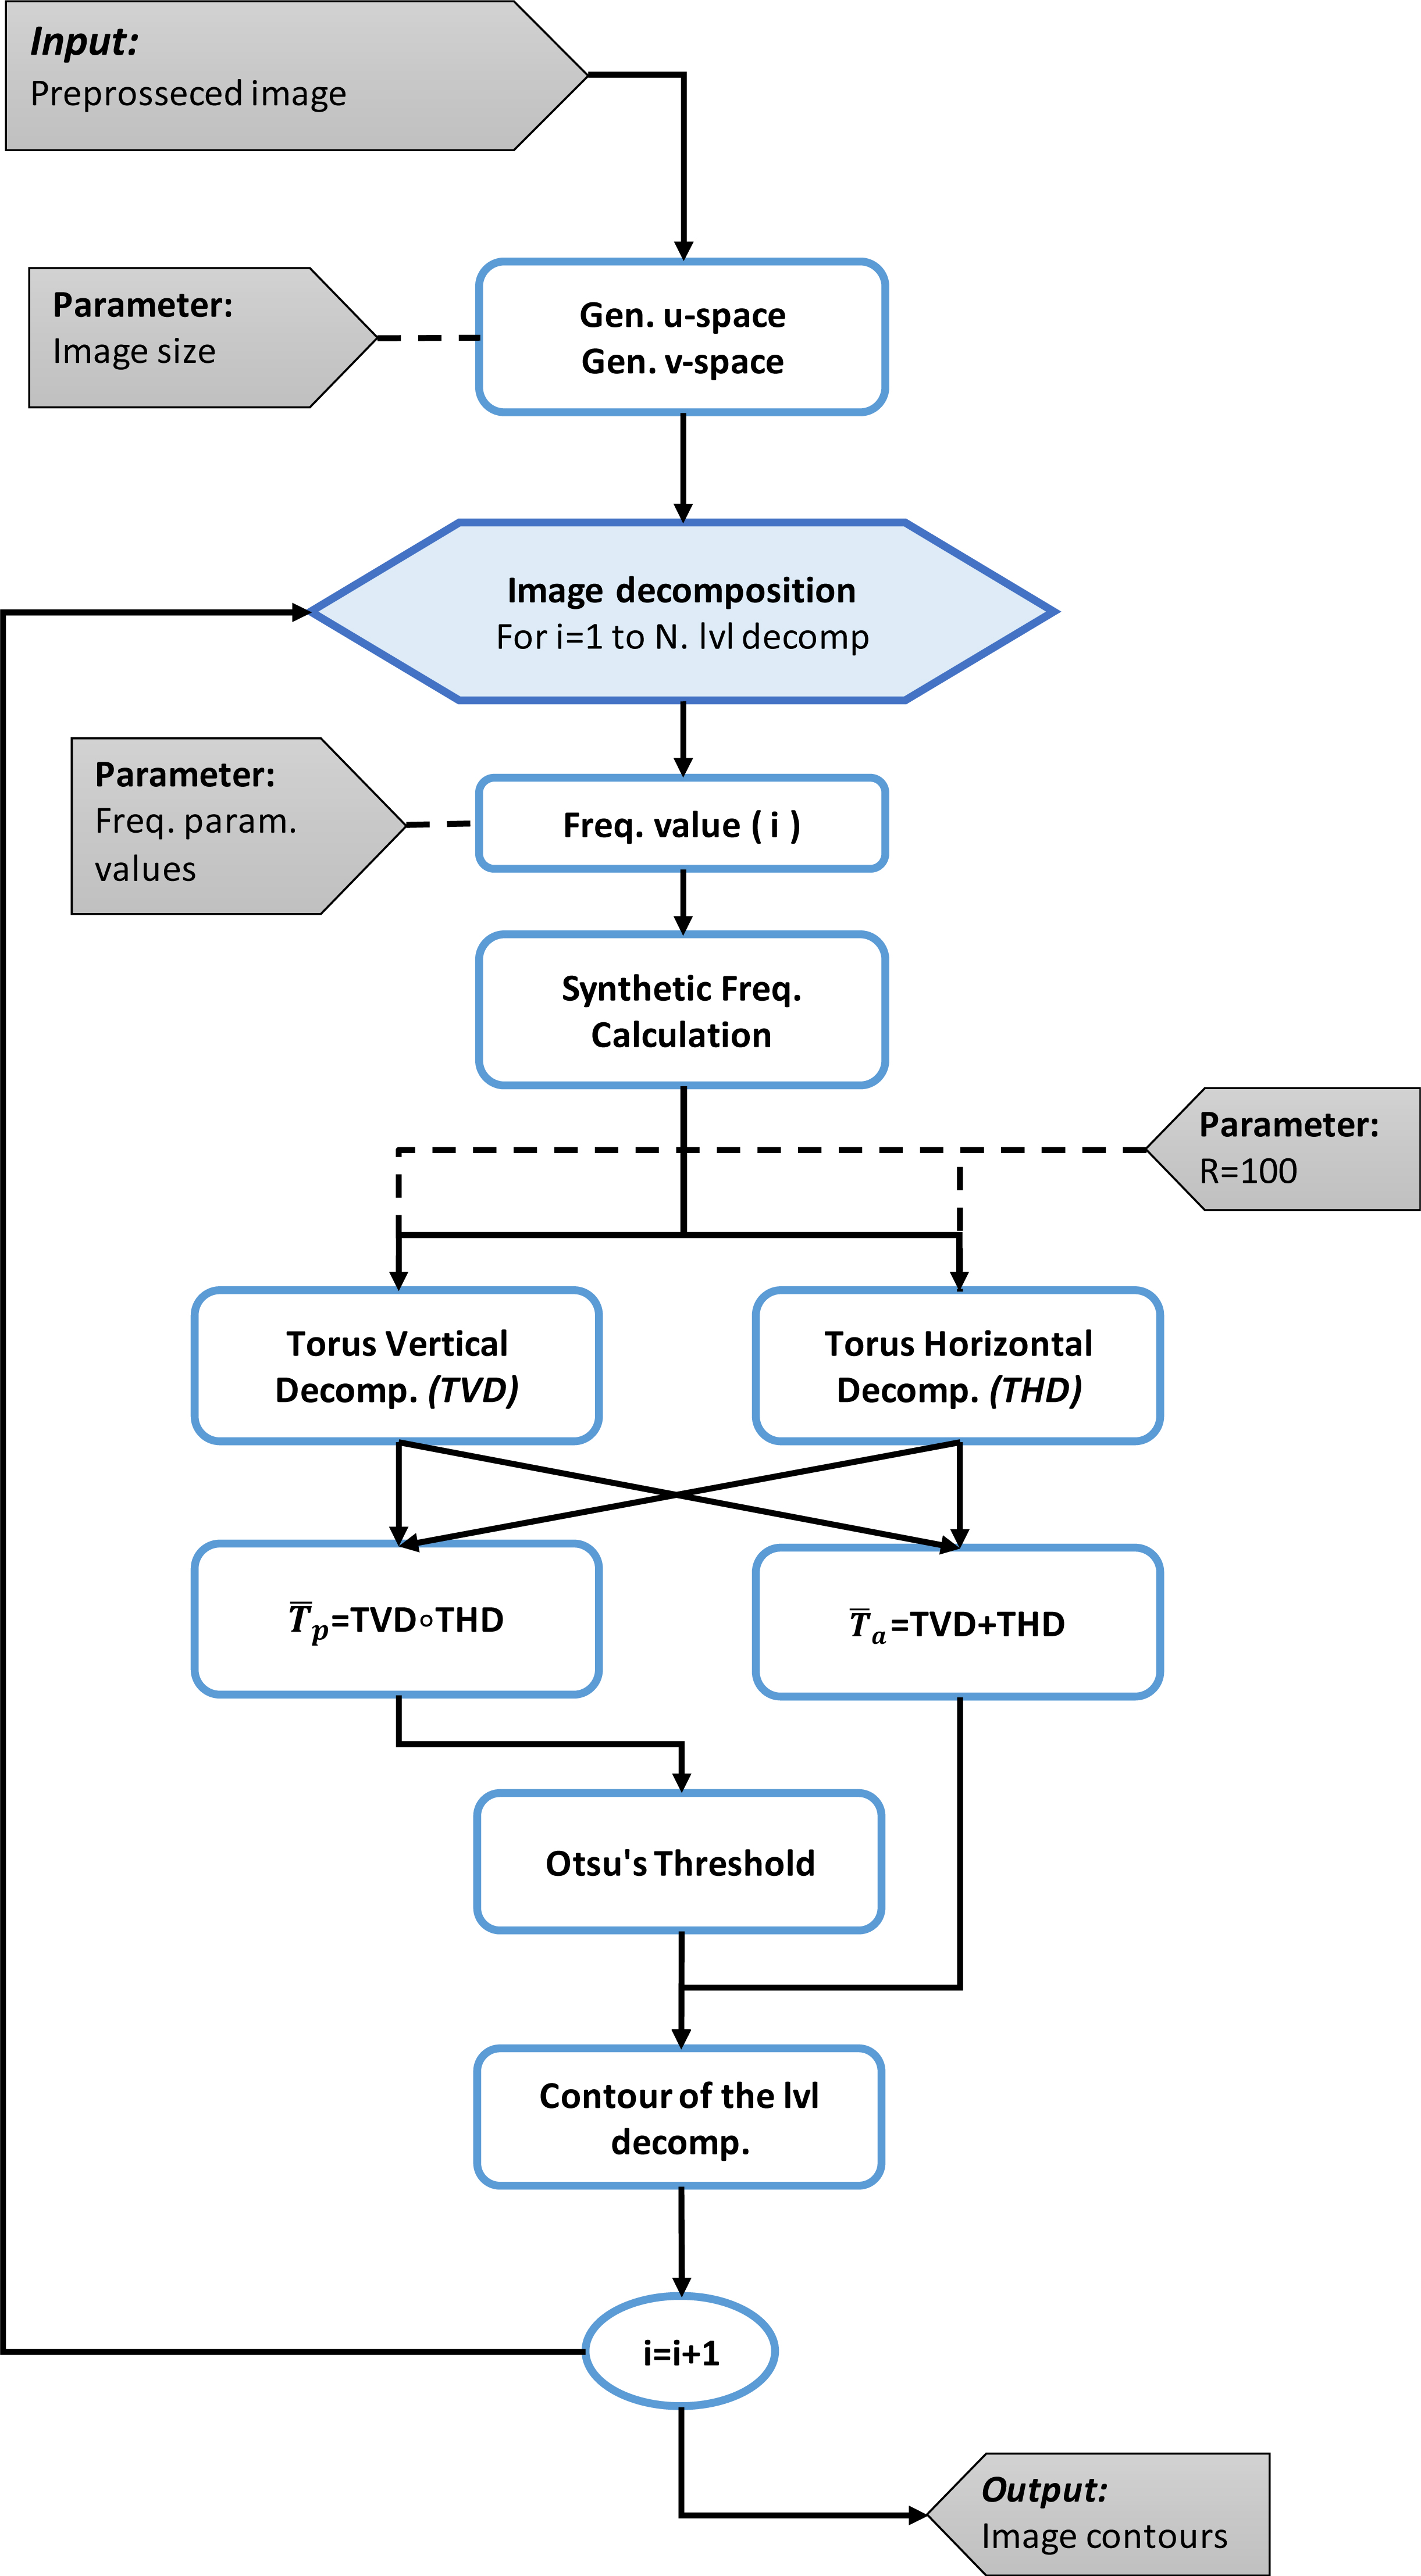
Image decomposition is obtained by using the obtained maps, this decomposition is defined vertically and horizontally given the domain
(4)
where
(5)
The third and fourth step consists to apply the Otsu’s method [11, 12] to the product operation, and then, use the calculated threshold to separate the pixels into two classes on the addition operation, by comparing the threshold with the values of each pixel. This classification allows to extract the contours.
Figure 3.
Average times vs image size.
The frequency parameter variation of each iteration induces changes in the toroidal operations amplitude, and different contours are generated on each iteration. This allows for defining the edges of the objects in the image. The output of this block is the union of the contours of each level of decomposition. The flow chart for the image decomposition can be seen on Fig. 2.
2.3Morphological operations
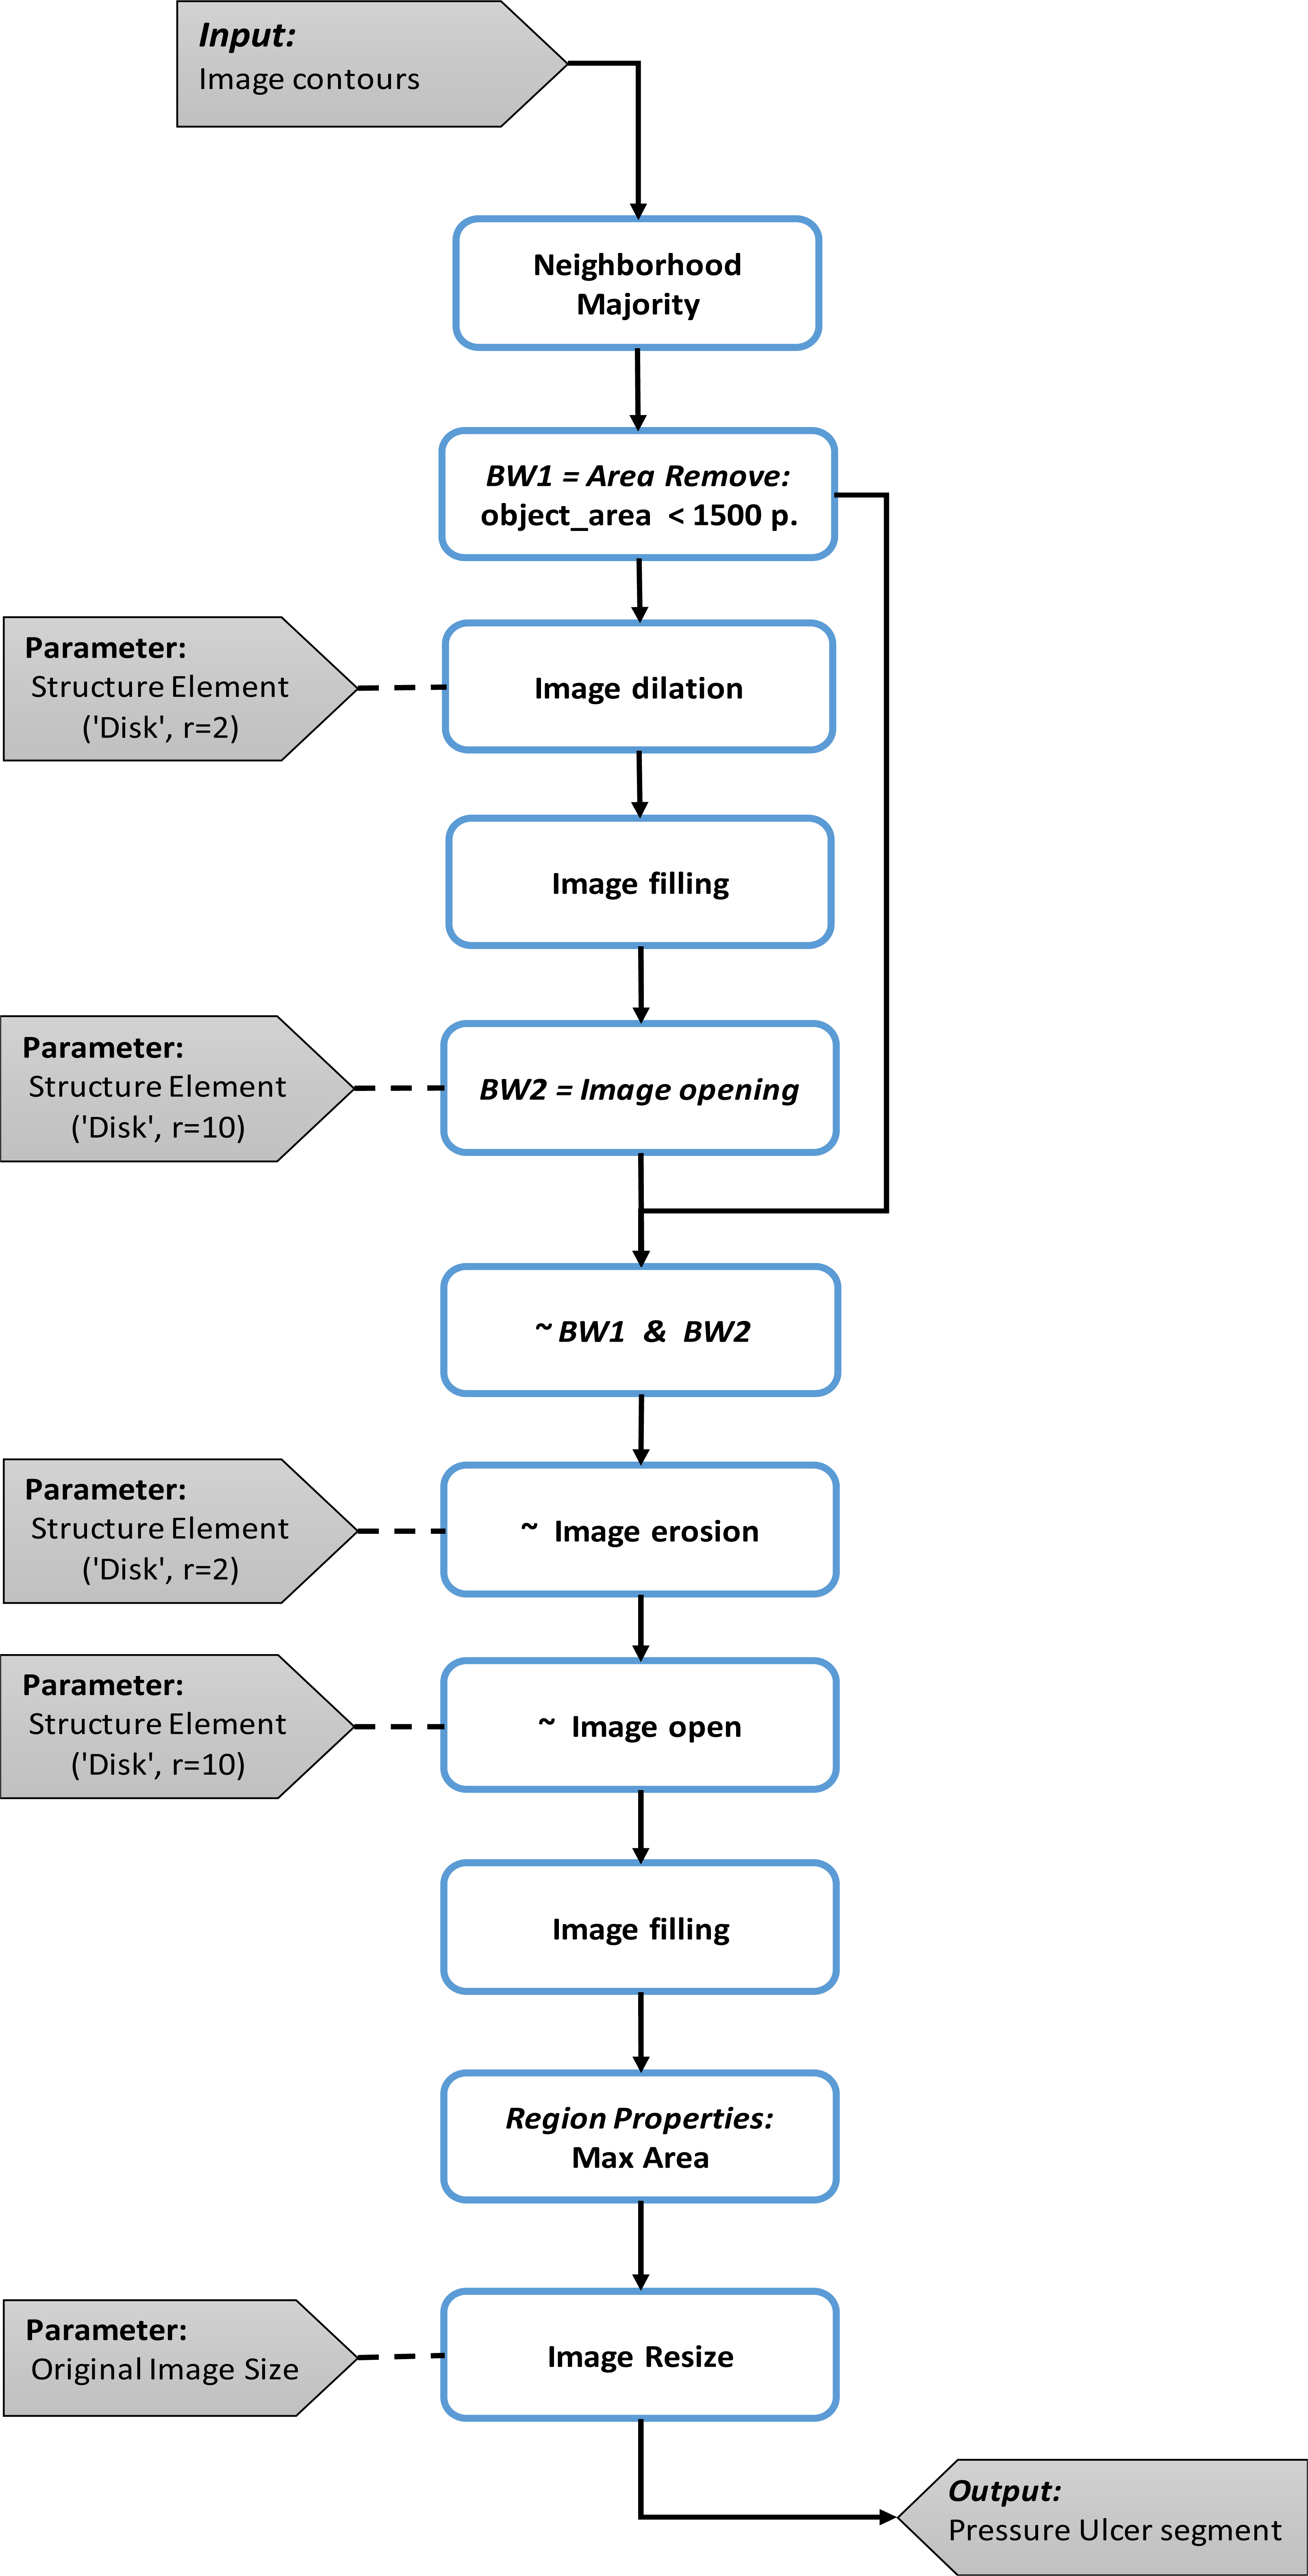
The contours obtained in the previous block are transformed in order to define the section of the pressure injury. The union of the contours can be seen as a binary image.
The first step consists of analyzing the neighborhood of each pixel in the binarized image, with the objective of extracting the thicker lines formed by the union of the different contours, considering that this union defines the edges of the objects in the image. Here a pixel is set to 1 if five or more pixels around its 3 by 3 neighborhood are 1 and 0 otherwise. Once the thicker edges are selected, objects that do not describe contours and having a smaller area to 1500 pixels are removed.
The second step consist in dilate and fill the area inside these contours. This step allows to define sets where the pressure injury is contained, and the morphological opening, allows to eliminate the remaining lines. Here, the dilation and opening are made using a disk structure element with radius of 2 and 10 pixels respectively.
Figure 4.
Morphological transformation.
In the third step, a logical conjunction operation between the binary complement of the first step called BW1 and the result of the second step BW2. This operation allows for separating the different objects that are subset of the binary image from step two.
It is possible that after the logic operation performed in the previous step, the segments representing the pressure injury have been separated. The fourth step has the objective to reduce the separation between segments that constitute the wound. For this, the complement of the image obtained in step three is eroded followed by an opening operation to remove internal divisions. The erosion and opening are made with a disk structure element with radius of 2 and 10 pixels respectively.
In the last step, the segment of the pressure injury is selected by comparing the areas between the objects produced in previous step. Here, the object with the higher area is selected as the segment of the pressure injury, and then it is resized using the original image size in order to describe correctly the pressure injury.
The final result of the system is a binary image that contains the segment that describes the morphology of the pressure injury.
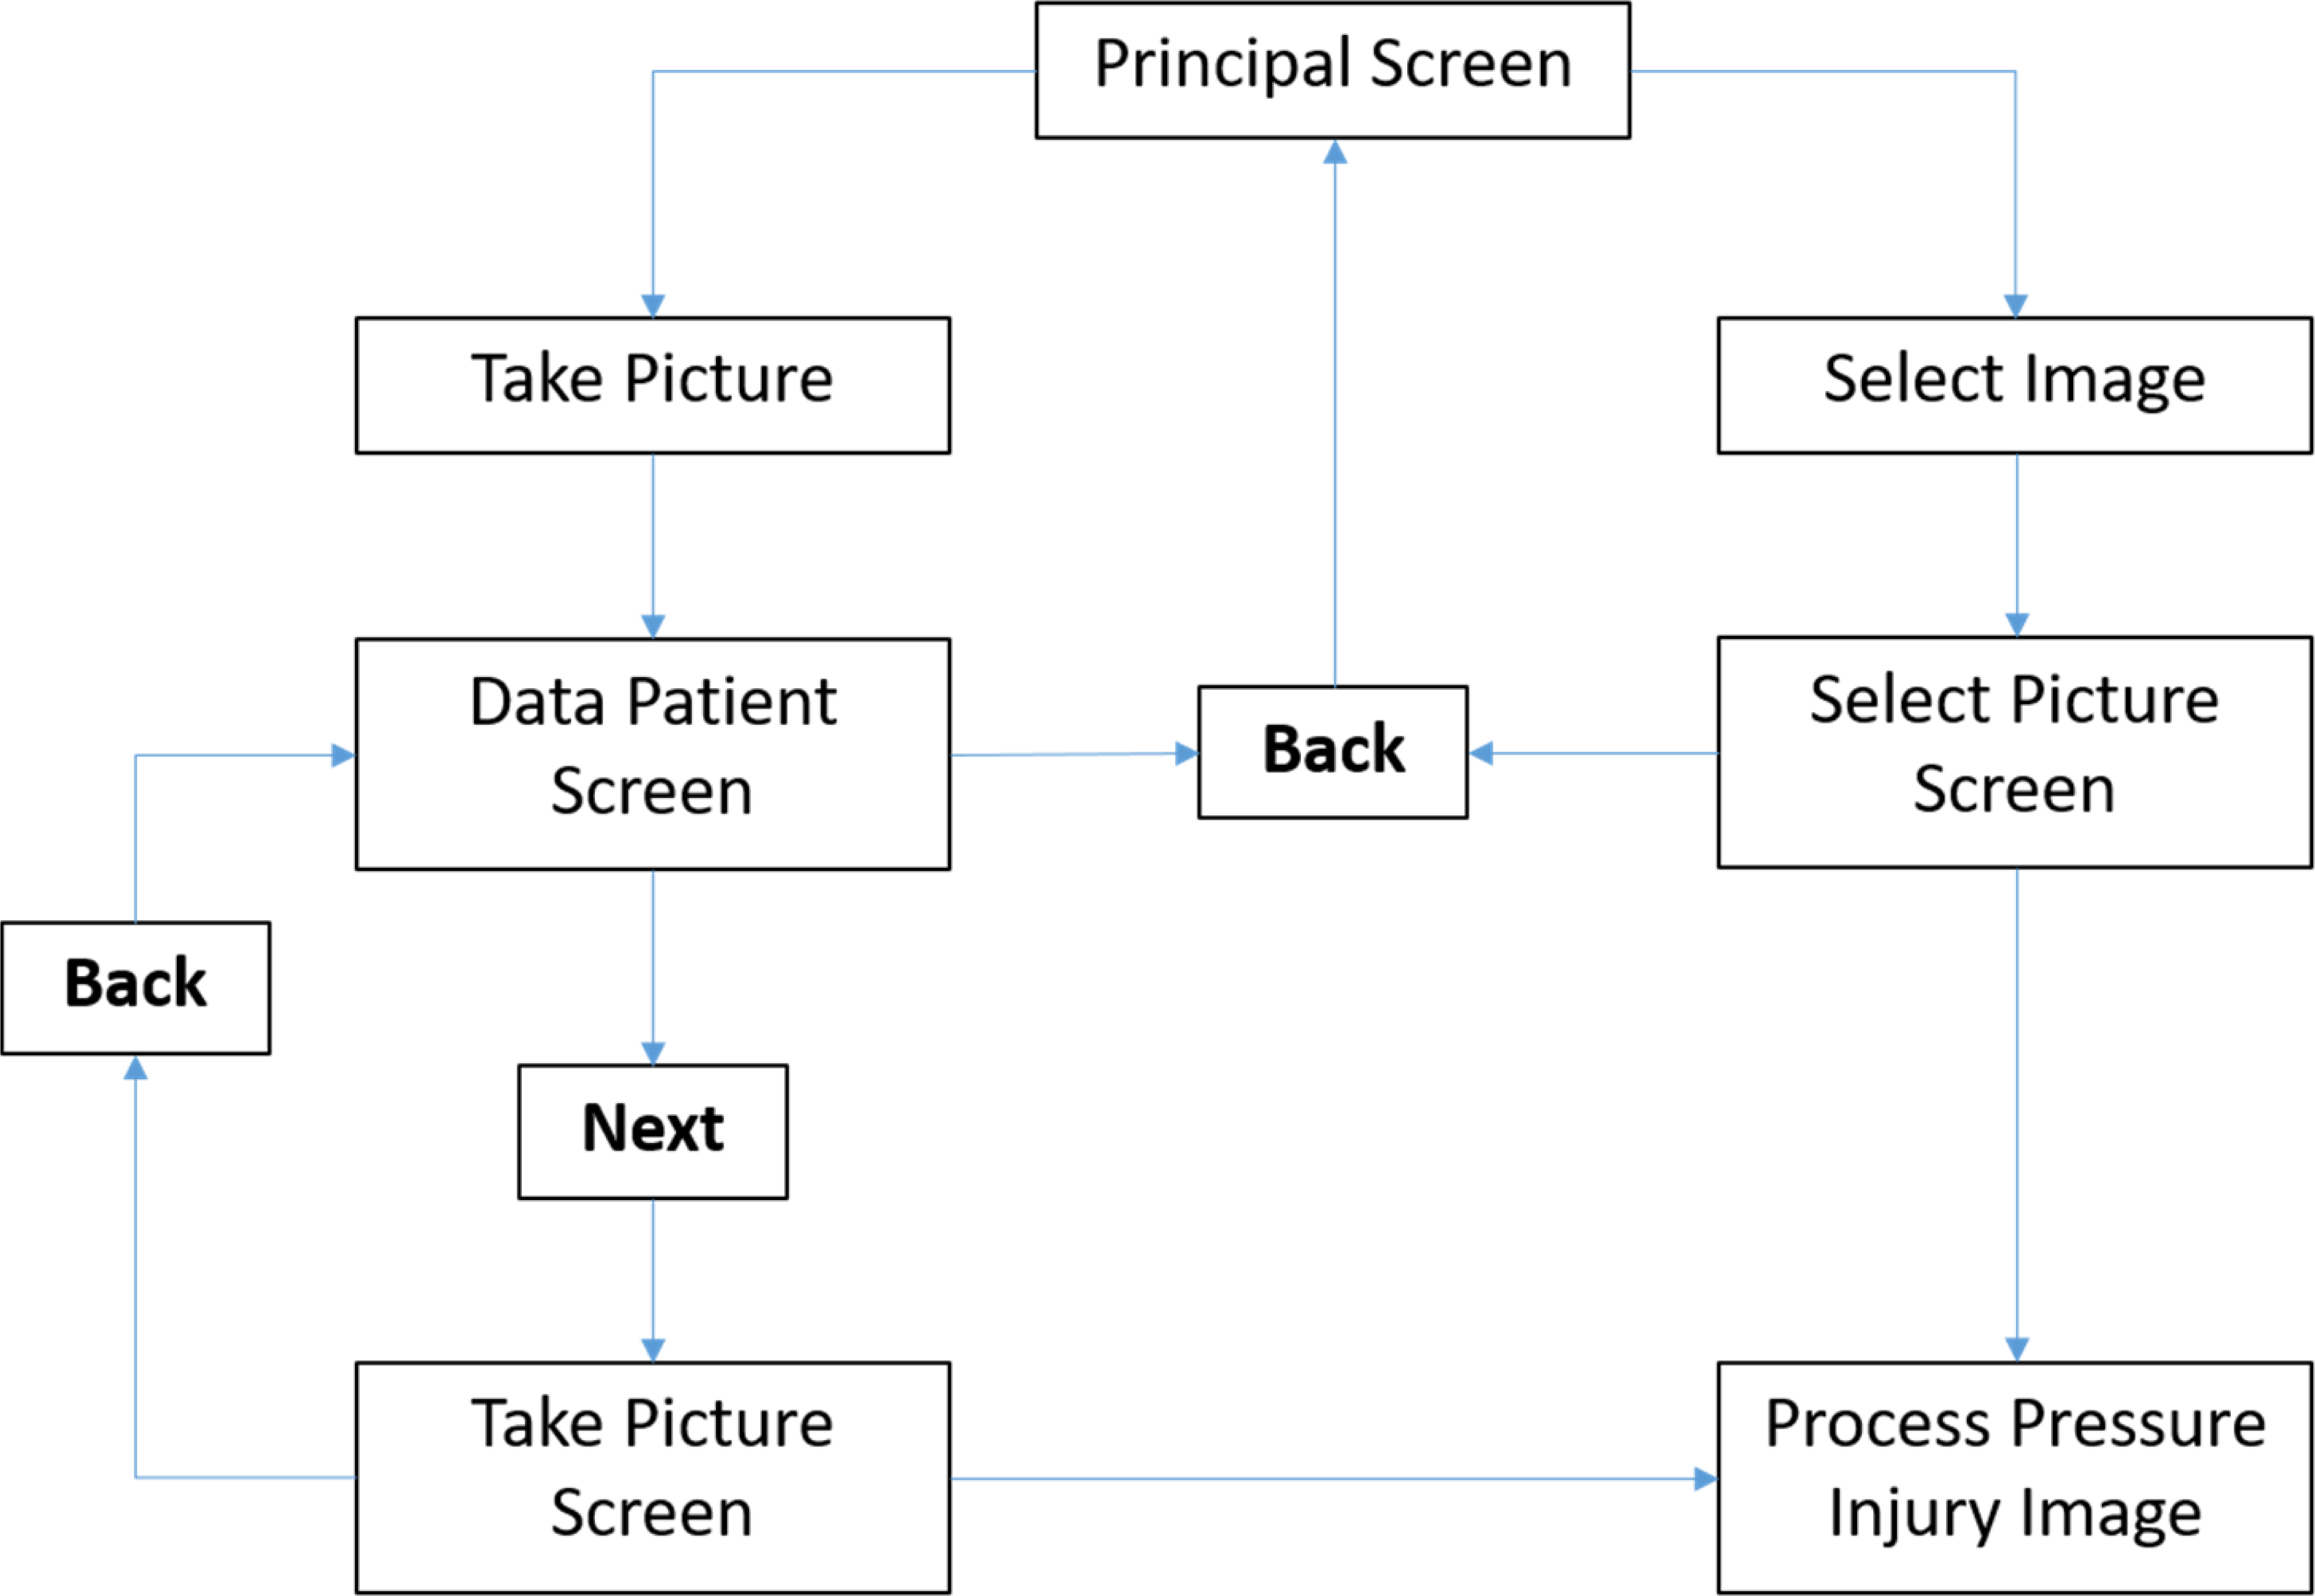
3.Mobile application development
The graphical interface will follow the logic schematized in Fig. 4, from a Principal Screen the user has the option to take a new picture or select a previous recorded image. If the option “Take Picture” is selected a new screen appear and the user should fulfill the patient information including Name, Last Name, Age, ID and Hospital. All images are saved with the patient personal information for future analysis. Once a new picture is taken or selected from a previous recording, is then processed and the segmented Pressure Injury is saved as a binary image.
Figure 5.
Graphical interface screens.
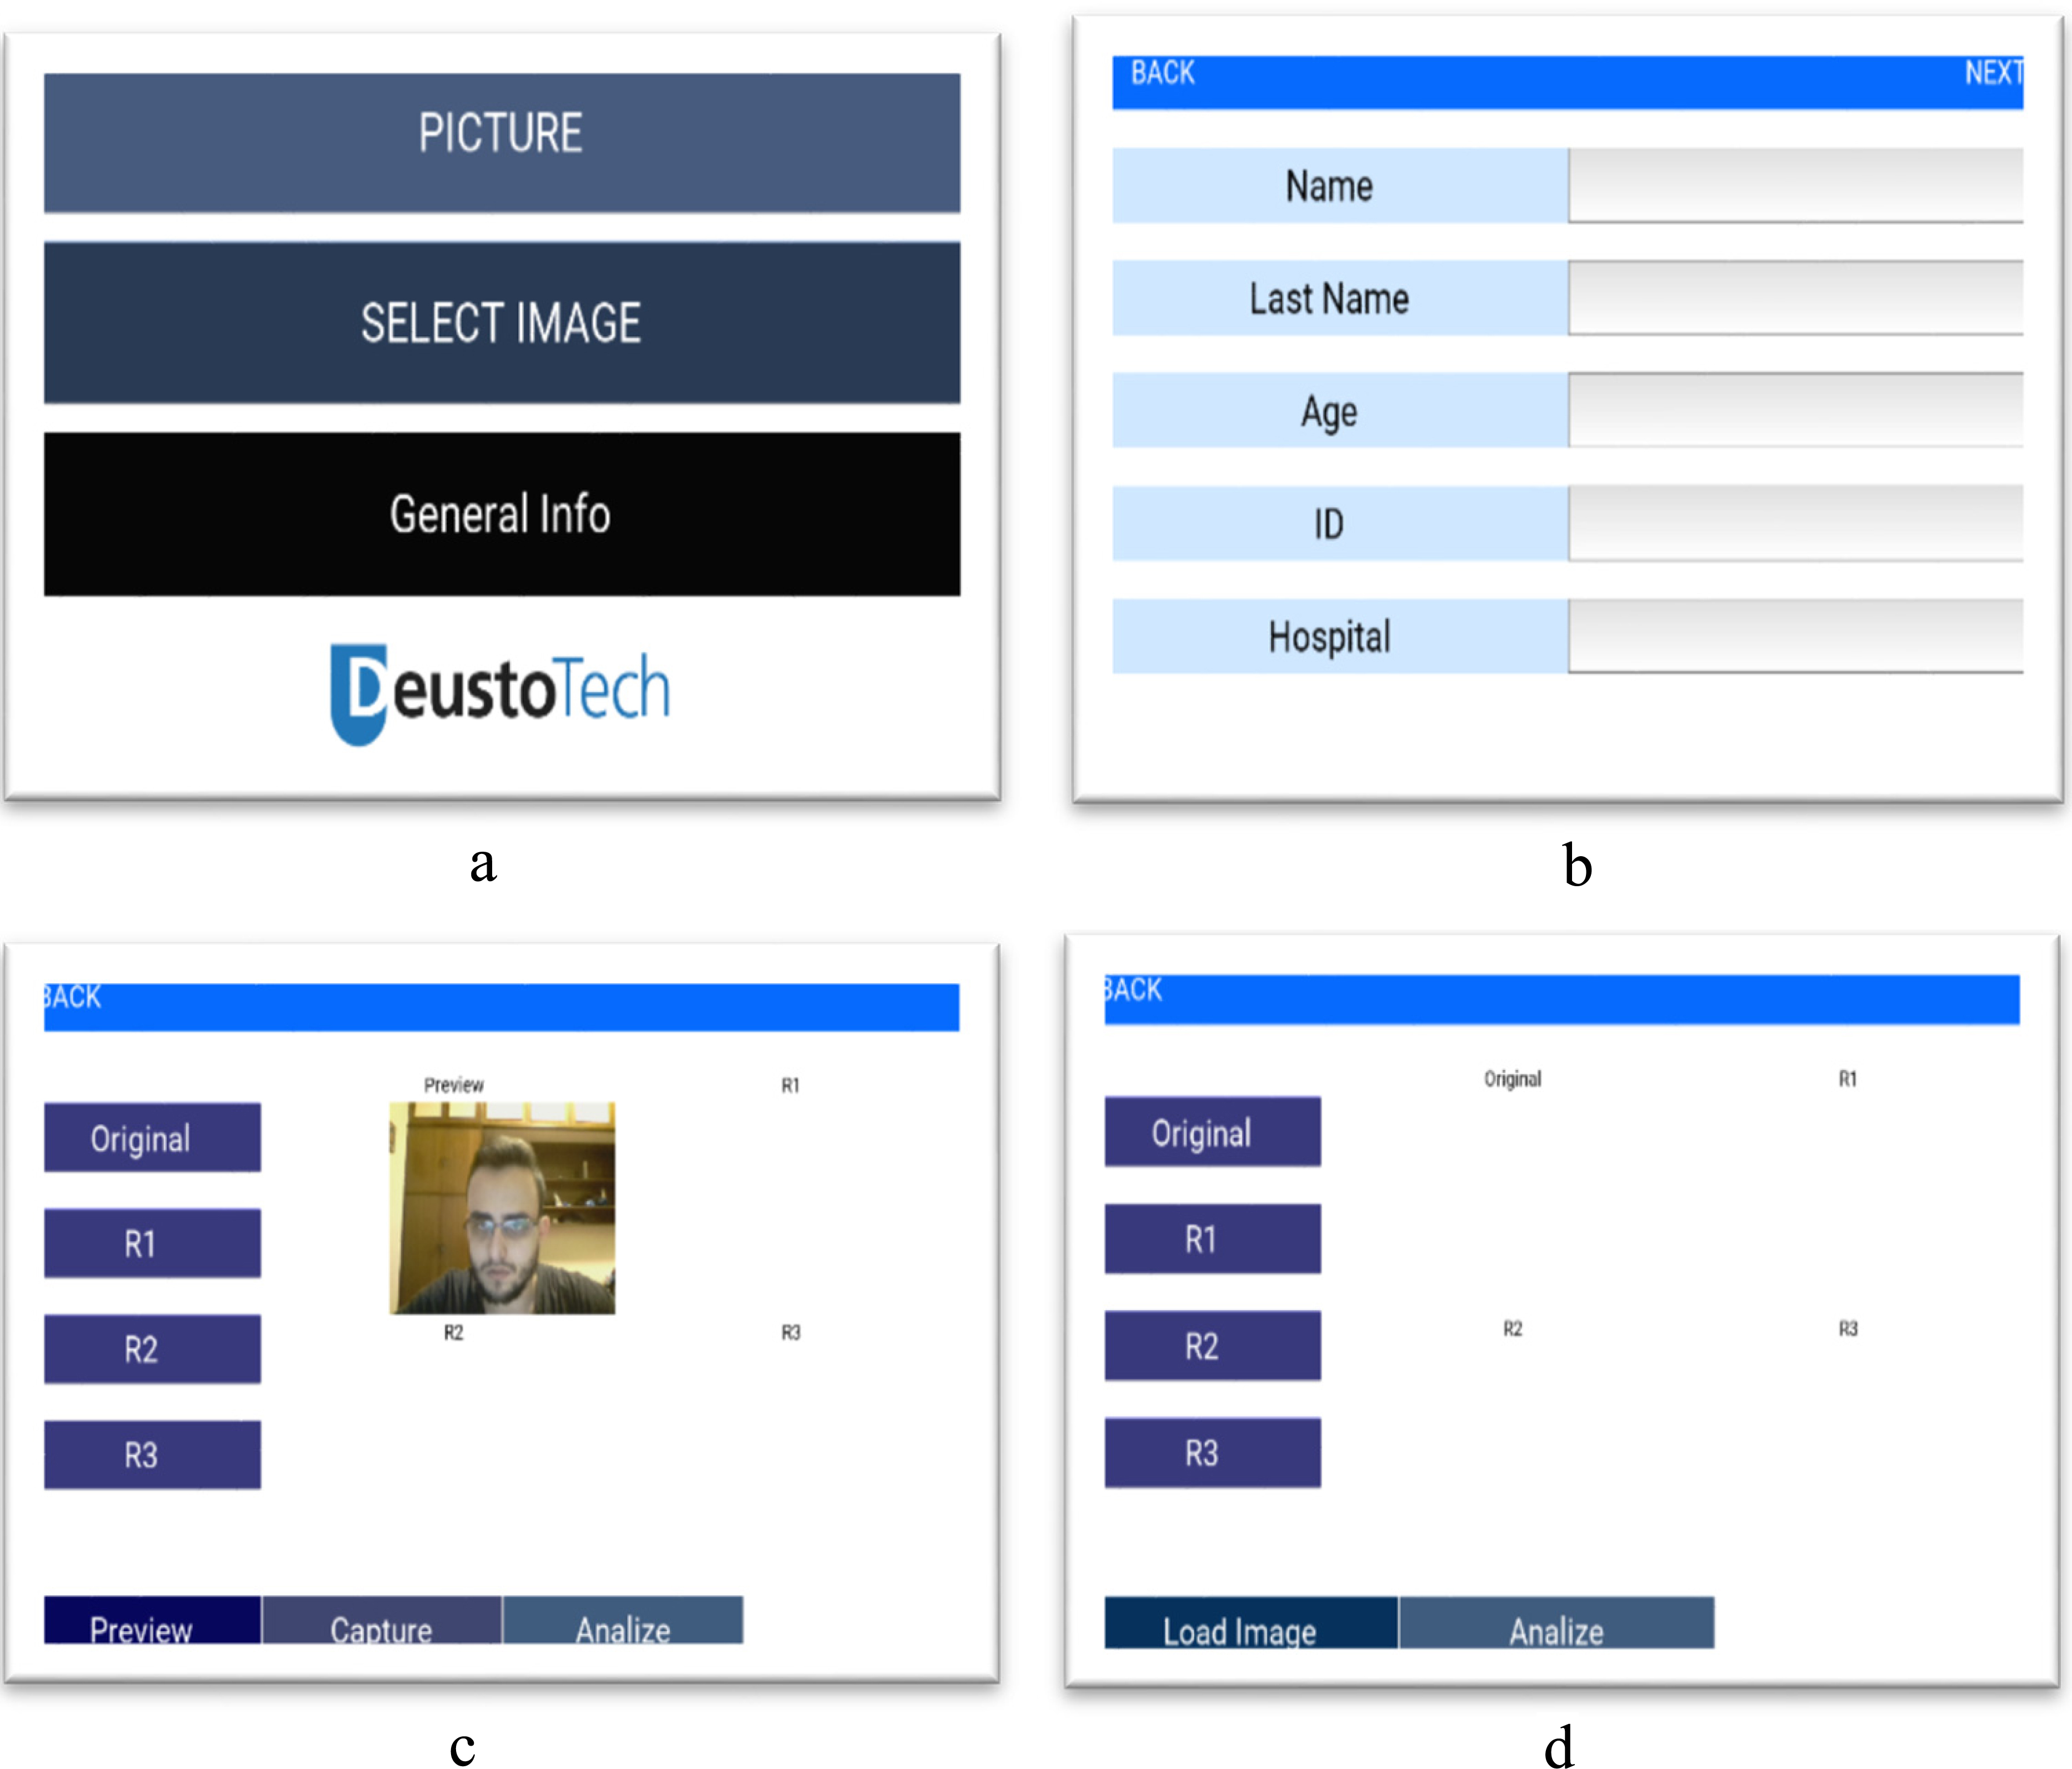
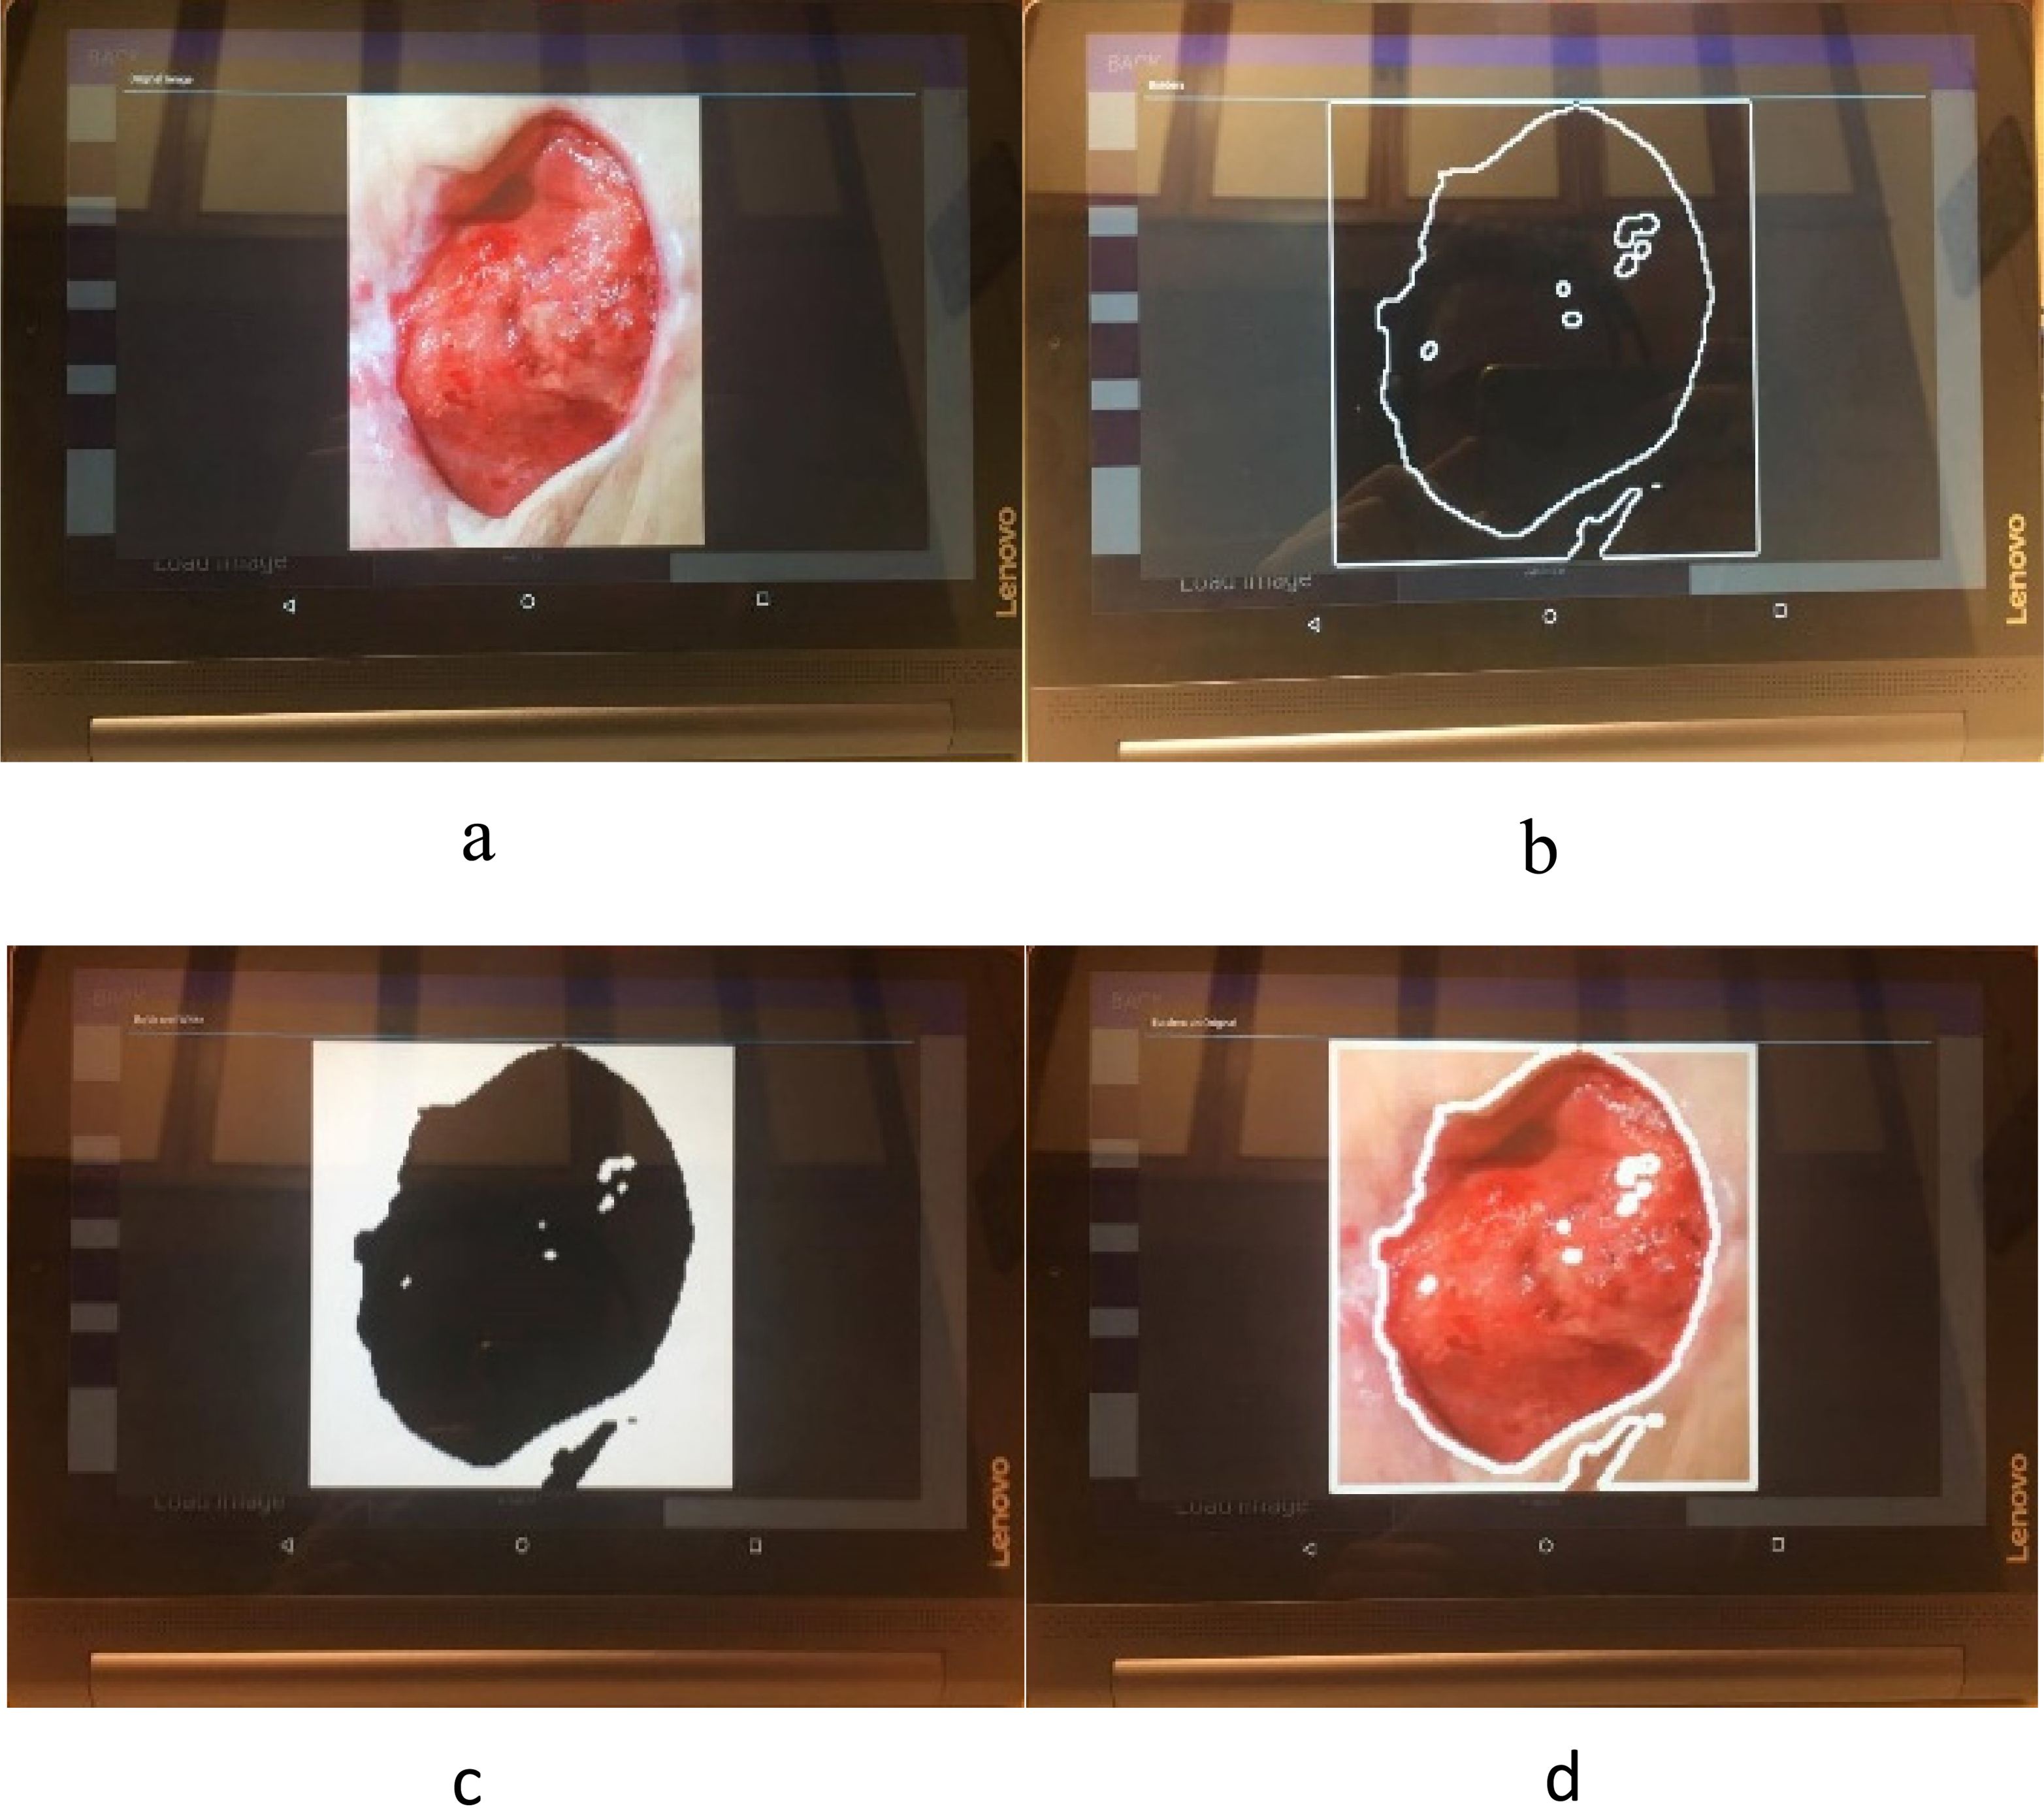
Figure 6.
Mobile application results.
“Take Picture” Screen, is composed, by a Preview Button that enables the camera and show a preview of the image to capture, Capture Button that take and display the picture, analyze button that starts the processing of the taken picture and display the results within the current screen, also this screen contains 4 more buttons:
• Original button: Shows a pop-up window with the recorded image enlarged.
• Result 1: Shows a pop-up window with the Binary Image of segmented Pressure Injury enlarged.
• Result 2: Shows a pop-up window with the Pressure Injury contour.
• Result 3: Shows a pop-up window with the overlap of the Pressure Injury contour and the original image.
“Select Picture” screen, is similar to “Take Picture” Screen, but instead of taking a new picture, it accesses the internal storage of the device in order to select an image, and display it. The different screen designs are portrayed in Fig. 5.
When the Pressure Injury image is processed, the system displays the original image, the segmented injury binary mask, the contour and the original image with marked contour. An example of the results is depicted in Fig. 6. The perimeter, area, height, width, major diagonal and minor diagonal are calculated and saved, these parameters are relevant for the Pressure Injuries assessment and are used by the medical personnel for the evaluation and diagnosis.
Table 1
Comparison of technique mean correlation and mean computation time values [7]
| Method | Mean | Standard deviation | Max | Min | Computation time (s) |
|---|---|---|---|---|---|
| Proposed technique | 0.89 | 0.102 | 0.977 | 0.532 | 9.04 |
| ACWE | 0.50 | 0.226 | 0.889 | 70.23 | |
| Dynamic contours | 0.75 | 0.154 | 0.967 | 0.427 | 78.65 |
Table 2
Processing times for tablet and PC of different image sizes
| Sizes (pixels) | Mean | Standard | Mean time | Standard | Mean time | Standard |
|---|---|---|---|---|---|---|
| correlation | deviation | tablet (s) | deviation | PC (s) | deviation | |
| 150 | 0.585 | 0.11 | 70.2 | 0.54 | 3.00 | 0.06 |
| 200 | 0.599 | 0.12 | 123.0 | 0.74 | 5.40 | 0.10 |
| 250 | 0.608 | 0.12 | 190.8 | 1.20 | 9.58 | 0.40 |
| 300 | 0.611 | 0.12 | 207.3 | 50.30 | 13.40 | 0.39 |
| 350 | 0.615 | 0.12 | 285.8 | 51.38 | 18.30 | 0.61 |
| 400 | 0.619 | 0.12 | 278.9 | 55.20 | 24.10 | 1.00 |
| 450 | 0.623 | 0.12 | 439.3 | 150 | 29.80 | 1.32 |
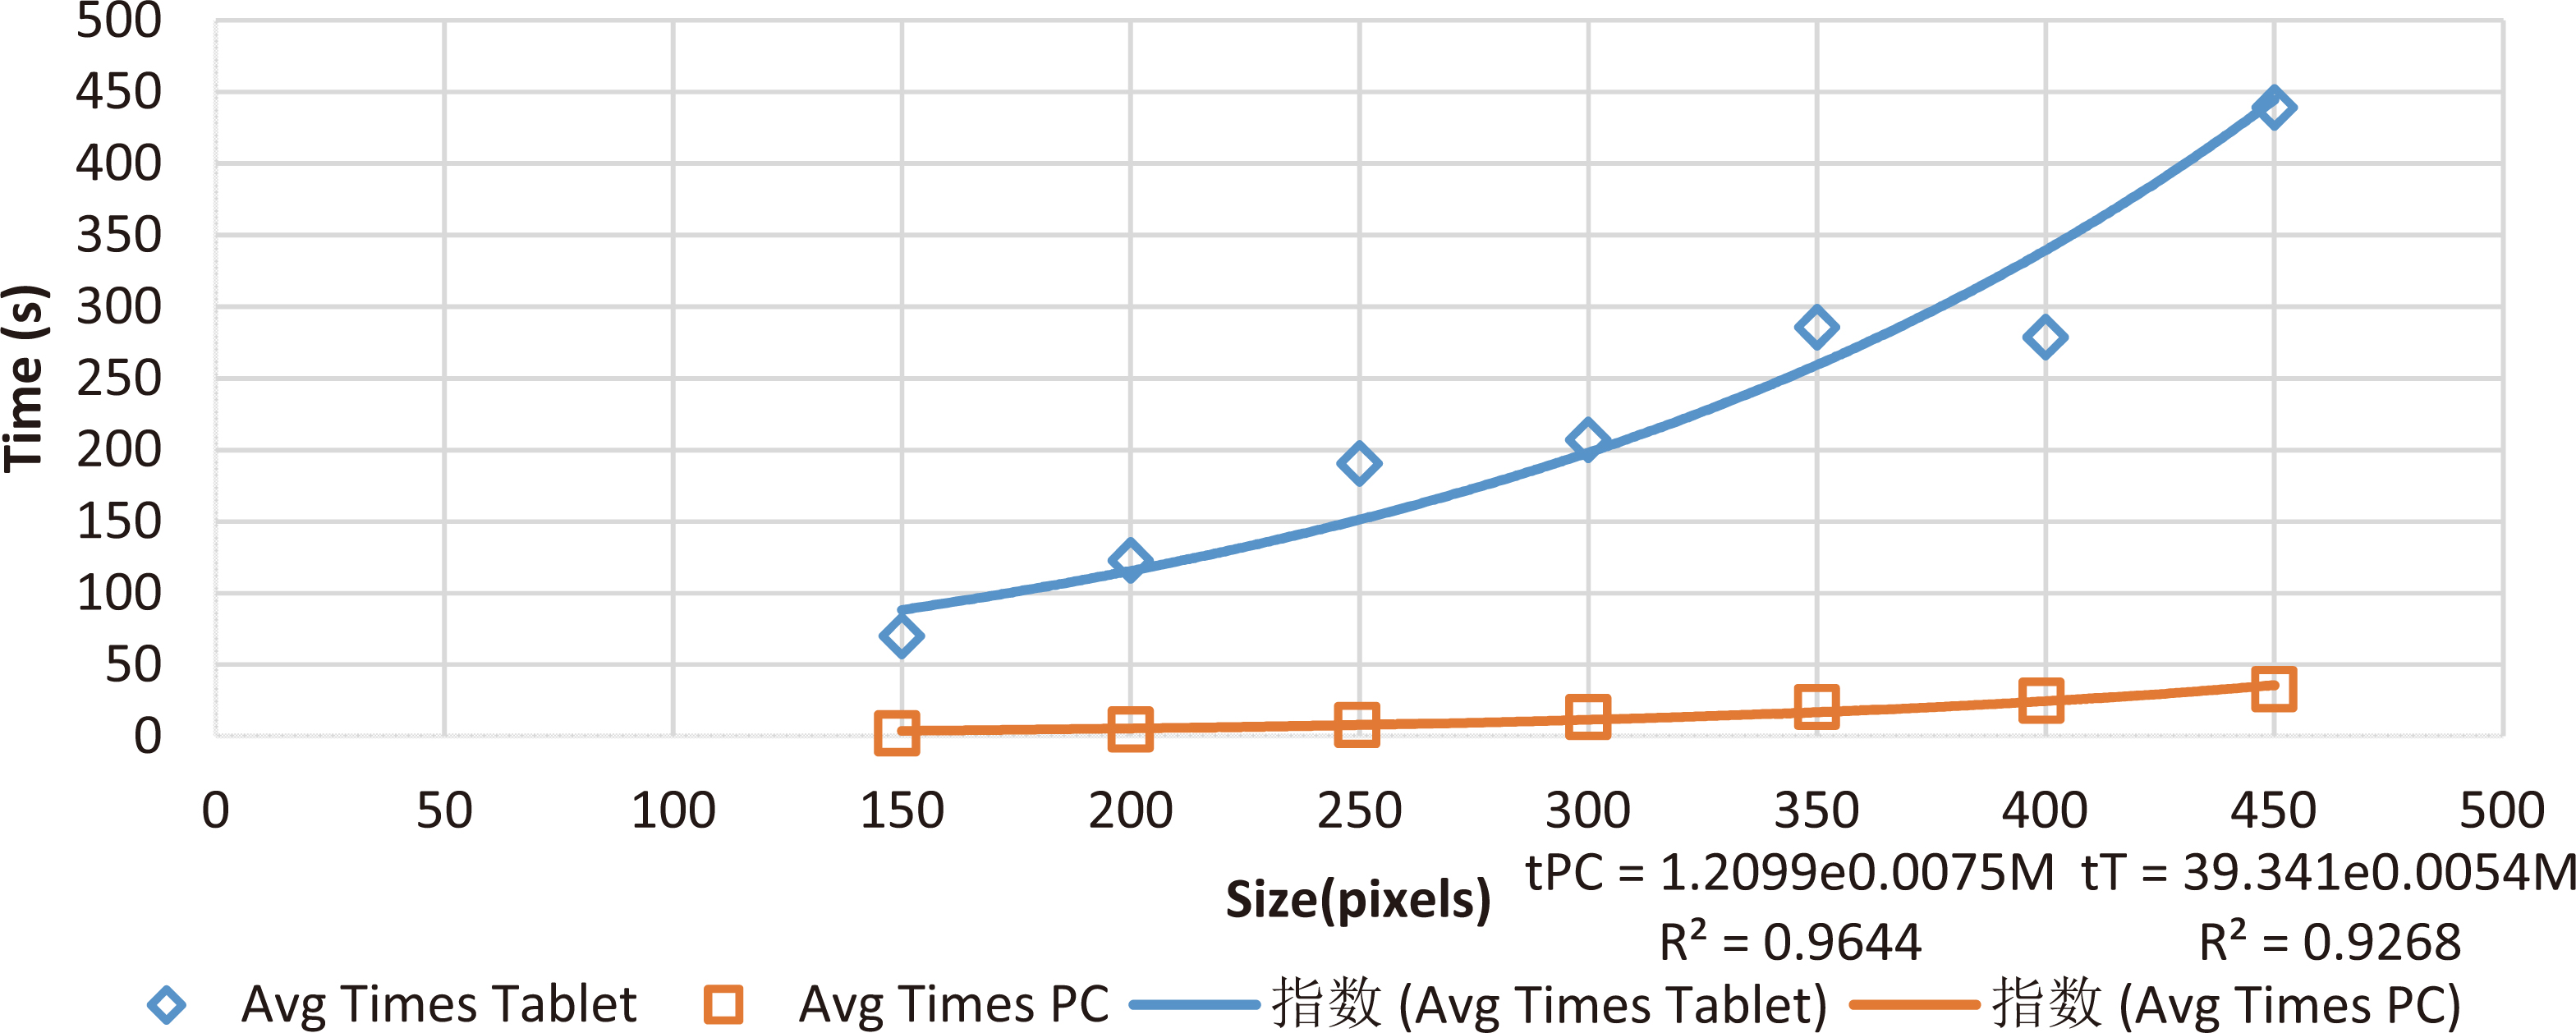
Figure 7.
Mean processing times of different image sizes.
4.Results
To test the application, a dataset with 40 images and the manual segmentation of Pressure Injuries provided by the physicians of IGURCO Hospital was employed. The proposed technique was compared in [7] with the common use algorithms reported. For this purpose, the segmentation technique was compared with Active Contours Without Edges (ACWE) and Dynamic contours. 1000
In general, the tablets possess less capabilities in terms of processing speed and ram memory when compared with a PC. A processing time comparison for different image sizes is presented in Table 2, for this comparison we used a Lenovo Yoga Tab 3 with a Qualcomm Snapdragon 652 processor and 3 Gb of RAM. The behavior from processing times in both devices are depicted in Fig. 6.
5.Conclusions
The main objective of the study has been reached, we have developed an operational and efficient mobile application that includes an optimized segmentation algorithm running in a reasonable time. Although the accuracy is improvable, nurses could now use it in real time to have the assessment of the patient. As the development has been made for Android devices and could be run in any, a detailed study about the relation of the quality of the image, the processing time and the accuracy offers the possibility of locally resize the resolution of the patient’s image of the pressure injurie in order to have a fast result that could help physicians to optimize in real time the treatment. In a specific case of a patient who may need a more accurate value, the mobile application is able to send the image to a server and then apply other techniques as machine and deep learning in order of obtaining a more accurate result.
The future lines of this research include both the optimization of the accuracy on the algorithm for automatic segmentation and the reduction on the processing time. This last issue will be easily solved with the advances of the technology used on the mobile devices and with the cloud partial processing of the data.
Acknowledgments
The grants that have contributed with a partial founding of the study are: IT- 905-16 to eVIDA research group from the Basque Government, JC2015-00305 José Castillejo Research Stay Grant from the Spanish Ministry and ACM2017_09 from the University of Deusto. This research was approved by the Ethical Committees Ref: ETK-17/16-17 and Ref: ETK-18/16-17 from the University of Deusto in Bilbao, Spain.
Conflict of interest
None to report.
References
[1] | Edsberg LE, Black JM, Goldberg M, McNichol L, Moore L, Sieggreen M. Revised national pressure ulcer advisory panel pressure injury staging system: Revised pressure injury staging system. Journal of Wound, Ostomy, and Continence Nursing (2016) ; 43: (6): 585. |
[2] | Soldevilla AJ, Torra IBJ, Posnett J, Verdu SJ, San Miguel L, Mayan SM. The burden of pressure ulcers in Spain. Wounds Compend Clin Res Pract (2007) ; 19: (7): 201-206. |
[3] | Franks P. Pressure ulcers: Cost to a nation, cost to an individual. Wound Manag (2007) ; 18-19. |
[4] | Larizgoitia Burgaña J. Solución tecnológica para la parametrización objetiva de úlceras por presión basada en técnicas de procesado de imágenes. Bilbao: Universidad de Deusto (2015) . |
[5] | Leachtenauer J, Kell S, Turner B, Newcomer C, Lyder C, Alwan M. A non-contact imaging-based approach to detecting stage i pressure ulcers. In: Engineering in Medicine and Biology Society, 2006. EMBS’06, 28th annual international conference of the IEEE (2006) ; 1: : 6380-6383. |
[6] | Leachtenauer J, Kell S, Turner B, Newcomer C, Lyder C, Alwan M. A non-contact imageing-based approach to detecting satge i pressure ulcers. New York: EMBs Annual International Conference (2006) . |
[7] | Ortiz DP, Sierra-Sosa D, Zapirain BG. Pressure ulcer image segmentation technique through synthetic frequencies generation and contrast variation using toroidal geometry. Biomedical Engineering Online (2017) ; 16: (1): 4. |
[8] | Lopez-Basterretxea A, Mendez-Zorrilla A, Garcia-Zapirain B. Eye/head tracking technology to improve HCI with iPad applications. Sensors (2015) ; 15: (2): 2244-2264. |
[9] | Arroyo JLG, Zapirain BG, Zorrilla AM. Blue-white veil and dark-red patch of pigment pattern recognition in dermoscopic images using machine-learning techniques. In Signal Processing and Information Technology (ISSPIT), IEEE International Symposium on (2011) ; 196-201. |
[10] | Wrońska N, Garcia-Zapirain B, Mendez-Zorrilla A. An iPad-based tool for improving the skills of children with attention deficit disorder. Journal of Environmental Research and Public Health (2015) ; 12: (6): 6261-6280. |
[11] | Raja N, Rajinikanth V, Latha K. Otsu based optimal multilevel image thresholding using firefly algorithm. Modell Simul Eng (2014) ; 2014: : 37. |
[12] | Konkachbaev AI, Elmaghraby AS, Casanova M. Recursive segmentation of minicolums using myelinated bundles. In Neural Engineering, Conference Proceedings, 2nd International IEEE EMBS Conference on (2005) ; 1: : 52-55. |

