
In vivo noninvasive blood glucose detection using near-infrared spectrum based on the PSO-2ANN model
Abstract
BACKGROUND:
To improving the nursing level of diabetics, it is necessary to develop noninvasive blood glucose method.
OBJECTIVE:
In order to reduce the number of the near-infrared signal, consider the nonlinear relationship between the blood glucose concentration and near-infrared signal, and correct the individual difference and physiological glucose dynamic, 2 artificial neural networks (2ANN) combined with particle swarm optimization (PSO), named as PSO-2ANN, is proposed.
METHOD:
Two artificial neural networks (ANNs) are employed as the basic structure of the PSO-ANN model, and the weight coefficients of the two ANNs which represent the difference of individual and daily physiological rule are optimized by particle swarm optimization (PSO).
RESULTS:
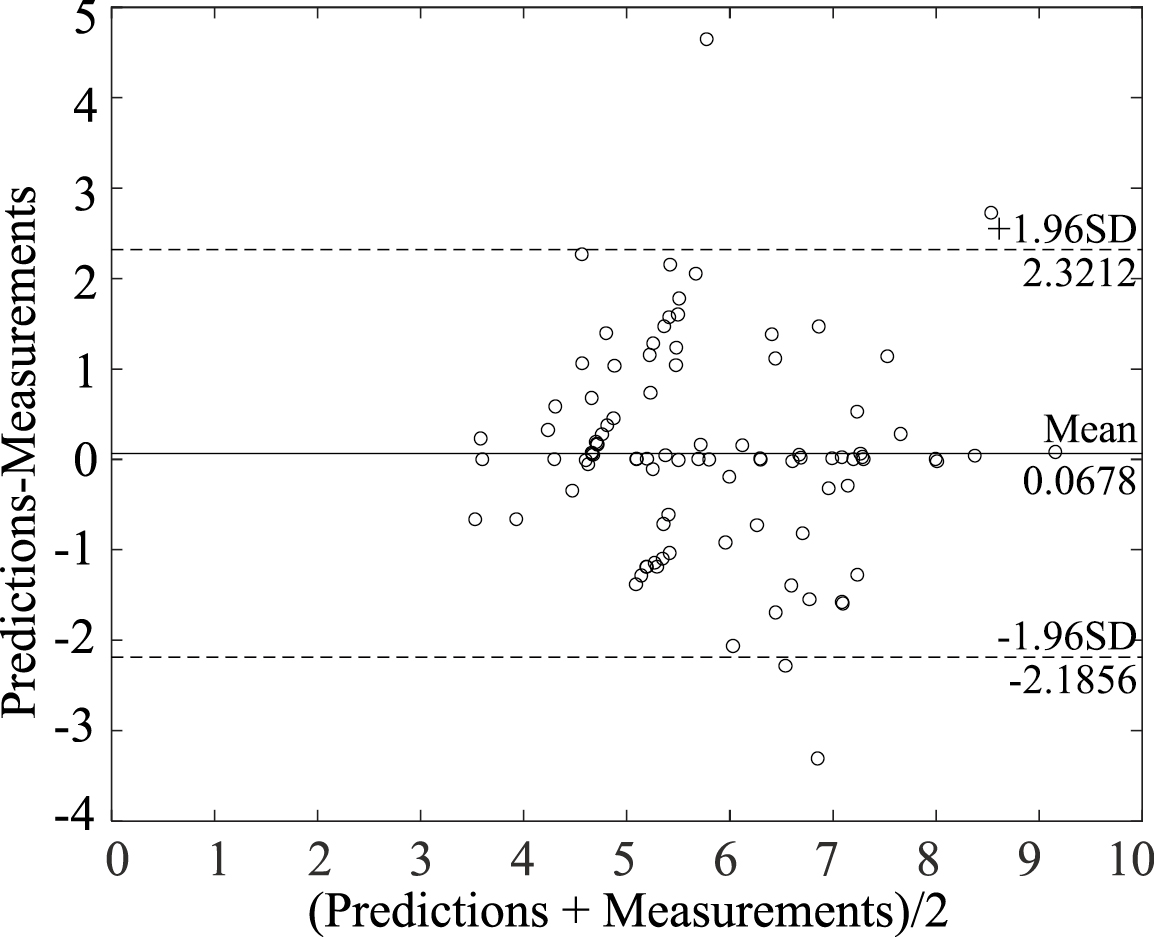
Clarke error grid shows the blood glucose predictions are distributed in regions A and B, Bland-Altman analysis show that the predictions and measurements are in good agreement.
CONCLUSIONS:
The PSO-2ANN model is a nonlinear calibration strategy with accuracy and robustness using 1550-nm spectroscopy, which can correct the individual difference and physiological glucose dynamics.
1.Introduction
According to the investigation by The International Diabetes Federation, by the end of 2015, the number of diabetes cases worldwide was as high as 4.15 hundred million, and the prevalence rate was 9.09%. Glucose metabolism disorder is a major clinical manifestation of diabetes [1]. Epidemiologic evidence has revealed a powerful connection among the blood glucose concentration, cardiovascular disease, arteriosclerosis and mortality [2, 3]. Additionally, severe glucose metabolism disorder may result in acute complications, such as ketoacidosis and a diabetic hyperglycemic hyperosmolar state (HHS).
An approach to completely cure diabetes has not been discovered. The method to maintain normal blood glucose level in clinic is the frequent detection combined with drug therapy. The finger prick test is most popular blood glucose detection technique [4], which improves the level of control but has some disadvantages such as infection, invasiveness, high costs etc. It is necessary to develop noninvasive blood glucose method. Near-infrared (NIR) spectroscopy detection technology is one of the promising noninvasive blood glucose detection method because of low costs, high precision and noninvasiveness.
The researchers worldwide pay much attention to NIR noninvasive blood glucose detection technology. For instance, Unnikrishna Menon et al. measured the reflected near-infrared light through the fingertip before and after occluding the blood flow and predicted glucose present in blood [5]. Yadav et al. designed developed the prototype for near-infrared noninvasive blood glucose detection and claimed that NIR detection technology is promising in noninvasive blood glucose detection [6].
The precision of the noninvasive blood glucose model is key to clinical application. Chuah et al. collected 290 sets of NIR signals between 1500 nm and 1800 nm and applied the two-stage partial least squares (PLS) regression model to prediction of blood glucose, which reveals that the accuracy of the model is improved [7]. Yamakoshi et al. collected 100 sets of NIR spectrum data between 900 nm and 1700 nm by spectrograph and considered the Support Vector Machine to be most accurate based on contrast analysis of principle component analysis (PCA), PLS and SVM [8]. The model combining parallel factor analysis and multiple linear regression is established which is more accurate and robust than multiple linear regression [9]. Each of the methods has advantages, but has some disadvantages: (1) More independent variables can capture more information while more independent variables would cause information redundancy; (2) Spectrometers with high precision and high speed counteract the promotion of noninvasive blood glucose detection at home; (3) The fundamental concept of NIR noninvasive blood glucose detection technology is the Beer-Lambert law, which is applicable to human tissue under ideal conditions. However, NIR noninvasive blood glucose detection does not exactly agree with the Beer-Lambert law, and the relationship between the NIR signal and blood glucose measurement is both linear and nonlinear; (4) These methods do not consider the difference of individual and daily physiological rule.
Ficorella et al. pointed out that the best performances in terms of sensitivity and resolutions is obtain at 1550 nm [10]. To reduce the number of independent variables, our research team designed and developed the noninvasive blood glucose detection optical subsystem using 1550-nm NIR spectrum [11]. The PSO-ANN model is established with considering the nonlinear relationship between blood glucose concentration and 1550-nm absorbance and correcting the individual difference and physiological glucose dynamics. Two artificial neural networks (ANNs) are employed as the basic structure of the PSO-ANN model, and the weight coefficients of the two ANNs which represent the difference of individual and daily physiological rule are optimized by particle swarm optimization (PSO).
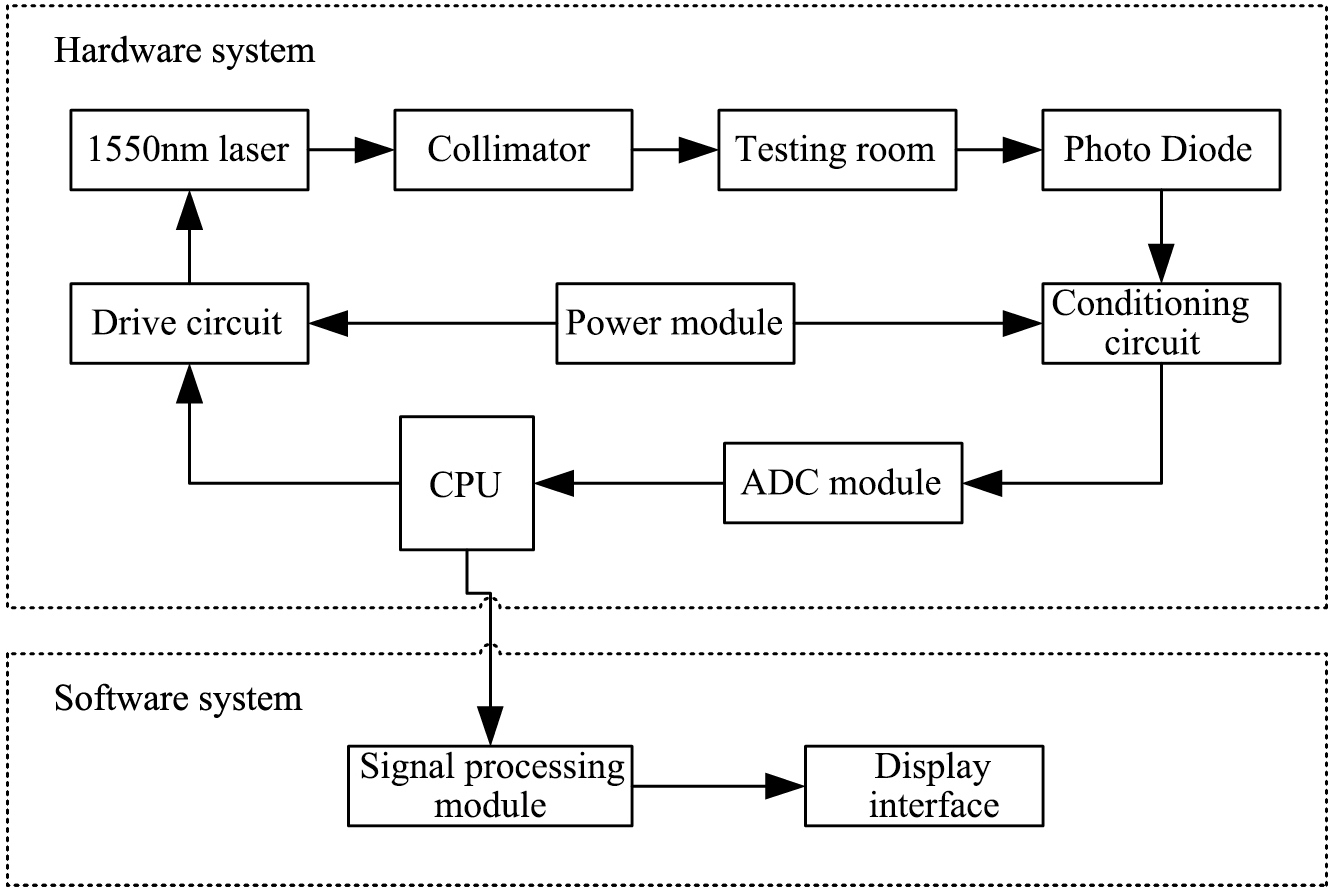
Figure 1.
The system structure diagram.
2.Materials and methods
2.1Collection of experimental data
The 1550-nm NIR signal is measured by the noninvasive blood glucose detection optical subsystem developed by our research group, whose structure is shown in Fig. 1. The 1550-nm NIR signal carries the human blood glucose concentration information [11]. The measurement of the blood glucose concentration is minimally invasive, so the volunteers are informed of the specific process and risk before the experiment, and the data collection was performed with the volunteers’ consent, which meets ethical standards. One touch Ultra Easy (paired with one touch Sure Step Test Strips) is employed to measure the blood glucose concentration. The experimental procedure was as follows: (1) Turn on the power of the optical subsystem and adjust it to the ready position; (2) Wash the volunteer’s hand with soap and spread the hand out to dry; (3) Place the left index finger in the testing room in gentle contact with the surface of the collimator. Control the collection of the data using the experimental system software, and obtain the 1550-nm NIR signal; (4) Repeat step 3 three times to record the 1550-nm NIR signals and take the average of the three measurements; (5) Sterilize the finger with 75% alcohol and measure the blood glucose concentration using the one touch Ultra Easy and test strip after the alcohol fully evaporates; (6) Record the blood glucose measurement values.
Finally, 14 datasets were collected. In which, the 1
2.2Model evaluation indexes
2.2.1Root-mean-square error
The root-mean-square error (RMSE) is the square root of the ratio of the sum of the squared deviation between the prediction values and the measurement values divided by the sample size. The formula is as follows:
(1)
2.2.2Relative error rate
The relative error rate (RER) is the ratio of the absolute error between the prediction values and measurement values to the measurement values; the formula is as follows:
(2)
2.2.3Correlation coefficient
The correlation coefficient is the ratio of the covariance between the prediction values and measurement values to the product of the standard deviations, and the formula is as follows:
(3)
2.3Theory of the ANN model
As described in part 1, there is nonlinear relationship between blood glucose concentration and corresponding NIR absorbance. The artificial neural network (ANN) not only delineates linear relationship but also nonlinear relationship [12], so the model incorporating ANN can be established, which consists of the input layer, hidden layer and output layer.
2.4Theory of the PSO-2ANN model
The ANN model could capture the nonlinear relationship between blood glucose concentration and 1550-nm NIR absorbance, but the ANN model with stationary structure and certain parameters fails to show adequate predictive ability to the new datasets. Generally, the noninvasive blood glucose detection model need to be corrected on account for individual difference (such as skin color) and physiological glucose dynamics. There are many parameters to be corrected in the ANN model, which hinder the household promotion of noninvasive blood glucose measurement. To overcome the above shortcomings, the PSO-2ANN model is proposed. The PSO-ANN model is established with considering the nonlinear relationship between blood glucose concentration and 1550-nm absorbance and correcting the individual difference and physiological glucose dynamics. Two artificial neural networks (ANNs) with stationary structure and certain parameters are employed as the basic structure of the PSO-ANN model, and the weight coefficients of the two ANNs which represent the individual difference and physiological glucose dynamics are optimized by particle swarm optimization (PSO) [13].
3.Results
3.1The ANN model
3.1.1Construction of the ANN model
Fourteen datasets were obtained during the experiment. The three nets were established by 3 datasets (data_9, data_10, data_12), whose sample sizes are large to provide more information. To improve the performance of the nets, the three nets were trained with the 1550-nm NIR signal (denoted by PD) and the reciprocal of the signal (denoted by 1/PD) as independent variables and blood glucose concentrations as dependent variables. The full process is described below.
(1) Determination of the input neurons and the output neurons: Because there is 1 independent variable and 1 dependent variable, there is 1 neuron in both the input layer and the output layer.
(2) Determination of the hidden neurons: The number of the hidden neurons is determined by synthetically considering the RMSE of every dataset and the complexity of the model.
Table 1
RMSEs of Net11, Net12 and Net13 (the independent variable is PD)
| Number of the hidden neurons | Net11 | Net12 | Net13 |
|---|---|---|---|
| 1 | 0.40356 | 0.53772 | 1.11492 |
| 2 | 0.18944 | 0.53772 | 1.07037 |
| 3 | 0.16151 | 0.25181 | 0.15943 |
| 4 | 0.14548 | 2.08E | 2.17E |
| 5 | 0.14032 | 2.19E | 1.29E |
| 6 | 9.65E | 3.76E | 3.32E |
| 7 | 2.73E | 1.67E | 4.80E |
| 8 | 5.07E | 1.87E | 9.13E |
| 9 | 2.77E | 1.47E | 3.06E |
| 10 | 1.05E | 3.66E | 4.16E |
Table 1 shows the RMSEs of three nets with different numbers of the hidden neurons, whose independent variable is PD. The data in column 2 indicate that the variation trend of the RMSEs of Net11 is small when the number of the hidden neurons is greater than 6; the data in column 3 and column 4 were similarly analyzed. The final numbers of the hidden neurons of Net11, Net12 and Net13 were consistently set at 6 to facilitate the comparison of parameters.
As above, the numbers of the hidden neurons of Net21, Net22 and Net23, whose independent variable is 1/PD, were consistently set at 5.
The structures of Net11, Net12, Net13, Net21, Net22 and Net23 were determined after the numbers of the input neurons, the hidden neurons and the output neurons were confirmed. IHW, Hb, HOW, and Ob represent the weight coefficients of the input layer to the hidden layer, the thresholds of the hidden layer, the weight coefficients of the hidden layer to the output layer and the thresholds of the output layer. After trained by the Neural Net Fitting application in MATLAB R2014a, the parameters of Net11, Net12 and Net13 are given in Table 2. Net21, Net22 and Net23 are similar, so we won’t cover those again.
3.1.2Evaluation of the ANN model
After establishing of Net11, Net12, Net13, Net21, Net22 and Net23, the performance of the ANN model was evaluated by using the following indexes with 14 datasets as the test data.
3.1.2.1. RMSE and correlation coefficient (
First, based on the respective analysis of each network, this study found that the prediction performance of the 6 networks is poor for new datasets, illustrating that the ANN model lacks robustness. Next, ANN with 1/PD as the independent variable is more accurate than ANN with PD as the independent variable, as revealed by separately comparing Net11 and Net21, Net12 and Net22, and Net13 and Net23.
Table 2
Parameters of Net11, Net12 and Net13 (the independent variable is PD)
| Net11 | Net12 | Net13 | |||||||||
|---|---|---|---|---|---|---|---|---|---|---|---|
| IHW | Hb | HOW | Ob | IHW | Hb | HOW | Ob | IHW | Hb | HOW | Ob |
| 7.73 | 3.23 | 7.73 | 2.36 | 0.83 | 8.29 | 0.62 | 0.01 | ||||
| 8.48 | – | 5.46 | – | 4.95 | 0.33 | – | |||||
| 1.25 | – | 4.11 | – | 1.76 | – | ||||||
| – | 6.39 | – | 2.05 | – | |||||||
| 9.78 | – | 8.64 | 7.07 | 2.83 | – | 20.35 | 17.12 | 5.10 | – | ||
| 15.17 | 2.64 | 3.96 | |||||||||
Table 3
Comparative analysis of RMSE and
| Network | Independent variable is PD | Independent variable is 1/PD | ||||||||||
|---|---|---|---|---|---|---|---|---|---|---|---|---|
| Net11 | Net12 | Net13 | Net21 | Net22 | Net23 | |||||||
| RMSE |
| RMSE |
| RMSE |
| RMSE |
| RMSE |
| RMSE |
| |
| data_1 | 9.39 | 0.31 | 2.86 | 0.36 | 1.22 | NaN | 1.67 | 2.85 | 0.53 | |||
| data_2 | 10.04 | 2.26 | 0.80 | NaN | 2.24 | 0.11 | 2.25 | 0.80 | 0.00 | |||
| data_3 | 9.27 | 0.55 | 3.15 | 0.56 | 1.65 | NaN | 1.76 | 0.11 | 3.15 | 0.32 | 1.10 | 0.28 |
| data_4 | 10.23 | 2.09 | NaN | 0.72 | NaN | 3.14 | 2.08 | 0.93 | ||||
| data_5 | 2.73 | 0.69 | 1.91 | 0.86 | 3.53 | 0.79 | 1.49 | 0.88 | 0.79 | 0.74 | 3.37 | 0.70 |
| data_6 | 10.11 | 2.27 | NaN | 0.92 | NaN | 3.63 | 2.26 | 0.97 | ||||
| data_7 | 0.75 | 0.23 | 3.08 | 0.88 | 1.14 | 0.91 | 1.79 | 0.57 | 0.97 | |||
| data_8 | 1.11 | 0.99 | 0.94 | 3.72 | 0.99 | 1.23 | 0.89 | 0.95 | 0.98 | 3.69 | 1.00 | |
| data_9 | 0.00 | 1.00 | 1.45 | 0.12 | 1.85 | 0.36 | 0.00 | 1.00 | 1.25 | 2.12 | 0.17 | |
| data_10 | 2.78 | 0.56 | 0.00 | 1.00 | 1.93 | 2.67 | 0.56 | 0.00 | 1.00 | 2.46 | ||
| data_11 | 1.77 | 0.07 | 1.97 | 0.30 | 2.05 | 0.10 | 1.96 | 0.18 | 1.81 | 0.41 | 2.40 | 0.21 |
| data_12 | 1.95 | 0.06 | 2.51 | 0.00 | 1.00 | 2.45 | 2.56 | 0.00 | 1.00 | |||
| data_13 | 1.95 | 1.51 | 2.07 | 0.84 | 1.63 | 1.20 | 2.07 | 0.91 | ||||
| data_14 | 1.74 | 0.08 | 4.01 | 2.11 | 0.17 | 2.46 | 2.07 | 0.12 | 2.34 | |||
Note: NaN in Table 3 occurs when the denominator in the formula of the correlation coefficient is zero, which is meaningless.
Table 4
Analysis of the relative error
| Network | Independent variable is PD | Independent variable is 1/PD | ||||
| Net11 | Net12 | Net13 | Net21 | Net22 | Net23 | |
| data_1 | 78.22% | 23.80% | 10.18% | 13.95% | 23.76% | 4.39% |
| data_2 | 83.70% | 18.80% | 6.63% | 18.67% | 18.76% | 6.67% |
| data_3 | 77.27% | 26.25% | 13.74% | 14.68% | 26.21% | 9.14% |
| data_4 | 85.23% | 17.38% | 5.97% | 26.21% | 17.33% | 7.75% |
| data_5 | 22.73% | 15.90% | 29.45% | 12.40% | 6.56% | 28.09% |
| data_6 | 84.22% | 18.89% | 7.67% | 30.29% | 18.84% | 8.11% |
| data_7 | 6.27% | 25.68% | 7.30% | 9.53% | 14.91% | 8.06% |
| data_8 | 9.22% | 8.25% | 30.99% | 10.28% | 7.93% | 30.79% |
| data_9 | – | 12.05% | 15.44% | – | 10.41% | 17.64% |
| data_10 | 9.83% | – | 16.07% | 8.94% | – | 19.64% |
| data_11 | 14.72% | 16.41% | 17.07% | 16.37% | 15.07% | 19.99% |
| data_12 | 16.25% | 20.88% | – | 20.42% | 21.30% | – |
| data_13 | 16.29% | 12.57% | 17.27% | 13.54% | 9.98% | 17.23% |
| data_14 | 14.49% | 33.43% | 17.57% | 20.53% | 17.27% | 19.53% |
3.1.2.2. RER
The data in Table 4 show that prediction precision of the 6 networks is low. The ANN with 1/PD as the independent variable is more accurate than the ANN with PD as the independent variable based on separate comparisons of Net11 and Net21, Net12 and Net22, and Net13 and Net23, in agreement with the results above.
3.1.2.3. EGA
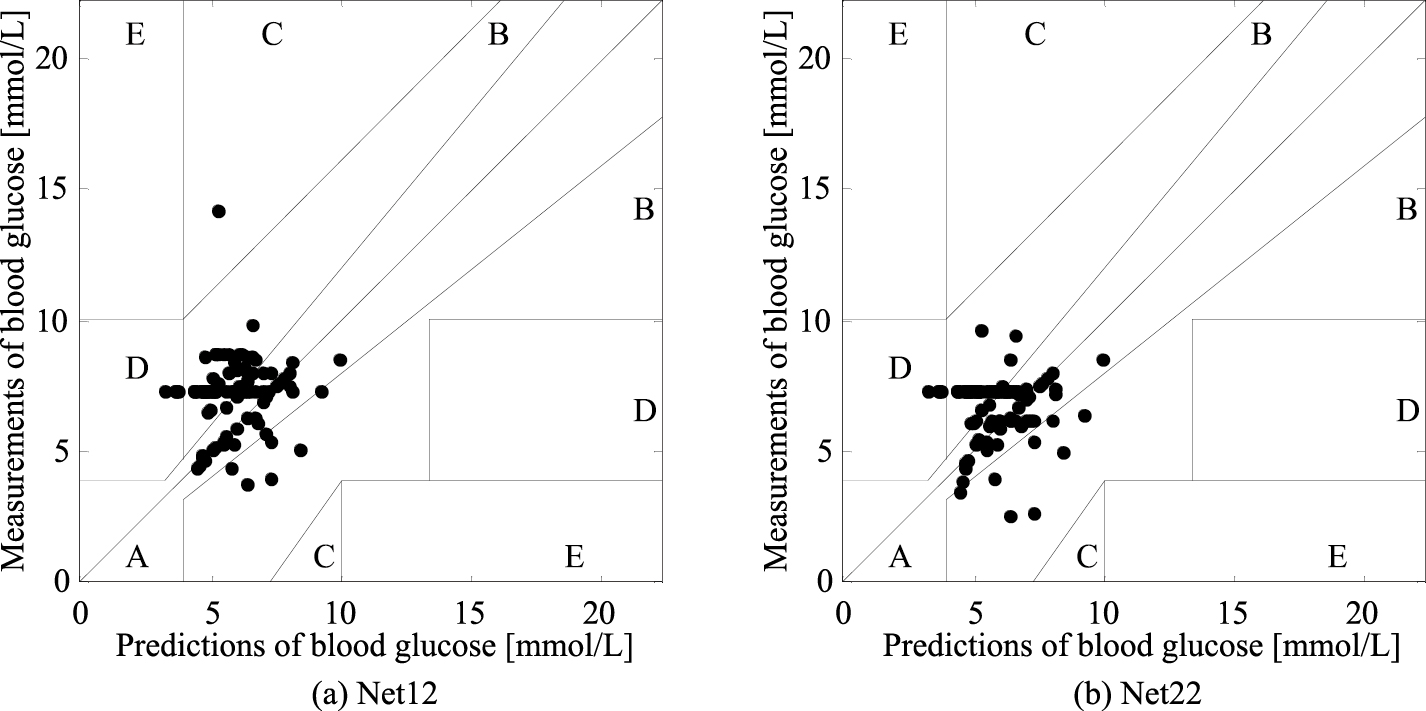
Clarke error grid analysis (EGA) is the “gold standard” and considers 4 factors – the absolute prediction values of blood glucose, the absolute deviation between the predictions and measurements, the relative difference in those deviations, and the clinical significance of the difference [14]. Clinically, the values distributed in regions A and B are acceptable, while the values distributed in other regions are not acceptable. The EGAs are illustrated by Net12 and Net22 to comparatively analyze. Figure 2 shows that the predictions of Net12 are distributed in regions A, B, C and D, while the predictions of Net22 are distributed in regions A, B and D. The percentage of each region in the EGA is presented in Table 5 for a clear comparative analysis. The ANN model could not make all predictions distributed in regions A and B. The ANN with 1/PD as the independent variable was more accurate. Thus, 1/PD will be subsequently used as the independent variable.
Table 5
Statistical table of Clarke error grid analysis
| Networks | Independent variable is PD | Independent variable is 1/PD | ||||
|---|---|---|---|---|---|---|
| Net11 | Net12 | Net13 | Net21 | Net22 | Net23 | |
| A | 67.74% | 37.63% | 53.76% | 39.78% | 45.16% | 53.76% |
| B | 26.88% | 56.99% | 41.94% | 59.14% | 50.54% | 41.94% |
| C | 1.08% | 1.08% | 0.00% | 1.08% | 0.00% | 0.00% |
| D | 4.30% | 4.30% | 4.30% | 0.00% | 4.30% | 4.30% |
| E | 0.00% | 0.00% | 0.00% | 0.00% | 0.00% | 0.00% |
Figure 2.
Clarke error grid Analysis of Net12 and Net22.
3.2The PSO-2ANN model
3.2.1Construction of the PSO-2ANN model
The two nets that are more accurate among Net21, Net22, and Net23 trained with 1/PD as an independent variable were taken as submodules, and the weight coefficients of the two were optimized by PSO. The algorithm process of the PSO-2ANN model is as follows: (1) Selection of submodules: The data in Tables 3 and 4 reveals that the prediction performance of Net22 is worse for all experimental datasets; thus the two submodules were Net21 and Net23; (2) Topological structure of PSO-2ANN: Net21 and Net23 are two submodules of the PSO-2ANN model, denoted by Net, Net
Table 6
Evaluation indicators of PSO-2ANN
| Dataset | RMSE | RER |
|
|---|---|---|---|
| data_1 | 0.69 | 5.73% | |
| data_2 | 0.88 | 7.31% | 0.46 |
| data_3 | 1.39 | 11.58% | 0.04 |
| data_4 | 1.05 | 8.73% | |
| data_5 | 1.51 | 12.55% | 0.88 |
| data_6 | 1.06 | 8.82% | |
| data_7 | 0.96 | 7.99% | |
| data_8 | 1.29 | 10.78% | 1.00 |
| data_9 | 0.02 | 0.16% | 1.00 |
| data_10 | 1.03 | 8.57% | 0.47 |
| data_11 | 1.77 | 14.77% | 0.18 |
| data_12 | 0.08 | 0.68% | 1.00 |
| data_13 | 1.22 | 10.18% | 0.57 |
| data_14 | 2.26 | 18.87% |
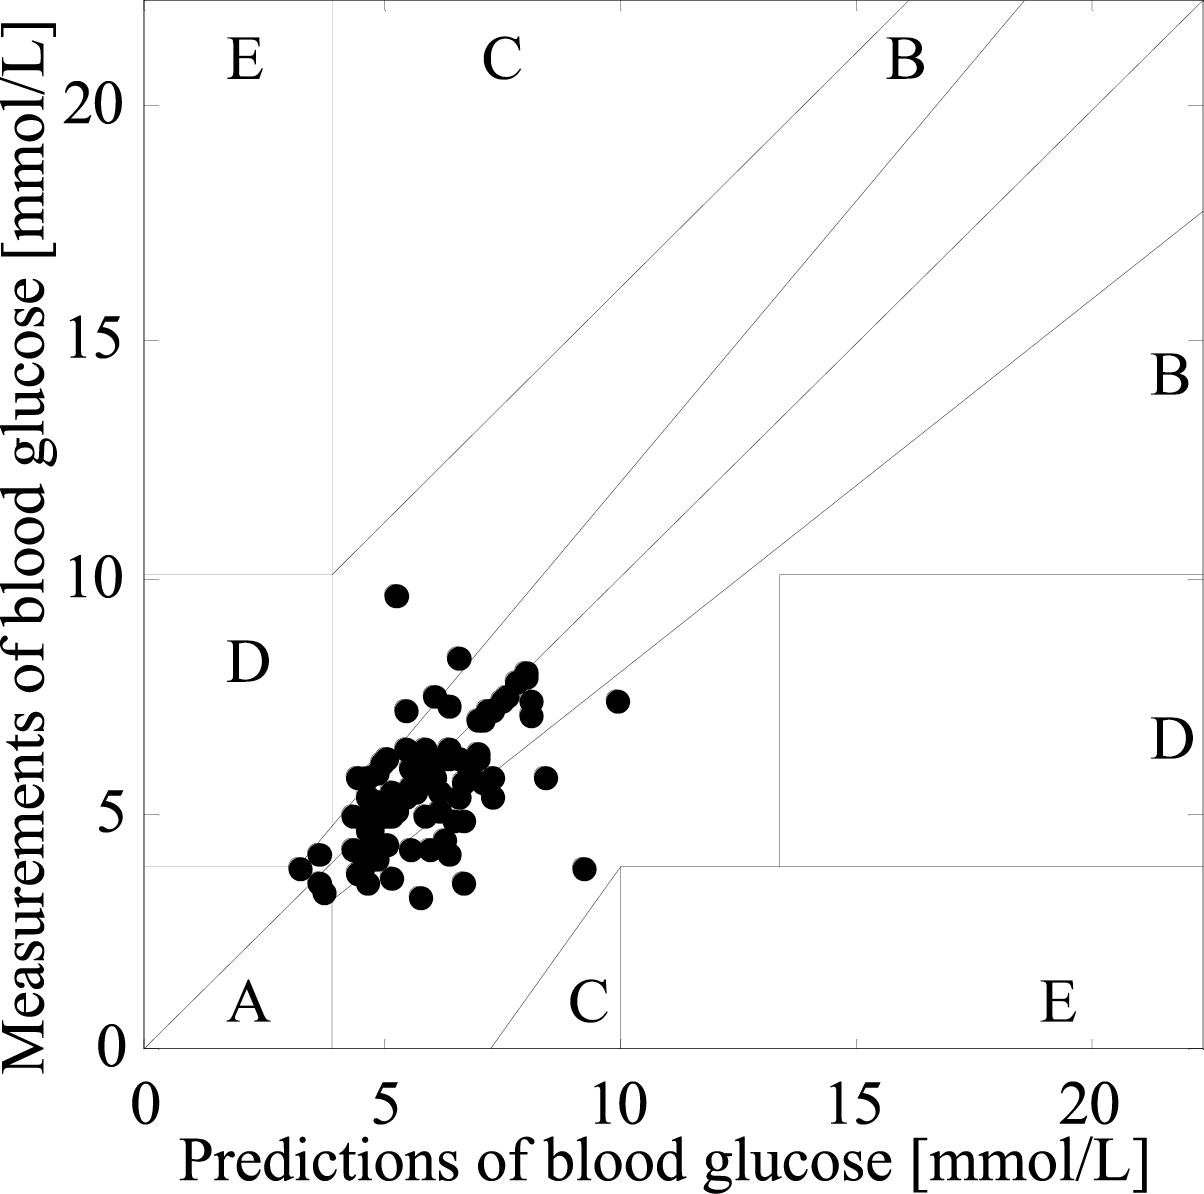
Figure 3.
Clarke error grid of PSO-2ANN.
3.2.2Evaluation of the PSO-ANN model
3.2.2.1. RMSE, RER and
The performance of the PSO-2ANN model was superior to that of the ANN model whether evaluated by RMSE, RER or p based on a comparative analysis, as shown in Tables 3, 4 and 6. Additionally, the PSO-2ANN model is capable to overcome individual difference and physiological glucose dynamics.
3.2.2.2. EGA
Figure 3 presents the Clarke error grid of the PSO-2ANN model. The percentage of the predictions distributed in region A is 64%, the percentage of the predictions distributed in region B is 29%, and the percentage of the predictions distributed in the critical line between regions A and D is 7%. According to the results of statistical analysis, the predictors of PSO-2ANN meet the clinical accuracy requirement.
Figure 4.
RMSEs of 10 experiments.
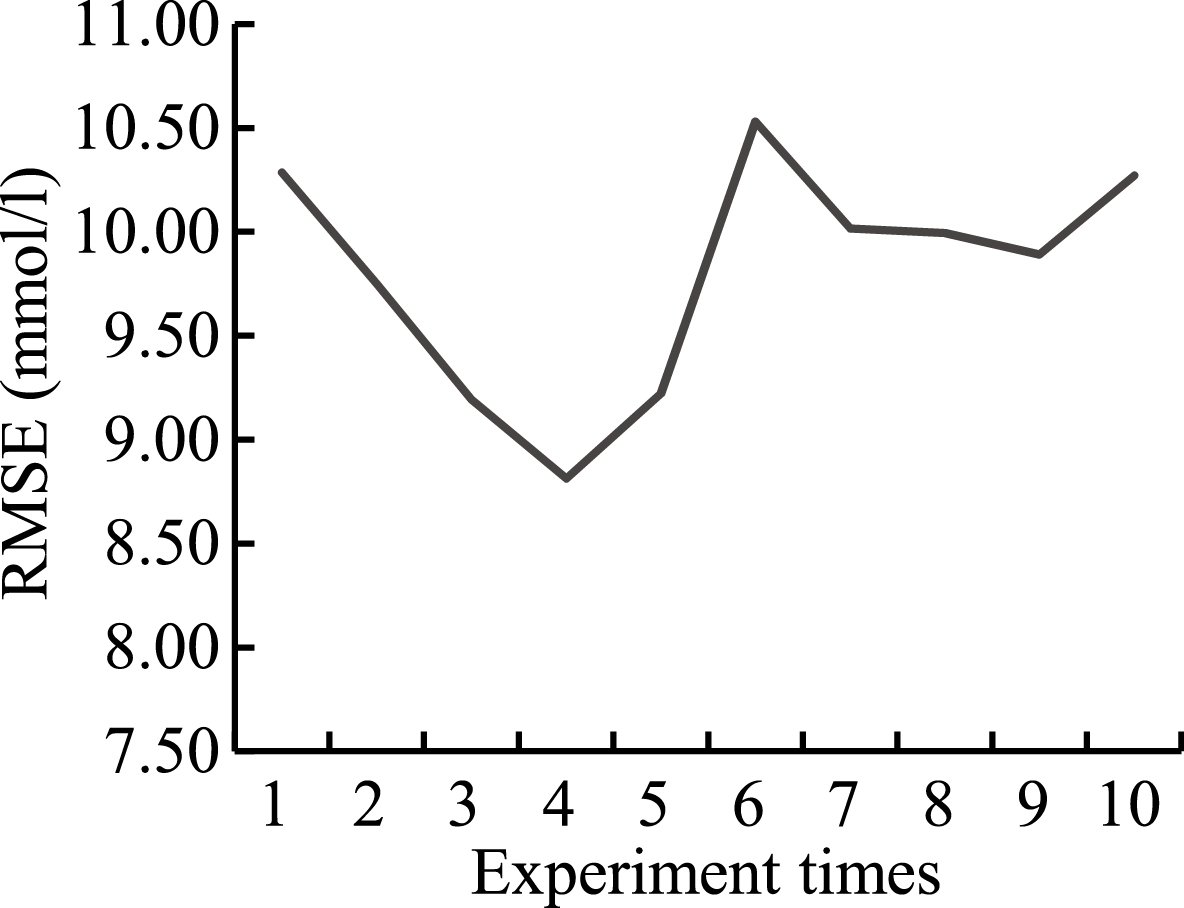
Figure 5.
Bland-Altman plot for predictions and measurements of blood glucose.
3.3Reliability of the PSO-2ANN model
3.3.1Assessment of chance correlation
Zhao of Tianjin University indicated that chance correlation may occur during blood glucose modeling [15]. To further verify the validity and reliability of the PSO-2ANN model, the research on chance correlation during PSO-2ANN modeling was conducted by random number methods. Because the range of experimental data was from 0 to 25, the 1000
3.3.2Bland-Altman analysis
The Bland-Altman method is the popular method to assess the agreement of medical instruments [16]. The results of Bland-Altman analysis between predictions by the PSO-2ANN model and measurements are shown in Fig. 5. The mean and the standard deviation of the difference between predictions and measurements are 0.0678 mmol/L and 1.1497 mmol/L, respectively. The 95% limits of agreement are [
4.Discussion
As shown above, the PSO-2ANN model is capable of noninvasive blood glucose detection by using an invasive blood glucose concentration to calibrate the weight coefficient every day. The enhanced robustness provided by the PSO-2ANN model can be attributed to two primary factors. First, the relationship between blood glucose concentration and 1550-nm absorbance may be different due to individual difference (such as skin color). The two ANNs with different structure and parameters are employed as the submodules of the PSO-2ANN model, which could provide different relationship between blood glucose concentration and 1550-nm absorbance. Second, each ANN model is trained by the dataset on different days which learn the rule of physiological glucose dynamics.
Finally, it should be noted that although application of the PSO-2ANN model enhances prediction accuracy and robustness, it suffers from some drawbacks. First, the experimental datasets are from 6 healthy subjects, the range of which is narrow. thus, the applicability of PSO-2ANN in diabetics needs to be further verified. Second, the blood glucose concentration is impacted by many factors, such as the ambient temperature, pulse rate, blood pressure and finger temperature. The study only considers the 1550-nm absorbance.
5.Conclusion
The 1550-nm NIR signal is employed to predict glucose concentration in blood due to its sensitivity and resolutions to blood glucose. The presence of nonlinear relationship between blood glucose concentration and 1550-nm absorbance must be considered in developing an accurate and robust NIR-based calibration model for predicting blood glucose concentrations. The ANN model can describe the nonlinear relationship but fails to predict new datasets, so the ANN models are taken as the submodules of the PSO-2ANN model, which can overcome individual difference and physiological glucose dynamics. Compared to the ANN model, the PSO-2ANN model can provide the enhanced robustness.
Conflict of interest
None to report.
References
[1] | Fan Y, Du J, Li X, Bao Y, Song D, Liu H, Zhu J. Detriment and protection of diabetes mellitus. Journal of Practical Traditional Chinese Internal Medicine (2012) ; 06: : 56-58. |
[2] | Laakso M. Glycemic control and the risk for coronary heart disease in patients with non-insulin-dependent diabetes mellitus. The Finnish studies. Annals of Internal Medicine (1996) ; 124: (2): 127-30. |
[3] | Ledru F, Ducimetière P, Battaglia S, et al. New diagnostic criteria for diabetes and coronary artery disease: Insights from an angiographic study. Journal of the American College of Cardiology (2001) ; 37: (6): 1543-1550. |
[4] | Ji Z, Qin Z, Cheng X, Peng C. Study of principles of non-invasive glucose monitoring and instruments with the methods. Journal of Biomedical Engineering (2010) ; 01: : 222-226. |
[5] | Unnikrishna Menon KA, Hemachandran D, Abhishek TK. A survey on non-invasive blood glucose monitoring using NIR. International Conference on Communications and Signal Processing (2013) ; 1069-1072. |
[6] | Yadav J, Rani A, Singh V, et al. Near-infrared LED based non-invasive blood glucose sensor. (2014) . |
[7] | Chuah ZM, Paramesran R, Thambiratnam K, et al. A two-level partial least squares system for non-invasive blood glucose concentration prediction. Chemometrics and Intelligent Laboratory Systems (2010) ; 104: (2): 347-351. |
[8] | Yamakoshi Y, Ogawa M, Tamura T. Multivariate regression and classification models for estimation of blood glucose levels using a new non-invasive optical measurement technique named pulse-glucometry. Open Optics Journal (2009) ; 3: (1): 63-69(7). |
[9] | Zhang W, Liu R, Xu K. Enhanced robustness of calibration models using parallel factor (PARAFAC) analysis with NIR spectral data for non-invasive blood glucose monitoring. ACTA Chimica Sinica (2013) ; 71: (9): 1281-1286. |
[10] | Ficorella A, D’Amico A, Santonico M, Pennazza G, Grasso S, Zompanti A. A multi-frequency system for glucose detection with optical sensors. AISEM Conference IEEE (2015) ; 59: : 1-3. |
[11] | Yang X, Ji Z, Yang L, Peng C. The construction and analysis of the optical system for non-invasive blood glucose detection based on near infrared transmission method. Chinese Journal of Biomedical Engineering (2012) ; 1: : 147-150. |
[12] | Qin G. Artificial neural networks and its applications. Sichuan University, (2003) . |
[13] | Xie Z. Application of optimized neutral network soft-sensing in the blood glucose concentration estimation. Jiangsu University, (2016) . |
[14] | Perolat J, Couso I, Loquin K, et al. Generalizing the Wilcoxon rank-sum test for interval data. International Journal of Approximate Reasoning (2015) ; 56: : 108-121. |
[15] | Zhao B, Cao Y, Liu R, Xu K. Study of chance correlation in blood glucose sensing. Spectroscopy and Spectral Analysis (2012) ; 04: : 934-938. |
[16] | Zaki R, Bulgiba A, Ismail NA. Testing the agreement of medical instruments: Overestimation of bias in the Bland-Altman analysis. Preventive Medicine (2013) ; 57: (Suppl 3): 80-2. |


