
Changes in the bilateral pulse transit time difference with a moving arm
Abstract
BACKGROUND:
Changes of pulse transit time (PTT) induced by arm position were studied for unilateral arm. However, consistency of the PTT changes was not validated for both arm sides.
OBJECTIVE:
We aimed to quantify the PTT changes between horizontal and non-horizontal positions from right arm and left arm in order to explore the consistency of both arms.
METHODS:
Twenty-four normal subjects aged between 21 and 50 (14 male and 10 female) years were enrolled. Left and right radial artery pulses were synchronously recorded from 24 healthy subjects with one arm (left or right) at five angles (90
RESULTS:
The overall mean PTT changes at the five angles (from 90
CONCLUSIONS:
Obvious differences were not found in the PTT changes between the two arms (left arm moving or right arm moving) under each of the five different positions (all
1.Introduction
The assessment and detection of arterial function is important for cardiovascular physiology and pathophysiology [1, 2]. The properties of the peripheral arteries are often used in the assessment of health and disease and are associated with different physiological and clinical conditions, such as aging [2, 3], hypertension [4, 5], heart failure [6, 7], drug injection [8] and arterial disease [9]. Clinically, the in vivo characterization and quantification of the arterial properties are difficult to achieve. Arterial compliance is usually used to quantify the arterial characteristics (compliance
PTT can change due to blood pressure changes in the arm with arm raising or lowering [15, 16]. Raising or lowering arm can easily lead to the changes in blood pressure. Based on this information, Zheng and Murray [17] studied the effects of the arm heights on the PTT by right arm at different positions, demonstrating the PTT increased with the arm raised. However, their study was only performed by moving the right arm at different positions and the PTT changes were calculated from unilateral arm artery pulse waveforms in two separate measurements. It was not studied and was taken for granted that the right arm had consistency with the left arm in PTT induced by arm movement.
This study intended to research the consistency of changes in PTT induced by right arm movement and left arm movement. The hypothesis of the current study is that, in healthy subjects, the bilateral radial artery PTTs should be almost the same if both arms are in the same position. Therefore, one arm be placed in different heights with the other arm placed in the horizontal level as a reference, a PTT changes could be induced and its changes with arm movement could be quantified.
2.Methods
2.1Subjects
Twenty-four normal subjects aged between 21 and 50 (14 males and 10 females) years were enrolled in this study. Table 1 showed basic clinical information of subjects. Ethical permission was obtained from Shandong University in China and all subjects signed informed protocol.
Table 1
Basic characteristics for the 24 subjects studied
| Parameters | Value | Range | |
|---|---|---|---|
| Number (M/F) | 24 (14/10) | – | |
| Age (year) | 29 | 21–50 | |
| Height (cm) | 169 | 151–183 | |
| Weight (kg) | 63 | 41–87 | |
| BMI (kg/m | 22 | 15–27 | |
| SBP (mmHg) | 115 | 93–137 | |
| DBP (mmHg) | 70 | 57–95 | |
| MAP (mmHg) | 85 | 69–107 | |
Values are showed as means
2.2Arterial pulse measurement
Testing was carried out in a quiet environment with an ambient temperature of approximately 26
The whole measurement procedure for each subject included two identical repeat sessions. In each session, five separate measurements were obtained from right arm at 90
Table 2
Four schemes of the experimental design
| Scheme | Session | Reference arm | Moving arm | Position order | ||||
|---|---|---|---|---|---|---|---|---|
| 1 | 1 | Left | Right | 90 | 45 | 0 | ||
| 2 | Left | Right | 90 | 45 | 0 | |||
| 2 | 1 | Right | Left | 90 | 45 | 0 | ||
| 2 | Right | Left | 90 | 45 | 0 | |||
| 3 | 1 | Left | Right | 0 | 45 | 90 | ||
| 2 | Left | Right | 0 | 45 | 90 | |||
| 4 | 1 | Right | Left | 0 | 45 | 90 | ||
| 2 | Right | Left | 0 | 45 | 90 | |||
Figure 1.
An example of the measurement process with the right arm at five angles.
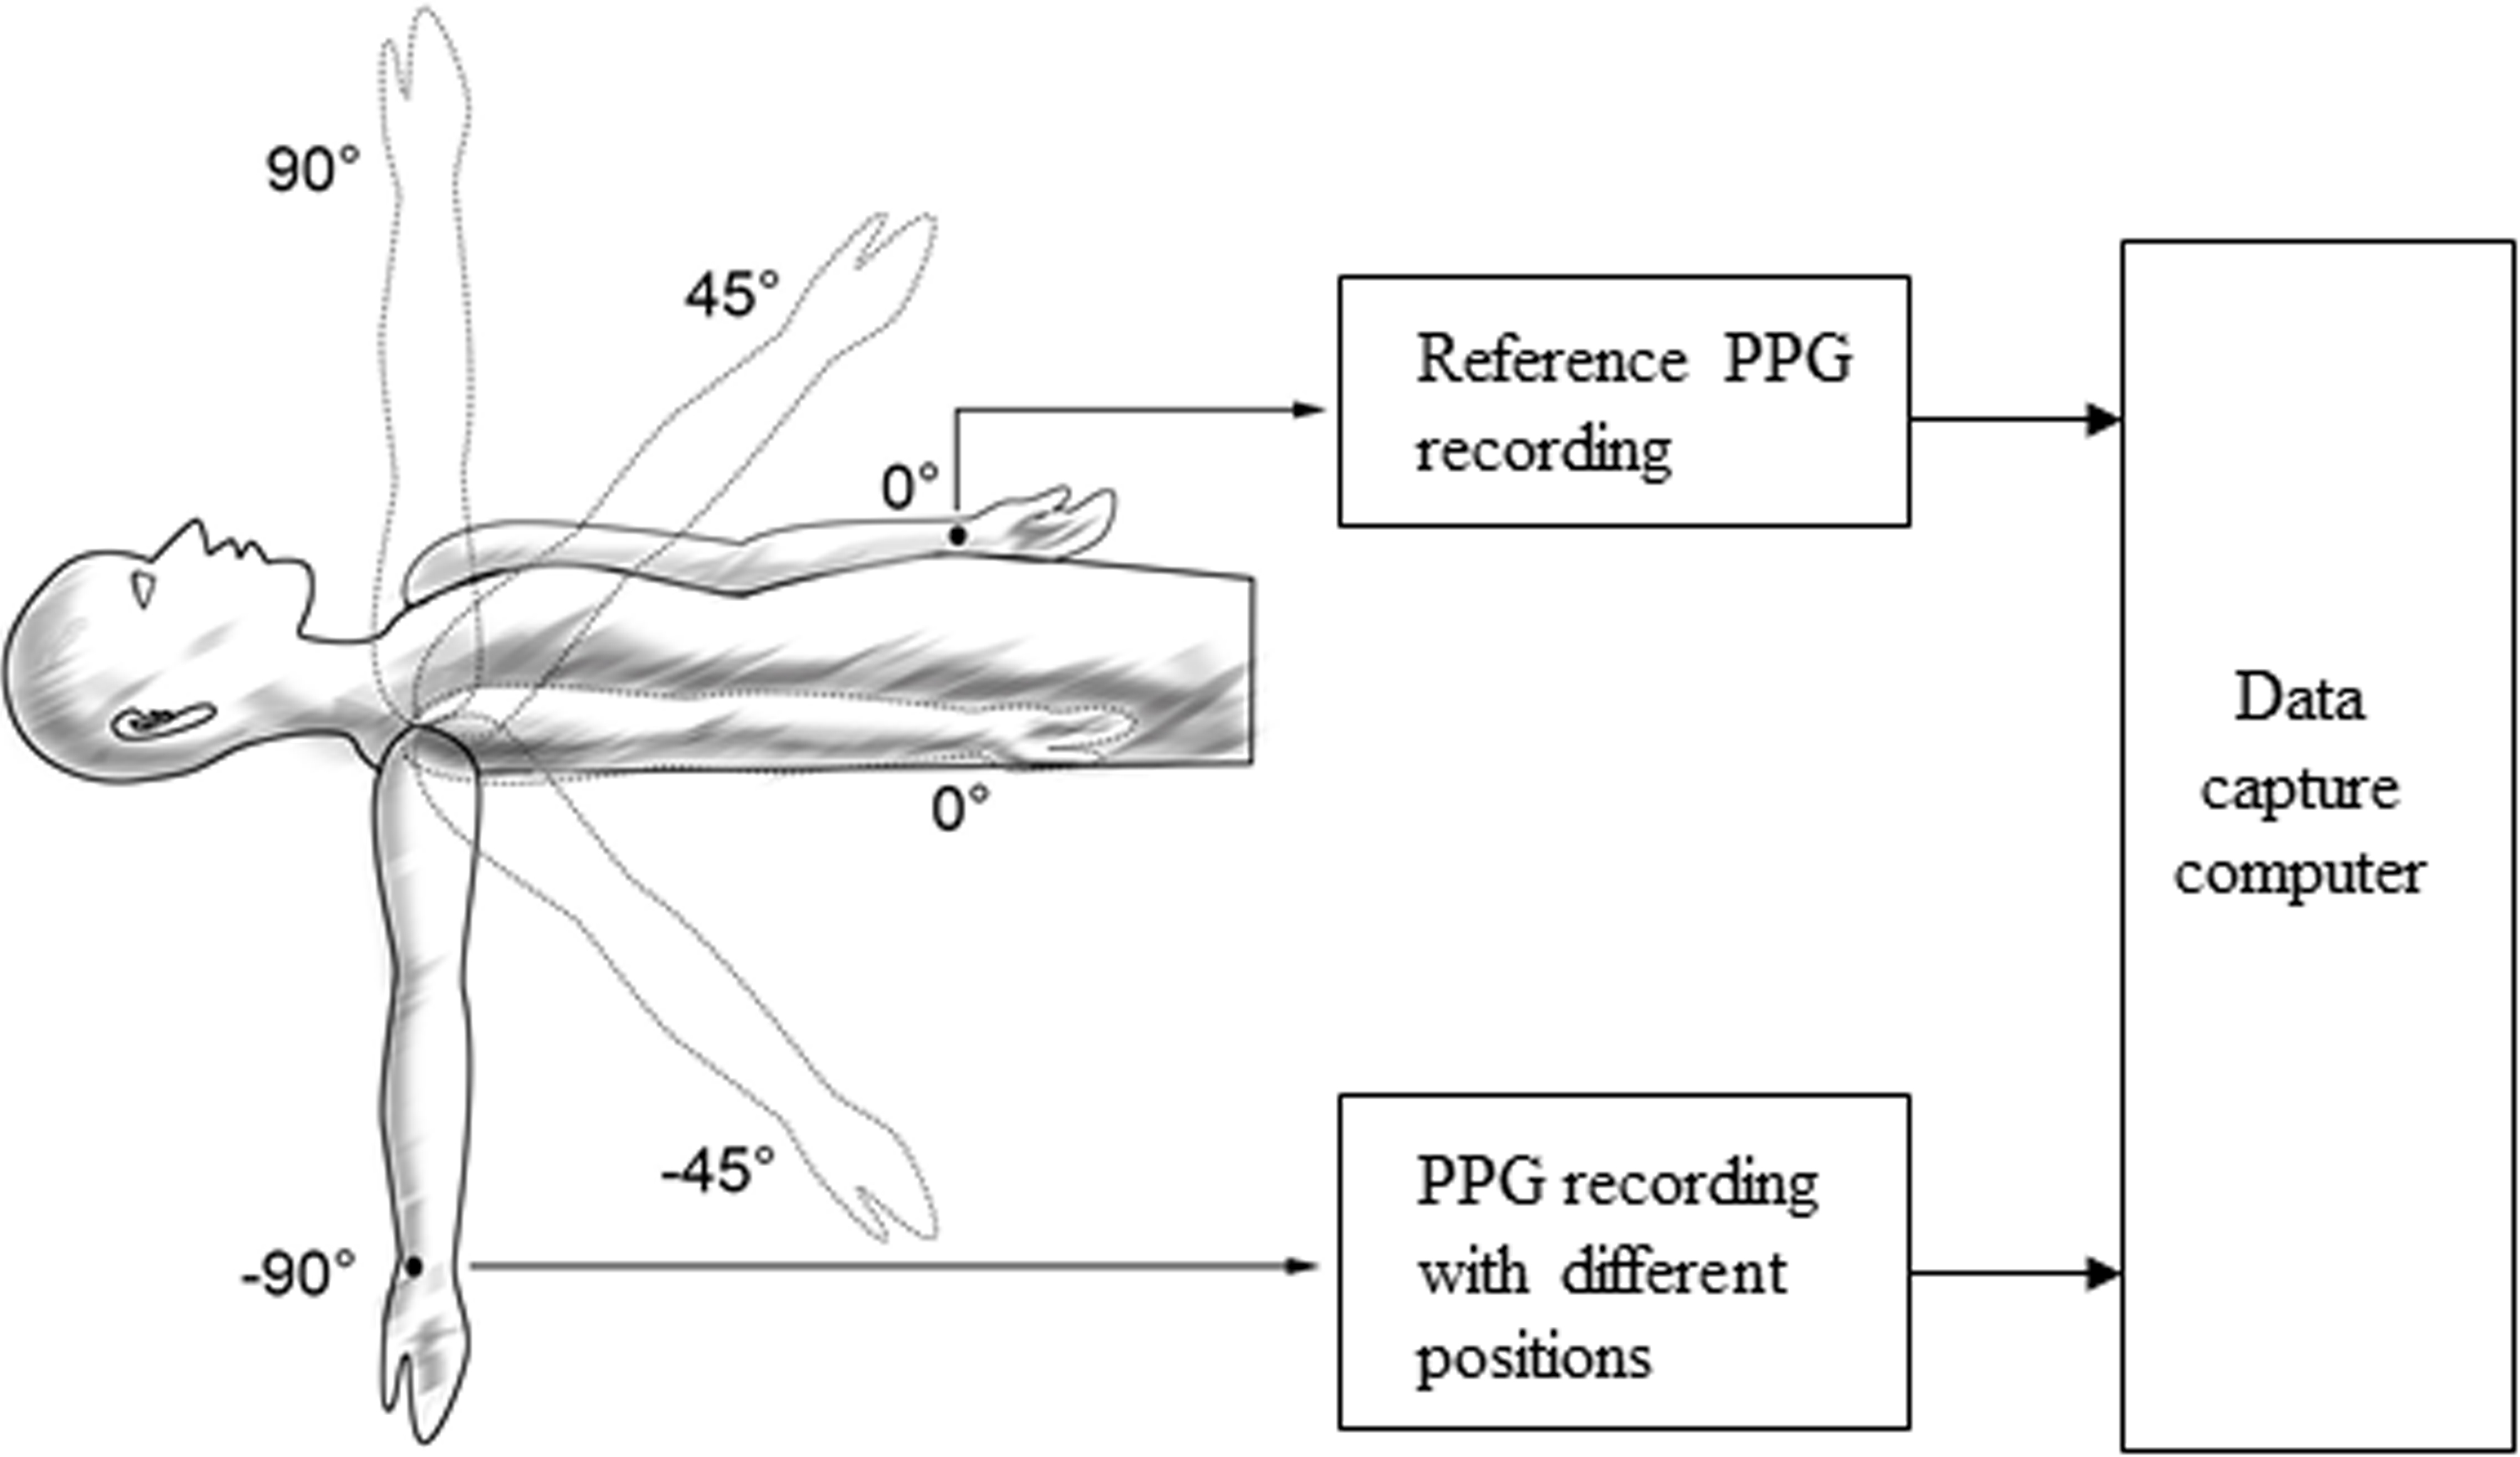
During each measurement, the moving arm was placed on a mechanical support to avoid movement. Subjects were instructed to breathe regularly and gently during the measurement. When the signal presented is stable, radial artery pulses from the left and right sides were simultaneously recorded for 40 s. All measurements were performed by the same operator. At the beginning and end of each whole measurement procedure, blood pressures (SBP and DBP) were measured with the subject supine using a validated BP monitor (102, Dongyue healthcare, Shandong, China).
2.3Radial arterial pulse analysis
The foot points of each recorded radial artery pulse were first detected by an open-source algorithm, ‘wabp’ from PhysioNet [18, 19] and were then verified manually. As shown in Fig. 2, the beat-by-beat PTT changes between the arm at five angles and the reference arm at the horizontal level were calculated from the pulse foot points within the same heartbeat. For each subject, the PTT change was calculated by the average for 10 consecutive heart beats in each arm angle. In total, 20 PTT changes for each subject were evaluated (from 2 repeats, with the left or right arm as the moving arm, and 5 arm positions).
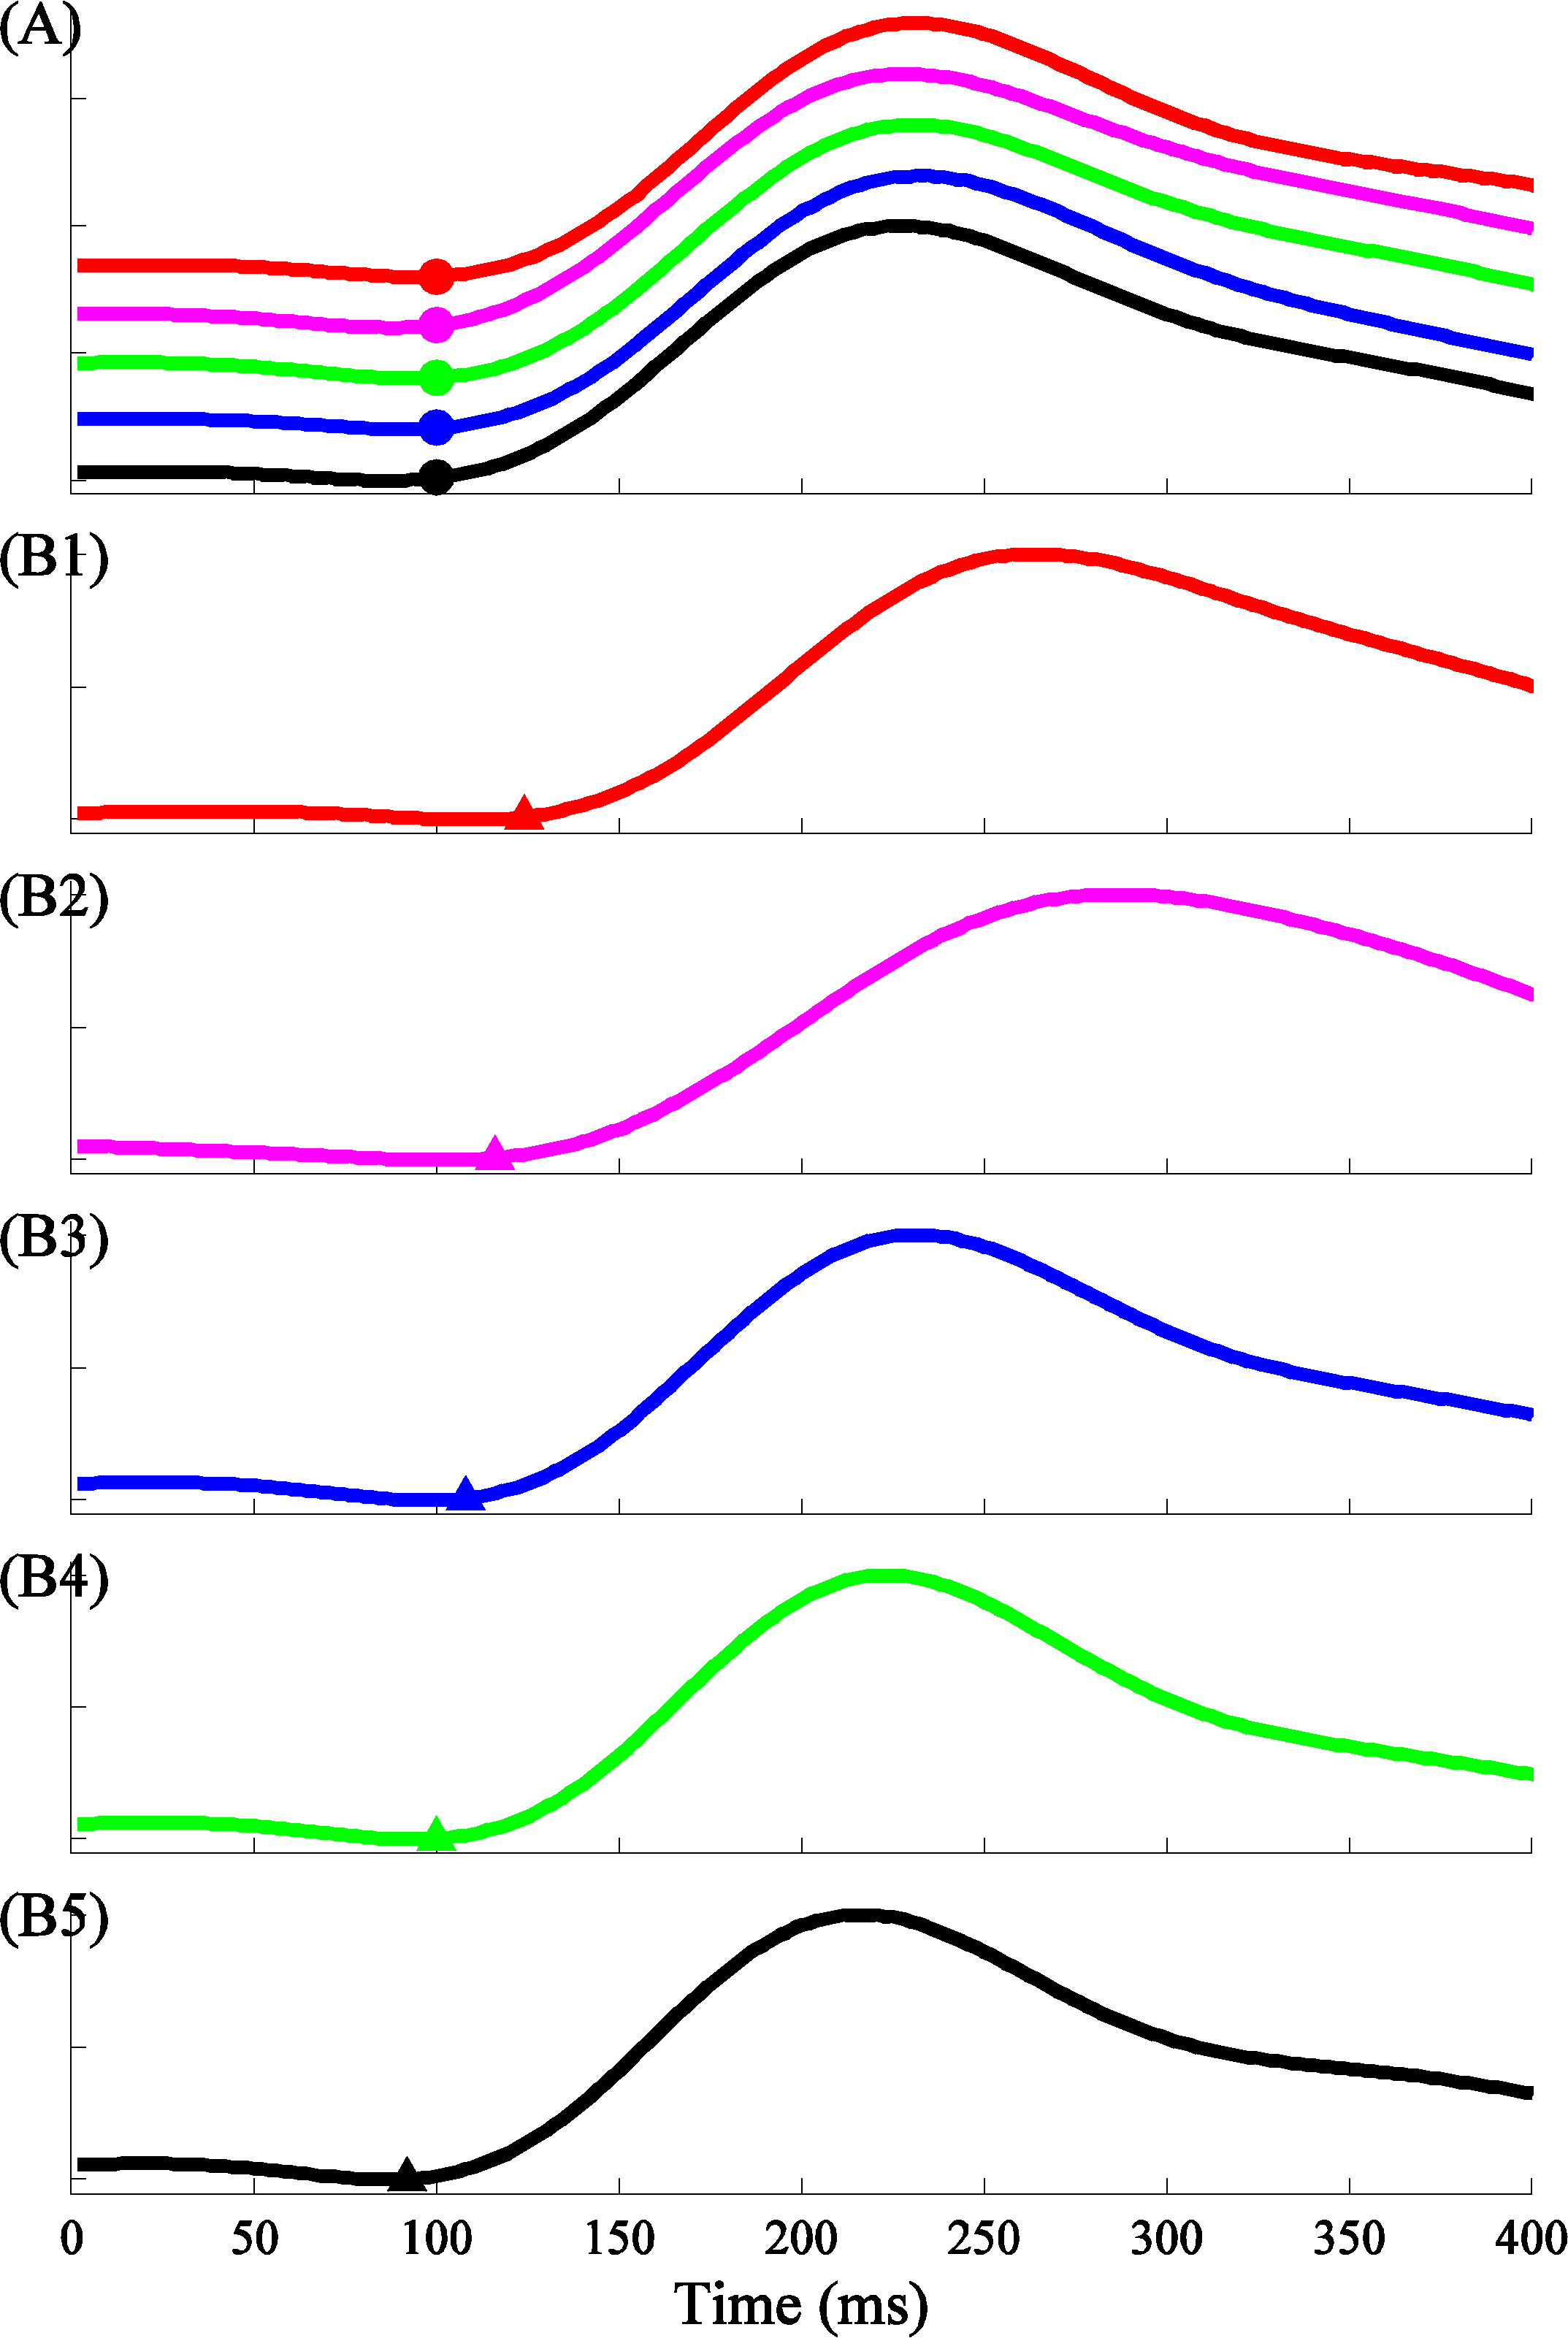
Figure 2.
Examples of recorded pulse waveforms and the corresponding pulse feet to show the PTT changes between the reference arm at the horizontal level (A) and the arm at various positions (B1–B5, 90
2.4Data and statistical analysis
The means and standard deviations (SDs) of the PTT changes between one arm at five angles (90
3.Results
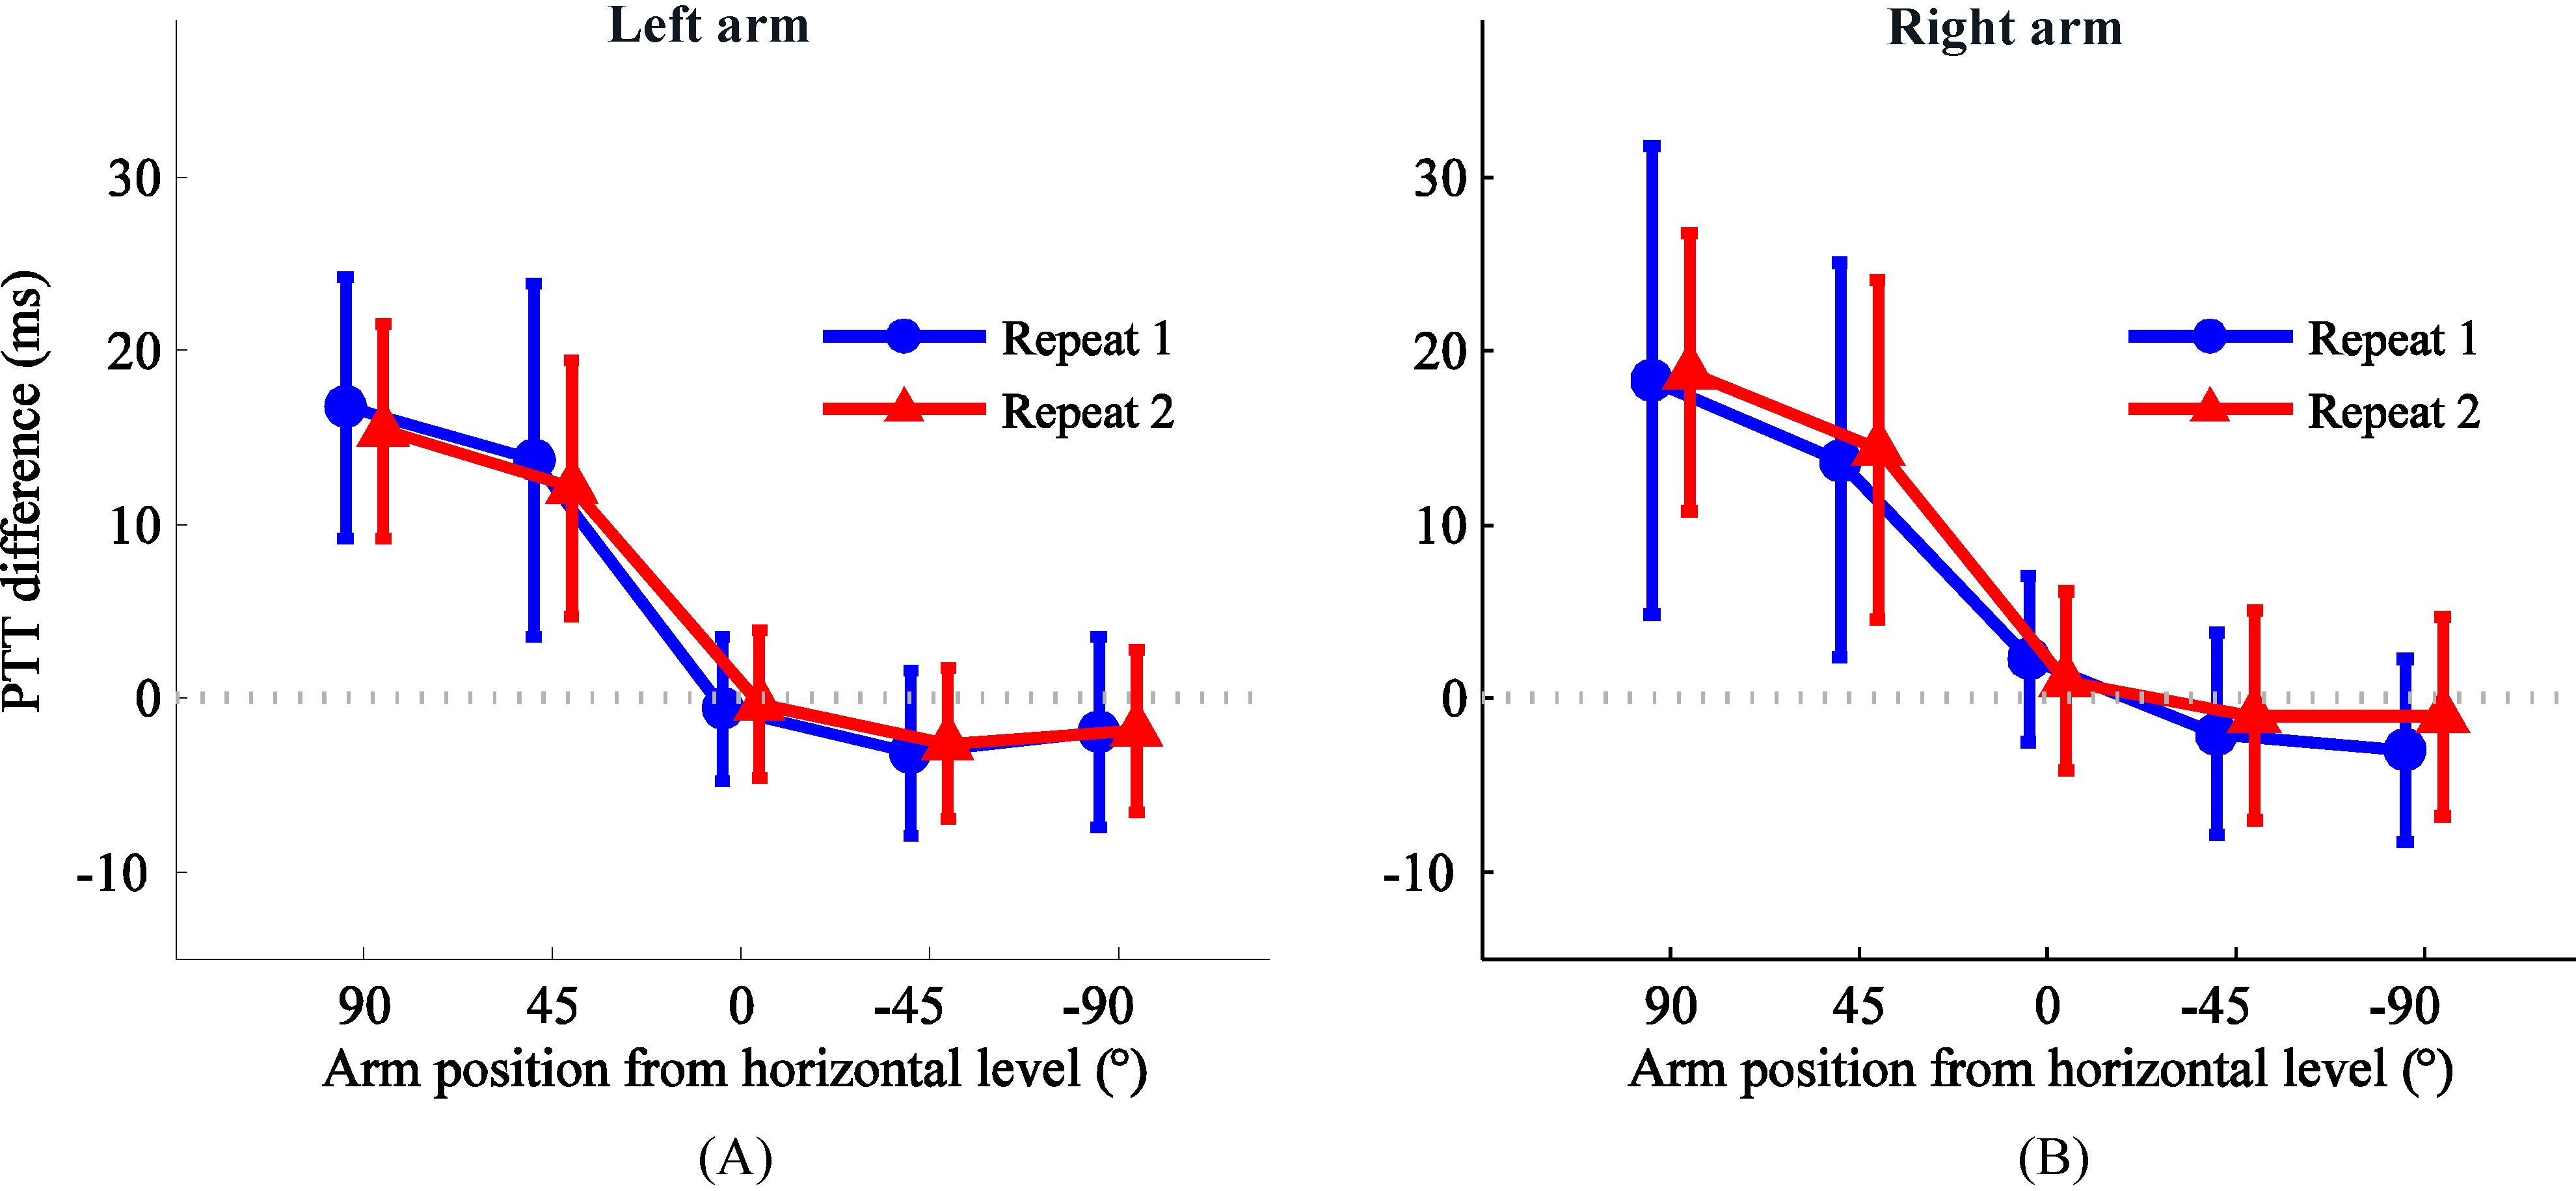
The overall means and SDs of paired differences in the PTT changes between the two repeat measurement sessions are detailed in Fig. 3. There were no significant differences between the two repeat sessions for both arms (all
Table 3
The overall means and SDs of PTT changes from the two repeat sessions
| Position | Overall PTT changes (ms) | |||
|---|---|---|---|---|
| With the left arm moving | With the right arm moving | |||
| 90 | 16.1 | 18.0 | ||
| 45 | 12.3 | 12.6 | ||
| 0 | 1.6 | |||
| | | |||
Figure 3.
Means and SDs of the PTT change between one arm at different positions (90
4.Discussion and conclusion
As an indirect and non-invasive technique, the measurement of PTT changes with the arm moving has been reported to quantify the changes of peripheral arterial property. This study quantified and compared the PTT changes induced by right arm movement with the PTT changes induced by left arm movement in order to research the consistency of changes in PTT induced by both arm movement.
Blood pressure changes in the arm with the arm at different heights [15, 16] and PTT can change due to blood pressure changes. Arm position affects PTT was reported by Zheng and Murray [17]. However, Liu reported the relationship between PTT changes and peripheral arterial BP changes induced by lifting right arm above heart level. Zheng et al. mentioned the PTT changes with the arm above and below heart level, but they also obtained the unilateral PTT changes induced by the right arm movement. Moreover Liu and Zheng et al. obtained the PTT changes asynchronously. Since the two separate measurements were performed at different times, the physiological factors of heart rate, blood pressure and emotional status could be different. Pulse morphological changes due to heart rate and blood pressure factors have been widely studied and verified [4, 5, 20, 21]. The effect of emotional status on the tiny morphological changes in the pulse was also confirmed in a recent study [22]. Foo researched the PTT changes observed with different limb positions synchronously [14]. In his study, the PTT changes obtained with the arm raising or leg declining and a random selection of arm (the left or right arm) and a random selection of leg (the left or right leg) were adopted.
It was ignored and was taken for granted that the right arm had consistency with the left arm in PTT induced by arm movement. In this study, we collected arterial pulses simultaneously in both arms, making the comparison between the horizontal and the non-horizontal positions more accurate.
With either the left arm raising or the right arm raising, the trend in PTT changes due to the arm moving is fairly consistent with the results reported by Zheng and Murray [17]. With either the left arm declining or the right arm declining, the trend in PTT changes due to the arm moving is fairly consistent with the results reported by Zheng and Murray [17]. The right arm had consistency with the left arm in PTT induced by arm raising or declining.
Although both arm are consistent with PTT changes, there are little difference between them at each position. PTT changes with right arm raising were little big than that with left arm raising, while absolute value of PTT changes with right arm declining were little small than that with left arm declining. The reason of this may be the difference of physiological structure between both arm, may be the sensor error partly. The limitations of this study should be mentioned. First, the bilateral PTTs are not necessarily the same all the time. It is possible that the brachial arteries in the two arms have different stiffness in cardiovascular disease patients, which would cause different PTTs measurements in the two arms. However, in the current study, our cohort included healthy and relatively young subjects. Therefore, the prerequisite could be hold. The quantification of the potential effect of vascular disease on the PTT changes with the arm moving will take place in our future work.
In conclusion, this work has provided scientific evidence for the changes in the bilateral peripheral arterial property difference with the arm moving, which is an important step in using the bilateral arterial property difference as a simple non-invasive procedure for vascular health screening.
Acknowledgments
This research was sponsored by the National Natural Science Foundation of China (grants 61571113, 51075243 and 61201049), Key Research and Development Programs of Jiangsu Province (BE2017735), the Natural Science Foundation of Shandong Province in China (grant 2014ZRE2733), and the Fundamental Research Funds for the Central Universities in Southeast University (2242018k1G010). The authors thanks the support from the Southeast-Lenovo Wearable Heart-Sleep-Emotion Intelligent monitoring Lab.
Conflict of interest
None to report.
References
[1] | Glasser SP, Arnett DK, McVeigh GE, Finkelstein SM, Bank AJ, Morgan DJ, et al. Vascular compliance and cardiovascular disease: a risk factor or a marker? Am. J. Hypertens. (1997) ; 10: (10): 1175-89. |
[2] | Liu CY, Zheng DC, Murray A. Arteries stiffen with age, but can retain an ability to become more elastic with applied external cuff pressure. Medicine. (2015) ; 94: (41): e1831. |
[3] | Van der Heijden-Spek JJ, Staessen JA, Fagard RH, Hoeks AP, Boudier HA, Van Bortel LM. Effect of age on brachial artery wall properties differs from the aorta and is gender dependent: a population study. Hypertension. (2000) ; 35: (2): 637-42. |
[4] | Arnett DK, Boland LL, Evans GW, Riley W, Barnes R, Tyroler HA, et al. Hypertension and arterial stiffness: the Atherosclerosis Risk in Communities Study. ARIC Investigators. Am. J. Hypertens. (2000) ; 13: (4): 317-23. |
[5] | Liu CY, Zhao LN, Liu CC. Effects of blood pressure and sex on the change of wave reflection: Evidence from Gaussian fitting method for radial artery pressure waveform. Plose One. (2014) ; 9: (11): e112895. |
[6] | Liu CY, Zheng DC, Zhao LN, Li P, Li B, Murray A, et al. Elastic properties of peripheral arteries in heart failure patients in comparison with normal subjects. J. Physiol. Sci. (2013) ; 63: (3): 195-201. |
[7] | Liu CY, Zheng DC, Zhao LN, Liu CC. Gaussian fitting for carotid and radial artery pressure waveforms comparison between normal subjects and heart failure patients. Biomed. Mater. Eng. (2014) ; 24: (1): 271-77. |
[8] | Hong T, Liu CY. Changes of femoral photolethysmographic waveform characteristics in anesthetized dogs with increased blood pressure induced by epinephrine. Front Physiol. (2016) ; 7: : 404. |
[9] | Allen J, Oates CP, Lees TA, Murray A. Photoplethysmography detection of lower limb peripheral arterial occlusive disease: a comparison of pulse timing, amplitude and shape characteristics Physiol. Meas. (2005) ; 26: (5): 811-21. |
[10] | McVeigh GE, Hamilton PK, Morgan DR. Evaluation of mechanical arterial properties: clinical, experimental and therapeutic aspects. Clin. Sci. (2002) ; 102: (1): 51-67. |
[11] | Foo JY, Wilson SJ, Williams G, Harris MA, Coper D. Pulse transit time as a derived non-invasive mean to monitor arterial distensibility changes in children. J. Hum. Hypertens. (2005) ; 19: (9): 723-29. |
[12] | Pannier BM, Avolio AP, Hoek SA, Mancia G, Takazawa K. Methods and devices for measuring arterial compliance in humans. Am. J. Hypertens. (2002) ; 15: (8): 743-53. |
[13] | Allen J, Murray A. Age-related changes in peripheral pulse timing characteristics at the ears, fingers and toes. J. Hum. Hypertens. (2002) ; 16: (10): 711-17. |
[14] | Foo JY, Wilson SJ, Williams GR, Harris MA, Cooper DM. Pulse transit time changes observed with different limbs positions. Physiol. Meas. (2005) ; 26: (6): 1093-102. |
[15] | Netea RT, Bijlstra PJ, Lenders JW, Smits P, Thien T. Influence of the arm position on intra-arterial blood pressure measurement. Journal of Human Hypertension. (1998) ; 12: : 157-60. |
[16] | Suzuki J, Maeda J, Takemiya T. Analysis of microvascular responses in the finger to changes in arm position during cold water stimulation. The Japanese Journal of Physiology. (1994) ; 44: : 181-91. |
[17] | Zheng DC, Murray A. Non-invasive quantification of peripheral arterial volume distensibility and its non-linear relationship with arterial pressure. J. Biomechanics. (2009) ; 42: (8): 1032-37. |
[18] | Liu CY, Li Q, Clifford GD. Evaluation of the accuracy and noise response of an open-source pulse onset detection algorithm on pulsatile waveform databases. IEEE, (2017) . |
[19] | Zong W, Heldt T, Moody G, Mark R. An open-source algorithm to detect onset of arterial blood pressure pulses. Computing in Cardiology, (2003) . |
[20] | Safar ME, Levy BI, Struijker-Boudier H. Current perspectives on arterial stiffness and pulse pressure in hypertension and cardiovascular disease. Circulation. (2003) ; 107: (22): 2864-69. |
[21] | MacWilliams BA, Hoffman AH, Savilonis BJ. Variation of arterial compliance within the cardiac pressure pulse. J Biomech. (1998) ; 31: (9): 867-71. |
[22] | Li F, Yang LC, Shi HY, Liu CY. Differences in photoplethysmography morphological features and feature time series between two opposite emotions: Happiness and sadness. Artery Research. (2017) ; 18: : 7-13. |

