
Development and calibration of drum-based rolling resistance testing machine for manual wheelchair components
Abstract
BACKGROUND:
Manual wheelchair users are at a high risk of repetitive strain injuries, carpal tunnel syndrome, and rotator cuff tears due to propelling their wheelchair for mobility. Rolling resistance (RR) is one of the key forces that leads to increased propulsion forces and risk of injuries.
OBJECTIVE:
To better understand the factors contributing to RR, we iteratively designed, developed, and validated a drum-based testing machine and test method.
METHODS:
As part of the validation of the system, we tested and compared 4 manual wheelchair wheels under a range of conditions including camber, toe in/out, tire pressure, surfaces, and speed. A treadmill was employed to simulate flat ground RR.
RESULTS:
A machine was effectively designed, developed, and tested to measure RR. Tire type, surfaces, and toe were found to be the largest contributors to RR. Comparison of the drum-based system to flat ground revealed that an offset can be used to calculate overground RR from drum measurements.
CONCLUSIONS:
Ongoing work includes performing a comprehensive analysis of the degree to which each factor contributes to RR of commonly used casters and rear-wheels so that the wheelchair sector can work to reduce RR and the associated risk of repetitive strain injuries.
1.Introduction
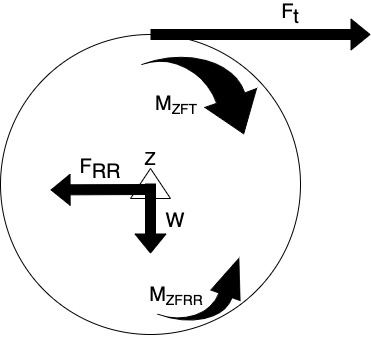
Manual wheelchair propulsion has been extensively studied in an effort to reduce the risk of repetitive strain injuries and pain of the upper extremities of manual wheelchair users (MWU) [1]. Rolling resistance (RR) of the tires and wheels rolling over a surface is one of the forces that MWU must overcome to propel their wheelchairs [2]. Energy loss that occurs due to the continuous compression and expansion at the contact between the tire and the ground is the main contributor to RR. This energy loss increases the required push-rim forces, which are associated with upper-extremity pain and injury such as carpal tunnel syndrome and rotator cuff injuries [3, 4, 5]. Figure 1 details the forces seen at the push rim, where the tangential force must be greater than the RR force to propel the manual wheelchair (MWC) forward by applying a rotational torque that overcomes the RR torque.
Figure 1.
Rolling Resistance Free body diagram where
The research focused on understanding contributing factors to MWU upper limb injury and pain resulted in a clinical practice guideline [6]. This guideline recommends reducing RR by the use of better bearings, larger diameter wheels, low wheelchair weight, and a forward axle position for adjustable wheelchairs [6]. Additionally, other studies show that increased loads are correlated to increased RR and decreased self-selected velocity [7, 8, 9, 10].
Although these are all rational and evidence-based recommendations, they do not provide the more complex insight that could be valuable. For example, the benefits or drawbacks of using different types of wheels and tires over different types of terrains; the relative impact of RR based on the setup of the device (camber and rear axle position) compared to the impact of RR due to changes that may occur after the user receives their wheelchair, such as tire deflation or wheel misalignment. The lack of detailed recommendations on the factors influencing RR and approaches to mitigate them is due to the scope and type of data on wheelchair wheel RR.
In order to assess what the industry has already accomplished on this topic, a scoping literature review was conducted through database searches and articles recommended by colleagues. Results of the scoping review identified the range of existing test methods used to measure RR in manual wheelchairs. Seven test method categories were identified including deceleration, motor draw, treadmill, physiological expenditures, drag, ergometer/dynamometer, and a robotic test rig [11]. Only two of the test methods (treadmill and drag) are considered a direct measurement of RR forces [12, 13]. The remainder measure a proxy measurement to calculate the resistive forces, which can be less accurate and the results are more challenging to interpret. Additionally, all of the identified testing methods were applied to an entire wheelchair rather than individual wheels or tires. Because of this, it is difficult to discern the influence of individual factors (e.g. tire pressure, tire type, load) which are needed to understand their influence and guide stakeholders on how to reduce RR. The methods were also evaluated against their ability to test RR on multiple surfaces. Measurement methods such as the dynamometer or treadmill do not easily provide the ability to attach surfaces to a small drum. While the other methods have the ability to test multiple surfaces, only the drag test was a direct measurement; but all methods were system-level testing [12, 13, 14, 15, 16]. Ultimately, no method was able to meet the needs to complete comprehensive testing to provide insight into the mitigation of RR.
Figure 2.
Toe Free Body Diagram,
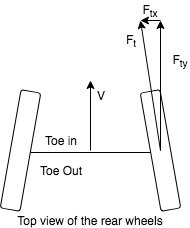
Table 1
Design and performace specifications
| Rear-wheels | |||
|---|---|---|---|
| Factor | Range | Increment | Justification |
| Camber | 0 to 5 degrees | 1 degree | User preference where most devices do not allow more than 5 degrees. |
| Load | 0 to 150 lbs. | 20 lbs. | 75 lbs. represents the load on one wheel with a 60/40 distribution of 250 lbs. |
| Toe In/Out | 0.5 degree | Field data suggest that less than 2 degrees are commonly found. | |
| Speed | Up to 1 m/s | 0.5 m/s | Common propulsion speed is 1 m/s |
| Tire Pressure | Up to 100% of max | 20% of max | Smaller interval than previous tire pressure studies |
| Surfaces | Carpet to start | Level of pile | Common heights of commercial-grade carpet. |
| Tire Type | 6–24” rear-wheels varied by type | 1 wheel | Recommended by industry experts |
| Casters | |||
| Factor | Range | Increment | Justification |
| Load | Up to 100 lbs. | 10 lbs. | 50 lbs. represents the load on one caster with a 60/40 distribution of 250 lbs. |
| Speed | Up to 1 m/s | 0.5 m/s | Common propulsion speed is 1 m/s |
| Tire Pressure | Up to 100% of max | 20% of max | If applicable, some pneumatic casters on the market |
| Surfaces | Carpet to start | Level of pile | Common heights of commercial-grade carpet. |
| Caster Type | 6 casters varied by type | 1 caster | Recommended by industry experts |
The scoping literature review was also able to identify the factors tested with the various test methods. Eight testing factors were identified including camber, toe, tires, tire pressure, casters, increased mass, load distribution, and surfaces. Toe and tire selection were found to be the highest influencers on RR, where small degrees of toe can drastically increase RR. Pnuematic tires were found to be more efficient than solid or airless insert tires. Surfaces came in third with carpet having a high RR than tile ans smooth concrete, followed by tire pressure which is inversely related to RR. The overall weight and load distribution had varying results on their level of influence due to differneces in the studies conducted. Camber was found to not be influential with one study contradicting the consensus. Toe is defined as the misalignment of the rear-wheels where toe in has the front of the wheels closer together than the rear. Toe out is the inverse, but both are demonstrated in Fig. 2. Casters can vary due to material, design, and sizes making it difficult to discern their impact. It is understood that some factors are more influential than others, but without standardized testing and reporting, it is difficult to understand the exact effect of each factor [11]. Furthermore, without the testing at a component level, the direct impact of one factor is challenging to accurately measure [2, 12, 13, 14, 15, 16, 17].
While some methods had capabilities to evaluate surfaces or other factors, not one system was able to measure RR across all factors and at a component level. Therefore, a new approach needed to be implemented to ensure the goals were met. After a thorough review, a drum-based approach provided the desired outcome, which is what the tire industry uses to measure RR [18]. The drum-based method is employed with an axle transducer to measure the forces. However, passenger car tires can have a larger diameter and most often a larger width than wheelchair tires. Therefore, more forces are experienced during their testing. It was a concern that it would be difficult to detect the smaller forces seen in wheelchair wheels if the same measurement style was employed. The drum used for passenger care tire testing was a 5.6-foot diameter drum, in which it was assumed there was a negligible difference between the curvature of the drum and the flat ground [18]. The difference can be calculated by a formula establishing the relationship of the contact patches on a curved surface versus a flat surface [19]. The goal of this project was to address these limitations by developing and validating a drum-based RR test equipment and a test method for wheelchair wheels based on the gold standard test method used to measure RR of tires for passenger cars and trucks [20]. Additionally, some preliminary results, to include sensitivity testing, are also reported.
Table 2
Overground comparison
| Rear-wheels | |||
|---|---|---|---|
| Factor | Range | Increment | Justification |
| Load | 55 to 95 lbs. | 20 lbs. | 75 lbs. represents the load on one wheel with a 60/40 distribution of 250 lbs. |
| Toe in | 1 degree | A subset of the full scale | |
| Tire type | 4 rear-wheels | 1 wheel | From a selection of 6 wheels based on clinical recommendations. |
| Casters | |||
| Factor | Range | Increment | Justification |
| Caster type | 3 casters | 1 caster | A selection of 3 wheels based on clinical recommendations. |
| Load | 40 to 60 lbs. | 10 lbs. | 50 lbs. represents the load on one caster with a 60/40 distribution of 250 lbs. |
Table 3
Sensitivity levels
| Rear-wheels | ||||
|---|---|---|---|---|
| Factor | Goal | Test range | Test increment | Justification |
| Load | 10 lbs. | 65 to 75 lbs. | 1 lb. | 75 lbs. represents the load on one wheel with a 60/40 distribution of 250 lbs. |
| Toe in/out | 0.5 degree | 0.25 degree | Toe is more influential farther from 0, testing around 0 gives the hardest scenario to determine sensitivity. | |
| Tire pressure | 20% of max | 60 to 90 psi | 5 psi | Smaller interval than previous tire pressure studies and max inflation was 75 psi. |
2.Methods
We performed a multi-stage, iterative design process to ensure that the final test method was robust and valid. The following stages were completed, and the methods are described in detail below: Ideation (Stage 1), Design Iteration (Stage 2), Final Design (Stage 3), and Characterization of the System (Stage 4).
In the Ideation Stage (1), we established a core design team of subject matter experts and convened a series of brainstorming sessions. These sessions were informed from the past experience of the members of the design team as well as previous relevant literature that was shared among the team. The results of these brainstorming sessions included sketches of the proposed test equipment as well as the design and performance specifications shown in Table 1. The previous test methods were reviewed, evaluated, and ranked based on effectiveness to meet the following goals:
• To measure the RR force with a repeatability of 10% as measured on the reference trials.
• To test the factors of load, toe, tire pressure, surfaces, casters, camber, speed, tire type at community-relevant levels detailed in Table 1 and sensitivity levels outlined in Table 3.
• To test the factors independently and combined at a component level.
Ultimately, no previous method met all of the aforementioned goals, therefore a new testing method needed to be developed.
In the Design Iteration Stage (2) one of the individuals from the core design team led the component-level design of the system using Solidworks. Weekly meetings were held to review the design progress until a final design was established. A prototype was then built and preliminary testing was performed to evaluate whether design and performance specifications were met. The deisgn is based on the gold standard test method from the passenger car truck tire testing.
In the Final Design Stage (3), the lead designer refined the design based on the preliminary testing of the prototype. Similar to Stage 2, weekly meetings were held to review component-level and system-level designs until the design was finalized and fixed. Fabrication of the system was then performed using in-house prototyping equipment, as well as contracted services for parts that required high-precision manufacturing.
Table 4
Tires for testing
| Tire types | |
|---|---|
| HPS | High-Pressure tire on Standard lite spoke Dimensions: 24” diameter and 1” width Maximum air pressure 145 psi |
| AIS | Airless Insert in a low-pressure tire on a Standard lite spoke Dimensions: 24” diameter and 1.375” width |
| KLS | Knobby Low-Pressure tire on Standard lite spoke Dimensions: 24” diameter and 1.375” width, knobby tire, Maximum air pressure 65 psi |
| SPM | Solid Polyurethane tire on a Mag style wheel Dimensions: 24” diameter and 1” width |
| LPS | Low-Pressure tire on Standard lite spoke Dimensions: 24” diameter and 1.375” width Maximum air pressure 75 psi |
Table 5
Caster types
| Caster types | |
|---|---|
| 4PO | Four by One Poly Dimensions: 4” diameter with 1” width, polyurethane on aluminum hub |
| 5SR | Five by One and a half Softroll Dimensions: 5” diameter and 1.5” width, polyurethane on aluminum hub |
| 8PO | Eight by One Poly Dimensions: 8” diameter and 1” width, polyurethane, rounded profile, on a plastic hub |
In the Characterization of the System (Stage 4), a systematic approach was used to test the repeatability and sensitivity of the system across all of the factors that could be compared, including load, camber, toe in/out, tire pressure, and tire-type. External validity was performed by comparing drum-based RR measurements to those collected on a treadmill (simulating overground rolling) under the following conditions detailed in Table 2. The drum-based machine was operated with the same treadmill belt material placed on it. Due to the vinyl backing of the belt and the powder coating of the drum, rug anti-slip tape had to be applied to the drum to keep the treadmill belt material from moving under toe factor testing. Additionally, 1” binder clips were used to secure the belt to the drum.
The four rear-wheels tested, as seen in Table 4, are the high pressure on a standard wheel (HPS), low pressure with airless insert (AIS), knobby tire (KLS), and solid poly mag (SPM). Additionally, the three casters tested, as seen in Table 5, are the 4” diameter poly (4PO), 5” diameter softroll (5SR), and 8” diameter poly (8PO). The setup of the testing will follow these following general steps:
1. The parallel rods are aligned co-linear to the belt of the treadmill.
2. An initial zeroing testing is run to evaluate RR forces from
3. The nominal load is it is set at 75 pounds for a rear-wheel and 50 pounds for a caster, respectfully.
4. All testing is run at 1 m/s.
5. Factors will be changed based on Table 2 above.
The testing procedure began with rear-wheels in the order they are listed in Table 4 and following the testing order of factors as listed in Table 2. After the rear-wheels were tested, the testing order for casters was followed as listed in Table 5 and the factors listed in Table 2. For each condition, three trials were run and the average was taken.
To determine the precise offset between the drum and overground measurements, an only main-effects ANOVA model was built with RR force of the overground treadmill as the dependent variable (DV), RR force of the drum as a covariate, and load, toe, and tire type as factors. The results were significant (
Sensitivity was performed for load, toe, and tire pressure factors Outlined in Table 3. Load was tested in 1 pound increments over an 11-pound range of 65 to 75 pounds. Toe was tested in 0.25-degree increments from
Table 6
Machine comparisons
| Comparison of LeTourneau machine to pitt machine | ||
|---|---|---|
| Unmet goal | Weakness | Corrective action |
| Efficient design | Overall size | Redesigned to have a smaller footprint |
| Repeatability | Mass for vibration dampening | Frame tubing diameter increased |
| Repeatability | Drum deviations | Increased thickness, turned, and balanced |
| Repeatability | Friction in the measurement system | Air bushings replaced roller bearings |
| Repeatability | Continuous measurement for toe and camber | Moved to preselected levels |
As part of the characterization and external validity steps, preliminary evaluation of RR on four 24” wheel/tire combinations (Table 4) and 1 caster (Table 5) was also performed and the results compared to previously published data to confirm the results were consistent with previous RR research. Three tires were all on the same spoked wheel with two pneumatic tires (HPS, LPS) and one airless insert (AIS). The fourth tire was a solid polyurethane on a mag wheel (SPM). As expected, the pneumatic tires had a lower RR than the airless insert or solid tires with the solid insert tire having a higher RR than the solid tire. A tire pressure test was also conducted with two pneumatic tires at 40, 70, and 100% of max inflation pressure. Lines of best fit were applied to the graphical representations of each factor. Summary statistics were used to compare the data across factors as well as to previously reported results.
3.Results
3.1Stage 1: Ideation
The design team was a subcommittee of The International Society of Wheelchair Professionals Standards Working Group (ISWP-SWG) which was sponsored by a grant through the University of Pittsburgh by the U.S. Agency for International Development to strengthen wheelchair product standards. Norm Reese of LeTourneau University led the design team which includes Jon Pearlman (Pitt), Matt McCambridge (MIT), and Anand Mhatre (Pitt). The team reviewed previous testing methods and tested factors to understand the needs of the newly developing test method.
3.2Stage 2: Design iteration
The drum-based system is shown in Fig. 3 and includes a lower frame to house the drum, and an upper frame that supports the arm assembly where the wheels are attached, and the force sensing system is located. The drum-based method provides the ability to test every factor identified in previous literature, as well as, test on a component level. It has the adjustability to test a variety of wheels and tires and has an adjustment for toe and camber testing. Furthermore, the loading of the tire can be adjusted, and surfaces can be added to the drum. Although the first prototype met all of the design specifications, the repeatability and sensitivity of the system did not meet the performance specifications. The shortcomings were identified, and the design of a revised drum-based method was developed.
Figure 3.
RR testing machine at LeTourneau University (1) Lower frame, (2) Drum, (3) Upper frame, (4) Arm assembly.
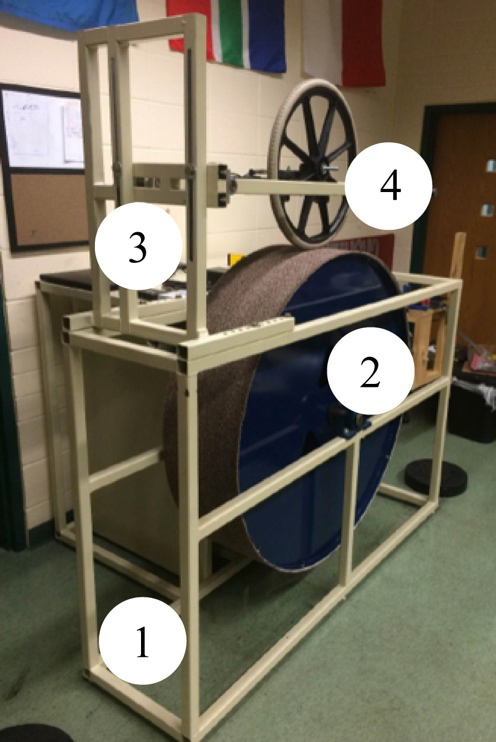
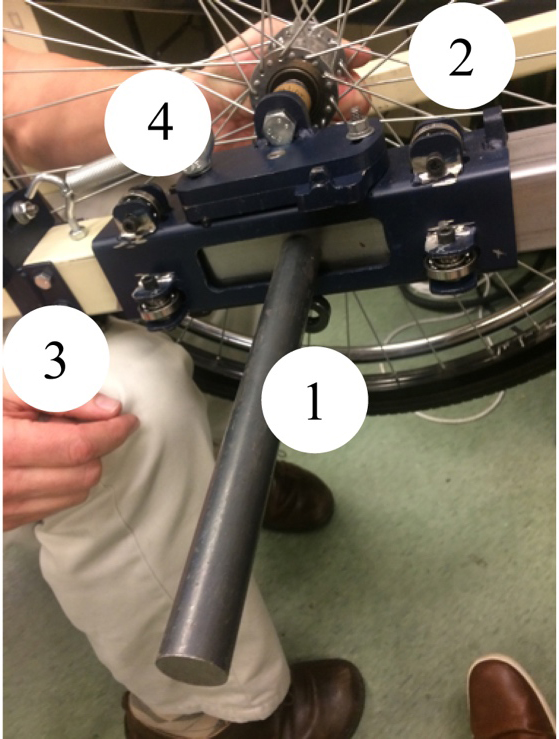
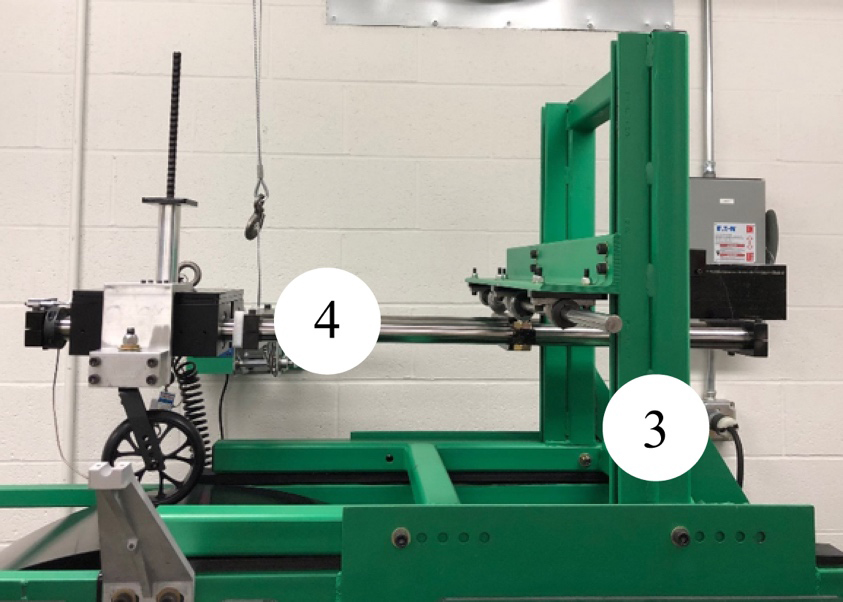
Figure 4.
Truck of LeTourneau machine (1) Weight bar, (2) Roller bearings, (3) Camber adjustment, (4) Toe adjustment.
3.3Stage 3: Final design
The goal of the second machine was to address the shortcomings of that device and Table 6 shows a detailed comparison, which largely focuses on the lack of repeatability in this design. Figure 4. Additionally, the measurement of toe and camber were changed to incremental to increase repeatability of the factor level. The new system was increased to 240 VAC with a 3-phase motor, prompting a complete redesign of all the electrical components. The data collection system was also redesigned but uses similar components. Lastly, the loading system and factor adjustment setups were required to be all newly developed after the numerous design changes.
The second RR test apparatus can be broken down into four modular components: (1) lower frame, (2) drum and drive system, (3) upper frame and arm assembly, (4) data collection. These four components work together and in conjunction with a computer to collect the RR force of the tested component through the selected factor(s).
Figure 5.
Lower frame assembly with the steel drum. (1) Lower frame, (2) Drum.
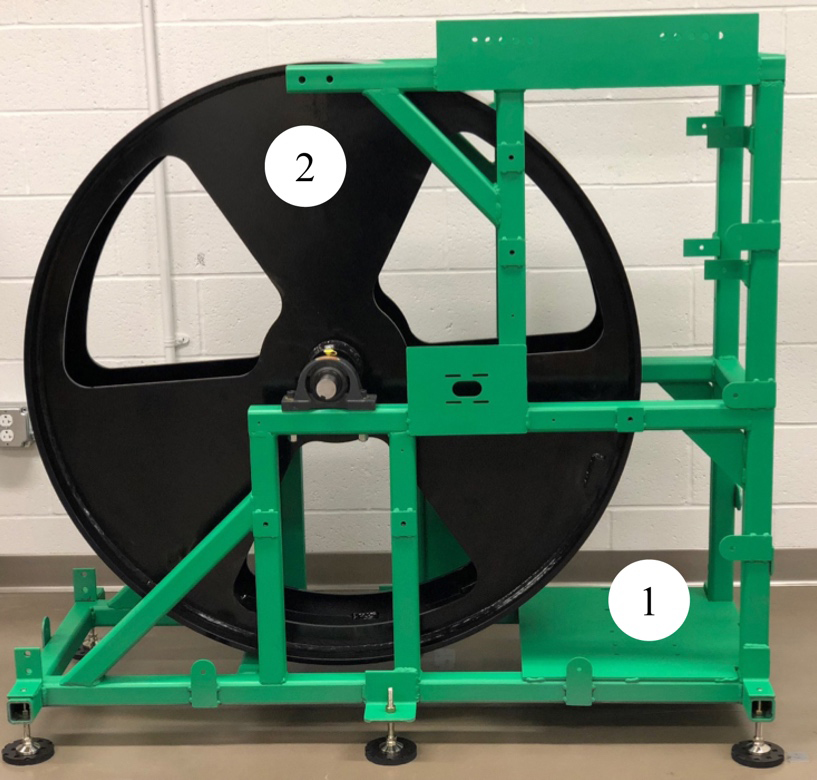
To ensure horizontal stiffness as well as vibration dampening, the majority of the frame has been constructed from 2” steel tube. The drum assembly consists of a 48” OD drum with a
One unspecified goal of the second machine was to compact the design and make it more space-efficient by embedding the motor footprint as the drum instead of behind it. The mass of the frame was increased with larger diameter tubing and thicker walls to absorb vibrations that can affect the load cell and increase stiffness. The drum was made with thicker materials to increase lateral stiffness, it was turned for a precise outer diameter, and it was spin balanced to reduce any variance from the drum. The arm assembly was redesigned with the incorporation of frictionless air bushings instead of roller bearings that were inducing friction in the system.
3.3.1Arm assembly
The main components of the arm assembly, as shown in Fig. 6, are two 1.5” diameter x 48” precision linear shafts from Thomson Linear (part number 1 1/2 L TU CTL) [21]. On the parallel shafts is a quad setup of four 1.5” air bushings (part number S303801) and mounting blocks from Newway (part number S8038P02) [22]. On top of the air bushing blocks are two plates that have a pivot point allowing for the top plate to swivel to
Figure 6.
Upper frame and arm assembly. (3) Upper frame, (4) Arm assembly.
3.3.2Control and power
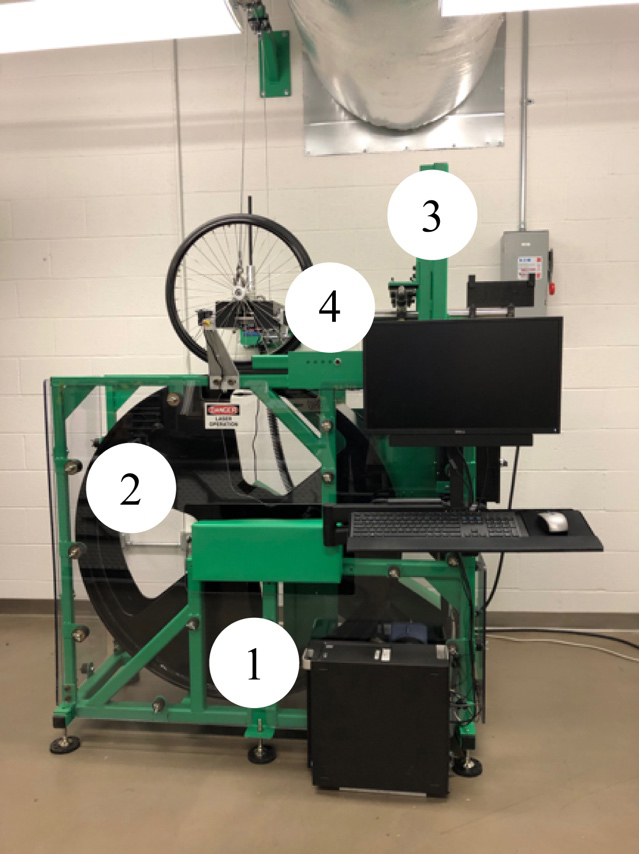
At the front end of the arm, a load cell from Interface (part number MB-25) is mounted horizontally [23]. That signal is read into a computer through a National Instruments Data Acquisition Card (model number NI-9201) and chassis (NI-9171) [24]. MATLAB runs a code to read the DAC, process the data, and export it to an excel file [25]. For safety, the machine is completely controlled by the computer connected to it. A test protocol was developed to describe the proper order of operations to ensure consistent reliable testing procedures. The system is adjusted to the appropriate configuration based on the desired factors to be tested. Next, the arm is leveled in both axes. A lifting hook with an inline load cell is used to measure the weight of the arm and wheel combination, which determines the normal force acting on the tire from the drum. Once the factors are set, the testing code is run. The MATLAB code prompts the tester for input factors, to turn on the air supply, and start the drum [25]. Voltage data is collected through the DAC for two minutes. After that, a moving average filter is applied to the data and truncates to the center sixty seconds to eliminate variances during startup or slow down. Based on the loading equation of the load cell, the voltages are converted into force pounds. All of the data is then exported in a .xslx format. Figure 7 shows the completed system.
Figure 7.
Completed second prototype. (1) Lower frame, (2) Drum, (3) Upper frame, (4) Arm assembly.
3.4Stage 4: Characterization of the system
3.4.1Machine calibration
Prior to data collection, it was necessary to identify a proper sampling frequency for the load cell. To begin, testing was done at 1000 Hz and a Fast Fourier Transform (FFT) was performed, which resulted in no significant peaks over 20 Hz with the exception of one at 60 Hz. The 60 Hz peak was assumed to be electrical interference. Finally, a sampling frequency of 150 Hz was selected because it ensured the capture of any cyclic anomalies in the system from the tire as well as the actual force signal. The load cell loading performance yielded a positive linear relationship between force (weight applied) and voltage, which resulted in an
3.4.2Drum versus overground external validity
To enhance the characterization of the drum-based testing, a relationship to overground measures was determined through the use of an instrumented treadmill along with the upper frame and arm assembly from the drum-based machine (Fig. 8). The results show similar trends in a proportional offset between the two testing methods.
Figure 8.
Treadmill testing with the upper frame and arm assembly.
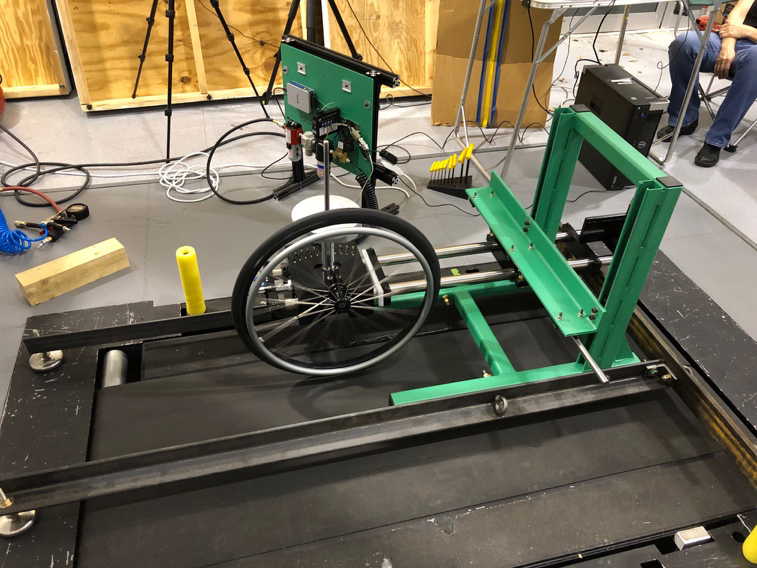
Figure 9 shows the details with all of the drum trials having a higher RR than the treadmill counterpart assorted by tire type. This provides validation to the data collection system that it can be adjusted to closer represent real-world scenarios by converting a drum result to a flat ground result. While it does not take include every possible real-world influencer, it is a closer approximation than the drum results alone.
Table 7
Coefficients for rear-wheels
| Factor | Coefficient |
|---|---|
|
| |
| 0 | |
| 0.084 | |
| 0.050 | |
| 0 | |
| 0.4 | |
| 0 | |
| 0.917 |
Figure 9.
Treadmill compared to drum testing.
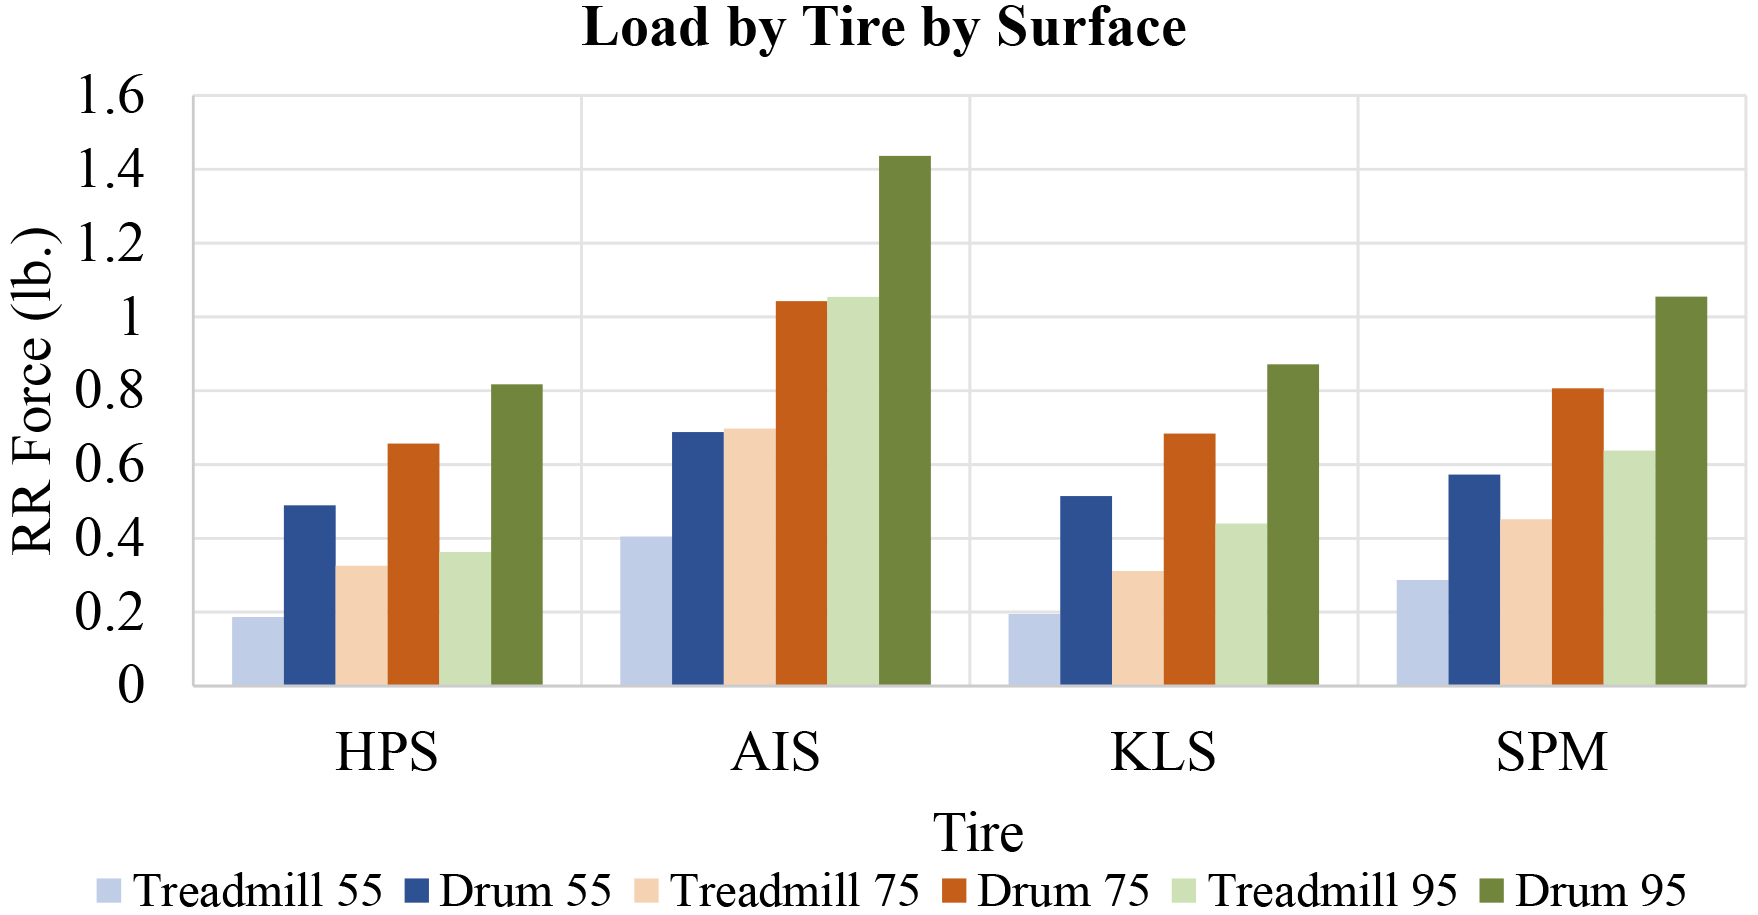
Figure 10.
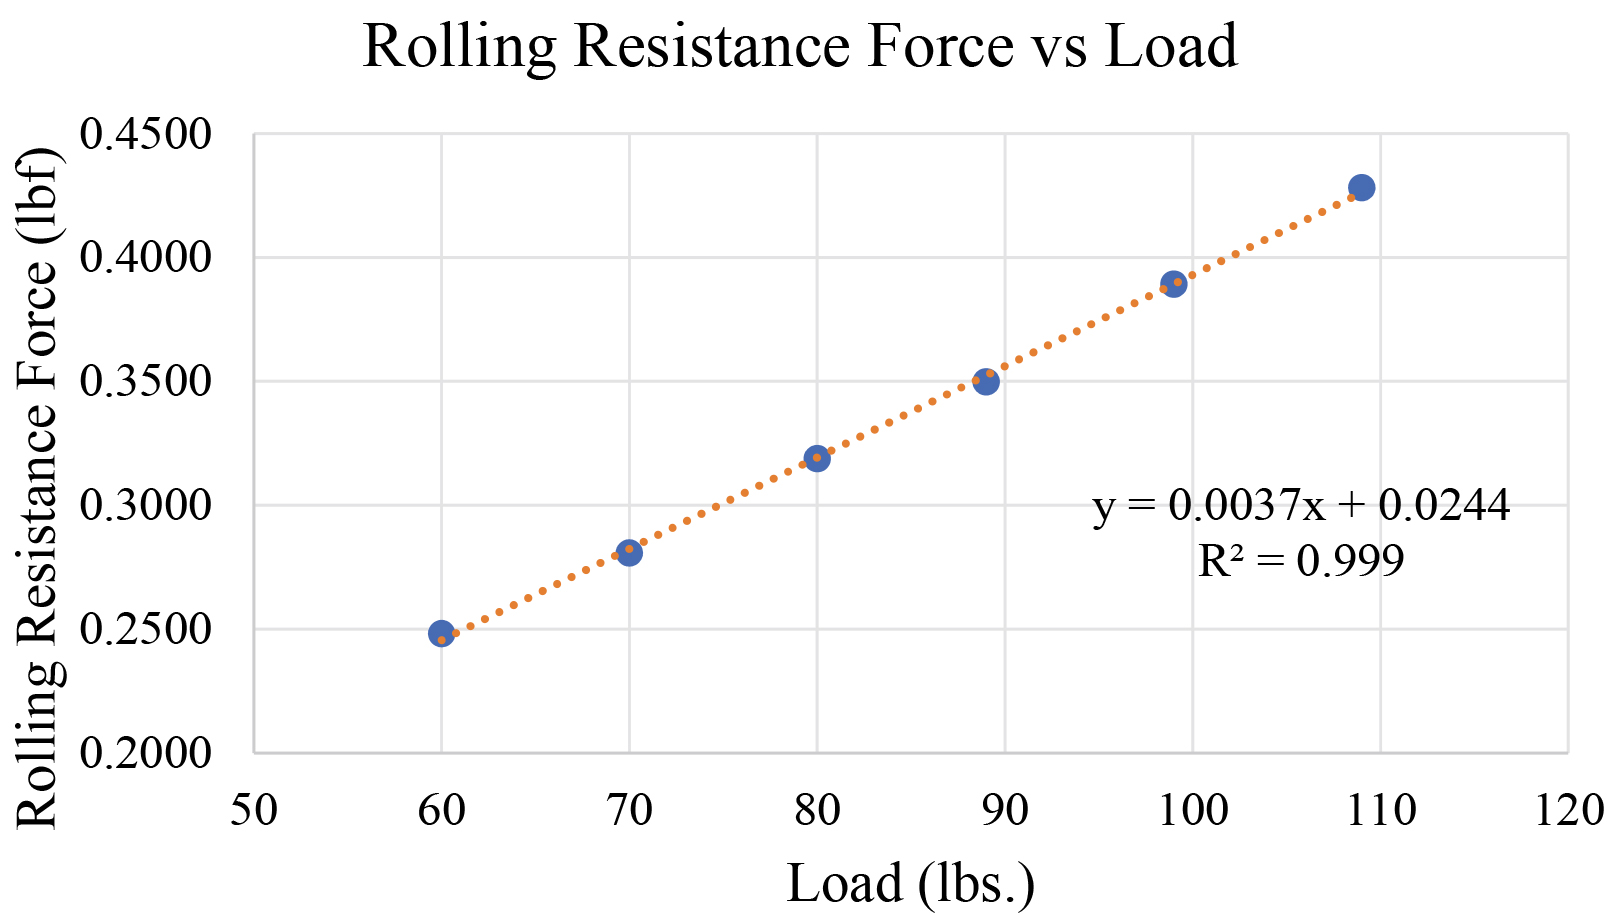
RR Force versus load with a trendline.
The results from the statistical analysis are displayed in Table 7 along with the results for the coefficients. To convert results from the drum to overground, the following formula would be used:
For example, the HPS tire run at a 75-pound load, 1 degree of toe would be
The same formula would be applied for casters with the substitution of the correct coefficients displayed in Table 8. This information could be used to build a system model of RR and provide values based on factors and overground measurements.
Table 8
Coefficients for casters
| Factor | Coefficient |
|---|---|
|
| 0.907 |
| 0 | |
| 0.174 | |
| 0 | |
3.4.3Sensitivity testing
The load was tested to see if the machine was properly detecting changes since the load is proportional to the reaction force and has a positive linear relationship to load as seen in Fig. 10. The results of this test revealed a linear relationship with an
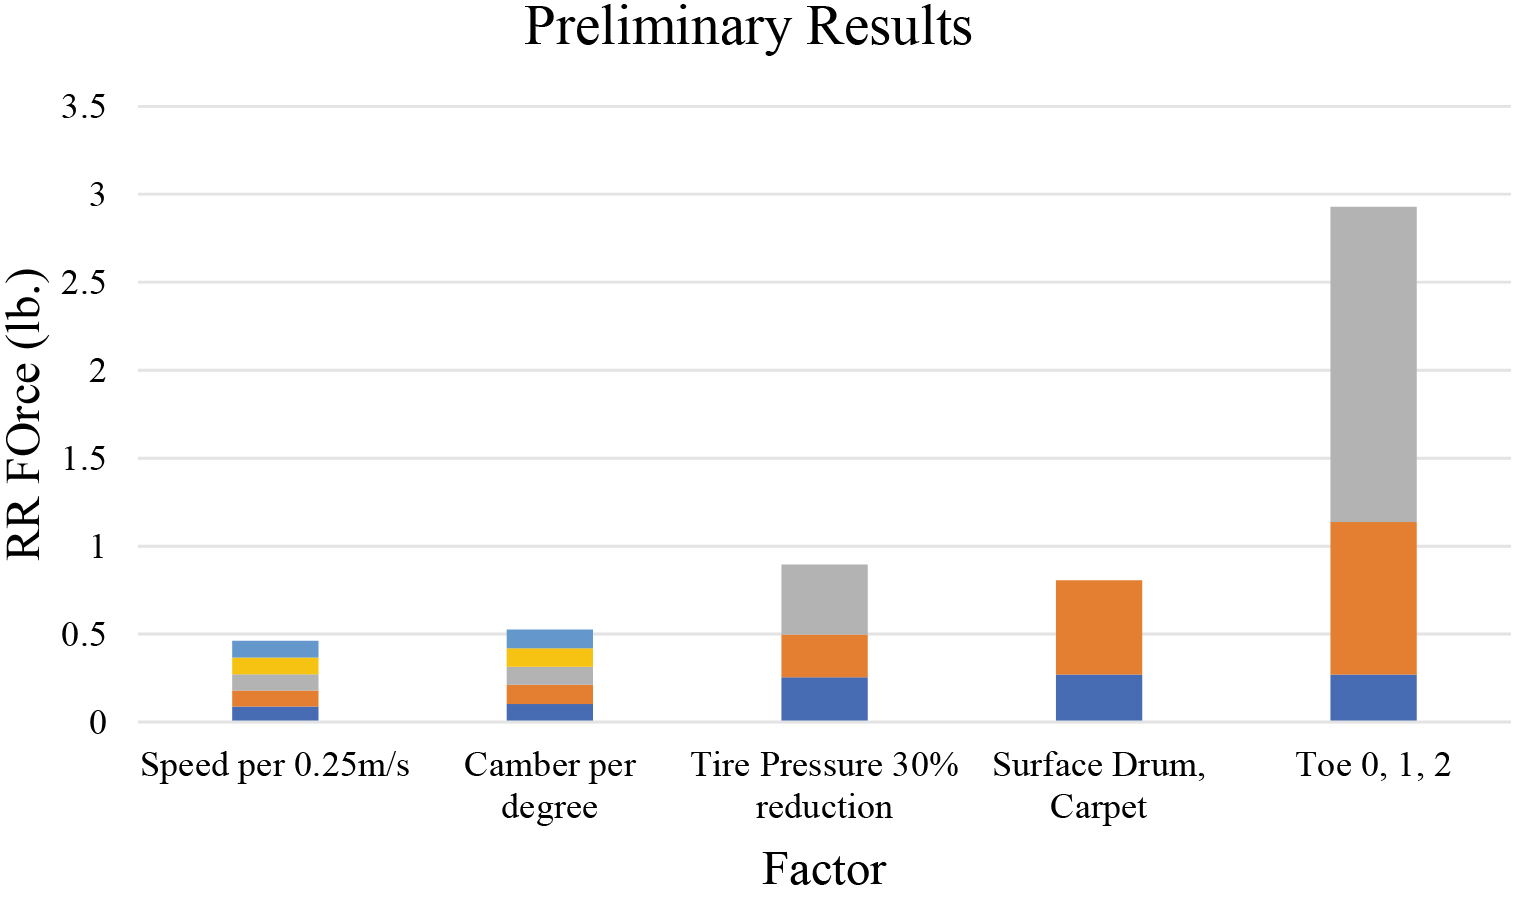
Figure 11.
Preliminary Results of LPS Tire. Speed is shown from 0.25 to 1.25 m/s in 0.25 m/s intervals. Camber is shown from 1 to 5 degrees in one degree increments. Tire pressure is shown from 100 to 70 to 40%. Surface is shown as drum then carpet. Toe is shown as 0, 1, then 2 degrees.
3.5Preliminary results
Camber was tested with camber blocks that were machined from 0 to 5-degrees in 1-degree increments. The results were inconclusive and did not show a relationship between camber and RR. Speed was also tested at 0.25 m/s increments from 0.25 to 1.25 m/s. There is a very minor increase in RR as speed increases. The medium-pile carpet showed a 21–174% increase in RR and varied greatly based on tire type. Pneumatic tires showed a higher increase as compared to the airless insert or solid tires with airless insert being the least affected. A decrease in 60% inflation can have an increase of 43–53% of RR. This shows that tire pressure and RR have an inverse nonlinear relationship. Toe was also found to have a non-linear relationship to RR with Fig. 11 showing the results for the LPS tire. It demonstrates the relative influence of each factor and its correspsonding intervals. Toe and surface can have a large impact where camber and speed are not as influential.
4.Discussion
RR is a complex topic that can be affected by many environmental and design factors that all have a biomechanical impact on manual wheelchair users which are associated with injuries. RR should be minimized by the optimization of design factors to reduce the risk of upper extremity pain and injuries. The newly developed drum-based RR testing machine allows for a comprehensive understanding of how RR is influenced by different factors through independent and combined factors testing. The system provides a direct measurement of RR rather than a proxy measurement. Component-level testing provides insight not previously researched, with all of the previous testing methods testing a whole wheelchair. Overall, the machine met the required design criteria set forth by the ISWP-SWG and is functioning well. The operation is standardized with a detailed protocol to ensure repeatability in the results.
When a pneumatic rear-wheel was tested against increasing loads, the relationship was linear and proportional at any weight, which continues to valid a previously established relationship [26]. The sensitivity of the system to detecting RR changes with weight changes was 7.0 lbs. That is a relatively small change in the load of RR compared to a change in user weight or weight on a wheel/caster due to a change in rear axle position, allowing researchers to measure the benefits/drawbacks of changes in setup and other factors that influence weight (e.g. body weight, backpacks, the weight of the wheelchair). The machine is accurate enough to discern the changes in force at small loads and the change maintains its relationship proportionally to load. This partially validates the results. Furthermore, the results show a strong
The toe testing provided some new insights that have not previously been reported. The two pneumatic tires had the lowest RR across all three toe-out settings. Surprisingly the airless insert had a higher RR than the mag wheel across all three setups. RR increased in tires at a rate of 171% for the HPS, 223% for the LPS, 52% for the AIS, and 77% for the SPM at 1
Tire pressure testing was conducted with the HPS and LPS tires. As expected, RR increases as tire pressure decreases, but not linearly. The increase was less than 10% for both tires from 100% inflation to 70% inflation and increased to 32% for the HPS and 61% for the LPS from 70% to 40% inflation. The results show that even a severely underinflated pneumatic tire has a lower RR than the airless insert or solid polyurethane tire. These results are similar to other RR studies. Sawatsky and Dension showed an 8% increase in RR with a 50% decrease in tire pressure [16]. Lin et al. showed a 10% increase at a 25% reduction in pressure [29]. While the percentages vary slightly, the amount of force on one tire is only a portion of the RR of the system. Furthermore, the forces measured are under 1 pound of force and the percentages are of very small forces. Last, the test setup factors and tire selection could cause the minute variances across different studies.
Only a medium-pile level loop carpet was tested in this study. All four tires showed an increase in RR as compared to the drum surface. The pneumatic tires showed the largest increases of 175% for the HPS and 100% for the LPS. The higher pressure tire (HPS) had a lower overall RR but was more susceptible to change in surfaces than a standard tire (LPS). The airless insert had an increase of 22% and the mag had an increase of 38%. The pneumatic tires are more susceptible to the change in surface but even on carpet still have a lower RR than the non-pneumatic. Sauret found the same increase when comparing carpet to concrete [30]. Two studies found the carpet to have over twice as high RR as compared to a smooth surface [31, 32]. This was correlated to a decrease in self-selected velocity and an increase in push-rim forces [8]. With the difference in carpet styles and materials, as well as the testing factors, it is difficult to determine how the studies directly compare.
Similar to the rear-wheel load testing, casters had a linear relationship. These results confirmed that the machine is able to test casters at a lower weight range than what was applied to the rear-wheels. Furthermore, it emphasizes that the machine is accurately measuring RR forces because the trendline has a high
Camber is not a strong influencer at small increments because it rotates the loading profile on the tire, which is not altering the contact patch in a significant way. These results are consistent with prior literature that are tested in a different manner [12, 28]. This may be different at a higher level of camber seen in the adaptive sports community. Also, the test was conducted on a pneumatic tire, whereas a solid tire may yield a different result. Speed yields very similar results. The increase in speed was not influential and the variation was less than 0.01 lbs.
As seen through some of the testing, the tire type is can have a significant effect on the RR. While not every factor has been tested, multiple tires, toe, tire pressure, and surfaces do show significant differences that were consistent with prior work. Pneumatic tires are across the board lower in RR than non-pneumatic. At 0
HPS results were examined across the factors to compare the influence of each factor respectively. The load is a constant linear trend and each tire will behave linearly. It is not something comparable since it is the baseline. Toe was found to have the largest impact on RR at 222–566% for 1
Overall, the machine was able to detect changes in all of the factors which were defined in the design goals. Additionally, the results show high repeatability through a randomized testing order, in which the error bars are very small at one standard deviation. Further statistical analysis is needed to confirm this for all of the factors. With an additional exploration of the factors, clinical recommendations can be made to inform clinicians, MWUs, service providers, and manufacturers of the effects of RR. From there, clinical practices can be updated to mitigate RR through setup and device maintenance. Therefore, a MWU would be at a lower risk for UE RSI and improved long-term MWU use.
5.Limitations
Although we took a comprehensive and iterative approach to designing and fabricating the system, there are always trade-offs that result in limitations to the types and accuracy of the measurements. Most notably is that the system measures RR when tires are contacting a round surface (the drum) compared to flat ground, which introduces a bias in the results. We have largely addressed this by developing a calibration to convert to overground RR, but this calibration may not be accurate for all scenarios, especially when testing multiple factors simultaneously (low pressure, on carpet, with toe). Fortunately, the calibration can be improved by repeating the approach we reported in this study, with the same setup factors on a treadmill. Operationally, the system requires a relatively small footprint (especially compared to coast-down test methods), but some of the setup procedures can be difficult and require two people– for example, shifting from caster to rear-wheel testing. Although the design and manufacturing of the machine were very purposeful, there is always room for error. Tolerances in machining can add friction or misalignment to the system. A significant effort was made to mitigate any instances of this occurring. The load cell presents a source of error since the signal is amplified into the DAC; however, the load equation for the load cell was found with this in place and it is consistent for all measurements. Protocols have been established that the machine is adjusted and run in the same manner every time to limit any operational errors. There are limitations to the range within each factor than can be tested but the system was designed to replicate common instances in the field of average manual wheelchair users. The machine has some difficulties to adjust to different sized casters and wheels. The Arm Assembly is heavy and requires two people to adjust properly, but that has been mitigated with the use of a jack so one person can run the system independently. Lastly, drum-based testing is constrained in surface testing to only those that can be attached to a drum. Irregular or soft surfaces are not easily placed on a drum, however, the impact of some indoor surfaces can be identified.
6.Ongoing and future work
The natural progression of this project leads to further testing. With every testable factor comes a list of possible studies to conduct. Initially, testing will be conducted on the strongest influencers. Furthermore, a comprehensive study is planned to explore all of the factors through 6 wheels and 6 casters and even the combinations of two factors. This is the information necessary to provide to the clinicians, manufacturers, and end-users about the impact of products and setup factors. One area for future study is the effects of temperature on RR. A pneumatic tire would increase inflation pressure as it warms up. It would be interesting to see the effect temperature has on RR because tires would generate heat as they are used. Lastly, a series of studies will be done to assess the prevalence of factors found to be most influential. Influential factors need to be evaluated with interventions in the community and eventually standards to combat the issues. Toe and bearing and axle slop in users’ devices may be substantial contributors to RR, but their prevalence has not been examined in the community.
A measurement system and protocol were developed to complete the study. Future tests will also include randomized testing order with an integrated standard trial mixed in. The standard trial is to be considered the baseline test with no factor adjustments.
The end goal is to be able to understand the effects of every factor at a component level. If all of the factors are appropriately characterized, a model can be constructed which demonstrates how each factor will change the propulsion of the manual wheelchair at a system level. After future testing, the results can be provided to clinicians, manufacturers, and end-users on how to mitigate RR and the best options for manual wheelchair users. An online tool could be created that shows the impact of RR as factors are changed. This would be useful for all stakeholders.
Author contributions
CONCEPTION: Joseph Ott, M. Mendel Marcus, Travis Henderson, Holly Wilson-Jene, London Lee and Jonathan Pearlman
PERFORMANCE OF WORK: Joseph Ott, M. Mendel Marcus, Travis Henderson, Holly Wilson-Jene, London Lee and Jonathan Pearlman
INTERPRETATION OF ANALYSIS OF DATA: Joseph Ott, Holly Wilson-Jene and Jonathan Pearlman
PREPARATION OF THE MANUSCRIPT: Joseph Ott and Jonathan Pearlman
REVISION FOR IMPORTANT INTELLECTUAL CONTENT: Joseph Ott and Jonathan Pearlman
SUPERVISION: Joseph Ott and Jonathan Pearlman
Ethical considerations
This study, as a document of the design and development of non-human subject testing equipment, is exempt from Institutional Review Board approval.
Acknowledgments
A sincere thank you to the ISWP-SWG for their continued support of this research and helpful advice. A special thank you to the Human Engineering Research Laboratories for the use of their facility to build the testing machine and feedback along the way. Another special thank you to the University of Pittsburgh Biodynamics Laboratory for the use of their instrumented treadmill. This paper was supported by the following: Integrative Graduate Education and Research Traineeship award number IGERT 1144584 from the National Science Foundation, Improving Health and Function Through Use of Performance Standards in Wheelchair Selection Grant #: 90REGE0001-02-00, and U.S. Agency for International Development through Agreement Nos. APC-GM-0068, SPANS-037, APC-GM-0107, and FY19-A01-6024.
Conflict of interest
The authors have no conflicts of interest to report.
References
[1] | Boninger ML, Baldwin M, Cooper RA, Koontz A, Chan L. Manual wheelchair pushrim biomechanics and axle position. Archives of Physical Medicine and Rehabilitation. (2000) ; 81: (5): 608-13. |
[2] | Brubaker CE. Wheelchair prescription: an analysis of factors that affect mobility and performance. J Rehabil Res Dev. (1986) ; 23: (4): 19-26. |
[3] | Cooper RA, Robertson RN, VanSickle DP, Boninger ML, Shimada SD. Methods for determining three-dimensional wheelchair pushrim forces and moments: a technical note. Journal of Rehabilitation Research and Development. (1997) ; 34: (2): 162. |
[4] | Burnham RS, May L, Nelson E, Steadward R, Reid DC. Shoulder pain in wheelchair athletes: the role of muscle imbalance. The American Journal of Sports Medicine. (1993) ; 21: (2): 238-42. |
[5] | Boninger ML, Cooper RA, Baldwin MA, Shimada SD, Koontz A. Wheelchair pushrim kinetics: body weight and median nerve function. Archives of Physical Medicine and Rehabilitation. (1999) ; 80: (8): 910-5. |
[6] | Medicine CfSC. Preservation of upper limb function following spinal cord injury: a clinical practice guideline for health-care professionals: Consortium for Spinal Cord Medicine, (2005) . |
[7] | Lemaire ED, Lamontagne M, Barclay HW, John T, Martel G. A technique for the determination of center of gravity and rolling resistance for tilt-seat wheelchairs. J Rehabil Res Dev. (1991) ; 28: (3): 51-8. |
[8] | Cowan RE, Nash MS, Collinger JL, Koontz AM, Boninger ML. Impact of surface type, wheelchair weight, and axle position on wheelchair propulsion by novice older adults. Arch Phys Med Rehabil. (2009) ; 90: (7): 1076-83. |
[9] | Kwarciak AM, Yarossi M, Ramanujam A, Dyson-Hudson TA, Sisto SA. Evaluation of wheelchair tire rolling resistance using dynamometer-based coast-down tests. J Rehabil Res Dev. (2009) ; 46: (7): 931-8. |
[10] | Sprigle S, Huang M. Impact of Mass and Weight Distribution on Manual Wheelchair Propulsion Torque. Assistive Technology. (2015) ; 27: (4): 226-35. |
[11] | Ott J, Pearlman J. Scoping review of the rolling resistance testing methods and factors that impact manual wheelchairs. Journal of Rehabilitation and Assistive Technologies Engineering. (2021) ; 8: : 1-19. |
[12] | VanderWiel J, Harris B, Jackson C, Reese N. Exploring the relationship of rolling resistance and misalignment angle in wheelchair rear wheels. RESNA, Arlington, VA. (2016) ; 12: . |
[13] | Frank TG, Abel EW. Measurement of the turning, rolling and obstacle resistance of wheelchair castor wheels. Journal of Biomedical Engineering. (1989) ; 11: (6): 462-6. |
[14] | Teran E, Ueda J, editors. Evaluation of wheelchair Rolling Resistance using a robotic device. Advanced Robotics and its Social Impacts (ARSO), 2014 IEEE Workshop on; 2014: : IEEE. |
[15] | Hillman M. Wheelchair wheels for use on sand. Medical Engineering & Physics. (1994) ; 16: (3): 243-7. |
[16] | Sawatzky BJ, Denison I. Wheeling efficiency: The effects of varying tyre pressure with children and adolescents. Pediatric Rehabilitation. (2006) ; 9: (2): 122-6. |
[17] | Koontz AM, Yang Y, Price R, Tolerico ML, DiGiovine CP, Sisto SA, et al. Multisite comparison of wheelchair propulsion kinetics in persons with paraplegia. J Rehabil Res Dev. (2007) ; 44: (3): 449-58. |
[18] | Salaani MK, Evans LR, Harris JR, MacIsaac JD Jr., editors. NHTSA tire rolling resistance test development project – Phase I. Proceedings of the 21ST (Esv) International Technical Conference on the Enhanced Safety of Vehicles, Held June 2009, Stuttgart, Germany; (2009) . |
[19] | Clark SK. Rolling resistance forces in pneumatic tires. United States. Dept. of Transportation. Office of the Secretary; (1976) . |
[20] | Evans L, MacIsaac J Jr, Harris J, Yates K, Dudek W, Holmes J, et al. NHTSA tire fuel efficiency consumer information program development: phase 2 – effects of tire rolling resistance levels on traction, treadwear, and vehicle fuel economy. East Liberty, OH: National Highway Traffic Safety Administration. (2009) . |
[21] | Thomson Industries, Inc. 2019 [Available from: https://www.thomsonlinear.com/en/product/1%201/2%20L%20TU%20CTL. |
[22] | Newway Air Bearings 2019 [Available from: https://www.newwayairbearings.com/catalog/product/air-bushings-english-1-50-inch-id/. |
[23] | Interface Inc. 2019 [Available from: https://www.interfaceforce.com/products/mini-load-cells/mb-mini-beam-load-cell/. |
[24] | National Instruments 2019 [Available from: http://www.ni.com/en-us/support/model.ni-9201.html. |
[25] | Inc. TM. MATLAB. 2018b2018. |
[26] | Kauzlarich JJ, Thacker JG. Wheelchair tire rolling resistance and fatigue. J Rehabil Res Dev. (1985) ; 22: (3): 25-41. |
[27] | Sprigle S, Huang M, Misch J. Measurement of rolling resistance and scrub torque of manual wheelchair drive wheels and casters. Assistive Technology. (2019) : 1-13. |
[28] | McLaurin CA, Brubaker CE. Biomechanics and the wheelchair. Prosthetics and Orthotics International. (1991) ; 15: (1): 24-37. |
[29] | Lin JT, Huang M, Sprigle S. Evaluation of wheelchair resistive forces during straight and turning trajectories across different wheelchair configurations using free-wheeling coast-down test. J Rehabil Res Dev. (2015) ; 52: (7): 763-74. |
[30] | Sauret C, Bascou J, de Saint Remy N, Pillet H, Vaslin P, Lavaste F. Assessment of field rolling resistance of manual wheelchairs. J Rehabil Res Dev. (2012) ; 49: (1): 63-74. |
[31] | Hoffman MD, Millet GY, Hoch AZ, Candau RB. Assessment of wheelchair drag resistance using a coasting deceleration technique. Am J Phys Med Rehabil. (2003) ; 82: (11): 880-9; quiz 90-2. |
[32] | van der Woude LH, Geurts C, Winkelman H, Veeger HE. Measurement of wheelchair rolling resistance with a handle bar push technique. Journal of Medical Engineering & Technology. (2003) ; 27: (6): 249-58. |
[33] | Zepeda R, Chan F, Sawatzky B. The effect of caster wheel diameter and mass distribution on drag forces in manual wheelchairs. J Rehabil Res Dev. (2016) ; 53: (6): 893-900. |
[34] | Gordon J, Kauzlarich JJ, Thacker JG. Tests of two new polyurethane foam wheelchair tires. J Rehabil Res Dev. (1989) ; 26: (1): 33-46. |
[35] | Sawatzky BJ, Kim WO, Denison I. The ergonomics of different tyres and tyre pressure during wheelchair propulsion. Ergonomics. (2004) ; 47: (14): 1475-83. |
[36] | de Groot S, Vegter RJ, van der Woude LH. Effect of wheelchair mass, tire type and tire pressure on physical strain and wheelchair propulsion technique. Medical Engineering and Physics. (2013) ; 35: (10): 1476-82. |
[37] | Mason BS, Lemstra M, van der Woude LH, Vegter R, Goosey-Tolfrey VL. Influence of wheel configuration on wheelchair basketball performance: wheel stiffness, tyre type and tyre orientation. Medical Engineering & Physics. (2015) ; 37: (4): 392-9. |
[38] | Dickey C, Higginbotham G, Reese N. Exploring the Relationship of Rolling Resistance, Tire Type, and Surface in Wheelchair Rear Wheels. RESNA; Washington D.C. (2018) . |

