
Food price inflation nowcasting and monitoring1
Abstract
Rising food prices may rapidly push vulnerable populations into food insecurity, especially in developing economies and in low-income countries, where a substantial share of the financial resources available to the poorest households is spent on food. To capture soaring food prices and help in designing mitigating measures, we developed two complementary products: a nowcasting model that estimates official food consumer price inflation up to the current month and a daily food price monitor that checks whether the growth rate of a few basic food commodities exceeds a statistical threshold. Both products were designed with the consideration that the rapid acquisition of data and the automated extraction of insights are indispensable tools for policymakers, particularly in times of crisis. Our framework is characterized by three key aspects. Firstly, we leverage two non-traditional data sources to emphasize the importance of real-time information: a crowdsourced repository of daily food prices and textual insights obtained from newspapers articles. Secondly, our framework offers a global perspective, encompassing 225 countries and territories, which enables the monitoring of food prices dynamics on a global scale. Thirdly, results are made accessible daily via an intuitive and user-friendly interactive dashboard.
1.Introduction
Global food price inflation that followed global events, including the COVID-19 pandemic and the ongoing Russia-Ukraine conflict [1], has recently been a critical issue for policymakers and economists. The level of food prices is a fundamental aspect of the economy that affects the quality of life of people and the economic well-being of countries, making it a significant topic. Food items’ availability and prices are key factors that affect the nutrition of a population [2], and therefore, their impact on health and human development is substantial [3]. Furthermore, food is a basic good whose price has a direct influence on households’ budgets, especially those with lower incomes. In some low-income countries, households with per capita income lower than $2.97/day spend around two-thirds of their earnings on food [4].
Fluctuations in food prices have the potential to disrupt both international and local market stability, impacting the food supply and nutritional well-being of populations. Although some studies suggest that where prices of agricultural products have increased, these increases helped reduce poverty at a global level [5]; evidence that increases in poverty are more frequent than reductions is more widespread [6, 7]. A study on the potential negative effects of food price increases [8]estimated that during the food crisis period of 2005–2008 the number of poor people increased by 187 million globally.
High food prices can serve as an early warning signal of potential a food crisis unfolding or on the horizon. However, food prices are a complex phenomenon that is influenced by various demand and supply factors such as, e.g., weather, production costs, government policies, changes in income distribution and dynamics, and market conditions. Moreover, official inflation estimates are usually available but with some delay due to several factors such as data collection challenges, data processing and validation, administrative bottlenecks, among others. For instance, as of mid-March 2023, only 22 countries out of 184 have published the figure for the previous month.
For the reasons highlighted above, accurate and rapid monitoring and forecasting of food price inflation have become critical in providing relevant information for policies aimed at food security and stability [9]. However, given the previously mentioned complexity, most of the studies and tools that monitor food inflation are country-specific or focused on specific groups of countries. In this context, the Food and Agriculture Organization of the United Nations (FAO), with its role to provide timely and reliable information on food markets and support countries in their efforts to improve their food security [10], has developed an early warning system for food prices. In this paper, two products developed by FAO’s Data Lab and aimed at the global economic landscape that covers 225 countries and territories are introduced. These tools aim at detecting possible anomalous dynamics, alerting analysts and policymakers, and facilitating mitigating measures in response to soaring food prices. The first product is a nowcasting model that estimates food price inflation indices up to the current month using daily food price averages and other frequently updated variables. The second product is a daily food price monitoring tool that uses statistical criteria to identify when the growth rate of prices for a set of food items exceeds a given threshold, triggering alerts in the event of anomalous cases. Both approaches offer promising solutions to address the challenges posed by the lag in publishing national food price indices and monitoring abnormal growth in food prices worldwide. The two products have been integrated into an interactive web tool with tables, graphs, and maps to present the findings in a readable format for non-technicians. This tool is available at the following URL: https://www.fao.org/datalab/early-warnings/food-prices/.
In the context of our research on nowcasting and daily monitoring of food prices, we explore the practical implications of this tool for policymakers, particularly in addressing the challenges posed by rising food prices on vulnerable populations. Our nowcasting tool is designed to serve as an early warning system, enabling policymakers to anticipate and respond to potential spikes in food prices with timely interventions. To illustrate the benefits of our tool, consider a scenario where a region has limited access to real-time data. By leveraging our model, officials can predict an imminent rise in food prices and proactively implement measures to mitigate its impact. These measures might include adjusting import/export policies to stabilize prices, enacting temporary price controls on essential food items, expanding social safety nets to support affected populations, enhancing market monitoring to prevent speculative practices, and promoting agricultural initiatives to increase local food production. By using our predictive tool, policymakers can shift from a reactive to a proactive perspective, potentially minimizing the adverse effects of food price inflation on those most at risk. This approach underscores the significance of our nowcasting tool and daily monitoring in facilitating timely and effective policy decisions. Ultimately, this contributes to the broader goal of enhancing food security and economic stability.
The remainder of the paper is structured as follows: Section 2 provides an overview of relevant literature on price nowcasting and early warnings. Section 3 describes the data used in this work. Section 4 outlines the methodologies employed for nowcasting official food price inflation and detecting abnormal growth in food prices. Section 5 discusses results and describes some examples of how results are made available to the public. Finally, Section 6 summarizes the findings and presents a discussion about the strengths and weaknesses of the proposed approaches.
2.Related work
The scientific literature offers various methods to monitor food price inflation, among which is the Indicator of Food Price Anomalies [11]developed by the FAO’s Global Information and Early Warning System (GIEWS). This indicator detects severe market disruptions and is used to monitor progress against Sustainable Development Goal 2 (Zero Hunger). The indicator is based on [12]and uses a weighted moving average of two composite growth rates, for quarterly and annual changes. These provide valuable insights but rely on monthly or annual data, and thus introduce delays in signaling emerging food crises.
Some authors underscored the importance of online food prices for monitoring and predicting food inflation, and crises related to food security. [13] proposed a novel framework using web-scraping to collect and analyze online food prices in real-time, providing reliable estimates of monthly and annual food inflation ahead of official indexes in Poland. [14] showed that incorporating online prices into model-based frameworks improves accuracy in food inflation nowcasting compared to traditional methods. [15] conducted a pilot project in northern Nigeria to demonstrate the feasibility and potential of using crowdsourcing platforms to provide timely and localized data on food security threats during the COVID-19 pandemic. The project focused specifically on major grain commodities such as maize and rice. [16] explored the use of online price indices to predict changes in official inflation trends. The study covered inflation rates in ten countries from July 2008 to September 2016 and argues that online indices can improve forecasting accuracy compared to traditional survey-based forecasts. The authors find that online indices can anticipate traditional CPI measures, particularly in the short term. Yavas and Das [17]use a crowdsourced database and apply dynamic factors and mixed frequency models for nowcasting inflation prices in India. Seabold and Coppola [18]nowcast food prices in Costa Rica, El Salvador and Honduras using Google Trends. [19] apply mixed frequency models for nowcasting food prices in Colombia. Pramana et al. [20]discuss the potential benefits of using crowdsourcing to obtain real-time information on food prices in Indonesia. This involves gathering data from a range of sources, including social media, mobile apps, and online platforms. The authors emphasize how this approach can improve the accuracy and efficiency of food price nowcasting, which can ultimately lead to more effective government policies.
In terms of the geographical heterogeneity of the countries considered, as well as the use of non-conventional data sources, the work most similar to ours is Tilly, Ebner and Livan [21]who estimate a model that uses textual information from world news to nowcast consumer prices in the United States, the United Kingdom, Germany, Norway, Poland, Turkey, Japan, South Korea, Brazil, and Mexico. While this is indeed a set of distinct countries, the geographical coverage (ten countries) is not global as in our application. Moreover Tilly, Ebner and Livan use a bidirectional long short-term memory (LSTM) neural network, which is a rather sophisticated model, while our work uses a panel data model. Despite being computationally simpler, models like the one we use in our application continue to be used for nowcasting purposes. A recent example can be found in Fosten and Greenaway-McGrevy [22].
Interested readers in nowcasting are invited to read a systematic review of research papers on the topic recently elaborated by Stundziene et al. [23].
As already mentioned, various studies have demonstrated the effectiveness of real-time online data in improving the accuracy of inflation forecasting and its timeliness to inform possible food security threats. These studies are mostly limited to specific countries or groups of countries, and specific commodities. Furthermore, these studies are typically academic research products that are not deployed in a “production” environment, i.e., they do not underpin publicly available and updated tools with the proposed methods, which makes them difficult to use. On the contrary, our framework is readily made available on the web.
3.Methodology
In this paper we propose two approaches: the first one is a model that generates nowcasts of official food price inflation, and the second one is a method for detecting anomalies in daily food prices (the Food Price Acceleration Monitor). We will now present the methodological foundations of the two approaches and how results are categorized so that they can be better interpreted, which in turn supports the visual tools such as maps and graphs.
3.1Nowcasting model for monthly food inflation
As stated by [24]nowcasting can be described as the prediction of current events, the near future, and the very recent past. A crucial aspect of the nowcasting process is the utilization of timely monthly information to forecast important economic variables, such as GDP, which is usually collected at lower frequencies and released with long delays [24]A similar situation occurs with Food Consumer Price Indices, which are typically published with at least one month delay, as previously mentioned in the Introduction.
A nowcasting exercise has two critical components. The first one is the selection of relevant explanatory variables, which must be accessible, frequent and timely, to aid in the prediction of the target variable. The second one involves choosing an appropriate function to estimate the relationship between the explanatory variables and the target variable.
In terms of explanatory variables, our methodology focuses on the integration of four timely variables that are likely to influence or correlate with the official food price inflation: daily food prices of a product subset, oil prices, exchange rates, and text indices obtained from newspapers.
The first variable (more information in the following section) is obtained from Numbeo (https://numbeo.com/), which is a website that collects daily worldwide information about the cost of living, quality of life, and other socio-economic factors across cities, countries, and territories. The data is crowdsourced, i.e., entered directly from users. Bai et al. [25]mention that this source for potential use in research areas like food policy, nutrition, and health. However, to the best of our knowledge, it has not yet been used at scale in this context, although Numbeo’s data was applied in a variety of research settings by multiple authors. Kaklauskas et al. [26]consider Numbeo’s Quality of Life Index to benchmark estimates of the quality of life in European cities. Laframboise et al. [27]use some of Numbeo’s series to build an index to compare the nominal cost of similar tourism products across destinations around the world and rank them for differences in purchasing-power parity. Helble et al. [28]provide evidence of the housing affordability crisis by using housing prices of 211 cities in 27 developing countries located in the Asia-Pacific region sourced from Numbeo. Besides their main conclusion of house unaffordability, they test the validity of Numbeo’s data by comparing it with data from alternative public and private sources for a subset of cities and find that there is a correlation between the different sources of 0.95 and find no significant bias in either direction.
Oil prices are used as a proxy for national gasoline prices to include the effects of energy shocks. Oil prices are critical as they affect the costs of transportation and production in the food industry. Oil prices fluctuations can cause significant changes in food supply chain costs, thereby impacting food prices. Sun et al. [29]establish a positive correlation between world food prices indices and oil prices, as well as their respective demand and supply fluctuations. Mehmet and Waiwood [30]find that oil prices contribute to explaining short-term fluctuations in the consumer price index. Nazlioglu and Soytas [31]provide substantial evidence on the influence of global oil prices on the prices of various agricultural commodities. Positive gasoline price shocks are found to trigger an increase in agricultural input prices by Diab and Karaki [32], which may possibly explain the increase in agricultural product prices.
As for exchange rates, Yeboah et al. [33]find that the only factors that persistently explain soaring food prices are the simultaneous and one-year lagged exchange rates and income. Gilbert [34]shows that during the period 1970–2008, exchange rates are one of the consistent determinants of changes in world agricultural prices, albeit with a relatively small effect.
Lastly, text indices derived from newspapers offer real-time insights into various factors that might influence food markets. These indices provide a window into market sentiments, policy shifts, and other emerging trends that can potentially affect food prices. Kalamara et al. [35]show that newspaper text data can be converted into forward-looking economic indicators that improve forecasts of inflation and other macroeconomic variables such as GDP and unemployment (see also [36]). Lamla and Lein [37]find that news reporting and tone strongly influence consumers’ expectations on inflation. Focusing on Twitter, the “Social Mood on Economy Index” developed by the Italian National Statistics Institute, which measures the Italian sentiment about the economy based on Twitter data, has a good correlation with official statistics series derived from monthly surveys e.g., with the Consumer Confidence Survey [38]. Angelico et al. [39]show that tweets can be converted into timely indices, which can anticipate consumers’ expectations and provide additional content compared to alternative sources (professional forecasters and market-based expectations). For additional research supporting the effectiveness of Twitter-based indices in price forecasting, see Muñoz-Martínez et al. [40]and Kim et al. [41].
Having discussed the variables that we selected to nowcast food price indices, we turn now to the second part of this exercise, i.e., the model specification. For this, we have chosen the following panel framework with varying slopes across regions allowed for the effect of oil prices:
(1)
where
While in Eq. (1) we use the month-over-month (MoM) variations to have more observations to use for estimating the model, results are provided in year-over-year (YoY) terms. We use the formula below to compute the YoY inflation:
where a bar on a variable indicates the nowcast value.
To enhance the interpretability of the model’s output, we categorize the anticipated variation in food prices at month
(2)
where
3.2Daily food prices acceleration monitor
The indicator of Daily Food Prices Acceleration (DFPA) is based on the Indicator of Food Price Anomalies (IPA) published by FAO through the monthly bulletin Food Prices Monitoring and Analysis (FPMA). The approach relies on Compound Growth Rates (CGR), which assume that a variable grows at a steady rate, compounded over a specific time period [11]. This assumption of a constant rate helps suppress the effect of periodic price fluctuations by smoothing them. The calculation of the CGR involves computing the growth of a random variable from an initial point
(3)
where
The calculation of the z-score was modified to reduce the noise on the final indicator. In the modified z-score, we use the median as a central measure and the Median Absolute Deviation (MAD) as a measure of variability, as shown in Eq. (4):
(4)
where
(5)
The standard deviation to define thresholds is commonly used in alerts system to minimize the probability of missing significant events [11, 12]. In previous works, Araujo et al. [12]and Baquedano [12]proposed classifying the indicator of price anomalies into two explicit alarm categories. When the compound growth rate deviation from historical trends exceeds its standard deviation, the situation is considered alarming. On the other hand, when it falls short of its standard deviation and exceeds half of it, the market disruption is considered moderate. We propose adding one more class for alerts and define explicitly when the indicator is on a regular level, as shown in Eq. (5). In contrast to the previous work, the classes proposed in Eq. (5) require a higher deviation to trigger an alert when compared with the Baquedano [11]indicator. These changes are proposed based on the high volatility of daily food prices, which may result in many false alerts if we keep the same thresholds used in the previous work. The following sections will illustrate the methodology with examples and its results.
The DFPA indicator proposed in this work is computed for the fourteen food items in each geographical area. We propose a weighted average of the CGR for the indicator by geographical area, with weights equal to each food item’s availability for each geographical territory.
4.Data
This work utilizes diverse data, ranging from standard variables like the exchange rates from local currency units (LCU) to the US dollar (USD) and the crude oil price, to data from non-conventional sources like the crowdsourced daily food prices, to non-conventional variables such as the sentiment index compiled from news articles collected on Twitter.
The daily LCU/USD exchange rates, the WTI and Brent crude oil prices are all obtained from the Yahoo database and the University of British Columbia respectively. The two oil prices are averaged to obtain a single price indicator.
Daily price data for fourteen food products (bread, milk, rice, eggs, cheese, chicken, beef, apples, bananas, oranges, tomatoes, potatoes, onions, and lettuce) are obtained from Numbeo, which is a “crowdsourced” database, i.e., contributed by a large online community of users who voluntarily enter data on the cost of living, housing, health care, traffic, crime and pollution in the countries they live in. We use Numbeo for food prices as it meets the need for timely and real-time information by overcoming the constraints of official survey data collection. While this is a clear advantage, crowdsourced data also has some limitations. For instance, there is no guarantee that all the contributors will report every day on every item, so there can be inconsistencies in coverage or quality for a single day or product. Our database covers the period from January 1, 2020, to the present (March, 2023) and encompasses information for 225 countries and territories worldwide. During the period from February 20th, 2023 to February 20th, 2024, the daily price recordings for the 14 commodities were consistent across different territories. Overall, 85% of the territories recorded daily prices for all the commodities, while 91% recorded prices for at least 13 of these commodities daily. Upon closer examination, territories in the Middle East & North Africa, North America, South Asia, and Europe & Central Asia consistently reported daily prices for at least 13 of the 14 commodities throughout the entire period. However, Sub-Saharan Africa and Latin America & Caribbean territories demonstrated a slightly lower consistency, reporting prices for 13 commodities on 90% of the days. East Asia & Pacific territories reported the least consistency, with food prices for at least 13 commodities being recorded on only 80% of the days. Prices are available in local currency, and in some cases, in US dollars, and include minimum and maximum prices as well as average prices. A series of data processing techniques were employed to enhance the quality of the data, which involved cleaning and harmonizing the database. This process entailed checking country names, currency codes, and date format.
Table 1
Descriptive statistics on the nowcasting model estimation sample (2020–08 to 2022–12)
| Percentiles | |||||||
|---|---|---|---|---|---|---|---|
| Variable | Mean | Std. dev. | 1 | 25 | 50 | 75 | 99 |
|
| 0.9% | 1.9% | 0.0% | 0.6% | 1.4% | 7.6% | |
|
| 0.7% | 6.2% | 0.2% | 0.9% | 10.5% | ||
|
| 0.4% | 3.9% | 0.0% | 0.9% | 7.3% | ||
|
| 2.1% | 9.2% | 3.7% | 8.2% | 19.6% | ||
|
| 0.50 | 0.11 | 0.29 | 0.44 | 0.50 | 0.56 | 0.79 |
Given the user-contributed nature of the data, its accuracy and reliability may vary. Numbeo addresses this challenge by blending user-generated input with curated information from trusted sources, such as supermarkets, government websites, and taxi company platforms. This manually gathered data is meticulously processed, entered biannually, and assigned a weight three times higher than user-generated data, enhancing its reliability. Numbeo implements automatic and semi-automatic filters (algorithms) that reduce noise and prevent spam to ensure data integrity further. The platform’s proprietary filtering technology plays a crucial role in eliminating biases and safeguarding accuracy, which is essential for maintaining the objectivity and quality of the data.33 In our analysis, we apply a three-period moving average to nowcasting food prices to enhance data accuracy and exclude observations that fall below the 1% and above the 99% percentiles in Numbeo’s raw data. Furthermore, we employ robust statistical methods in the Daily Food Prices Acceleration Monitor, opting for the median absolute deviation over the standard deviation as a measure of spread to ensure reliability and accuracy.
In the Daily Food Prices Acceleration Monitor, Numbeo prices are considered individually, and they represent the variables that are monitored. In contrast, in the nowcasting application, they are aggregated into a single index that is used as an explanatory variable of the model. The aggregation is done by using the availability (or supply) of the items, constructed as the sum of production and imports minus exports, and is determined using the data from the countries’ Food Balance Sheets as compiled by FAO.
The model uses another non-conventional variable and source: the Twitter sentiment index. To this end, the FAO Data Lab built a database, which is updated daily since January 2020 with tweets on any topic in seven languages (English, Spanish, French, Italian, Portuguese, Arabic, and Russian) collected from more than 500 newspaper accounts from 193 different countries and territories. The text from the tweets and the associated article are extracted jointly when both are available. The sentiment index is calculated using a dictionary approach, i.e., a method that compares the words in the text to a pre-defined set of language-specific words (lexicon) associated with the positive, negative, or neutral sentiment [44, 45]. The sentiment index is then computed by summing the number of positive words over the total of positive and negative words in the article. Equation (6) describes the sentiment calculation, where
(6)
In the nowcasting application, the target variable is the variation of official Food Consumer Price Indices. These are sourced from the FAOSTAT database and supplemented with information obtained from the International Monetary Fund (IMF) and Trading Economics.
Descriptive statistics of the data used in this paper are provided in Table 1.
5.Results
Table 2
Model estimates, different estimations, and forecast performance metrics
| (1) | (2) | (3) | (4) | (5) | (6) | (7) | (8) | (9) | (10) | (11) | (12) | (13) | |
| Intercept | 0.005*** | 0.017*** | 0.009*** | 0.009*** | 0.008*** | 0.008*** | 0.005*** | 0.008*** | 0.016*** | 0.017*** | 0.016*** | 0.009*** | 0.008*** |
| (0.001) | (0.003) | (0.001) | (0.001) | (0.001) | (0.001) | (0.001) | (0.008) | (0.003) | (0.003) | (0.003) | (0.001) | (0.001) | |
|
| 0.502*** | 0.506*** | 0.501*** | 0.484*** | 0.491*** | 0.488*** | |||||||
| (0.078) | (0.078) | (0.078) | (0.078) | (0.079) | (0.079) | ||||||||
|
| 0.048 | 0.026** | 0.018*** | 0.039 | 0.051 | 0.036** | 0.019*** | ||||||
| (0.029) | (0.011) | (0.006) | (0.024) | (0.033) | (0.020) | (0.007) | |||||||
|
| 0.117 | 0.074*** | 0.077*** | 0.112*** | 0.118*** | 0.111*** | 0.074*** | ||||||
| (0.019) | (0.017) | (0.018) | (0.015) | (0.018) | (0.016) | (0.018) | |||||||
|
| |||||||||||||
| (0.005) | (0.002) | (0.002) | (0.002) | (0.005) | (0.005) | (0.005) | (0.002) | ||||||
| Obs. | 3,818 | 3,440 | 3,846 | 3,846 | 3,414 | 3,414 | 3,818 | 3,414 | 3,440 | 3,440 | 3,440 | 3,846 | 3,414 |
| RMSE | 0.017 | 0.020 | 0.019 | 0.019 | 0.017 | 0.017 | 0.016 | 0.017 | 0.020 | 0.020 | 0.020 | 0.019 | 0.017 |
| Adj. R2 | 0.245 | 0.006 | 0.010 | 0.033 | 0.251 | 0.253 | 0.259 | 0.265 | 0.043 | 0.015 | 0.038 | 0.037 | 0.266 |
| Within R2 | 0.392 | 0.199 | 0.201 | 0.219 | 0.399 | 0.401 | 0.404 | 0.410 | 0.229 | 0.207 | 0.225 | 0.223 | 0.411 |
| Forecasting accuracy measures: | |||||||||||||
| MASE | 0.17 | 0.143 | 0.17 | 0.17 | 0.138 | 0.137 | 0.17 | 0.138 | 0.141 | 0.141 | 0.143 | 0.171 | 0.137 |
| MAPE | 17.87 | 19.97 | 19.56 | 20.54 | 16.71 | 16.06 | 17.07 | 16.46 | 18.44 | 18.60 | 19.48 | 19.57 | 16.00 |
Notes: Models are estimated with a sample of
Table 2 shows the results of different estimation specifications of the nowcasting model. Estimates under (1) is a simple autoregressive model, which is used to benchmark the alternative models similarly to [35]. Estimates (2) to (4) are simple models that introduce one single explanatory variable at a time. Estimates (5) to (13) correspond to richer specifications, with (13) containing the whole set of explanatory variables as in Eq. (1). All models were estimated by including varying slopes for the average oil price corresponding to the 21 regions available.
As can be seen in Table 2, all coefficients have the anticipated signs and are significant. We report two measures of forecast accuracy: the Mean Absolute Scaled Error (MASE) and Mean Absolute Percent Error. In both cases, the complete specification (13) improves over the benchmark model (1).
The nowcasting and DFPA methods are run daily, and results are provided to the public in a user-friendly dashboard at the link: https://www.fao.org/datalab/early-warnings/food-prices/.
Figure 1.
The Nowcasting Food Prices module provides visualizations and summaries that are included in the Data Lab Food Price Monitor (screenshot from 23/Feb/2023). Please see the online version to view the color image.
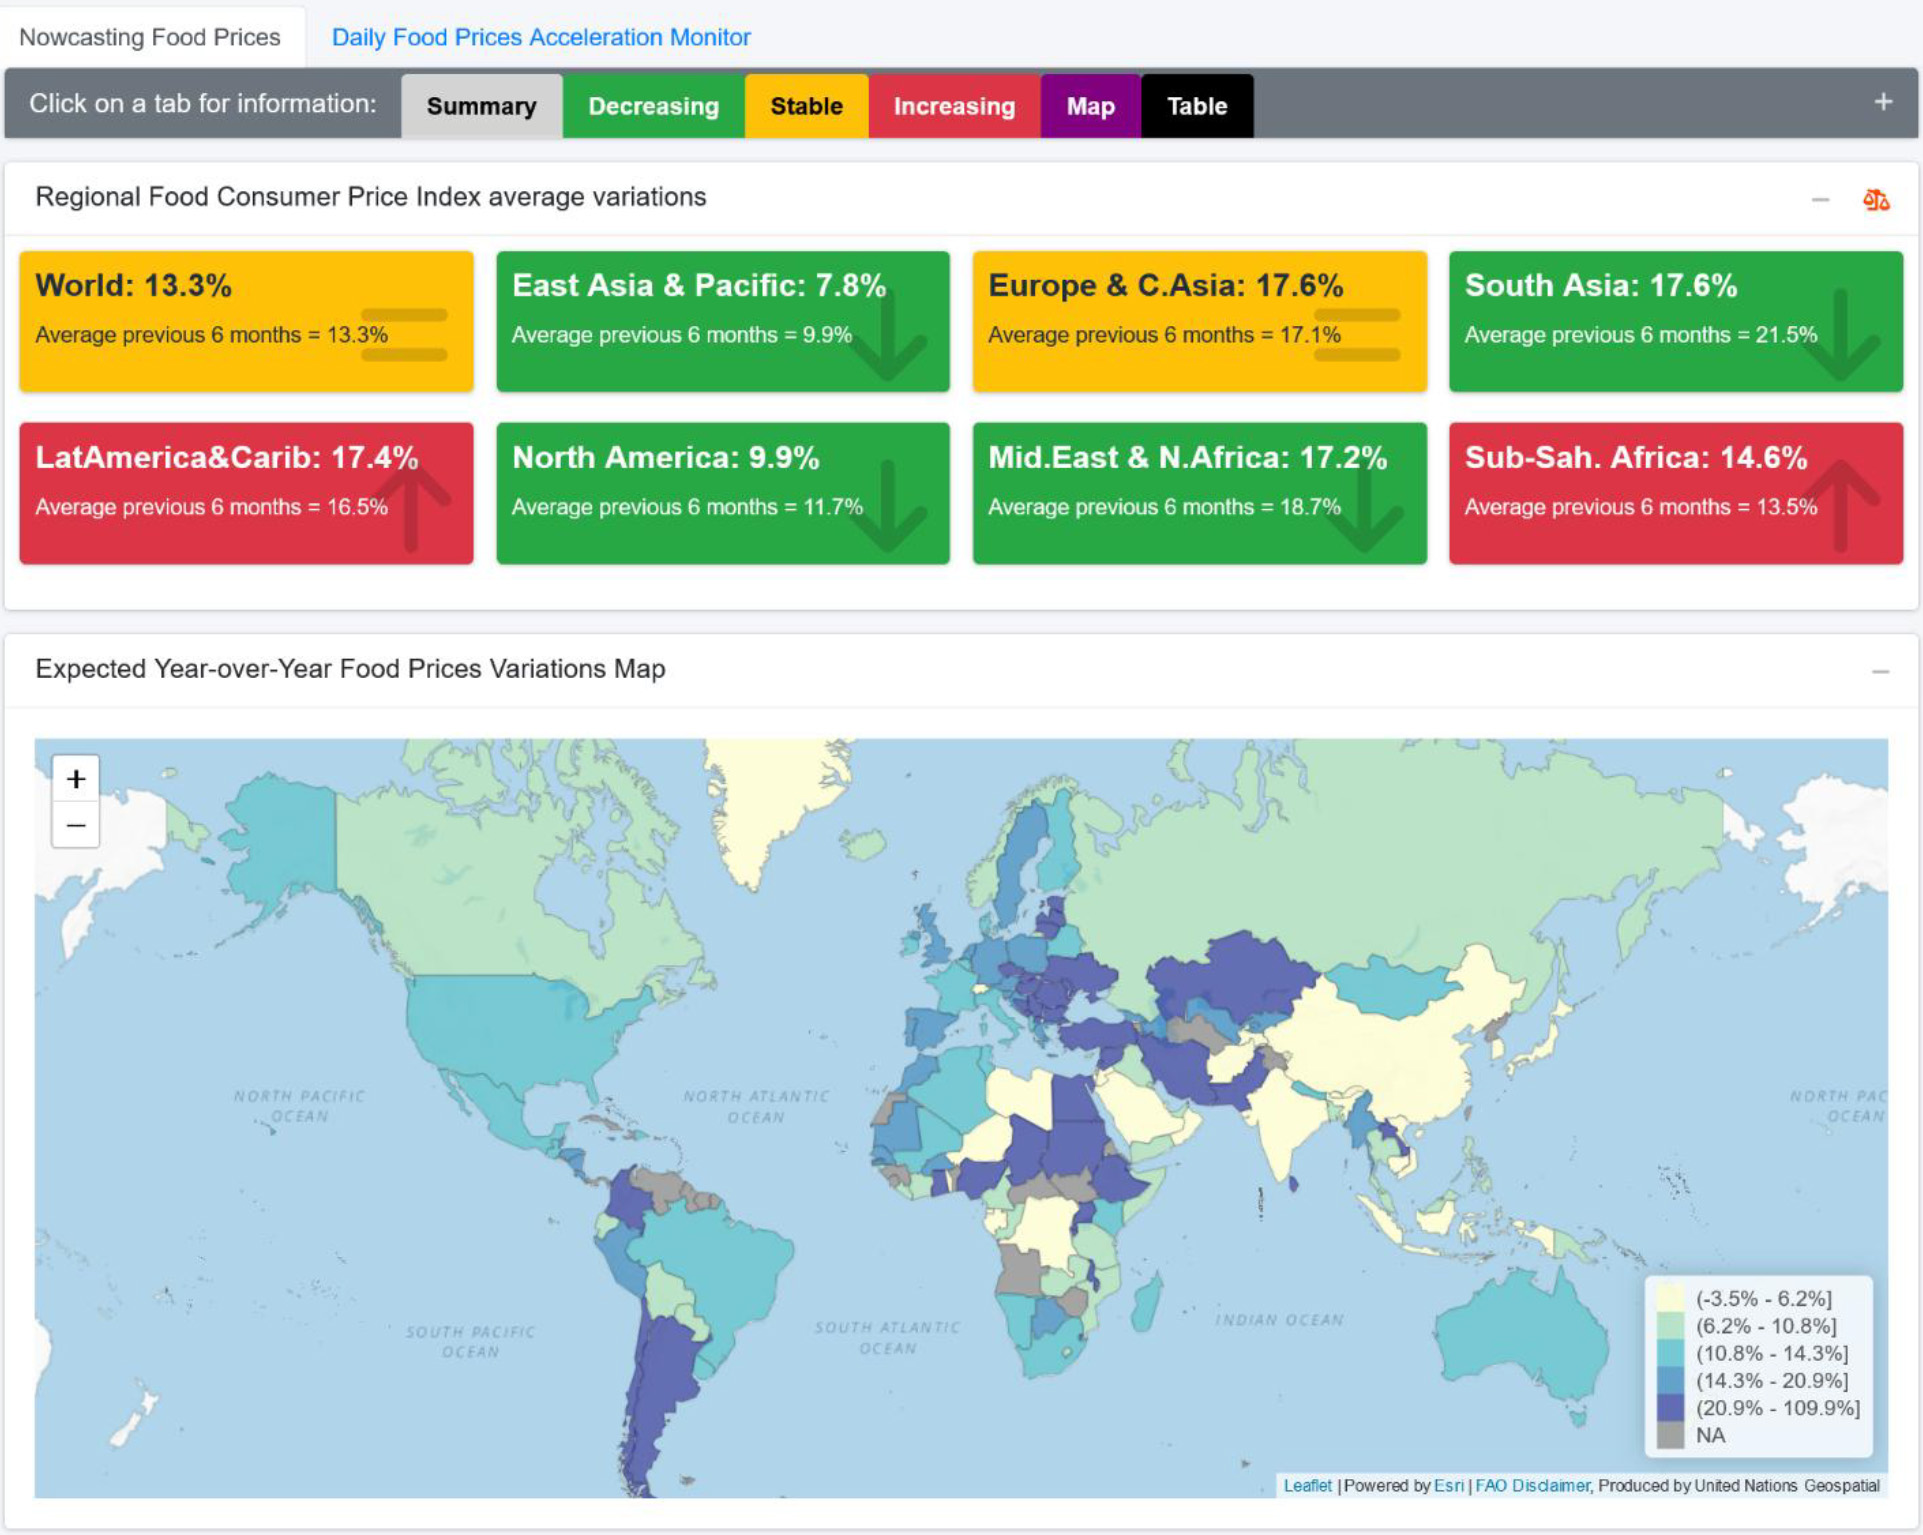
Figure 1 shows the Nowcasting Food Prices Module view from the Data Lab Food Price Monitor as of 22 February 2023. This module is composed of a set of cards that present the summary of the Food Consumer Price Index average variation at the regional and global levels. Below the cards, a map displays the YoY food price inflation nowcast at the geographical area level. This is followed by a table containing the same information, along with the 95% confidence interval for the nowcast value. The colour coding of the cards follows the classification system detailed in Section 4. Additionally, the tool describes each class and presents the rules in a tab view above the card section. The regional aggregation of the indices is computed as a weighted average, with each geographical areas’s weight being proportional to its GDP share in the corresponding region. The tool also offers the option to choose “No weights”, which computes the simple arithmetic mean of the food inflation nowcast of all areas in the region.
The findings in Fig. 1 suggest that, at the time of the calculations, the dynamics of the average variation of the food consumer price index was stable at the world level with a value of 13.8%, slightly higher than the previous six-month average of 13.5%. Similar stability was observed in several regions, including East Asia & Pacific (8.6%), Europe & Central Asia (18.2%), South Asia (19.7%), Latin America and Caribbean (17.1%), and Middle East & North Africa (18.4%), with only minor changes in comparison to their respective six-month averages. At the same time, a decreasing variation in the dynamics of the food consumer price inflation was observed in North America (9.0%) compared to the previous six-month average of 11.5%. Conversely, an increasing trend was observed in Sub-Saharan Africa (15.7%) compared to the previous six-month average of 14.1%.
Figure 2.
Image obtained from the Nowcasting Food Prices module by clicking on the Uganda area, which opens a modal window displaying the year-over-year (YoY) food price inflation. The chart reports the historical YoY food price inflation for Uganda (red line). The black dot represents the nowcast value enclosed by its 95% confidence interval (light blue bars). The black line is the six-month average, and its shaded area is
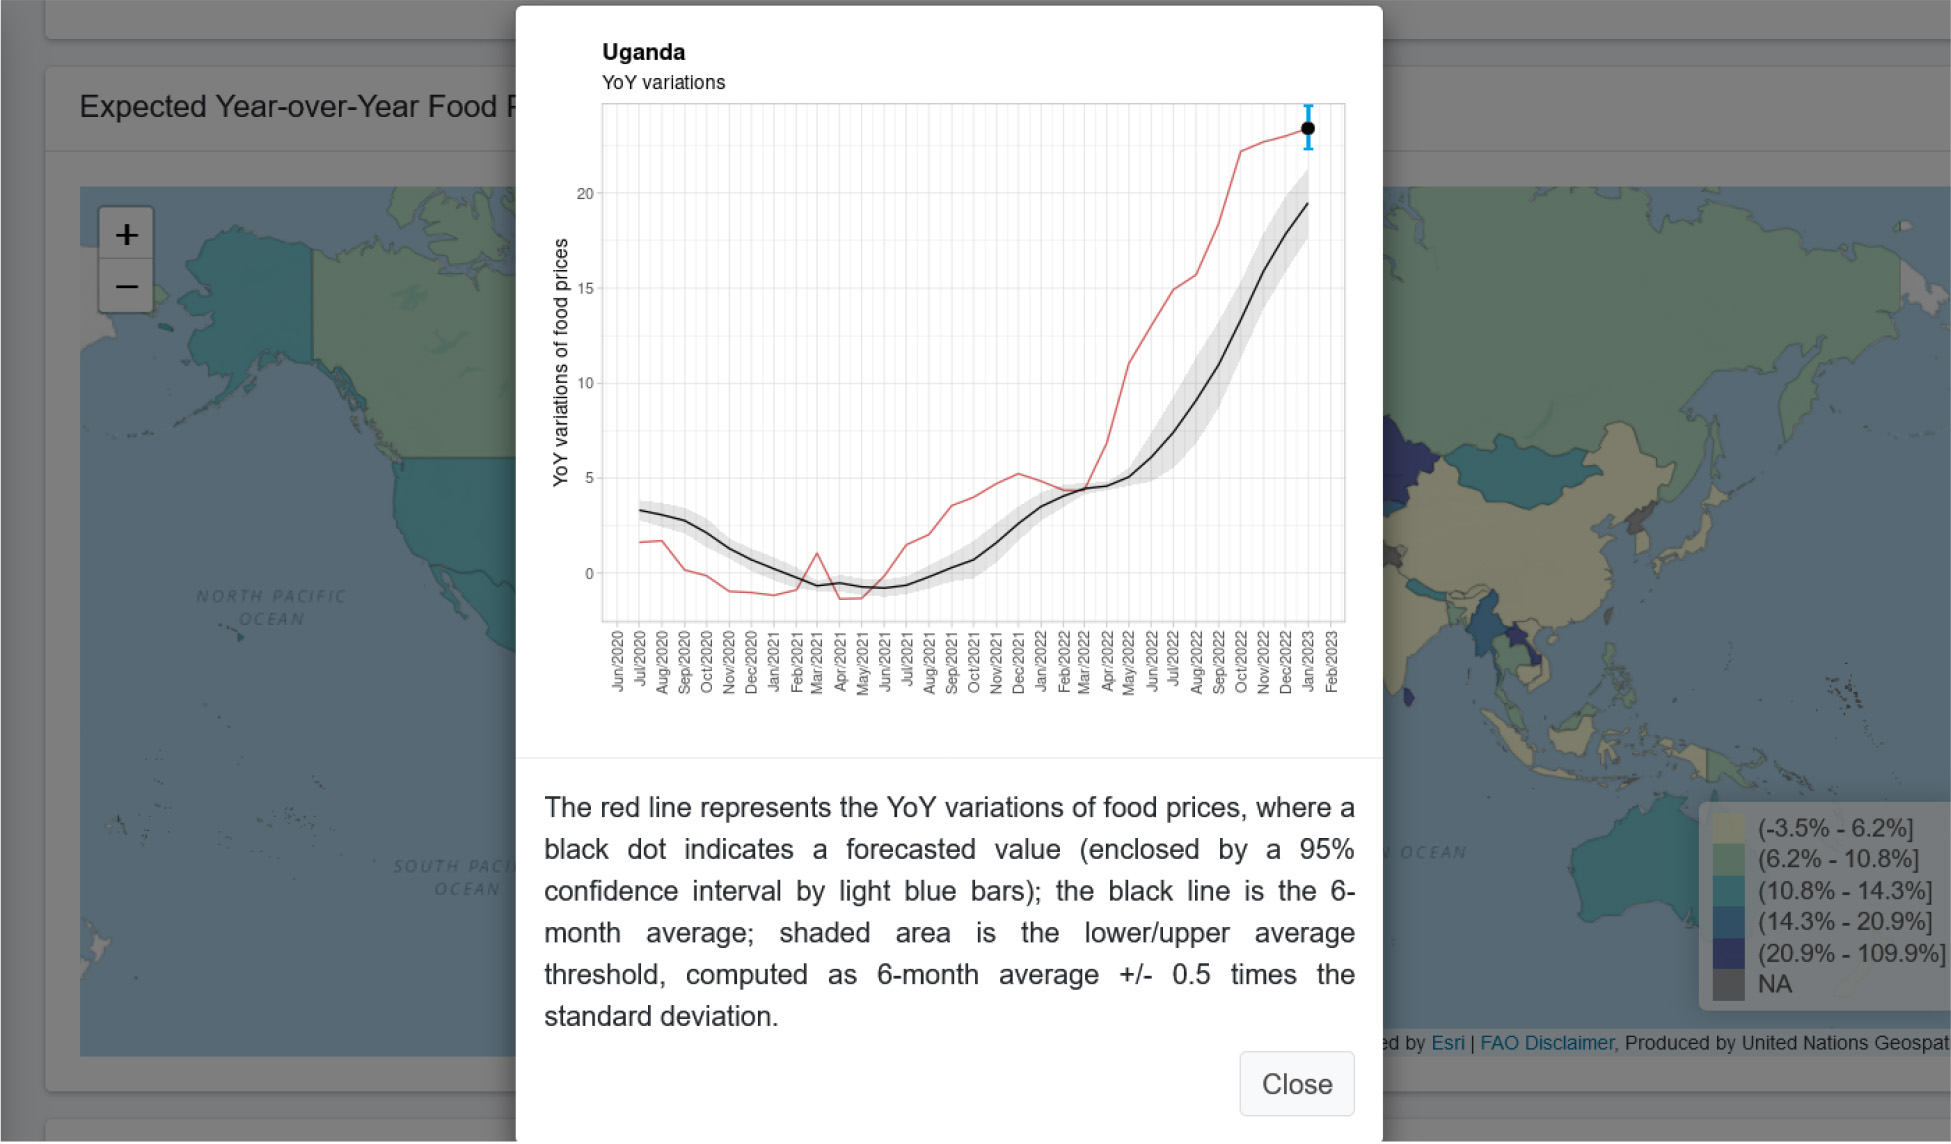
Despite the stability shown in the aggregated level, it is also important to analyze the year-over-year variation at the country and territory level. To enable this view, the tool provides a map that displays data by country and territory. The map presents the food price inflation nowcast organized into quintiles, with the intensity of blue/purple increasing as nowcast inflation grows. The user can hover over a geographical area to observe its nowcast. The data presented in the map indicated several countries and territories with high food consumer price inflation, including Argentina, Chile, and Colombia in South America, as well as Sudan, Ethiopia, and Egypt in Africa. A few areas in Eastern Europe and Southern and Western Asia faced high food consumer inflation. Additionally, by clicking on the map, the user can view the time series data shown in Fig. 2.
Figure 2 presents the forecasted YoY food prices inflation for Uganda in March 2023, with a value of 23.2%. This value is marginally higher than its six-month average of 20.8% and exceeds the shaded area. When the nowcast inflation exceeds the six-month average, it may signal an increase in the YoY food prices inflation. Additionally, the projected value falls into the highest quintile, indicating that it surpassed 80% of the YoY variation worldwide. Similar results were observed in Pakistan, Argentina, and Ghana.
The Nowcasting Food Prices Module provides valuable insights into the current state and trends of food prices at regional, country or territory levels. The visualizations and summaries enable policymakers to make informed decisions about food security and price stability. The stable trend in the global average food consumer price index that could be seen in the initial months of 2023 suggested that food prices were not significantly impacting inflation. However, some regions and geographical areas were experiencing increasing or decreasing trends. The map and time series data allow for a more detailed analysis of the YoY food price inflation, which can be used to inform policies that mitigate the impact of price fluctuations on vulnerable populations.
Figure 3.
Image obtained from the Daily Food Prices Acceleration Module on 23/Feb/2023. Please see the online version to view the color image.
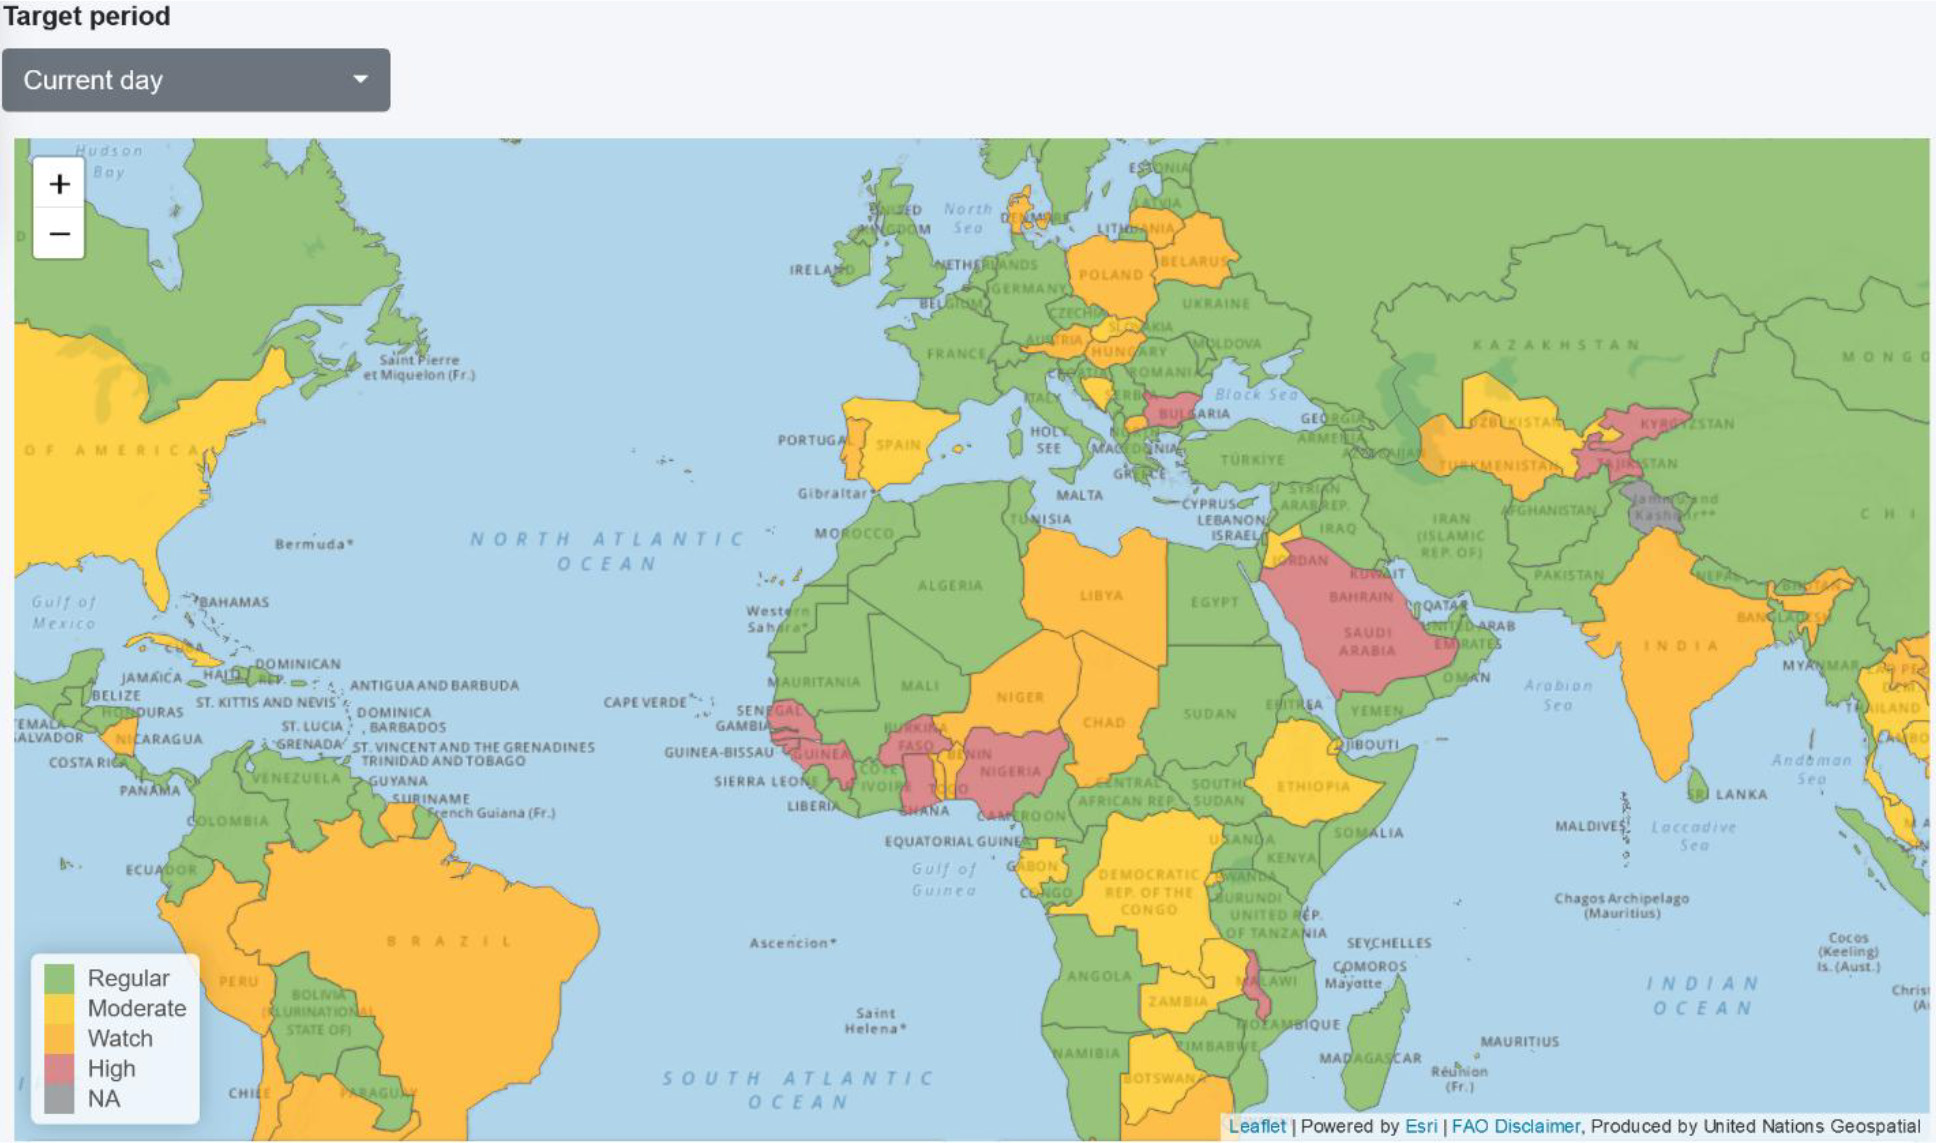
Figure 4.
Stacked area chart that displays the daily percentage of countries and territories categorized by levels of food price alerts over time, spanning from April 2023 to January 2024. The categories are encoded by color: green represents “Regular”, orange signifies “Moderate”, yellow indicates “Watch”, and red denotes “High”. Please see the online version to view the color image.
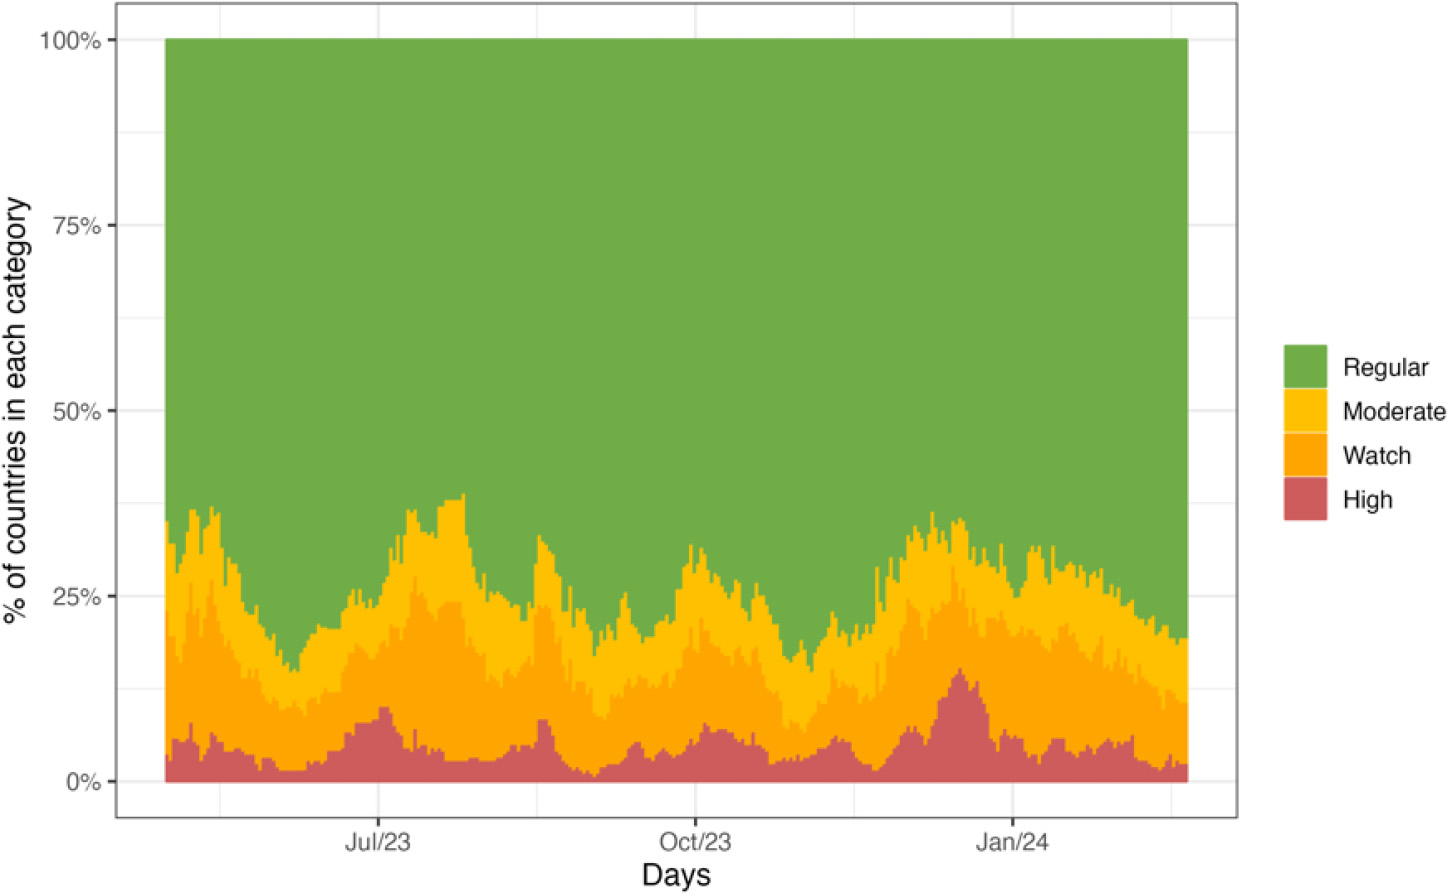
Figure 5.
Historical price data of the fourteen food items tracked by the tool presented as small multiples chart line. This image was obtained from the Data Lab Food Prices Monitor on 23rd February 2023. Please see the online version to view the color image.
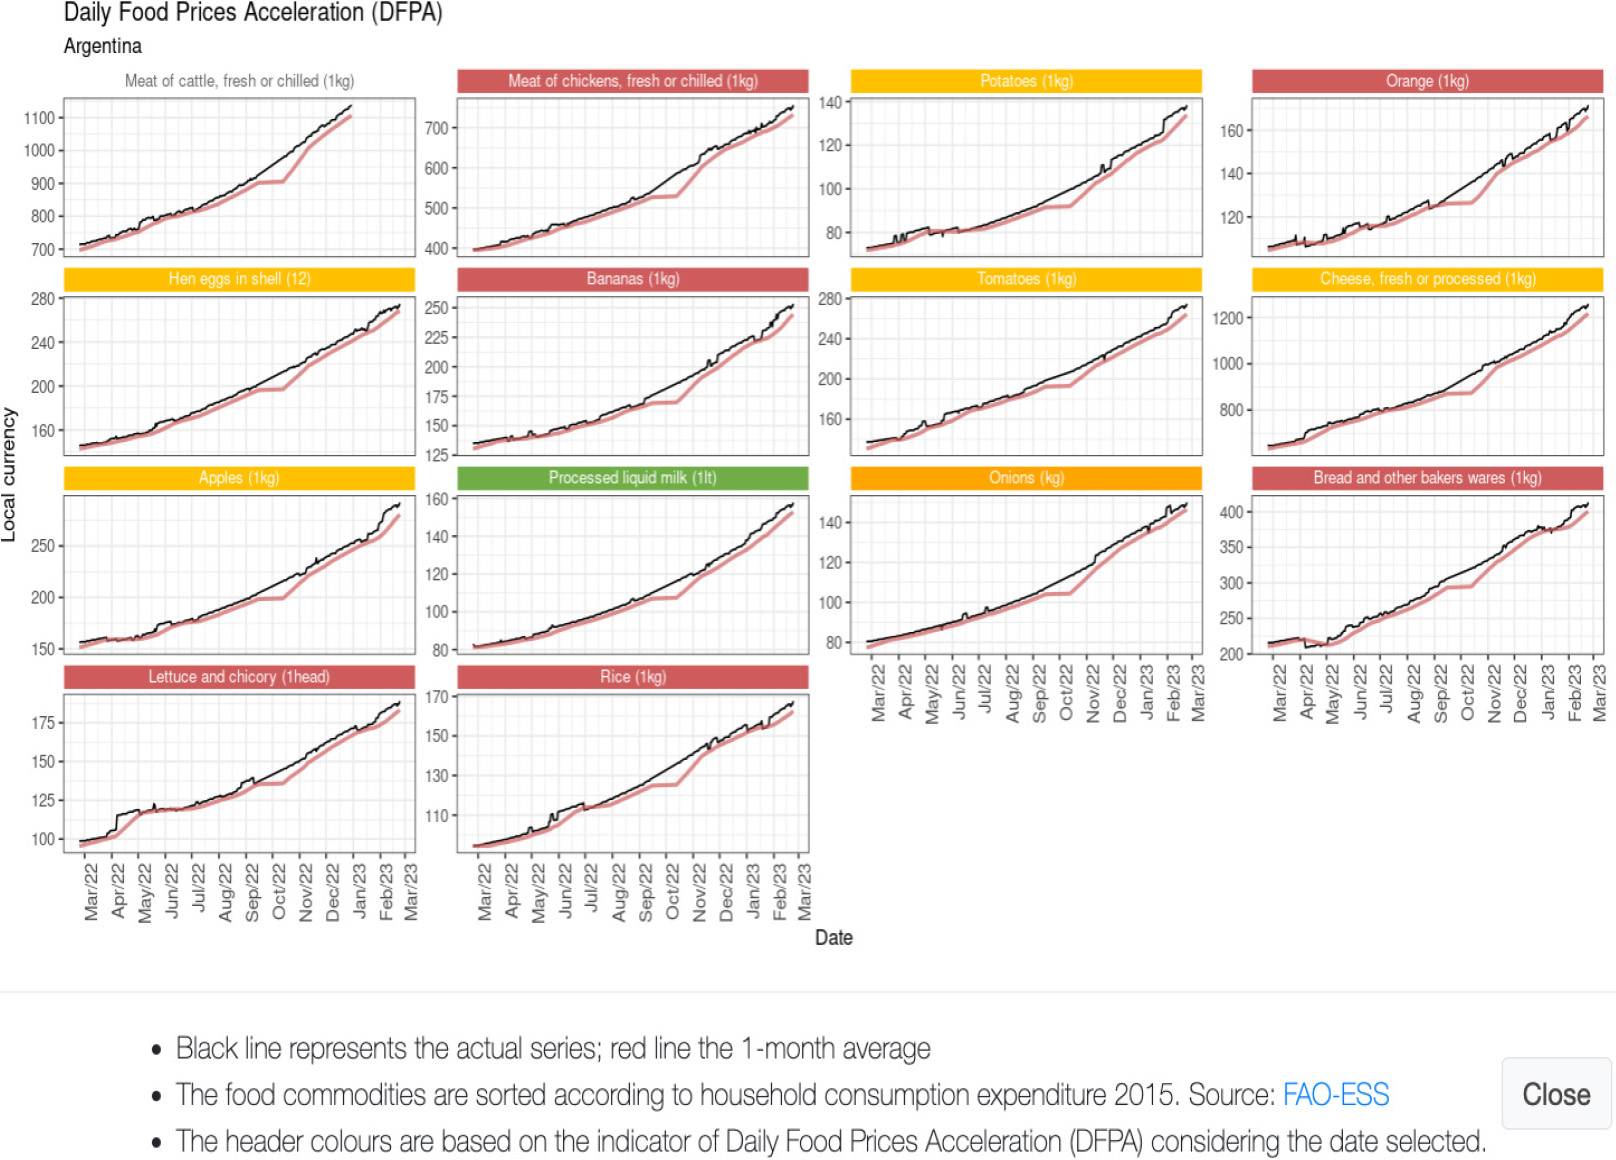
Figure 3 illustrates the Daily Food Prices Acceleration Module as of 23 February 2023, where the map represents the price acceleration indicator categorized in accordance with Eq. (5). In addition to the map, two other visualizations are included: a lollipop chart depicting the top 20 countries and territories ranked by the indicator value, and a searchable table presenting each geographical area’s indicator value and its corresponding category. The tool also allows users to compare the indicator across three time frames: the present day, one week prior, and one month prior.
According to the Daily Food Prices Acceleration Module, at the time of computation, Argentina and Bolivia in South America were facing a significant increase in food prices (Fig. 3) classified as “High”, meaning that the prices of fourteen food commodities of the past 30 days surpassed the maximum threshold defined in Eq. (5). The map also highlighted several African nations, including Zambia, Tanzania, and Malawi, under “Watch.” This category denotes a need for vigilance due to the rising trends in the prices.
The indicator at country and territory level is helpful to identifying areas of the world that may be facing a possible anomaly in food prices. While aggregated data can provide a quick overview of the global food price situation, a more detailed view can offer additional insights. The tool allows users to view the price trends of the last year for all the fourteen food products by clicking on the geographical area. This data is displayed using a “small multiples” layout, where each item’s price series is shown in a small line chart. Figure 5 shows the example for Argentina. Note that the items are ordered according to their share in household consumption expenditure in 2015 for the given geographical area and may vary across areas. The colours at the top of each line chart encode the same classification system used in the map and defined in Eq. (5). In addition to the historical price (black line), the one-month moving average of the price (red line) is also included in the chart, which gives a smoothed version of the prices that can be used to interpret if the current price is also above its monthly average.
We analyzed the distribution of alert categories based on the number of territories by calculating the daily proportion of territories in each category. Figure 4 illustrates that most countries and territories remained in the “Regular” category throughout the observed period, as indicated by the predominant green area. This means that food prices were within expected ranges without significant cause for concern. The “Watch” and “Moderate” categories seem to follow a cyclical pattern, showing some fluctuation with peaks suggesting that at certain intervals, a higher percentage of countries and territories experienced elevated food price alerts that warranted attention but were not severe. These fluctuations could indicate seasonal patterns or responses to specific events affecting food prices. The “High” alert level, indicated in red, occupies the smallest area at the bottom of the chart, which suggests that the percentage of countries and territories experiencing high food price alerts is relatively low compared to the other categories. However, this category has been noticeable throughout the period, implying that a few countries and territories consistently face significant food price challenges.
The Daily Food Price Acceleration was demonstrated to help detect relevant early signals in rapidly increasing food prices. Moreover, the examples confirmed that policymakers and analysts could use the indicator to guide their analysis to quickly understand the reasons behind the signals. Additionally, both modules, DFPA and Nowcasting, corroborate the results of each other by showing a trend of stability in food prices in the two indicators globally. They also show some regions that need more attention on soaring food prices. While space limitations preclude the inclusion of additional examples in this paper, readers are encouraged to conduct their own analysis using the link provided at the beginning of the section.
6.Conclusions
The global crises that unfolded recently have had significant negative impacts on the most vulnerable populations, leading to displacements and limited access to nutritious and healthy diets. To provide timely information that may help address these challenges, we have proposed a methodology to help anticipate actions in response to soaring food prices by producing a global early warning tool. The tool comprises two modules: the nowcasting model of monthly food price inflation and the daily food prices monitor, both of which have unique methodologies, as detailed in this paper. The proposal is innovative in its use of a daily updated non-conventional database underpinning the methodologies and the tool. The daily updated database features the prices of fourteen food items and the Twitter sentiment index used in the nowcasting model. Moreover, unlike most other proposals in the academic literature, our tool covers almost all countries in the world, making it effective for monitoring the global economy.
The two proposed methods, the nowcasting model and the daily food price acceleration, have been designed to complement each other. The nowcasting model provides timely food-inflation statistics, thereby reducing the publication lag of official statistics. The daily food price acceleration detects early abnormal food price increases, enabling stakeholders to take timely action. The relevance of both products lies in their ability to quickly and automatically extract insights from data, which is crucial in emergencies. The complementary nature of these methods can potentially enhance the effectiveness of detecting potential disruption of food prices.
The results shown in this paper demonstrate that the methods and the tool have significant potential to support policymakers and analysts in efficiently drawing insights from data. A better overview of current food prices can help detect rapid changes and anticipate the development of appropriate strategies to mitigate their impact. In addition, the visual aids coupled with the categories system can help the general public to rapidly interpret the indicators, making these findings more accessible to all.
One possible limitation of our proposal is that it does not provide direct explanations of the factors that affect food inflation. A sudden spike in the food prices will immediately produce a signal in the tool, but it will be up to the users to investigate the reasons that drive such behaviour. Identifying the drivers was not the initial goal of our work, which is aimed at providing timely estimates of official food price inflation and detecting abnormal dynamics in food prices. However, we consider that such a feature would be useful, and we may introduce it into the tool at a later stage. For instance, we could use the methods proposed in this paper to find the alerts and isolate the countries and territories associated to them, then search the topics related to the food prices over the news database to identify the events associated to the alert.
Some upgrades to our methods are planned in the near future. First, we intend to source news directly from newspapers’ websites instead of Twitter (now X), in response to the new restrictive access policies recently put in place, and to avoid potential bias from selectively curated content [46]We are setting up a news database for this purpose and integrating it with our existing Twitter-sourced data. Second, we aim to enhance our text-based indicator by, on the one hand, replacing the current lexicon-based sentiment approach with a Large Language Model, capable of understanding language and contextual nuances in document corpora [47], and, on the other hand, incorporate an indicator that measures the popularity of the topic of prices, such as the intensity of it mentioned in the news [37]. Third, we intend to investigate the inclusion of additional timely variables in our model, such as weather anomalies or extreme events [48, 49, 50].
Notes
2 We chose to include
Acknowledgments
We would like to thank Pietro Gennari, Editor-in-Chief of the Statistical Journal of the IAOS, for the smooth revision process. We are grateful for constructive comments and suggestions made by the SJIAOS Guest Editor, three anonymous referees, colleagues from FAO’s Data Lab and the ESS and EST Divisions of FAO, as well as participants in the Ninth International Conference on Agricultural Statistics (ICAS-IX) where a preliminary version of this work was presented.
References
[1] | OECD. COVID-19 and food systems: Short- and long-term impacts. Paris, France: OECD; (2021) . Report No.: 166. |
[2] | Bouis HE, Eozenou P, Rahman A. Food prices, household income, and resource allocation: socioeconomic perspectives on their effects on dietary quality and nutritional status. Food and Nutrition Bulletin. (2011) ; 32: (1 Suppl): S14-S23. |
[3] | Nourou M. Human development effects of large changes in food prices: Does openness policy matter? The Journal of International Trade and Economic Development. (2015) ; 24: (5): 591-615. |
[4] | Ha J, Kose MA, Ohnsorge F. Inflation in emerging and developing economies: Evolution, drivers, and policies. Washington, DC: World Bank; (2019) . Report No.: doi: 10.1596/978-1-4648-1375-7. |
[5] | Headey DD, Martin WJ. The impact of food prices on poverty and food security. Annual Review of Resource Economics. (2016) ; 8: : 329-351. |
[6] | Ivanic M, Martin W. Implications of higher global food prices for poverty in low-income countries. Agricultural Economics. (2008) ; 39: : 405-416. |
[7] | Green R, Cornelsen L, Dangour AD, Turner R, Shankar B, Mazzocchi M, et al. The effect of rising food prices on food consumption: Systematic review with meta-regression. BMJ. (2013) ; 346. |
[8] | De Hoyos RE, Medvedev D. Poverty effects of higher food prices: a global perspective. Review of Development Economics. (2011) ; 15: (3): 387-402. |
[9] | FAO. Food outlook: Biannual report on global food markets. Rome, Italy: FAO; (2022) . Report No.: 978-92-5-136028-6. |
[10] | FAO, IFAD, UNICEF, WFP, WHO. The state of food security and nutrition in the world 2021. Transforming food systems for food security, improved nutrition and affordable healthy diets for all. Rome, Italy: FAO; (2021) . |
[11] | Baquedano FG. Developing an indicator of price anomalies as an early warning tool: A compound growth approach. Rome, Italy: FAO, EST/GIEWS; (2015) . |
[12] | Araujo C, Araujo-Bonjean C, Brunelin S. Alert at Maradi: Preventing food crises by using price signals. World Development. (2012) ; 40: (9): 1882-1894. |
[13] | Jaworski K. Measuring food inflation during the COVID-19 pandemic in real time using online data: A case study of Poland. British Food Journal. (2021) ; 123: : 260-280. |
[14] | Macias P, Stelmasiak D, Szafranek K. Nowcasting food inflation with a massive amount of online prices. International Journal of Forecasting. (2023) ; 39: (2): 809-826. |
[15] | Adewopo JB, Solano-Hermosilla G, Colen L, Micale F. Using crowd-sourced data for real-time monitoring of food prices during the COVID-19 pandemic: Insights from a pilot project in northern Nigeria. Global Food Security. (2021) ; 29: : 100523. |
[16] | Aparicio D, Bertolotto MI. Forecasting inflation with online prices. International Journal of Forecasting. (2020) ; 36: (2): 232-247. |
[17] | Yadav V, Das A. Nowcasting inflation in India with daily crowd-sourced prices using dynamic factors and mixed frequency models. Applied Economics Letters. (2023) ; 30: (2): 167-177. |
[18] | Seabold S, Coppola A. Nowcasting prices using Google trends: An application to Central America. World Bank Policy Research Working Paper. (2015) ; (7398). |
[19] | Cárdenas-Cárdenas JA, Caicedo-García E, Molano ERG. Estimación de la variación del precio de los alimentos con modelos de frecuencias mixtas. Borradores de Economía; No. 1109. (2020) . |
[20] | Pramana S, Yuniarto B, Kurniawan R, Yordani R, Lee J, Amin I, et al. Big data for government policy: Potential implementations of bigdata for official statistics in Indonesia. In International Workshop on Big Data and Information Security (IWBIS); Jakarta, Indonesia. (2017) ; 17-21. |
[21] | Tilly S, Ebner M, Livan G. Macroeconomic forecasting through news, emotions and narrative. Expert Systems with Applications. (2021) ; 175: : 114760. |
[22] | Fosten J, Greenaway-McGrevy R. Panel data nowcasting. Econometric Reviews. (2022) ; 41: (7): 675-696. |
[23] | Stundziene A, Pilinkiene V, Bruneckiene J, Grybauska A. Future directions in nowcasting economic activity: A systematic literature review. Journal of Economic Surveys. (2023) ; doi: 10.1111/joes.12579. |
[24] | Banbura M, Giannone D, Reichlin L. Nowcasting. ECB Working Paper. (2010) ; Report N. 1275. |
[25] | Bai Y, Costlow L, Ebel A, Laves S, Ueda Y, Volin N, et al. Review: Retail consumer price data reveal gaps and opportunities to monitor food systems for nutrition. Food Policy. (2021) ; 104: (102148). |
[26] | Kaklauskas A, Zavadskas EK, Radzeviciene A, Ubarte I, Podviezko A, Podvezko V, et al. Quality of city life multiple criteria analysis. Cities. (2018) ; 72: : 82-93. |
[27] | Laframboise N, Mwase N, Park J, Zhou Y. Revisiting tourism flows to the caribbean: What is driving arrivals? IMF Working Paper. (2014) ; 14/229. |
[28] | Helble M, Lee KO, Gia Arbo MA. How (Un)affordable is housing in developing Asia? International Journal of Urban Sciences. (2021) ; 25: (sup1): 80-110. |
[29] | Sun Y, Gao P, Raza SA, Shah N, Sharif A. The asymmetric effects of oil price shocks on the world food prices: Fresh evidence from quantile-on-quantile regression approach. Energy. (2023) ; 126812. |
[30] | Pasaogullari M, Waiwood P. Do oil prices predict inflation? Federal Reserve Bank of Cleveland, Economic Commentary. (2014) ; 1. |
[31] | Nazlioglu S, Soytas U. Oil price, agricultural commodity prices, and the dollar: A panel cointegration and causality analysis. Energy Economics. (2012) July; 34: : 1098-1104. |
[32] | Diab S, Karaki MB. Do increases in gasoline prices cause higher food prices? Energy Economics. (2023) ; 107066. |
[33] | Yeboah O, Shaik S, Quaicoe O. Evaluating the causes of rising food prices in low and middle income countries. Journal of Agricultural and Applied Economics. (2015) ; 44: (3). |
[34] | Gilbert CL. How to understand high food prices. Journal of Agricultural Economics. (2010) ; 61: (2). |
[35] | Kalamara E, Turrell A, Redl C, Kapetanios G, Kapadia S. Making text count: Economic forecasting using newspaper. Journal of Applied Econometrics. (2022) ; 37: (5): 896-919. |
[36] | Aprigliano V, Emiliozzi S, Guaitoli G, Luciani A, Luciani J, Monteforte L. The power of text-based indicators in forecasting Italian. International Journal of Forecasting. (2023) ; 39: : 791-808. |
[37] | Lamla MJ, Lein SM. The role of media for consumers’ inflation expectation. Journal of Economic Behavior and Organization. (2014) ; 106: : 62-77. |
[38] | Catanese E, Scannapieco M, Bruno M, Valentino L. Natural language processing in official statistics: The social mood on economy index experience. Statistical Journal of the IAOS. (2022) ; 38: (4): 1451-1459. |
[39] | Angelico C, Marcucci J, Miccoli M, Quarta F. Can we measure inflation expectations using Twitter? Journal of Econometrics. (2022) ; 228: : 259-277. |
[40] | Muñoz-Martínez JA, Orozco D, Ramos-Veloza MA. Tweeting inflation: Real-time measures of inflation perception in Colombia. Borradores de Economía. (2023) ; 1256. |
[41] | Kim J, Cha M, Lee JG. Nowcasting commodity prices using social media. PeerJ Computer Science. (2017) ; 3: (e126). |
[42] | Laurie Davies UG. The identification of multiple outliers. Journal of the American Statistical Association. (1993) September; 88: (423): 782-792. |
[43] | Casella G, Berger RL. Statistical inference: Second edition: Cengage Learning; (2021) . |
[44] | Reagan AJ, Danforth CM, Tivnan B, Williams JR, Dodds PS. Sentiment analysis methods for understanding large-scale texts: a case for using continuum-scored words and word shift graphs. EPJ Data Science. (2017) ; 6: (28). |
[45] | Chen Y, Skiena S. Building sentiment lexicons for all major languages. In 52nd Annual Meeting of the Association for Computational Linguistics; (2014) ; Baltimore, Maryland, USA: Proceedings of the 52nd Annual Meeting of the Association for Computational Linguistics (Short Papers). 383-389. |
[46] | Soroka S, Daku M, Hiaeshutter-Rice D, Guggenheim L, Pasek J. Negativity and positivity biases in economic news coverage: Traditional versus social media. Communication Research. (2018) ; 45: (7). |
[47] | Huang AH, Wang H, Yang Y. FinBERT: A large language model for extracting information from financial text. Contemporary Accounting Research. (2023) ; 40: (2): 806-841. |
[48] | Heinen A, Khadan J, Strobl E. The price impact of extreme weather in developing countries. The Economic Journal. (2019) April; 129: (619): 1327-1342. |
[49] | Letta M, Montalbano P, Pierre G. Weather shocks, traders’ expectations, and food prices. Americal Journal of Agricultural Economics. (2021) ; 104: (3): 1100-1119. |
[50] | Cavallo A, Cavallo E, Rigobon R. Prices and supply disruptions during natural disasters. The Review of Income and Wealth. (2014) November; 60: (S2): S449-S471. |


