
Now is the time to close gaps in governance statistics – And the Praia Group is ready for the challenge
Abstract
Created in 2015 by the United Nations Statistical Commission, the Praia Group on Governance Statistics aims “to contribute to establishing international standards and methods for the compilation of statistics on the major dimensions of governance”. The Praia Group has recently created two “Task Teams” led by national statistical offices from around the world – one on Non-Discrimination and Equality, and one on Participation in Political and Public Affairs – whose aim is to advance the development of international statistical guidance, standards and instruments to measure these two dimensions. This article reviews the work accomplished so far by each Task Team to develop internationally harmonized model survey questionnaires on these two dimensions, in order to enable the production of comprehensive survey-based statistics on Discrimination and Participation that are comparable across different cultures, languages and development contexts, and over time.
1.Investing in another type of vaccine: The value of governance statistics in a crisis such as COVID-19
The global COVID-19 pandemic was first and foremost a public health emergency – but it was far more. It was also a governance crisis. Governments faced daunting responsibilities as they needed to design, implement and enforce measures to prevent the spread of the disease. When such measures failed to integrate the principles of equality, accountability and participation, people’s trust in public institutions suffered, which in turn weakened governments’ ability to respond rapidly and to secure citizen support and compliance. This led to an unprecedented need and demand for governance data. “Is testing and medical treatment for COVID-19 accessible to everyone without discrimination?” “What are the most common justice problems created or exacerbated by the pandemic for which people need help?” “To what extent are patients resorting to paying bribes to receive medical care before those unable to pay?” Confronting leaders across the world, these headline-grabbing questions could only be responded to if timely and reliable governance statistics were available – and more often than not, they were not.
To date, few national statistical offices (NSOs) have invested in the production of governance statistics, for a host of legitimate reasons. For one, they struggle to find internationally adopted methodologies to produce official statistics on the various dimensions of governance. They also wrestle with severe budget cuts, which can make it more challenging to start producing new types of statistics. This is creating a dangerous ‘blind spot’ in our information landscape: if we don’t have the statistical means to know whether our public institutions are serving the public equitably and whether they are responsive to the needs of everyone, if we don’t have a statistical assessment of the extent to which people feel they have a say in public decision-making, and the extent to which they trust their leaders to govern with their best interest at heart (both of which are essential for securing public support for emergency measures and recovery policies), how can we ensure that the trillions of dollars currently being spent on COVID-19 recovery will not go wasted?
Thus blindfolded, policymakers have been slow to detect flashpoints that quickly degenerated into civil unrest and violence, for example in reaction to the stark inequalities laid bare by the crisis or to emergency powers overreach. Meanwhile, the media, national oversight institutions and civil society groups have been ill-equipped to hold their government to account on its commitment to assist the most in need and to ‘build back better’.
We must address this blind spot if we want to come out of this crisis with improved institutions. Even in a time of fiscal constraint, investing in the expertise and systems needed to collect more and better data on prime-time governance issues is a smart long-term investment. Strengthening national governance data infrastructures will serve us now and will also prepare our systems to better respond to future shocks.
This is the utmost priority of the Praia Group on Governance Statistics. Created in 2015 by the United Nations Statistical Commission (UNSC), the Praia Group aims “to contribute to establishing international standards and methods for the compilation of statistics on the major dimensions of governance.”11 In March 2020, the Group published the first-ever Handbook on Governance Statistics, which provides guidelines on compiling official statistics on eight dimensions of governance, namely: non-discrimination and equality; participation in political and public affairs; openness; access to and quality of justice; responsiveness; absence of corruption; trust; and safety and security.
The United Nations Development Programme (UNDP), in view of its long-standing commitment to strengthening national capacities for the production governance data, has been a close partner to the Praia Group since its creation. As a custodian agency for four SDG indicators under SDG 16,22 UNDP is particularly aware of the vast interest there is at country level for establishing strong governance data systems, and for joining an NSO-led forum such as the Praia Group to access the technical expertise and practical experience that resides in statistical offices across the world.
In September 2020, the Praia Group, with UNDP’s support, published a sequel to the Handbook that looks specifically at the governance challenges posed by COVID-19 in each of the eight dimensions of governance identified in the Handbook. In a set of eight thematic briefs, this Guidance Note on Governance Statistics in the COVID-19 Era provides advice to statisticians on what specific statistics could be useful to help address the governance questions most likely to arise during this pandemic or similar crises prone to happen in the future. The Guidance Note also keeps in mind the acute operational constraints faced by NSOs and other governance data producers when faced with a crisis such as COVID-19 – such as their greatly reduced mobility for data collection and declining funding for statistical production. This makes the resource applicable not only to the current COVID-19 pandemic, but also to other multidimensional crises that may arise in the future, and that will require a similarly robust governance response.
2.The Praia Group’s second term: Translating the Handbook on Governance Statistics into action on the ground
For its second term, running from 2020 to 2025, the UN Statistical Commission (UNSC) has requested the Praia Group to “further develop the conceptualization of governance statistics, further improve methodology and standardization, [and] add practical experiences.”33
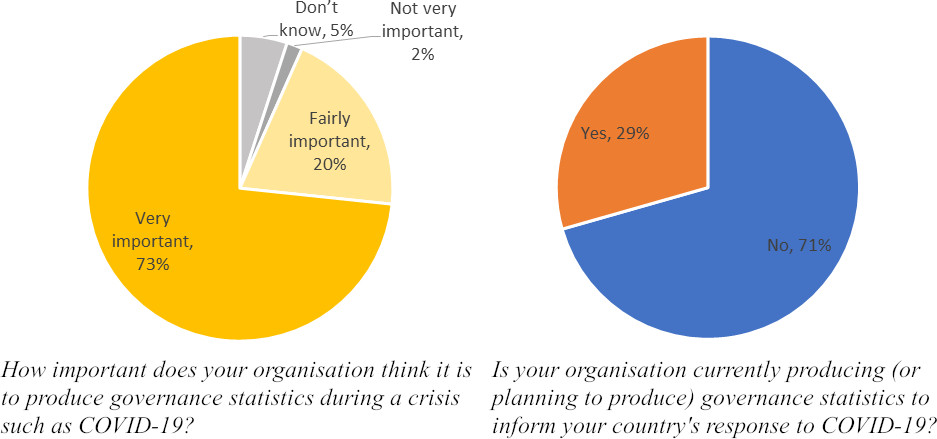
In October 2020, the Praia Group Secretariat, with the support of UNDP, launched an extensive consultation of its members and other relevant actors in the field of governance statistics to collect views and recommendations on what would be useful for the Group to produce over the next four years to address this request by the UNSC. This consultation confirmed the high interest of Praia Group members in producing governance statistics, but their inability, at this point in time, to produce such statistics (see Fig. 1).
Figure 1.
A high interest for governance statistics but actual production remains low.
In the same consultation, members recognized the Handbook as a key achievement of the Praia Group’s first term, but also underlined their need for more operational guidance, especially in relation to dimensions that still lack internationally recognized standards and readily available harmonized methodologies.
In response to this demand, and in continuation with its standard-building function, the Praia Group committed in its second term to support the development of standardized methodologies for dimensions of governance that are methodologically less advanced than others, such as corruption or criminal justice.66 This led to the creation of two “Task Teams” on Non-Discrimination and Equality, and Participation in Political and Public Affairs, whose aim is to advance the development of international statistical guidance, standards and instruments to measure these two dimensions. Participation and Non-Discrimination were also selected because they represent central pillars of a resilient recovery from COVID-19, and because a number of emerging issues, such as people’s experiences with new online platforms for political engagement, or the impact on digitally excluded populations of public services and participation channels moving online, are not always well captured in existing international and regional survey questionnaires.
Established in November 2021, the Task Teams are co-led by two NSOs – one from the North and one from the South – and constituted by more than 150 members each,77 including national statisticians (accounting for roughly 50% of members) but also other governance data practitioners from international and regional organizations, academia and civil society/advocacy organizations. Dedicated technical support is provided by UNDP and UN Women to the Task Team on Participation, and by UNDP and the Office of the High Commissioner for Human Rights (OHCHR) to the Task Team on Non-Discrimination. Each Task Team aims to develop two products. The first one is a model survey questionnaire on the dimension of interest, with core and optional questions, to enable the production of comprehensive survey-based statistics on Discrimination and Participation that are comparable across different cultures, languages and development contexts, and over time. These model questionnaires are intended to be used as stand-alone surveys or as survey modules integrated in larger surveys run by NSOs. A modular approach may be favored in view of its cost-saving benefits, which is critical for NSOs to be able to produce such statistics on a regular basis.
The second product is a guide on the collection and use of administrative data to produce statistics on Discrimination and Participation, with recommendations on data registration practices, data comparability, quality assurance, data-sharing, linking with other sources, indicator calculation, and data use, among other issues. Demand for such guidance among Praia Group members has increased significantly since the COVID-19 pandemic, which interrupted almost all face-to-face survey operations worldwide. In addition to making the production of governance statistics more resilient in times of crises, key advantages of using administrative data include its high disaggregation potential and its accessibility at any point in time.
So far, both Task Teams have followed similar steps to design the two model questionnaires. Each Task Team started by fleshing out a conceptual and measurement framework, building on the preliminary frameworks presented in the Praia Group’s Handbook. These frameworks served to identify those areas of measurement whose primary sources are household surveys, which should be covered in the model questionnaires, and other areas of measurement that are best measured with administrative data sources, which are covered in the guides on the collection and use of administrative data.
The Task Teams then conducted extensive mappings of relevant global, regional and national survey questionnaires that have a focus on Non-Discrimination and Equality (such as the World Values Survey, the Gallup survey, the Latinobarometro, the Eurobarometer module on Discrimination in the EU, the EU-MIDIS II questionnaire, the questionnaire developed by the Princeton University’s PERLA Project on Ethnicity and Race in Latin America, the national discrimination survey of Mexico (ENADIS), the Canadians’ Safety 2020 survey, to name a few) and on Participation in Political and Public Affairs (such as Africa’s SHaSA survey on Governance, Peace and Security, the Arab Barometer, the European Social Survey, the LAPOP AmericasBarometer survey, the US General Social Survey, to name a few more). NSOs and other organizations with relevant expertise were then invited to share experiences and recommendations with the Task Team.88
Several webinars were then dedicated to the actual design of the questionnaire. Following the technical approach proposed by Harkness et al. (2010),99 the Task Teams designed the model questionnaires by 1) adopting (replicating) relevant existing questions in use in other questionnaires, 2) adapting (modifying) existing questions as necessary, and 3) developing new questions in areas not yet covered by existing surveys. Most questions in the model questionnaires are based on relevant questions already in use, adapted through discussions with Task Team members. When considering different formulations of a given question, members were invited to consider aspects related to comprehension, cognitive processing, cross-cultural sensitivity, and applicability of the wording to different national contexts and in different languages. Members of each Task Team voluntarily gathered on a monthly basis over the course of eight webinars to comment on drafts and to review written feedback received from members in-between meetings. This highly participatory survey design process was not only essential to ensure the applicability of the questionnaires in a diversity of cultural, social and political contexts, but it also imparted a strong sense of ownership among members over the survey design process.
The questionnaires include two categories of questions: ‘core’ questions that are recommended to be administered by all countries, following the sequence of questions as laid out in the questionnaire, and optional questions that NSOs may wish to add, depending on questionnaire space, national information needs and resources available to conduct a longer survey. As stated before, one important aim of these harmonized questionnaires is to enable the production of comparable statistics by NSOs across the world. As such, NSOs are instructed to minimize the number of changes made to the questionnaires. Nevertheless, NSOs should still consider the applicability of each question within their country’s socio-cultural and political contexts, and should document any national adaptation made to the questionnaires, such as the addition of country-specific response categories in question items that need a higher degree of contextualization.
Questionnaire pre-testing was identified by both Task Teams as one of the most critical steps in designing the model questionnaires, as it will ensure that the questionnaires maintain their measurement equivalence and cross-cultural equivalence, even when administered in different languages and across different cultures. In 2023, the two draft questionnaires will undergo an extensive review process, including expert appraisals and cognitive testing by a range of NSOs in different regions and different development contexts. The revised questionnaires will then be field-tested in 2024, and the final versions are scheduled to be submitted to the UNSC in March 2026, when the Praia Group concludes its second term and delivers its final report to the UNSC.
3.Task Team on Non-Discrimination and Equality
The Task Team on Non-Discrimination and Equality is co-led by INEI Peru, which over the past decade has conducted several surveys to investigate experiences of discrimination by different population groups1010, and FinStat, a world leader in this area, having worked closely with various ministries and agencies since 2008 to run a national discrimination monitoring system.1111
At its first meeting, the Task Team noted that even while the elimination of discrimination is central to the 2030 Agenda for Sustainable Development, with “leave no one behind” as the main transformative promise of the Agenda, very few countries systematically collect data on various grounds of discrimination and for various areas of life covered by national and international equality and non-discrimination legislation. The Task Team also reflected on the many ways in which the compilation and use of discrimination and inequality statistics are indispensable to countries, 1) to enable the proper assessment of the implementation of relevant national legal and policy frameworks on equality and non-discrimination; 2) to monitor trends in equality between different groups across different areas of life to enhance evidence-based policy making (e.g. employment rate across different groups, percentage of persons in tertiary education across different groups, or percentage of early school leavers across different groups); 3) to monitor the compliance of countries with relevant international human rights standards, such as the UN Convention on the Rights of Persons with Disabilities and the UN Convention on the Elimination of All Forms of Racial Discrimination; and 4) to support advocacy and awareness-raising in the field of equality and non-discrimination.
The Task Team also considered several challenges and shortcomings of current data collection practices – both through surveys and through the collection of administrative data – which are affecting the coverage, quality and usability of such data for compiling statistics on discrimination and inequalities:
• Data collection bodies at national level are not always coordinated or connected with each other, and as a result, data that could be used to reveal discrimination and inequalities is not linked and not used to its full potential;
• Data on discrimination, harassment and hate crimes often is not comparable, both within and across countries, due to a lack of consistency and coherence in definitions, classifications and categorisations used by various data sources;
• There is an imbalance in data collected on different grounds of discrimination, with gender and age being the most developed, disability gradually improving, and racial or ethnic origin, religion or belief, sexual orientation and gender identity being the least developed;
• There is an imbalance in data collection across different areas of life, with employment typically the area where most discrimination and inequality data is collected;
• Data is rarely collected on multiple, intersecting grounds of discrimination (e.g. data collected in the area of disability rarely includes information on ethnic or racial origin, age and other potential characteristics that might lead to a higher risk of discrimination based on multiple factors);
• Certain populations may be systematically excluded from administrative systems – and therefore, from datasets; and
• Data protection laws are often wrongly understood as prohibiting the collection of sensitive personal data e.g. on ethnic origin, religion or sexual orientation.
Figure 2.
Conceptual and measurement framework on non-discrimination and equality: areas for statistical measurement and data sources.
| Data sources | ||
| Areas for statistical seasurement | Administrative data | Household or population surveys |
| Experiences and Perceptions of Discrimination and Harassment | ||
| A.1. Prevalence of discrimination or harassment, by grounds of discrimination prohibited under international human rights law (incl. by multiple grounds) | Yes, police & court records, national human rights institutions (NHRIs), equality bodies & Ombuds institutions, other relevant reporting mechanisms | Yes |
| A.2. Different domains (“areas of life”) where discrimination or harassment typically occurs (e.g. health, education, justice and personal security, living standards, work, participation, etc.) | Yes, but limited information (depends on comprehensiveness of data collection by reporting mechanisms) | Yes |
| A.3. Relationship to the person who committed the discrimination act | Yes, but limited information (depends on comprehensiveness of data collection by reporting mechanisms) | Yes |
| A.4. Effects of discrimination or harassment on the person (e.g. effects on victims’ sense of insecurity, mental health, on going to work/school, etc.) | Police and court databases may include data on the damage caused, e.g. if the victim makes a claim for compensation or otherwise seeks damages | Yes |
| A.5. Perceived prevalence of discrimination and harassment against relevant groups at risk | No | Yes |
| Hate crimes and hate speech | ||
| B.1. Prevalence of hate crimes (e.g. homicide, assaults, property damage, etc.) and hate speech (esp. on online platforms), by type of bias motivation and type of offense | Yes, police & court records, national human rights institutions (NHRIs), equality bodies & Ombuds institutions, relevant monitoring mechanisms, etc. | Yes |
| B.2 Perceived prevalence of hate crimes against relevant groups at risk, by type of bias motivation and type of offense | No | Yes |
| Reporting and Sentencing of Discrimination, Harassment and Hate Crimes | ||
| C.1. Reporting of discrimination, harassment and hate crimes by victims and witnesses to relevant authorities, by type of authority | Yes, police & court records, national human rights institutions (NHRIs), equality bodies & Ombuds institutions, relevant reporting mechanisms, etc. | Yes |
| C.2. Reasons for non-reporting discrimination, harassment and hate crimes | No | Yes |
| C.3. Satisfaction with the way the report/complaint was handled | No | Yes |
| C.4. Convictions of discrimination, harassment and hate crime cases and reparations provided to victims | Yes, court records | No |
| Attitudes towards minority groups | ||
| D.1. Degree of ‘closeness to’ or ‘acceptability’ towards different social or ethnic/racial groups, including groups at risk of discrimination (Bogardus social distance scale) | No | Yes |
| D.2. Attitudes on equal treatment of groups, multiculturalism, integration | No | Yes |
| Promotion of equality and non-discrimination | ||
| E.1. Public awareness of national efforts aimed at fighting discrimination and promoting equality | No | Yes |
| E.2. Effectiveness of national efforts aimed at fighting discrimination and promoting equality | Yes, police & court records, national human rights institutions (NHRIs), equality bodies & Ombuds institutions, relevant reporting mechanisms, etc. | Yes |
| Indirect discrimination | ||
| F.1. Prevalence of indirect discrimination against certain population groups, by grounds of discrimination (e.g. statistics on school attendance, educational attainment, labour market participation, income, wealth, housing, social security and social benefits, access to other public services, etc.) | Yes, relevant administrative registers linked with population register | Yes (census & othersocioeconomic surveys) |
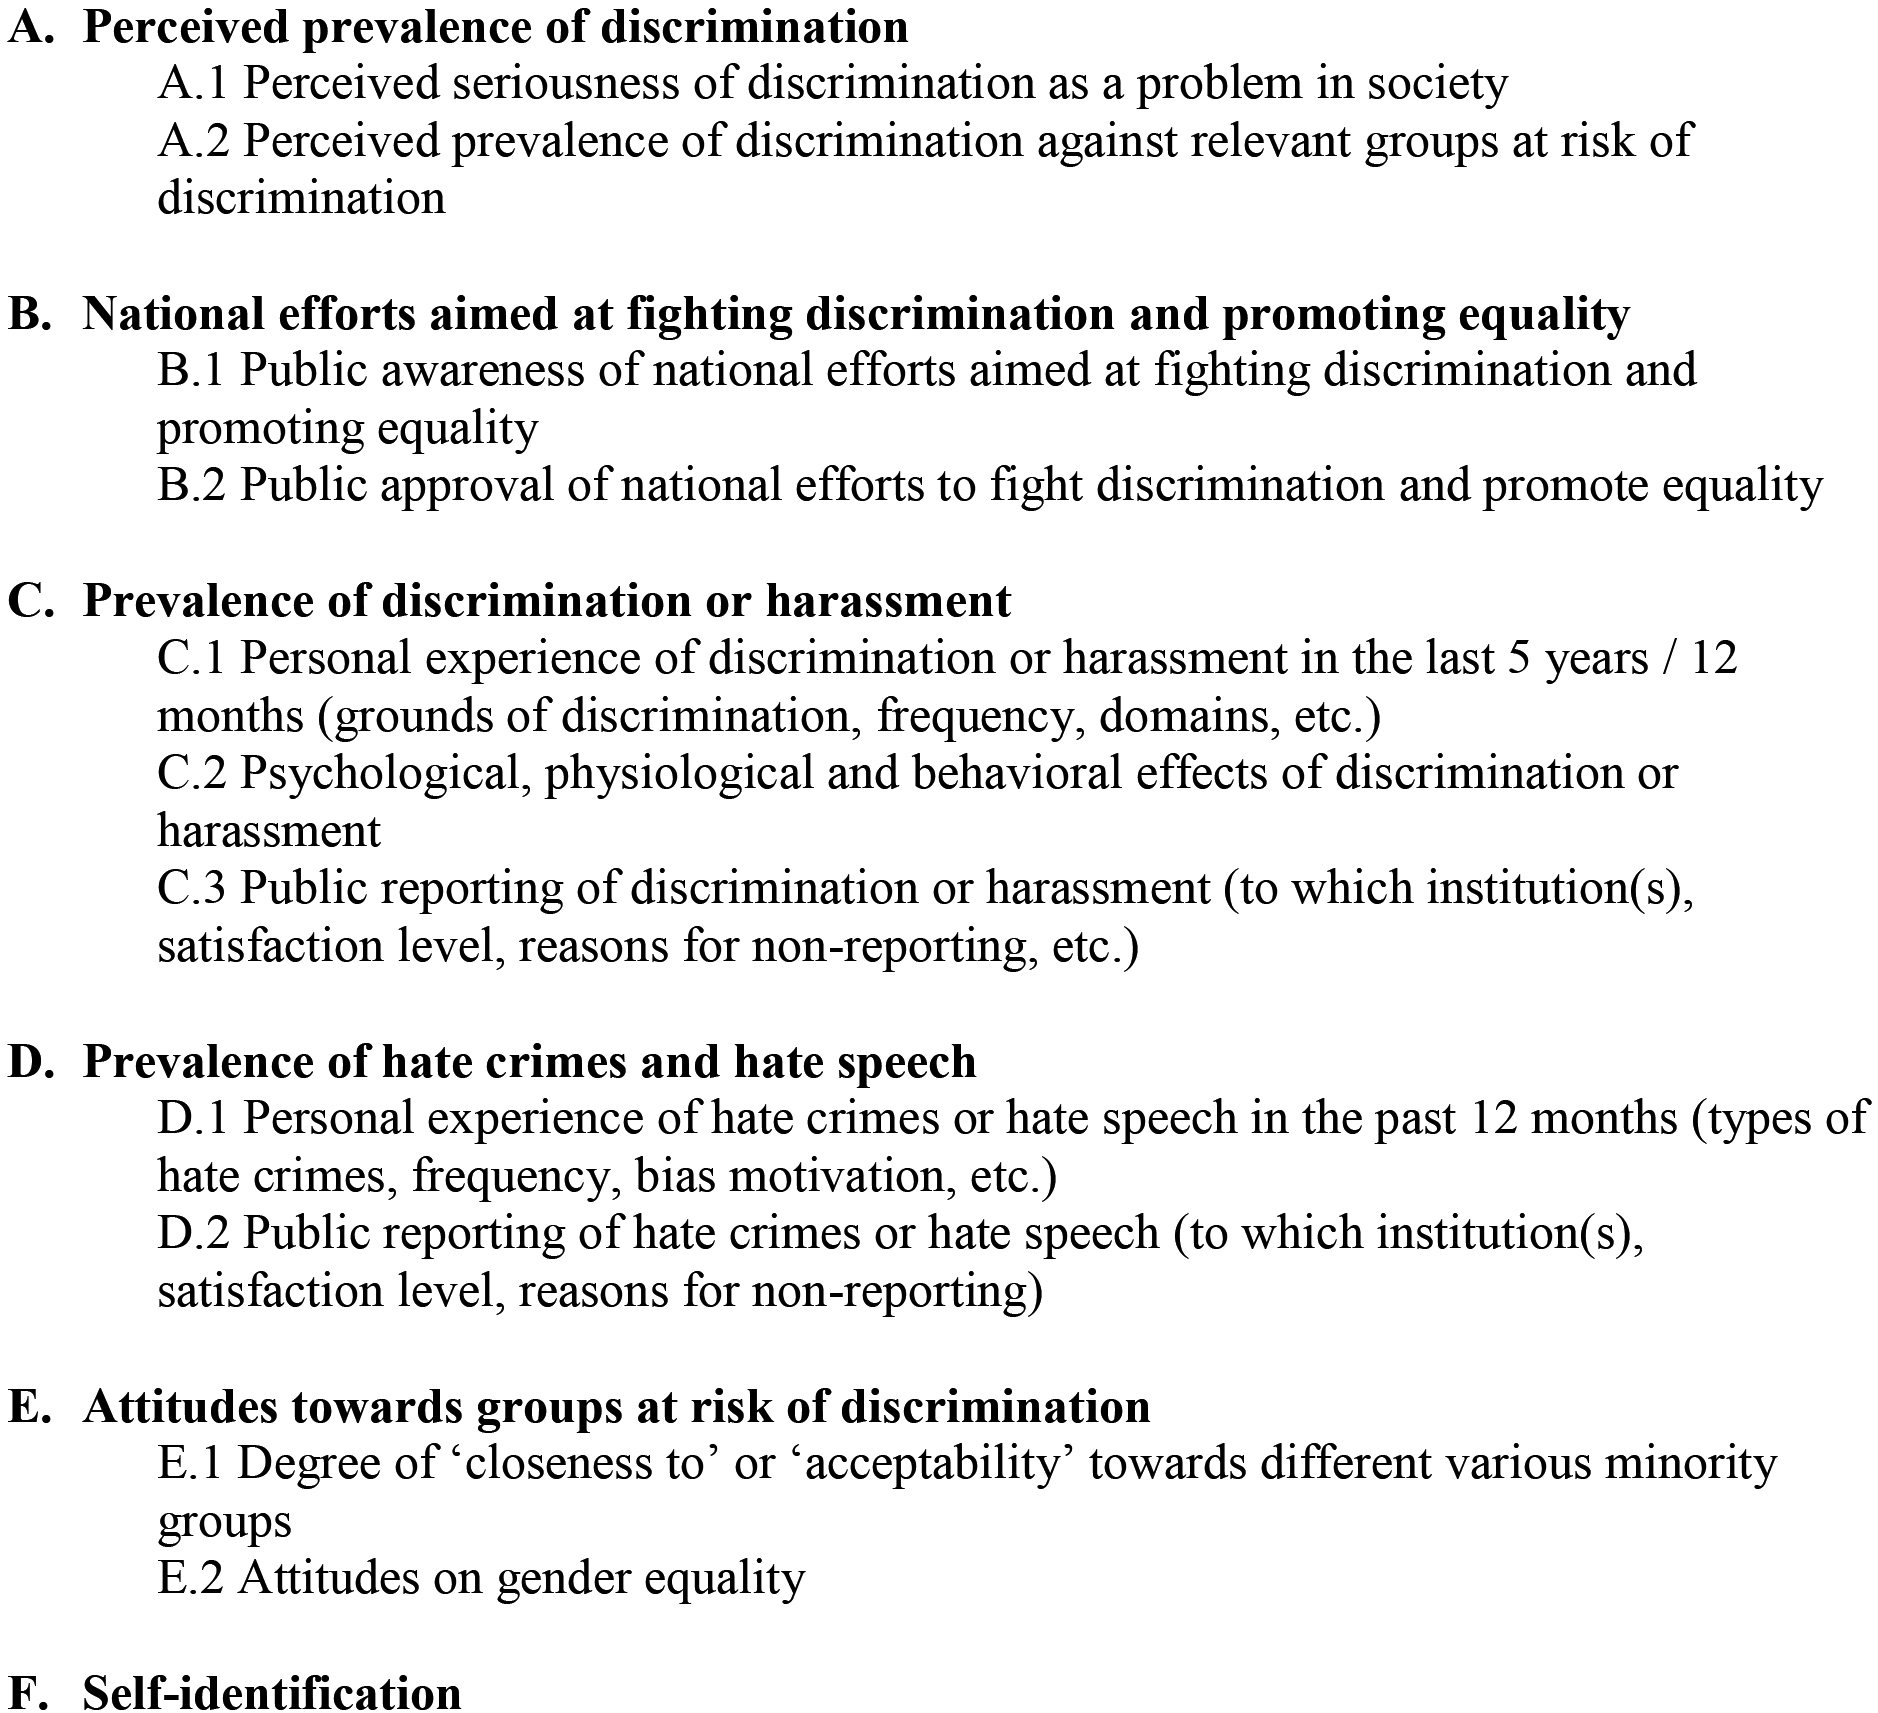
Figure 3.
Measurement areas covered by the model questionnaire on non-discrimination and equality.
At the core of the conceptual and measurement framework elaborated by the Task Team on Non-Discrimination and Equality (Fig. 2) is the distinction between direct discrimination, which occurs when an individual is treated less favourably than another person in a similar situation for a reason related to a prohibited ground (e.g. job applicants with a certain skin colour or ethnic origin are systemically excluded), and indirect discrimination, which refers to laws, policies or practices that appear neutral at face value, yet are discriminatory for population groups with certain characteristics and result in inequalities in outcomes (e.g. a requirement of a birth registration certificate for school enrolment may discriminate against ethnic minorities or non-nationals who do not possess, or have been denied, such certificates, and may result in lower enrolment rates for these ethnic minorities or non-nationals).1212 Given the considerable under-reporting of discrimination and the frequent non-recording of hate crimes by the police, the Task Team identified surveys as critically important to make visible the ‘hidden figure’ of discrimination (i.e. unreported discrimination) and to measure the overall prevalence of direct discrimination. Meanwhile, the Task Team noted that indirect discrimination, which results in inequalities in outcomes, is something for which large administrative data sets are particularly well suited. Any socioeconomic data or data on public service provision, when disaggregated by grounds of discrimination prohibited by human rights law or national legislation, can reveal indirect discrimination towards certain population groups. For instance, health care services collect a wide range of data – on access to treatment, treatment outcomes, other health outcomes (healthy births, healthy life years, etc.) – which can be used for equality analysis and to show differences in terms of ethnicity, for example.
The conceptual and measurement framework adopted by the Task Team is anchored around 6 sub-dimensions, the first three being specifically related to experiences of direct discrimination, harassment and hate crimes, and the last one focusing specifically on indirect discrimination:
• Experiences and Perceptions of Discrimination and Harassment
• Hate Crimes and Hate Speech
• Reporting and Sentencing of Discrimination, Harassment and Hate Crimes
• Attitudes Towards Minority Groups
• Promotion of Equality and Non-Discrimination
• Indirect Discrimination/Inequalities in Outcomes
As outlined in Fig. 2, the Task Team sought to identify relevant measurement areas under each sub-dimension, and for each, to specify the most relevant data sources. This conceptual and measurement framework enabled the identification of measurement areas that are best measured through surveys (e.g. the prevalence of discrimination, different domains where discrimination typically occurs, effects of discrimination on the person, etc.) and others that are best measured though administrative data sources (e.g. convictions of discrimination, harassment and hate crime cases and reparations provided to victims). In the end, the Task Team settled for the following areas to be included in the model questionnaire (Fig. 3).
Some notable features of the questionnaire include its investigation of factors contributing to the spread of discriminatory practices, such as attitudes towards minority groups, which are rarely measured in official surveys run by NSOs. For instance, one question aims to measure the acceptability of interactions with people with different social or ethnic/racial background by asking respondents to say how comfortable they would be to have various groups of people (e.g. ‘people of a different ethnic group, race or skin color’, ‘immigrants/people with a migrant background’, etc.) as neighbors. Other noteworthy aspects of the questionnaire are its attempt to measure the psychological and behavioral effects of discrimination on the person who experienced it (‘you lost sleep over worry’, ‘you were depressed’, ‘you had suicidal thoughts’, ‘you refrained from doing any activity or avoided going to any place because you expected to be discriminated against’, etc.) and its last two questions asking respondents whether or not they identify as a member of a minority group at risk of discrimination, in line with the human rights-based principle of self-identification (‘When you compare yourself to others in the country where you live, do you think that you belong to a minority (ethnic, religious, disability, etc.)? [If yes] Which of the following groups do you think you belong to? (Multiple responses allowed) Ethnic minority/Religious minority/Minority by sexual orientation (or gender identity)/Minority by disability status (or health problems)/other minority, specify.
After an expert appraisal of the draft questionnaire conducted by the EU’s Fundamental Rights Agency (FRA), selected NSOs from diverse national contexts will soon undertake the cognitive testing of questionnaire. For this purpose, a detailed protocol was elaborated by the Task Team, which is based on Tourangeau’s four-stage cognitive model of the survey response process (Tourangeau, 1984),1313 adopted by Willis (2015).1414 Interviewers will engage in the verbal probing of the respondents’ thought process, to identify potential issues with the questions. The standardized probe questions developed for this protocol relate to 1) the comprehension of the question, 2) the retrieval of relevant information from memory, 3) judgment/estimation processes, and 4) response processes. Interviewers and observers will also be coding respondent behaviour (i.e. Did the respondent ask the interviewer to repeat all or part of the question? Did the respondent ask for clarification of some aspect of the question? Did the respondent have any difficulty providing an answer using the response options provided?) and documenting any difficulty encountered in administering each survey question (e.g. problems with notes or instructions for the interviewer, or problems with the sequencing/placement of question items). Since the goal is to generate quantitative (comparable) information on the extent to which each question is exposed to unwanted response behavior, across different contexts, these cognitive testing interviews will be conducted by especially trained interviewers who will receive additional training in behavior coding.
Meanwhile, the Task Team is also compiling guidance on how to improve the use of administrative data to produce more and better statistics on discrimination and inequalities. The potential of administrative data to improve the availability, quality, granularity, timeliness and affordability of statistics on discrimination and inequalities is large, yet these data sources remain underutilized by NSOs around the world. While some countries are already drawing on administrative sources to produce statistics on discrimination based on certain grounds (e.g. sex or ethnic origin), or specifically on hate crimes, these are scattered efforts, and often project-based. Few countries have adopted a coherent and systematic approach to collecting administrative data across the National Statistical System to produce comprehensive statistics in this area. This is the gap that the Task Team aims to address through this guidance.
Mainly aimed at institutions and actors that are engaged in the collection, analysis and dissemination of data on discrimination and inequalities, such as NSOs, ministries or other national or local administrative bodies, equality bodies and human rights institutions, the purpose of the Guide is twofold: first, to take stock of current practices and to share practical examples of how different countries are approaching the production of statistics on discrimination and inequalities using administrative data. Keeping in mind that the availability and use of administrative data in any given country is influenced by a range of historical, political, cultural and administrative factors, the Task Team is trying to gather examples of practices from a diversity of national contexts. Second, the Guide aims to provide general recommendations on how to better use administrative records to produce various types of statistics on discrimination and inequalities.
The Task Team has identified several sources of administrative data from which discrimination and inequality statistics can be derived. These include offences reported to the police, crime data collected by the police, but also administrative data on police activities that can be used to examine whether discriminatory practices are taking place. For instance, data on police stops can be analysed to determine if some groups in the population experience a disproportionate number of police stops. Similarly, data on police response times to domestic violence calls can be used to analyse differences in people’s access to police response in different police districts, which may differ in terms of the median income or other characteristics of people living in these districts. Other types of relevant administrative data identified by the Task Team include data on active and concluded discrimination, harassment and hate crime cases as well as on convictions. Socio-demographic data on people having contact with different parts of the justice system can also reveal whether particular groups are over- or underrepresented within parts of the justice system, or whether they receive different treatments. Recognizing that people, and particularly those in more vulnerable situations, might be reluctant to contact law enforcement authorities to report incidents, the Task Team is also reviewing the use of data collected by organisations outside the formal justice system, such as complaints data collected by National Equality Bodies, National Human Rights Institutions, civil society organisations as well as other relevant entities such as legal aid schemes, alternative dispute resolution mechanisms, legal empowerment groups and lawyer associations. Finally, the Task Team is exploring how the wide range of datasets compiled by service provision institutions can be used for equality analysis across different population groups, by showing differences in terms of ethnicity, for example. While some service provision institutions collect complaints data (e.g. reports of abuse within health services, data on exclusions from schools, on accidents and failed safety inspections in workplaces, etc.), which can be used to measure direct discrimination, many other types of data collected by service provision institutions can be used to detect discrepancies in outcomes between groups, or indirect discrimination.
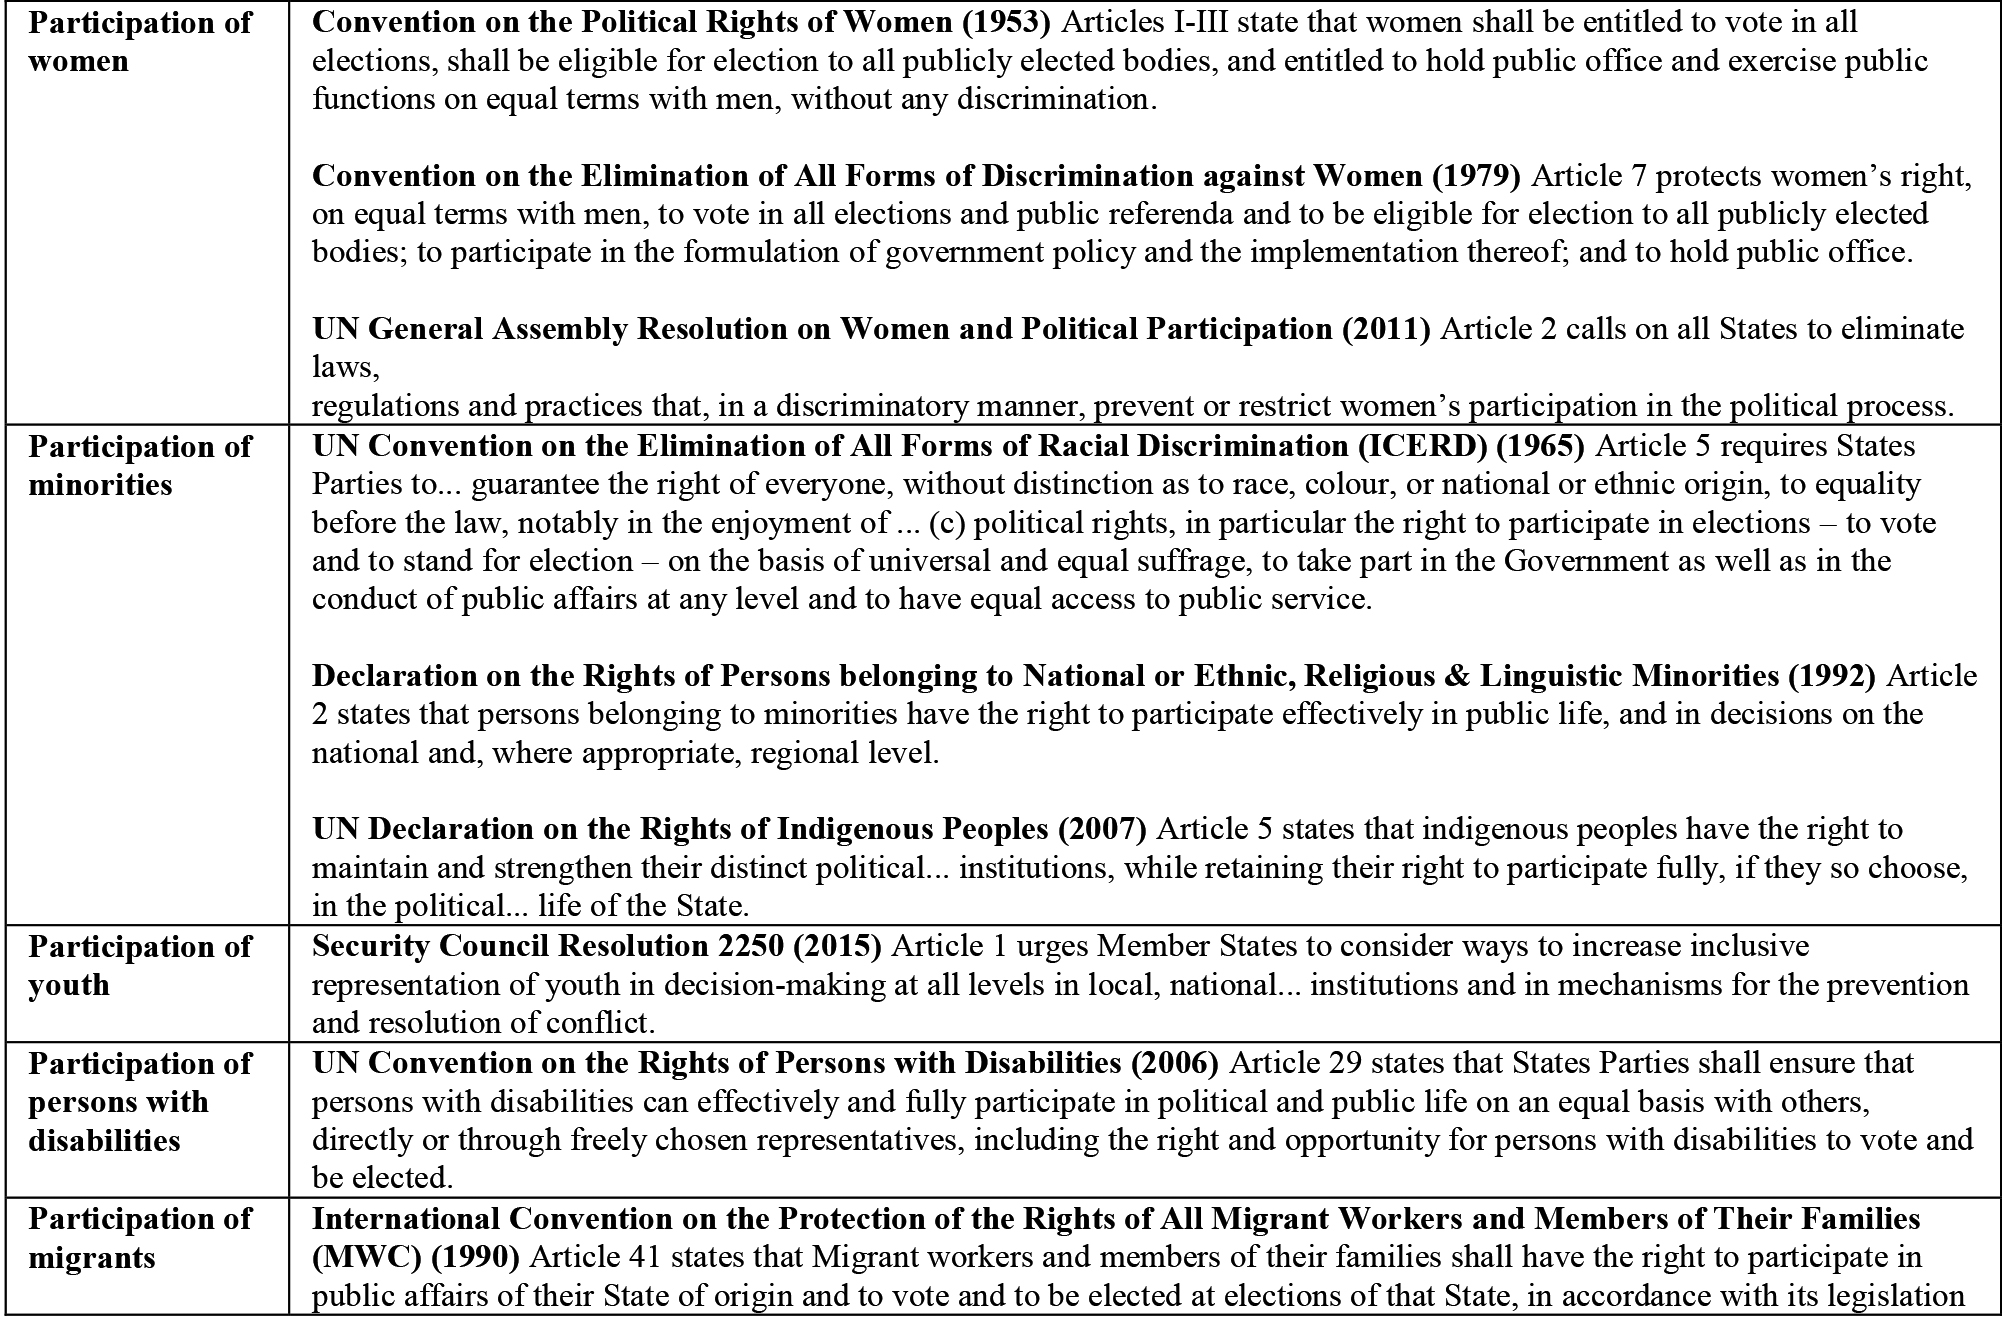
Figure 4.
International agreed normative frameworks on participation of specific groups in political and public affairs.
4.Task Team on Participation in Political and Public Affairs
The Task Team on Participation in Political and Public Affairs is co-led by Statistics Norway, which was a pioneering in initiating the production of register-based electoral statistics in 1969, and by the National Institute of Statistics of Tunisia, which runs a survey on “Citizen perceptions towards security, freedom and governance” as part of its regular survey programme since 2014, the first part of which focuses on the participation of Tunisians in political and public affairs.
Similarly to the other Team, the Task Team on Participation started by reviewing the normative framework and definition of “participation in political and public affairs” provided in the Praia Group’s Handbook on Governance Statistics. The concept of participation in political and public affairs is grounded in various internationally agreed normative frameworks, particularly the 1966 International Covenant on Civil and Political Rights (ICCPR). Article 25 of the ICCPR provides for the right of every citizen – “without distinction of any kind, such as race, colour, sex, language, religion, political or other opinion, national or social origin, property, birth or other status” – to participate in public affairs, including the following three elements: a) the right to take part in the conduct of public affairs, directly or through freely chosen representatives; b) the right to vote and to be elected; and c) the right to have access on general terms of equality to public service positions.1515 General Comment no. 25 on article 25 of the ICCPR, adopted by the UN Human Rights Committee, explains that the conduct of public affairs referred to in (a) is a “broad concept which relates to the exercise of political power, in particular the exercise of legislative, executive and administrative powers. It covers all aspects of public administration, and the formulation and implementation of policy at international, national, regional and local levels”.1616 The General Comment further specifies that the right to take part in the conduct of public affairs can also be realized “through public debate, dialogue with elected representatives, and people’s capacity to organize themselves”.1717 In this regard, the General Comment specifically refers to the “freedom to engage in political activity individually or through political parties and other organizations, freedom to debate public affairs, to hold peaceful demonstrations and meetings, to criticize and oppose, to publish political material, to campaign for election and to advertise political ideas.”1818
Figure 5.
Conceptual and measurement framework on participation in political and public affairs: areas for statistical measurement and data sources.
| Data Sources | ||
| Areas for statistical measurement | Administrative data | Household or population surveys |
| A. Participation in electoral processes and referendums | ||
| A.1. Voting-age population | Yes, population registers | Yes, population censuses |
| A.2. Registered voters | Yes, EMBs as primary source | Yes, for more disaggregated data, reasons for not registering, etc. |
| A.3. Voter turnout in presidential, legislative and local government elections and referendums | Yes, EMBs as primary source (most reliable for voter turnout statistics) | Yes, for more disaggregated data, reasons for not voting, etc. |
| A.4. Registered electoral candidates | Yes, EMBs/registers of political parties | Other types of surveys more relevant (candidate surveys) |
| B. Participation in political and civic life | ||
| B.1. Members of political parties, including in leadership positions | Yes, registers of political parties (partially) | Yes, but limited information. Other types of surveys more relevant (targeted surveys of political parties) |
| B.2. Members of NGOs/civic associations whose aim is to influence the conduct of political and public affairs | Limited information may exist (public registers of NGOs?) | Yes, but limited information. |
| B.3. Participation in election-related activities, such as campaign activities and rallies (online and offline) | No | Yes |
| B.4. Participation in other political and civic activities, including contacting government officials, participating in protests, contributing to local governance processes, etc. (online and offline) | No | Yes |
| C. Representation and participation in political office | ||
| C.1. Members of parliament, including in leadership positions; and by manner of selection | Yes, parliamentary secretariats | No |
| C.2. Ministers, including by type of portfolios held | Yes, ministerial secretariats or President’s or Prime Minister’s Office | No |
| C.3. Members of deliberative and executive bodies of local government | Yes, EMBs as primary source | Other types of surveys more relevant (surveys/censuses of local government units) |
| D. Representation in judicial bodies | ||
| D.1. Court staff dealing with criminal, civil, and administrative matters, by level of court and category of occupation | Yes, Judicial Services Commission, Ministry of Justice or similar body | No |
| E. Representation in bodies of public service/public administration | ||
| E.1. Employment in public service, by ministry/agency and by category of occupation | Yes, Public Service Commission, Ministry of Public Administration or similar body | Small-sample survey (e.g. labor force survey) may not capture nuanced categories of occupation |
| F. Representation in informal governance bodies | ||
| F.1. Members of informal popular assemblies with decision-making power over local issues and communities | No | Targeted surveys (in relevant contexts) |
| G. Enabling environment of participation | ||
| G.1. Campaign finances | Yes, register of political parties or equivalent administrative data source | No |
| G.2. Adult population who fears becoming/who is a victim of political intimidation or violence during electoral campaigns | No | Yes |
| G.3. Candidates standing for elections who experienced violence and/or discrimination | No | Other types of surveys more relevant (candidate surveys) |
| G.4. Members of political and public office who experienced violence and/or discrimination while in the office | No | Other types of surveys more relevant (surveys targeted to members of national and local legislatures) |
| G.5. Adult population with interest, information and knowledge on political and public affairs | No | Yes |
| G.6. Adult population with stereotyping attitudes and values | No | Yes |
| G.7. Self-reported levels of political efficacy among adult population and youth | No | Yes |
| G.8. Perceived levels of freedom to express any political opinion, to join any political organization, and to criticize government actions or performance/to participate in protests/demonstrations | No | Yes |
| G.9 Barriers to voter registration and voting | No | Yes |
Other internationally agreed normative frameworks emphasizing equal rights to participate in political and public affairs for women, ethnic, religious and linguistic minorities, indigenous people, youth and persons with disabilities, include the following (Fig. 4).
The Task Team also endorsed the working definition of ‘participation in political and public affairs’ provided in the Handbook, which was elaborated based on the aforementioned normative frameworks:
• Taking part in the conduct of public affairs, including by:
• Registering to vote, voting and standing as a candidate in elections;
• Being members of legislative, executive and judicial bodies at all levels of government;
• Accessing positions in the public service; and
• Engaging, individually or as members of political parties and other non-governmental organizations, in political activities such as publicly expressing political opinions, campaigning, holding peaceful demonstrations or taking part in other forms of collective mobilization.
Building on this definition and on the preliminary conceptual and measurement framework outlined in the Handbook, the Task Team identified seven sub-dimensions of participation in political and public affairs, and for each, defined key areas for statistical measurement (Fig. 5):
1. Participation in Electoral Processes and Referendums
2. Participation in Political and Civic Life
3. Representation and Participation in Political Office
4. Representation in Judicial Bodies
5. Representation in Bodies of Public Service/Public Administration
6. Representation in Informal Governance Bodies
7. Enabling Environment of Participation
The Task Team reformulated the second sub-dimension on “Participation in Political and Civic Life” (which was framed more narrowly in the Handbook as “Participation through association in political parties and other organizations”) to capture participation in all political and civic activities (online and offline) beyond elections, including political party membership and membership in NGOs and civic associations whose aim is to influence the conduct of political and public affairs, contacting government officials, participating in protests and contributing to local governance processes.
Figure 6.
Measurement areas covered by the model questionnaire on participation in political and public affairs.
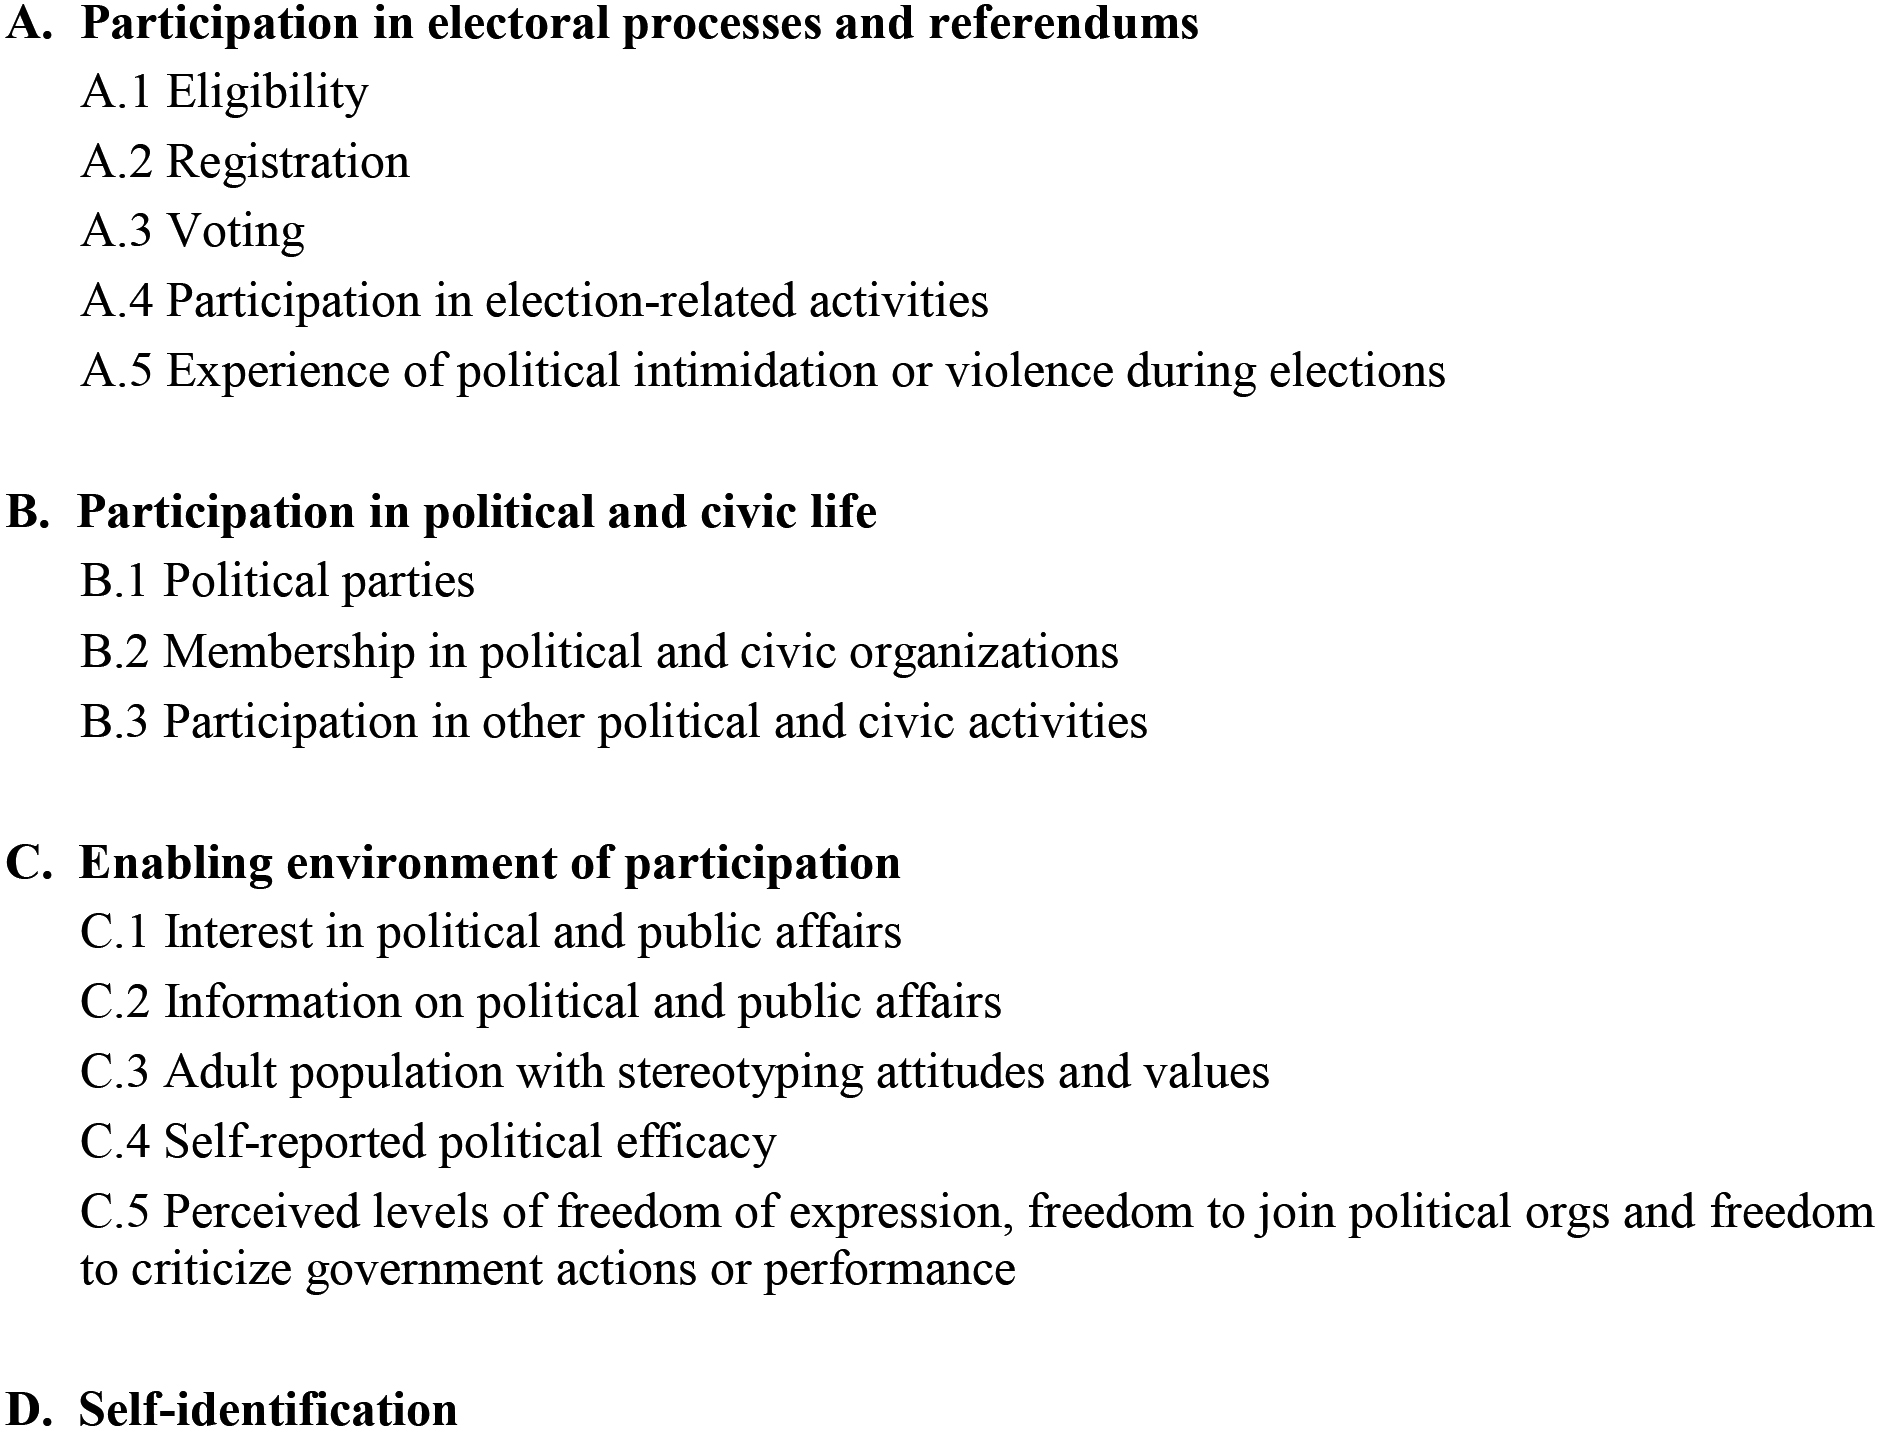
As detailed in the conceptual and measurement framework developed by the Task Team (Fig. 5), household or population surveys were identified as being the most appropriate source for producing statistics on the first two sub-dimensions, on electoral participation and on participation in political and civic life, as well as on the last sub-dimension, namely the enabling environment of participation. This last sub-dimension is grounded in the consideration that “the right to participate in public affairs cannot be considered in a vacuum”:1919 it requires an enabling environment where other rights are fully respected and enjoyed by all individuals. Particularly relevant are the freedom of expression,2020 “the right to form and join organizations and associations concerned with political and public affairs”,2121 “a free press and other media able to comment on public issues without censorship or restraint and to inform public opinion”,2222 the right of access to information,2323 and the right to equality and non-discrimination.2424 People must also perceive that they have abilities to understand politics and to participate in political processes (internal political efficacy) and feel that their views can impact on public decision-making for them to find it “worthwhile” to perform their civic duties (external political efficacy, measured by SDG indicator 16.7.2 under Goal 16).2525 Figure 6 outlines the specific areas of measurement that are covered in the model questionnaire.
The questionnaire is envisioned to be a post-election survey. It is recommended that NSOs schedule the module within 12 months of the elections of interest for the survey, whether national (i.e. presidential or parliamentary) elections, state or local elections. Ideally, the elections of interest should also be the most recent elections held in the country, to prevent recall errors, particularly in contexts where multiples elections are held within a short period of time.
For the first section of the questionnaire on electoral participation, a key challenge faced by the Task Team was to develop a questionnaire that would be applicable across the diversity of electoral systems in place across the world. For instance, voter registration can be ‘active’ or ‘passive’. That is, a person may be required to actively apply for voter registration, or s/he may be automatically (or ‘passively’) registered through participation in another process, such as holding a driver’s license or being included in a national population register. According to the World Bank’s Global ID4D Dataset 2018, there are around 150 countries/territories with ‘active’ voter registration systems, compared to only 20-30 countries/territories where the government itself assumes the responsibility of creating and keeping voter rolls (i.e. countries with ‘passive’ voter registration systems). Some countries/territories with passive voter registration systems draw on national ID registers (e.g. some Latin American countries), while other countries use automatic government registration: when an individual reaches the age of majority, or becomes a citizen, s/he is automatically added to the rolls. There are also countries that use a sort of ‘hybrid’ system: these are countries that have introduced passive voter registration but that also retain some features of the active system, such as when people who have changed their place of residence since the last election have to ‘actively’ register at their new voting station. These three types of registration systems – active, passive and hybrid – were considered when drafting the questionnaire, and where relevant, the Task Team provided detailed instructions on how to adapt questions depending on the type of registration system in place.
There are a few countries2626 also that have a law that provides for compulsory voting, based on the belief that voting is an inherent civic responsibility. Of the countries that have such a law, some enforce sanctions2727 on non-voters, while some have laws in place but do not enforce sanctions. In countries that do enforce sanctions on non-voters, specific response categories were added for the question on whether or not a respondent voted in the last election (‘No, but I justified my abstention’ and ‘No and I have not yet justified my abstention, but I will’), given the likely reluctance of non-voters to answer ‘no’ if they cannot also justify their abstention.
At this point in time, two options are being considered with regards to the sequencing of questions on electoral participation. The question flow in the first option follows the logic of electoral processes, from eligibility to registration to voting, whereas the second option starts with a question on whether the respondent voted or not, and questions on eligibility and registration are only asked to respondents who say they did not vote. While the sequence of questions used by the second option is more commonly used by international, regional and national survey programmes,2828 it is important to recognize that these survey programmes are primarily concerned with measuring voter turnout and may not share this Task Team’s interest in developing a survey module that also includes additional questions on reasons for non-registration, for example. This being said, having the voting questions as the central part of the question set on electoral participation is important and could be an argument for choosing the second option. Both versions will undergo an expert appraisal and extensive cognitive testing so as to identify the version that works best across different types of electoral systems, while also allowing for the calculation of the proportion of population who is 1) eligible to vote, 2) registered to vote, and 3) who voted.
Some ‘new’ questions were designed by the Task Team to address emerging information needs, which are not typically considered by existing questionnaires. For instance, a question was added to measure the proportion of the population who follows or participates in online discussions of political topics on social media networks, another to measure the proportion of the population who has positive or negative views about online discussions of political topics on social media networks (with respect to the ability of these new spaces to bring new voices into political discussions; to allow people to get more involved with issues that matter to them; to the language and tone used in these online discussions; and to the extent to which they are filled with misinformation and propaganda), and yet another to calculate the proportion of the population who has stereotyping attitudes and values about the participation of women and other minorities in politics (‘Please tell me how willing you would be to vote for a presidential candidate [or Prime Minister] for this country who is…a woman; a person from an ethnic/religious/linguistic minority group; a person with a disability; a gay/lesbian/bisexual/ transgender/non-binary; other minorities (country-specific)’).
Statistics Norway, as co-chair of the Task Team, has proposed a four-step process to test the draft questionnaire in the Norwegian context as well as across different political and socio-cultural settings. The first step – an expert appraisal of the questionnaire conducted by two questionnaire methodology experts from Statistics Norway – was completed in March 2023. A joint report was produced by the two experts which revealed logical errors, inconsistencies and a range of formulation issues which were increasing the ‘response burden’ for the respondent – that is, how demanding the respondent feels it is to participate in the survey, which in turn affects the quality of the data collected. A main advantage of starting the testing process with an expert appraisal is that it can contribute to resolving many problems in the questionnaire with relatively little resources, as no respondents are involved at this early stage. The findings of the expert appraisal led by Statistics Norway will soon be presented to the entire Task Team, which will then discuss collectively how to address the various weaknesses identified, and produce a revised questionnaire. The second step envisioned for the review of the questionnaire is to conduct 8–10 “classic” cognitive interviews, which will be semi-structured interviews focused on selected items, such as the core questions as well as other questions where problems are expected. Such interviews will be explorative and will include think-aloud sequences and cognitive probes. They will be conducted with respondents that have various socio-demographic characteristics, as well as diverse levels of engagement in politics. This approach is particularly useful to help identify unexpected problems in the questionnaire, for which it is not possible to prepare probes in advance. Subsequently, the third step envisioned is a series of structured cognitive interviews (40 in total) led on the basis of a detailed, fully agreed-upon protocol prepared in advance and applied systematically by participating NSOs, including behaviour coding. The main advantage of this approach is that it will generate comparable quantitative information on which questions are more exposed to unwanted response behaviour than others across diverse national contexts – and therefore require further adjustments. Finally, the fourth and last step will be 8–10 follow-up classic cognitive interviews to validate the changes made to address the problems detected in the protocol interviews in Step 3. This will be an important final step to make sure that any previous adjustments to the questionnaire are functioning according to intentions.
The Task Team on Participation in Political and Public Affairs is at the early stage of compiling guidance on the collection and use of administrative data for statistics on Participation. Administrative sources are cost-effective for statistics on participation in electoral processes and referendums, representation in legislative and executive bodies of government at national and sub-national levels, representation in the public service, and representation in the judiciary. Since the metadata for SDG indicators 16.7.1a, b and c already provide detailed guidance for producing statistics on representation in public institutions,2929 the Task Team will prioritize the compilation of guidance for NSOs and Electoral Management Bodies (EMBs) on how to leverage the vast amount of information that is produced by EMBs through their core activities, including voter registration, registration of candidates, polling place management, counting, tabulation and dissemination of election results, and post-election assessments, as the basis for statistics on electoral and political participation. The Task Team also intends to look into additional tasks that may be undertaken by some EMBs – such as voter outreach and information, electoral boundary delimitations, campaign finances disclosure and adjudication of electoral disputes – which can also generate data that can be used to produce further statistics on various aspects of participation in electoral processes.
5.Conclusion
More than twenty years ago, in 2002, the Friends of the Chair of the UN Statistical Commission stated in its report that “the development of statistical indicators for human rights and good governance will not be easy and will take time.” They recommended that the Commission establish a mechanism (“perhaps a city group”) to advance this ‘new’ area of statistics, and they stressed that “the process needs to involve statisticians and policy officials.” In March 2015, a City Group on Governance Statistics was indeed established by the UNSC. The Praia Group was created by the UNSC, “out of the international recognition that governance statistics are a critical area of statistics but that they lack the maturity of other statistics and are underinvested in most parts of the world.”3030
This year is a watershed moment for governance statistics. More than twenty years after the publication of the report of the Friends of the Chair, the UNSC, at its 54
This new classification effectively means that there is now a shared belief within the international statistical community in the value of governance statistics to help address some of the critical governance challenges facing countries today. It also means that the signifi-
cant methodological strides made by the Praia Group in recent years to help advance the field of governance statistics are bearing fruit: governance is no longer seen as an ‘emerging’ or ‘experimental’ area of official statistics, but now sits squarely in the official statistical nomenclature. Importantly, it sets the path for NSOs and international agencies to allocate and/or request dedicated resources for statistical programmes and publications on governance specifically.
There has never been a more opportune time to push the frontiers of governance statistics – and the Praia Group is ready for the challenge.
Notes
1 Report of Cabo Verde on governance, peace and security statistics, Statistical Commission, Forty-sixth session, 3–6 March 2015 (E/CN.3/2015/17).
2 On dispute resolution mechanisms (SDG 16.3.3), satisfaction with public services (SDG 16.6.2), inclusive representation in the public service (SDG 16.7.1b) as well as inclusive representation in the judiciary (SDG 16.7.1c), and responsive decision-making (SDG 16.7.2).
3 UNSC 51/117/c, 51st Session, March 2020.
6 Report of the Praia Group on Governance Statistics, Statistical Commission, Fifty-third session, 1–4 March 2022, E/CN.3/2022/29.
7 Meetings of the Task Team on Non-Discrimination & Equality were attended by 265 distinct participants, and meetings of the Task Team on Participation in Political and Public Affairs were attended by 152 distinct participants.
8 Members of the Task Team on Non-Discrimination & Equality heard from the experiences of Ireland (Measuring discrimination: Ireland’s experience), South Africa (Statistics South Africa’s annual survey to monitor discrimination), Peru (The first virtual survey of the LGBTI population in Peru), Italy (The Italian experience in measuring discrimination in the workplace against LGBT+ people and diversity policies in enterprises), Finland (Equality and non-discrimination data sources and their development in Finland), Palestine (Measuring SDG 16.b.1: The Palestinian experience), Madagascar (Discrimination in Madagascar: How close are perceptions and experiences?), the European Commission’s Subgroup on Equality Data (How to improve the collection and use of equality data?), and the EU Agency for Fundamental Rights (FRA) (Survey measurement of equality in the European Union). Meanwhile, members of the Task Team on Participation in Political and Public Affairs heard from the experiences of Colombia (The Political Culture Survey (ECP): An input to designing public policies aimed at strengthening democracy and peaceful coexistence in Colombia), Cote d’Ivoire (Trends and determinants of youth participation in political and public affairs in Cote d’Ivoire), Kenya (How representative of Kenyan society is the Political Office, the Parliament and the Judiciary?), Mexico (The National Survey on Civic Culture (ENCUCI): A strategy to inform the National Policy on Civic Culture), and Turkey (How are electoral statistics produced in Turkey).
9 Harkness et al. (2010), Survey Methods in Multinational, Multiregional, and Multicultural Contexts, John Wiley & Sons.
10 Including the general population (“Encuesta Nacional de Hogares – ENAHO” module on Governance, Democracy and Transparency integrated since 2012, to report on SDG indicator 10.3.1/16.b.1 on the “proportion of population reporting having personally felt discriminated against or harassed in the previous 12 months”); the youth (“National Youth Survey”, 2013), persons with a disability (“Primera Encuesta Nacional Especializada sobre discapacidad – ENEDIS”, 2012), Venezuelan migrants living in Peru (“Encuesta Dirigida a la Población Venezolana que Reside en el País – ENPOVE”, 2018) and the LGBTI population (“Encuesta Virtual para Personas LGBTI”, 2017)
11 See “What is discriminationdata.fi?”.
12 Praia Group on Governance Statistics, Handbook on Governance Statistics (2020), Chapter on Non-Discrimination and Equality, p.32.
13 Tourangeau, R. (1984). Cognitive sciences and survey methods. In National Research Council (Ed.), Cognitive Aspects of Survey Methodology: Building a Bridge Between Disciplines. National Academy Press.
14 Willis, G. (2015). The Practice of Cross-Cultural Cognitive Interviewing. Public Opinion Quarterly, 79(S1), 359–395. https://doi.org/ 10.1093/poq/nfu092.
15 International Covenant on Civil and Political Rights (ICCPR), 1966.
16 General Comment No. 25: The right to participate in public affairs, voting rights and the right of equal access to public service (1966) Para. 5.
17 Ibid, Para. 8.
18 Ibid, Para. 25.
19 Guidelines for States on the effective implementation of the right to participate in public affairs, Office of the UN High Commissioner for Human Rights, Para. 14.
20 General Comment No. 25: The right to participate in public affairs, voting rights and the right of equal access to public service (1966) Para. 8.
21 Ibid.
22 Ibid., Paras. 12, 25, 26.
23 Guidelines for States on the effective implementation of the right to participate in public affairs Office of the UN High Commissioner for Human Rights, Para. 15.
24 General Comment No. 25: The right to participate in public affairs, voting rights and the right of equal access to public service (1966), Paras. 15, 16, 21, 23, 24.
25 SDG 16.7.2 “Proportion of population who believe decision-making is inclusive and responsive, by sex, age, disability and population group”.
26 Approximately 27, according to International IDEA, see https:// www.idea.int/data-tools/data/voter-turnout/compulsory-voting.
27 Different types of sanctions can be imposed on non-voters, including requesting a legitimate reason for the non-voter’s abstention to avoid further sanctions, imposing fines, disenfranchising non-voters from future elections, or preventing them from obtaining a job in the public sector.
28 Among the questionnaires reviewed by the Task Team, the second sequence (Voting
29 SDG indicator 16.7.1: Proportions of positions (by sex, age, persons with disabilities and population groups) in public institutions (national and local legislatures, public service, and judiciary) compared to national distributions.
30 Praia City Group on Governance Statistics, UNSD.
31 Report of the Committee of Experts on International Statistical Classifications, Statistical Commission, Fifty-fourth session, 28 February–3 March 2023, E/CN.3/2023/13; Draft Classification of Statistical Activities, Version 2.0 (CSA 2.0), Background Document, Prepared by the Task Team on CSA.
Acknowledgments
INECV Cabo Verde, as Chair of the Praia Group, wishes to acknowledge the generous support from the Government of Norway to the Praia Group, through the technical assistance provided by the UNDP Oslo Governance Centre.

