Measuring governance, democracy and participation: Lessons from two decades of experience in Peru
Abstract
This paper presents Peru’s unique experience in measuring governance through household surveys. Launched at the initiative of the authors in the early 2000s, and coordinated since then by one of them, this survey module is, to the best of our knowledge, the most ambitious (in terms of the length of series, statistical properties, ownership) ever carried out on a global scale by a national institute of statistics (INEI). The Peruvian experience has contributed to both demonstrating the validity of the approach chosen to measure governance, prior to the adoption of SDG 16 in 2015, and supporting the regular production of indicators on governance, primarily those of SDG 16. The first part provides a brief overview of the Peruvian context and demonstrates the importance of monitoring governance issues in general, and in this country in particular. In the second part, we describe the main methodological options and innovations adopted by INEI since the launch of the module. The third part illustrates the analytical potential of the approach based on a few empirical examples, while the fourth part presents various ways through which the data has been used so far and some institutional challenges faced in promoting the use of governance statistics. Finally, we conclude by drawing key lessons from this initiative and outlining prospects for the future.
1.Introduction
The fields of research and development policies have broadened over the past thirty years, notably to better understand the interactions between at least four dimensions: growth, of course, but also distribution (of revenue or assets), the quality of institutions (notably public) and the type of political regime or, more generally, the value system of society [1, 2, 3]. The transition from the Millennium Development Goals (MDGs) to the Sustainable Development Goals (SDGs), with the creation of SDG 16 specifically dedicated to the monitoring of governance, peace and security, has confirmed interest in these subjects.
With the rise of governance issues and the nature of political regimes as explanatory factors for economic development, but also as an intrinsic component of development and the well-being of populations in general, a new need for data in this area emerged in the mid-1990s. This demand initially resulted in the proliferation of international databases on governance, mainly based on expert opinion, and for use by rating agencies, donors and business community: Transparency International’s Corruption Perception Index; the World Bank’s Worldwide Governance Indicators; Democracy and Rule of Law, Heritage Foundation, to name but a few. The emergence of Big Data has given a new impetus to this industry.
As of the mid-1990s, the authors of this article took an alternative approach: measuring governance by grafting modules onto household surveys (and subsequently to business surveys) conducted by national statistics institutes. After an initial test in Madagascar in 1995, the method was replicated at the beginning of the 2000s and the number of surveys has since multiplied in Africa and Latin America [4, 5]. This innovative approach is recognised today at the international level and even constitutes the core element in the measurement of SDG 16 indicators [6, 7].11 The example of Peru, the subject of this article, is interesting on two levels. Firstly, due to its institutional context: this middle-income country has experienced a period of great political turbulence related in particular to corruption. Secondly, due to the wealth of the statistical data generated so far: the Instituto Nacional de Estadística e Informática (INEI) has institutionalised a national monitoring system for governance indicators, which is still in place today. These two decades of data collection make Peru the global leader in terms of national governance statistics.
We aim to present this unique experience from a privileged viewpoint, as we both designed the method and initiated it in Peru, and one of us has been responsible for the implementation of the survey for the past twenty years. The first part of the article will provide a short overview of the Peruvian context and will highlight the importance of monitoring governance issues in the country. In the second part, we will describe the main methodological options used by INEI since the launch of the governance module at the beginning of the 2000s. The third part will illustrate the analytical potential of the approach based on a few empirical examples, while the fourth part will present various ways through which the data has been used so far and some institutional challenges faced in institutionalizing this governance monitoring system. Finally, we will conclude by drawing key lessons from this initiative and outline some prospects for the future.
2.The Peruvian context: Governance at the heart of the national debate
Some background information will be useful in order to better understand both the challenges and the implications of the Peruvian experience. Among others, we will take the particularly significant example of corruption. Corruption is an “endemic” phenomenon in Peru’s republican history [8], and the country’s political history over these past thirty years has been marked by reports of corruption at the highest level of government. At the beginning of the 2000s, Peru saw a period of democratic transition following the fall of Fujimori’s autocratic rule (1990–2000), undermined by cases of corruption that were unveiled by a wealth of evidence [9]. The legacy of the 1990s in the country was that of systemic corruption and the creation of a Mafia-style government, which was reflected in the acquisition of political power by a group prepared to resort to whatever means necessary to maintain this power. Primary recourse to corruption was therefore widespread. So was the subservience of senior members of the armed forces and government supervisory bodies as well as the complicity of key actors in the private sector, such as the media, entrepreneurs and bankers, among others. The phenomenon of corruption has continued to mark the country’s recent history. Over the last six years, six presidents have taken office and they have all been accused of and charged with corruption during this period, leading to the most instable period for Peruvian democracy. More recently, in 2021, which was an election year, 68 members of Congress were investigated for various offences and 11 are now facing charges of corruption. The elected president Castillo’s destitution and subsequent imprisonment (after a failed Coup d’Etat, which he saw as a way to avoid impeachment in December 2022) was based on different corruption charges that were made against him by the attorney general. This explains why Peruvians still consider corruption as the country’s main problem and why they have so little trust in political institutions.
Following the fall of Fujimori’s corrupt regime, the transition government called for new elections in 2001 and implemented a range of policies aimed at fighting corruption and ensuring greater transparency in public policymaking. According to Pozsgai-Alvarez (2019; [10]), the work of the Iniciativa Nacional Anticorrupción (Peru’s national anti-corruption initiative, or INA) and the new rules on transparency and access to information were the basis for efforts to prevent corruption. The fall of Fujimori led to significantly higher levels of awareness of corruption and greater vigilance by citizens over political officials.
At the early 2000s, new institutional practices were also introduced by the new director of INEI. For example, the poverty figures published by the institute, which had been manipulated by his predecessor, were corrected, and the microdata from Peru’s national household survey (ENAHO) as well as all the reports detailing the methodology of the new estimates were made publicly available [11]. It was in this context that INEI decided in 2001, with support from international partners (the OECD’s METAGORA Project and the General Secretariat of the Andean Community (CAN)) and technical assistance from IRD-DIAL researchers, to explore the possibilities offered by household surveys as a tool for quantitatively measuring and monitoring these new dimensions of development [4, 5]. As mentioned above, the national context favored the introduction of governance statistics as a legitimate part of the national information system. In 2001, Peru was going through a phase of return to democracy, marked by transparency and a strong concern for anti-corruption policies. INEI was no stranger to this process, seeking to respond to the government’s demand for the construction of a mechanism to monitor democracy and citizen participation, and calling for international cooperation. Three specific survey modules (“Multiple dimensions of poverty”, “Governance” and “Democracy”) were added to the ENAHO, the most prominent features of which we will present below.
In 2002, the three modules were integrated into the household surveys of four Andean countries: Bolivia, Colombia, Ecuador and Peru [4]. In total, more than 50,000 people were surveyed across the four countries, with a national and regional level of statistical inference. Thanks to the success of this operation from both a methodological (governance and democracy can be reliably measured) and analytical (results can be used to inform public policy) point of view, Peru’s INEI decided to integrate these survey modules within the national statistical information system on a permanent basis, and used its own resources to do so.
2.1Main characteristics of ENAHO’s governance, democracy and transparency module
Peru’s experience in monitoring governance through household surveys is, to our knowledge, the most accomplished to date worldwide, with the governance modules forming an integral part of the ENAHO survey, in the same way as modules on employment, revenue and consumption. Following the ENAHO sampling design, the modules cover a sample of around 35,000 households with a level of representativeness that is national, regional (8) and even departmental (24). In addition, as ENAHO is a continuous survey, since the introduction of the modules in May 2003 in their current form, it has been possible to generate time series on an annual, quarterly and monthly basis.
2.2A governance module integrated in a multi-purpose survey
Since ENAHO is a survey that investigates the living conditions of households (in regards to education, health, employment, poverty, spending, ethnicity, etc.), it is possible to cross-reference all aspects addressed in the governance module with standard variables related to the socio-economic characteristics of individual respondents and households, such as revenue, gender, age, etc. For example, the profile of those affected by corruption can be drawn by age group, ethnicity, employment status and poverty level, among others. This breakdown of results makes it possible to highlight disparities between different population categories, notably by studying the case of the most disadvantaged or those suffering the most from discrimination. For example, the governance indicators derived from the module compare the situations (and perceptions) of men and women, the poor and the rich, or even different ethnic groups. It should be noted in this regard that other regional or international surveys on governance and democracy (such as the Latinobarómetro surveys, to name the most significant in the Latin American region) use a more limited set of socio-economic descriptors (e.g. income poverty status or expenditure quintiles) and as such do not allow for a more detailed breakdown of survey results according to so many characteristics of the population. As a result, inequalities in the experience of various dimensions of governance cannot be addressed.
The wealth of information collected on governance and democracy, inaccessible by other methods, also allows for an in-depth analysis, which is more useful for the development of specific policies than the aggregate indicators available in international databases. Thus, for example, it has been possible to study the direct consequences of corruption on poor and non-poor households in Peru [12].
Figure 1.
Main subjects addressed in the Governance, Democracy and Transparency module.
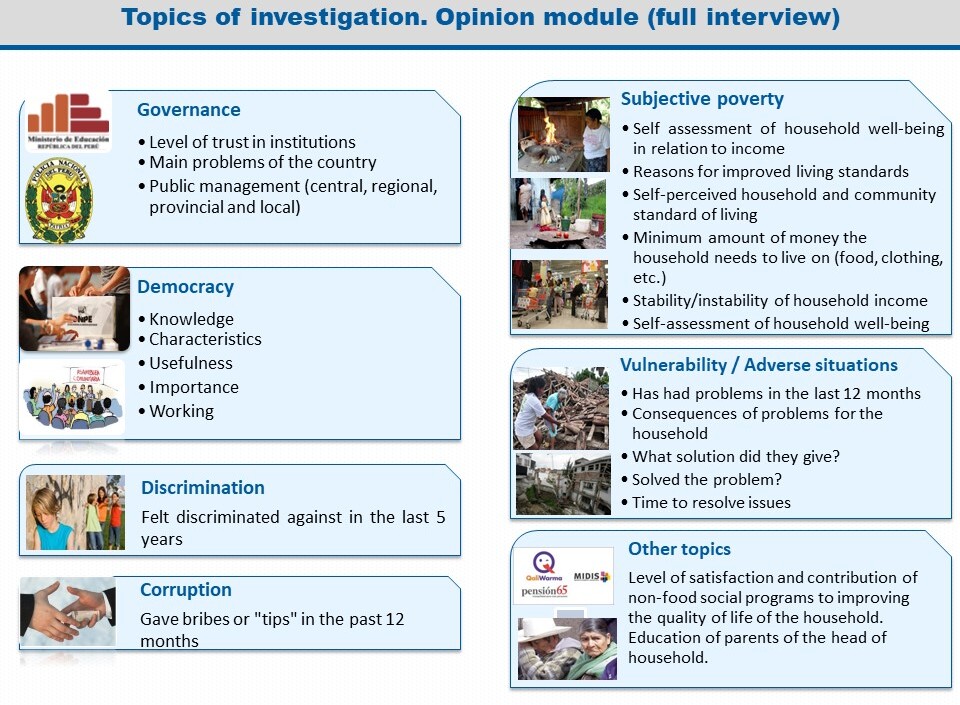
Another original feature: the module collects two types of governance-related information: 1) objective information, such as the incidence of corruption and discrimination, and experiences of political and civic participation, among others; and 2) subjective, perception-based information which traditionally falls within the remit of opinion surveys carried out by private entities of sometimes questionable quality. ENAHO’s Governance, Democracy and Transparency module investigates the population’s opinion on the country’s main issues, its confidence in public institutions, its adherence to the principles and the functioning of democracy, its subjective assessment of its poverty level, its perception of discrimination, its political preferences, and its future economic outlooks, both for the individual respondent and for the country as a whole (Fig. 1).
This way, it is possible to monitor and compare two key elements – both of which are equally important and cannot be reduced to each other (as evidenced in several articles in this issue; see for example [13]) – of these subjects and to break down information in several ways according to different categories of households or individuals.
2.3A long series of governance indicators over a period of 20 Years
INEI has produced a series of governance indicators spanning 20 years, during which there have been different types of government – from centre-right, to neo-liberal, to reformist. It was therefore possible to monitor the performance of these various regimes and to make an assessment of public policies through a range of indicators relating to corruption, confidence in institutions, the functioning of and adherence to democracy, civic participation, etc.
This continuous monitoring not only provides a basis for constructing indicators with different frequencies (quarterly, half yearly, annually) but also serves, on the methodological front, as a means of diagnosing the robustness of the surveys. Thus, on the one hand, it was possible to observe the stability of the structural variables, the subject of all ex ante apprehensions. On the other hand, changes in indicators over time were correlated with significant changes in the political context and public policies. Preconceived notions about the feasibility of governance surveys have been disproved. Households willingly answered governance-related questions: they even showed greater interest in these questions than in those relating to their income, consumption, etc. Finally, INEI was not subject to any political pressure to stop administering this module or publishing its results. This experience confirms the results obtained by [14] which demonstrate that, in the case of Africa, governance surveys carried out by NSOs do not present greater response bias than those carried out by institutions that are independent of the government (such as private polling institutes, research institutions, NGOs, etc.).
2.4A survey representative of the population as a whole
The random selection in each household of a person at least 18 years of age (using the next-birthday method) guarantees the possibility of obtaining indicators that are representative of the entire adult population. It must be noted that most opinion survey institutes use the quota method to obtain results that are representative of the population. Apart from the risk of generating survey bias, the quota method also has the disadvantage of making it impossible to calculate confidence intervals and to measure the accuracy of results. Moreover, in certain surveys, only the head of the household is interviewed, which also causes a bias in results, as heads of households are often men of a certain age, but governance issues affect men and women, the young and old, etc. in different ways.
The representativeness of the survey can also be interpreted literally as having an intrinsic value in contributing to democracy. Governance-related survey questions are an opportunity to make the voices of marginalised populations heard, as well as that of all citizens in the different regions of the country. It could therefore be argued that the results of the survey, to the extent that they contribute to the public debate, can help improve the democratic process.
2.5National coverage and inference at the departmental level
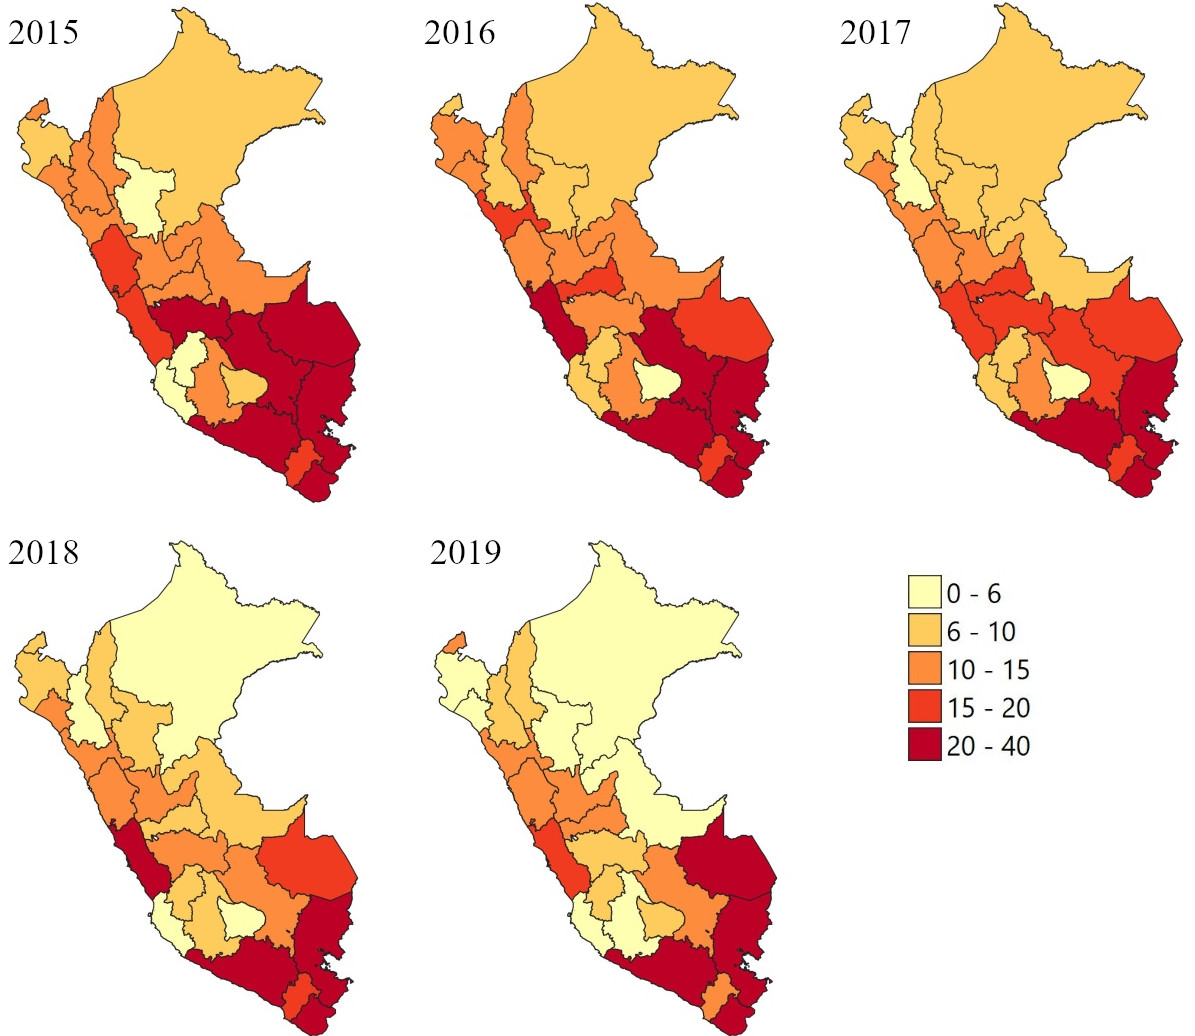
Sub-national representativeness allows for regional indicators to be developed (spatial breakdown: see maps in the appendix), and this offers a particularly valuable tool for managing the ongoing decentralisation processes and the strengthening of local democracy. Before and after the implementation of the decentralisation process, the governance module included specific questions related to expectations from this process and to actual results. The heterogeneity of the governance situation in each department (with regard to the management of mining royalties, social conflicts caused by the lack of basic infrastructure and by environmental contamination by the extractive industries, etc.) can be analysed in fine detail thanks to the sub-national representativeness of the survey. Also, thanks to standardised geo-coding, household survey data can be matched with data from other sources, such as administrative records (public resource allocations, level of execution of investment budgets, electoral data, etc.), thus paving the way for further statistical and econometric analysis.
By way of illustration, the maps presented in the appendix show, at departmental level, significant regional heterogeneity in the incidence of discrimination. The sense of injustice felt by certain categories of the population in respect to the discrimination they have experienced is a powerful driver of discontent, which can destabilise political regimes and lead to social conflict. The ENAHO’s Governance module allows for a geographically disaggregated assessment of discrimination, by location and by motive.
Departments in the south of the country, in particular the Andean ones, show a percentage of the population that feels discriminated against that is much higher than the national average. In recent years, the downward trend in the incidence of discrimination has been quite pronounced, except in the southern departments and in the capital. A more detailed analysis reveals that discrimination mainly occurs in health centres, in the workplace, when trying to access administrative services, and in interactions with the police. Notably, the population of the southern Andes presents a rate of discrimination that is higher than the national average in all of these settings, both public and private.
The grounds of discrimination also vary according to the location. Thus, in health centres, police stations or administrative buildings in general, economic factors (poverty, no-one to help “pull strings”) play a predominant role (70%). In other public places and in particular in schools, factors relating to ethnic identity play a major role (between 45% and 50%).
2.6A continuous survey with a panel composed of households and individuals
This approach offers all the recognised advantages of statistical surveys through random sampling: transparency of measurement procedures, representativeness of the information collected and quantification of phenomena, calculation of the precision of indicators, ensuring in particular their inter-temporal comparability. The panel dimension adds the possibility of reporting on perceptions of governance in relation to changes in individual circumstances. For example, do they have more confidence in a given institution following the loss of employment, after having fallen into poverty or after having been a victim of theft or corruption? Another advantage is that estimators are more accurate. Indeed, the parameters of cross-section regressions have a larger standard error than in the case of changes in indicators estimated from a panel of individuals or households [15].
The ENAHO’s sampling plan (for all of its modules) has a panel dimension. These are complex rotating panels with a maximum duration of five years and national, urban and rural representativeness. Once the sample panel is exhausted, a new panel is selected for a further five-year period. Therefore, over the 2007–2020 period (where the panel selection follows the same rotating panel scheme), we are able to study the individual trajectories of households over periods of different lengths: over two, three, four and five consecutive years. The number of households in each panel is large enough to enable the development of relatively detailed profiles of governance indicators according to the type of personal trajectory (for example, confidence in institutions for households that have fallen into poverty, the political participation of the chronically poor, etc.). On average, 8,052 households are monitored in bi-annual panels, 4,914 over three years, 3,166 over four years and 1,358 over the five years of the panel’s duration (Table 1).
Table 1
Number of households monitored according to the duration of the panel, 2007–2020
| Year in which panel started | 2-year panels | 3-year panels | 4-year panels | 5-year panels |
|---|---|---|---|---|
| 2007 | 6,293 | 4,247 | 2,565 | 1,129 |
| 2008 | 6,130 | 4,169 | 1,164 | 1,006 |
| 2009 | 6,205 | 1,262 | 2,999 | 1,940 |
| 2010 | 6,114 | 3,272 | 4,015 | |
| 2011 | 7,153 | 7,239 | 4,062 | |
| 2012 | 8,058 | 4,223 | 4,193 | |
| 2013 | 8,535 | 6,340 | ||
| 2014 | 9,464 | 6,684 | ||
| 2016 | 9,400 | 6,787 | ||
| 2017 | 9,466 | |||
| 2018 | 9,823 | |||
| 2019 | 9,987 | |||
| Average | 8,052 | 4,914 | 3,166 | 1,358 |
Sources: ENAHO; calculations by the authors. Note:
2.7Institutional arrangements within the INEI
The collection, quality control and initial analysis of the National Household Survey (ENAHO) data and the modules attached to this survey (including the module on governance, democracy and citizen participation) are carried out on a permanent basis within the Demography and Social Indicators Department. This department is in charge of the analysis of the Governance module, the construction of the indicators and the publication of a bulletin “Citizens’ perception of governance, democracy and trust in institutions” (20 reports published in the last 5 years). The ENAHO survey mobilizes about 100 people between interviewers, coders and analysts. Within this division, specialized officials are responsible for the analysis and publication of the results of the Governance module. Other officials are responsible for the analysis of the other components of ENAHO.
3.Some illustrative results
To gain a better understanding of the wealth of available data and its analytical potential, we present a selection of illustrative examples in this part.
3.1Governance: The country’s main issue and the agenda for public debate
Figure 2.
Main problems of the country in 2002–2020: the rise of governance issues.
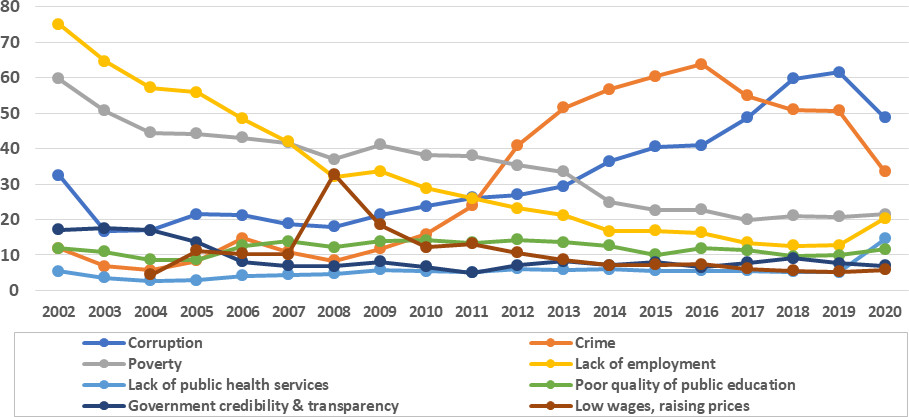
One of the major contributions of the module is that it highlights the importance that governance-related questions have assumed among the country’s main issues according to households during the past two decades (Fig. 2). While in the early 2000s, economic issues (poverty, unemployment) were by far the most prominent, this situation changed radically around 2014 when corruption and insecurity became, according to the population, the country’s main challenges.
It should be noted that the question posed is an open question and answers are then codified. This allows each individual’s perspective to emerge freely and spontaneously. The survey can be considered a means of free expression for citizens regarding their own priorities, and therefore an illustration of the intrinsic contribution of the survey to democracy. This contribution is especially important in contexts where freedom of opinion and of the press is constrained by an authoritarian regime or dictatorship. In the case of Peru, these results were published by the media, thus helping place questions related to governance and transparency at the heart of the public debate. Successive governments were forced to respond to survey results by establishing high-level anti-corruption commissions, organising public debates on this issue and making the fight against corruption a political priority (see following section).22 All presidential candidates have, without exception, proposed a head-on fight against corruption in their campaign programmes.33
When reviewing twenty years of governance statistics generated through ENAHO, it appears clear that the lack of resolve to fight corruption, and more generally the accumulation of unfulfilled promises, has significantly increased the percentage of those who believe that the “government’s lack of credibility” and the “government’s lack of transparency” are the country’s main problems (from 5% in 2011 to 9% in 2018).
3.2Poverty and corruption
Table 2
Petty bureaucratic corruption and poverty in Peru in 2002
| Expenditure quintiles | Incidence (total individuals) | Incidence (individuals in contact with the government) | Average cost (Peruvian soles per head/year) | Pressure from corruption (% of food expenditure) | Reason for failing to report (fear of repercussions, do not know how to) |
| I | 2.6% | 3.1% | 4.8 | 0.8% | 49.3% |
| II | 4.4% | 5.3% | 8.4 | 0.9% | 41.1% |
| III | 5.0% | 5.8% | 7.2 | 0.7% | 22.5% |
| IV | 6.2% | 7.1% | 21.6 | 1.4% | 30.9% |
| V | 7.9% | 8.9% | 33.6 | 1.2% | 29.5% |
| Poverty status | |||||
| Non-poor | 6.8% | 7.9% | 69 | 1.3% | 29.6% |
| Poor | 3.9% | 4.6% | 15 | 0.7% | 36.5% |
| Total | 5.2% | 6.1% | 48 | 1.1% | 32.3% |
Sources: ENAHO, Governance Module 2002, IV quarter, INEI; calculations by the authors. 18,598 households. Note: This corresponds to the number of individuals residing in a household where at least one member has been a victim of corruption. Average cost per head for victims of corruption who had to spend money. Corruption pressure is the share of expenditure on corruption in relation to food expenditure.
The scandal caused by the revelation in 2000 of the corruption network organised by presidential adviser Montesinos not only precipitated Fujimori’s downfall, but also brought the issue of corruption at the forefront of the public debate. While grand corruption had been the focus of much attention, with the prosecution and imprisonment of many political figures from the previous regime, petty corruption had so far been relatively overlooked. The public trial of Montesinos, the creation in the Congress of the Republic of five Corruption Investigation Commissions and the establishment within the judiciary of various anti-corruption mechanisms (anti-corruption courts, special chambers, anti-corruption prosecutors, ad hoc anti-corruption ombudsman, anti-corruption police) contributed actively to the fight against grand corruption. In the area of public procurement, the creation of the National Transparency Portal and the active role of CONSUCODE (Consejo Superior de Contrataciones y Adquisiciones del Estado – the Peruvian National Council for Contracts and Procurement) in monitoring contracts have made it more difficult for corruption to occur between the government and private companies. However, no serious mechanism for dealing with petty corruption has been put in place yet. It is this form of corruption that affects the population on a daily basis, as people can only access public services if they offer “gifts” and other bribes to indelicate junior or mid-level officials, of which they are victims. In this respect, the population is left without any recourse, despite the existence of the Defensoría del Pueblo (the Peruvian ombudsman) which falls woefully short of fulfilling its intended protective role. This form of corruption, beyond its direct financial cost for people who are victim of it, hinders access to public services, which themselves are far from covering the entire national territory, and also leads to a loss of confidence in public institutions. This combination of factors heightens inequalities. The fight against corruption and poverty, as well as the importance of strengthening democracy and human rights, were the focus of the discussion at the summit of the Heads of State of the Rio Group. This City Group, for which Peru currently holds the rotating presidency and which met at the end of May 2021 in Cusco, has made it possible to address these issues head on.
The past decade has seen a sharp rise in the perception of corruption and crime as the main problems of the country, far ahead of those affecting household economies (employment, poverty, low wages, rising prices). It can also be seen that over the past five years, concerns about crime has decreased while concerns about corruption continues to increase, to the point of becoming the country’s main issue according to the population. More in-depth analyses of the survey allow us to refine possible interpretations of these observations. Firstly, a distinction must be made between grand corruption involving the political class (notably the Odebrecht scandal which broke during this period) and petty corruption which has a direct impact on households. Secondly, recent changes in the political context and “objective” indicators illustrate a contrasting situation. While the incidence of petty corruption remains relatively low, grand corruption has triggered a strong reaction from the public through mass protests. The result has been that Peru has had five presidents from 2016 to 2021 (each term of office was meant to last five years) and one former president committed suicide during his arrest.
What do we know about corruption from the point of view of households? We have seen that this subject is a key priority for people, among other national issues. But what is the actual incidence of petty corruption and which public institutions are most involved in bribery practices? Who are the main target groups? What is the direct “cost” of bribery and how much does it weigh in the budget of each category of households? What proportion of corruption cases is reported and what are the reasons given when cases are not reported?
Contrary to a widespread belief, in Peru, the poor are relatively less affected by petty corruption than others, as can be seen in Table 2 for 2002. Generally speaking, the incidence of corruption increases with the standard of living. Two aspects nonetheless give nuance to this finding. Firstly, differential access to public services is due in part to corruption which primarily discourages those least able to enforce their rights, therefore above all the poor. Secondly, although the overall budgetary coefficient of corruption varies little according to standard of living, the amounts diverted in this way weigh more heavily on the poor as they deduct resources from an already inadequate expenditure base to cover for basic needs (food, education, health, etc.).
Figure 3.
Change in the incidence of corruption according to poverty status, 2003–2020 (%). Sources: ENAHO 2003–2020, INEI; calculations by the authors. Notes: As of 2012, the question regarding the victimisation of corruption was addressed to the head of the household, whereas in previous years it was addressed to a member of the household aged 18 years or over. Variations between 2011 and 2012 should therefore be interpreted with caution.
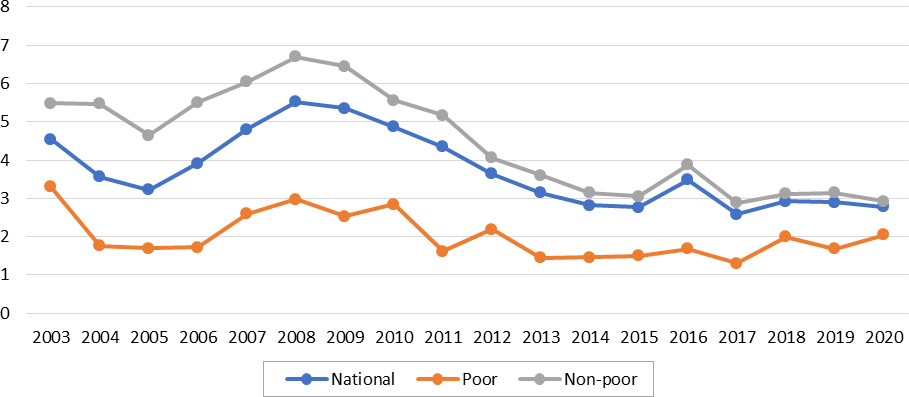
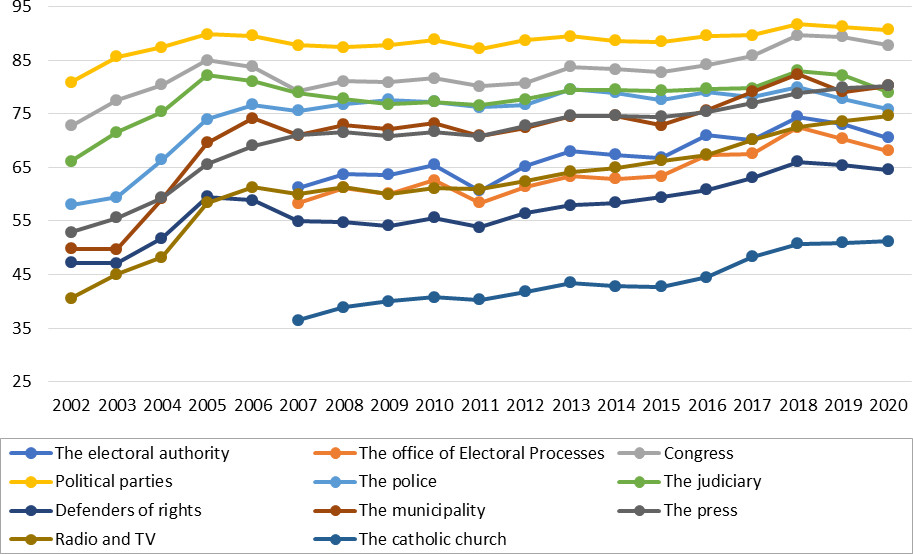
Figure 4.
Change in institutional distrust by type of institution, 2002–2020. Sources: ENAHO, Governance Module 2002–2020, INEI; calculations by the authors. Notes: % of those declaring “no” or “little” confidence in the institution in question.
An analysis of the time series demonstrates that the incidence of corruption for public service users (i.e. 90% of the population) is on a downward trend (Fig. 3), after peaking in 2008 during the term of President Garcia (who committed suicide in 2018 when he was convicted of corruption). In 2018, the further increase in the incidence of petty corruption coincided with the imprisonment of former presidents Kuczinsky and Toledo, as well as Lima’s mayor, Villarán, for accepting bribes from the Brazilian company Odebrecht. It is therefore possible that this grand corruption facilitated petty bureaucratic corruption among civil servants who felt ‘empowered’ to extract bribes.
The question asked in the 2018 survey was even more detailed than in previous versions, to enable a break-down of the results institution by institution. Firstly, and in terms of methodology, it appears that the estimated incidence of corruption measured for individual institutions is higher than that obtained through a question about corruption across all institutions combined (4.8% vs. 2.9%). Secondly, when considering only households that have been in contact with a given institution, the police ranked top of the list of institutions engaging in petty corruption, with 26% of households declaring they had fallen victim to corruption. This was followed by Peru’s national electoral authority (19.6%), provincial (12.6%), regional (8.8%) and finally municipal (6.9%) authorities. When asked to explain why cases were not reported, households pointed to the fear of repercussions (25.8%), a lack of interest by the authorities (27.2%) and a lack of time (23%). Moreover, around 15% of affected households did not report instances of corruption as they benefited from it. Corruption therefore has two sides: on the one hand, it constrains the population’s access to public services, and on the other hand, it makes it possible for some individuals to obtain services unfairly.
3.3Confidence in public institutions
Table 3
Dissatisfaction with the functioning of democracy according to socio-economic status, 2005–2020
| % | 2005 | 2010 | 2015 | 2020 |
|---|---|---|---|---|
| Urban | 78.3 | 64.0 | 59.6 | 61.6 |
| Rural | 60.1 | 43.2 | 38.6 | 44.0 |
| Male | 76.3 | 60.1 | 57.5 | 60.2 |
| Female | 71.1 | 58.0 | 52.9 | 56.3 |
| Poor | 66.7 | 46.4 | 43.2 | 45.3 |
| Not poor | 79.8 | 63.4 | 57.6 | 60.2 |
| Quechua | 63.7 | 49.0 | 44.9 | 52.5 |
| Spanish | 76.1 | 61.5 | 57.6 | 59.8 |
| Level of education | ||||
| Primary | 63.0 | 48.6 | 41.8 | 44.9 |
| Secondary | 77.7 | 63.7 | 58.6 | 60.6 |
| Higher | 83.0 | 64.7 | 64.0 | 67.8 |
| Employed | 73.2 | 58.8 | 55.0 | 57.9 |
| Unemployed | 83.7 | 67.6 | 57.9 | 63.9 |
| Economically inactive | 72.8 | 58.6 | 54.4 | 57.0 |
| Total | 73.5 | 59.0 | 55.0 | 58.0 |
Sources: ENAHO, Governance Module 2002–2020, INEI; calculations by the authors. Notes: % of those declaring that democracy is functioning “poorly” or “very poorly”.
Institutional trust is increasingly considered as a key indicator to measure the democratic health of a country (OECD, 2017). The case of Peru is symbolic in this respect. Figure 4 presents the level of distrust of a selection of institutions since 2002. At first glance, three major facts stand out. First, the level of distrust of institutions is exceptionally high on average. It reaches 90% with regard to political parties, which are totally discredited, but also parliament (88%). For the public institutions selected in the survey, the level of distrust is never lower than 60%. Secondly, the level of distrust has been on an upward trend, if we exclude the slight improvement of the atypical year of 2020. For example, whereas 40% of Peruvians did not trust the police at the beginning of the 2000s, this figure has now almost doubled (75%). Finally, not all institutions are in the same boat. The army, the national education system and the Catholic Church appear relatively unaffected. The latter inspires the greatest confidence, but the situation is deteriorating rapidly.
3.4The performance of democracy is not the same for all
An analysis of the dataset shed new light on phenomena that had been relatively unexplored until now, or were even totally unknown: for example, the strong attachment of citizens to democratic principles, in particular for the poorest among them. This result challenges common beliefs. Adherence to democratic principles is strong despite shortcomings in terms of the respect of some civil and political rights, such as freedom of speech, electoral transparency and, especially, equality before the law, despite the scale of petty corruption, and the profound disrepute of the political class, which played a central role in the current crisis.
In contrast to the population’s overwhelming support for democratic principles, the level of satisfaction with how they work in Peru is particularly low, as illustrated in Table 3. In 2020, 58% of Peruvians considered that democracy was functioning “poorly” or “very poorly”. But the situation is improving somewhat. In 2005, 74% responded negatively. Improvements were mainly seen in the second half of the 2000s but have stagnated since, with even a slight decline in 2020 compared with 2015, which can no doubt be attributed to the COVID-19 pandemic. All categories of the population are affected by democratic failures. But overall, it is the most privileged (the non-poor, educated, urban residents, non-indigenous populations, etc.) who are the most critical. The unemployed, who are among the most dissatisfied, are the only exception to this rule.
3.5Electoral participation and government failure
Table 4
Electoral participation (what election year?) and reasons for not participating by income quartile
| Quartile I | Quartile II | Quartile III | Quartile IV | Total | |
| % of those who did not vote | 20% | 15% | 10% | 8% | 13% |
| Reason for not participating | |||||
| No electoral card | 63% | 65% | 55% | 36% | 58% |
| Transport issue (cost, distance, etc.) | 12% | 12% | 14% | 19% | 13% |
| No identification document | 12% | 12% | 7% | 4% | 10% |
| Voting is pointless | 2% | 1% | 1% | 3% | 2% |
| Other | 11% | 10% | 22% | 38% | 17% |
Sources: Herrera et al. [4], as a basis for ENAHO, Governance Module 2002, INEI. Notes: Figures refer to municipal elections held in November 2002. Quartile I is the poorest and quartile IV the richest.
Our final example relates to the issue of the political exclusion of the most disadvantaged, concretely exposed in the case of Peru by lower levels of electoral participation, which is largely the result of government failures as shown by the following analysis. Thus, the percentage of those who did not vote in the 2002 municipal elections ranged from 20% for the poorest quartile to less than 10% for the richest (Table 4). This phenomenon is mainly due to the inefficiency of public institutions responsible for maintaining the electoral register and the national identity register; it should not be interpreted as the poorest quartile being less interested in politics than other quartiles. The absence of IDs not only prevents many citizens from exercising their fundamental right to vote, but also reduces their access to economic opportunities (access to credit and to property, foreign travel, etc.).
4.Use and political challenges related to the governance module
The production of governance-related indicators, however relevant and timely they may be, would remain a pointless exercise if the results were to remain unknown to the public, researchers and policy makers. To sustain the administration of the governance module over time, it was necessary to overcome reluctance both within INEI and externally. Meanwhile, a number of powerful institutional players who were convinced of the value of this innovative approach continued to express strong demand for the data generated by the governance module.
4.1INEI Peru’s distrust of opinion surveys
The Peruvian experience suggests that the adoption by the National Institute of Statistics of a module on governance and democracy cannot be achieved without encountering some obstacles and some level of scepticism. First of all, there was a widespread perception among different types of stakeholders (potential users) that opinion surveys, with all their subjectivity, cannot be used to build reliable and relevant indicators that are based on a verifiable reality and useful for public policy. However in Peru, as is the case in most countries worldwide, business and consumer surveys have long been based on perceptions. For many years, the Central Bank of Peru has carried out an opinion survey of leaders of large companies on their perception of growth prospects, their confidence in the future, etc. The decisions made by entrepreneurs (investments, hiring, etc.) are in fact largely based on perceptions on future developments. Many studies have demonstrated the strong correlation between subjective and objective indicators – and there is no reason to think that governance would be an exception.
A second hurdle was related to the idea that NSOs should refrain from interfering in political issues. The latter are not only considered by some to be outside the scope of responsibilities of NSOs (they are considered to be the exclusive domain of private polling institutions), but there is also a concern that statistical work in this area could expose NSOs to censorship by political powers (or to self-imposed censorship of results that are less favourable to the government). Through its institutionalisation over a period of 20 years, and through the reliability and credibility of results, the Peruvian experience refutes these claims. Another point of view, which in a certain sense is contrary to the previous one, considers that a public body like INEI which reports directly to the Presidency of the Council of Ministers, cannot be both judge and jury in the assessment of governance. This objection does not hold up when confronted with facts: traditional indicators, such as the rate of unemployment or poverty, which are at least as sensitive and directly mobilised for the assessment of government action, are regularly published by NSOs.
4.2A bottom-up strategy in response to a social demand
The adoption of the governance module is in line with a bottom-up strategy. This strategy was implemented during a period of democratic transition in Peru (fall of the dictatorship and transition government) against a backdrop of high demand for information by civil society. Multilateral bodies committed to the fight against corruption also played a major role. “Good governance”-related issues are increasingly central in discussions surrounding financial negotiations (or international support) and have encouraged authorities to respond to requests for statistical information on governance. The government has responded positively, by drawing on locally produced data. Indicators would otherwise have been provided by private organisations, some of which are very politically orientated (Heritage Foundation, etc.).
In terms of demand, the process of implementing the module is one of the strong points of the approach. The Peruvian case is exemplary in this respect: national ownership of the survey (despite some initial reluctances), under the joint coordination of INEI, the Ministry of Finance and the Prime Minister’s office; participation of civil society in the development of the questionnaire and the analysis of data; institutionalisation of the process of revising the survey over time; South-South cooperation between Peruvian experts and other countries in the region. Downstream, the experience demonstrates that governance and democracy indicators are subject to greater social demand than conventional socio-economic indicators, as seen through the strong reactivity of the public and the media during feedback sessions organised in the countries where this approach has been implemented (in Peru, but also elsewhere: Madagascar, Mali, etc.). Moreover, as we have already highlighted, by informing the public debate on governance issues, these types of surveys, in themselves, play a role in improving democracy, revealing public preferences and, finally, empowering populations “without a voice”.
4.3When supply creates its own demand
Governance, confidence in institutions, corruption and human rights were not only realities that were quantitatively difficult to grasp; these were also areas which had not been widely studied by social sciences in Peru. Sociologists and political scientists had not addressed them as they were ill-equipped in terms of statistical techniques. Economists believed that these issues, which were seen as too “subjective”, fell outside the scope of their research. This context made this initiative by INEI, supported by IRD researchers, particularly risky. The risk of failure was far from negligible, as demonstrated by other innovative surveys promoted by international bodies which failed to find a sustainable arrangement and had to be prematurely abandoned. It was therefore necessary, on the one hand, to convince decision-makers of the value of monitoring governance indicators and, on the other hand, to convince researchers skilled in statistical analysis of the importance of investigating the domain of governance to answer some of the questions they were asking about obstacles to economic growth, and about growth in general.
For this reason, a “participatory” approach was implemented from the outset to encourage the involvement of the main users (both actual and potential) of the survey results. We began by involving representatives of relevant public bodies44 in the design of the questionnaire to gauge their areas of interest and their concerns. Members of civil society organisations for which governance and human rights issues are a key concern were also consulted, as the survey was aimed at enhancing the accountability of the government towards the population. Another strategic decision was to include the governance module in an annual survey that was already funded by INEI’s recurrent budget, in order to ensure its sustainability. The reputation of researchers who have placed the functioning of institutions at the centre of their reflections, some of whom have been awarded the Nobel Prize in Economics (North in 1993, Stiglitz in 2001, Orstrom and Williamson in 2009), the publishing of seminal papers [16], and reference works (such as the influential Handbook on Corruption; [17, 18, 19]) dispelled doubts regarding the relevance of the module and its analytical potential.
Last, but not least, a policy of transparency and free and unrestricted access to the raw data from the survey, coupled with the regular dissemination of indicators in semi-annual reports (rolling half-year), facilitated the use of survey results by the media to inform the public debate. Resistance by political authorities has been overcome thanks to an institutional policy of reporting results on all variables of the governance module on a monthly basis to national authorities at the highest level (Head of State, the Presidency of the Council of Ministers and government institutions). The government therefore has access to a valuable diagnosis on the state of governance based on solid indicators, national coverage and departmental inference, disaggregated by socio-economic characteristics of the population. None of these benefits were present in the public opinion polls that, until then, had dominated the market to inform on issues that the population considered to be among the main problems of the country, and central to their own daily concerns.
5.Conclusions and perspectives
The Peruvian experience of INEI in measuring governance through household surveys is exemplary in many ways. Firstly, due to its longevity: INEI is a global pioneer in this field and offers continuous time series on a range of governance variables over the last two decades. Secondly, it deserves attention for its technical qualities and statistical innovation: representative national coverage with the possibility of regional and departmental inference, the panel component, a wide-ranging questionnaire and its inclusion in a general survey on living conditions, allowing for the cross-referencing of information across the various modules, highlighting the importance of perception indicators, quality control, availability of micro-data, etc. Finally, it is unique due to the process that has led to its creation and its sustainability. The result of an upstream South-South collaboration, with an earlier African experiment (in Madagascar, 1995) being tailored to the Peruvian context, it was able to generate institutional demand, which in turn helped consolidate it. Firmly established at the national level, the Peruvian experience continues to export a host of lessons learned and experience-sharing through South-South cooperation in the region.
This success has been far from straightforward. During this challenging journey, all kinds of resistance had to be overcome, from external institutions raising doubts about the capacity and legitimacy of a national statistical institute to be involved in such a project, to opposition from statisticians themselves. On several occasions, the survey module has been threatened with closure. Against this backdrop, it is fair to say that the Peruvian experience has significantly contributed to the validation of this approach to producing governance statistics, which is now considered an international standard [7]. Beyond the statistics alone, the adoption of SDG 16, which may seem obvious today, required empirical evidence that governance was at the heart of development processes in the same way as growth, inequalities and poverty, and the Peruvian case provides a prime illustration of this.
The Peruvian experience is far from complete and offers multiple prospects with a number of challenges still to be addressed as governance is still a new field in official statistical activities of NSOs. At the international level, INEI plays a leading role in the Praia Group on Governance Statistics. Notably, along with the Finnish NSO, it co-chairs the Praia Group’s “non-discrimination and equality” task team, which was launched in November 2021.55 Among the questions to be explored in greater depth on the analytical front is the need for a better understanding of the interactions between perceptions and experiences and between the economy and politics, which can only be achieved through more multi-disciplinary research leveraging these unique time series. Finally, we believe that the statistics produced remain underused (given its potential), in both academic66 and public policy terms. The data are meant to be used to both monitor and assess policies as well as to encourage democratic debate. The governance surveys are a powerful tool to inform dialogue between various actors, whether from the public or private sectors or from civil society.
Notes
1 See also the “SDG 16 survey” which aims to help NSOs report on survey-based indicators under SDG 16 which was designed as a set of topic-specific modules: https://www.sdg16hub.org/sdg-16-survey-initiative.
2 President Toledo’s government declared 2004 the year of “the rule of law and democratic governance”. Fujimori’s government even inaugurated the International Anti-Corruption Conference in Lima. However, it subsequently became clear that both presidents were involved in acts of corruption for which they were accused and convicted. Later, President Vizcarra (who was also accused of corruption) declared 2019 as the year of “the fight against corruption and impunity”.
3 A direct consequence was that this issue became the focus of public debate and demanded both the accountability of political powers and a response from the judiciary. Five Presidents were therefore convicted, three imprisoned and one (Alain Garcia) committed suicide when the police attempt to arrest him.
4 Public bodies that took part in the process include the Ministerio de Economía (the Ministry of the Economy), Contraloría General de la República (the Controller General of the Republic), Defensoría del Pueblo (the Peruvian ombudsman), Congreso de la República (the Congress of the Republic), and Presidencia del consejo de Ministro (the Presidency of the Council of Ministers). In terms of civil society, participants included the Comisión Nacional de la Juventud (the National Youth Commission), Instituto de Estudios Peruanos (the Institute of Peruvian Studies, an NGO), Ciudadanos al Día (an NGO), and academic research centres.
5 This team is responsible for creating a survey module covering non-discrimination and equality as well as making recommendations for the collection of administrative data relating to these issues.
References
[1] | Stiglitz JE, Sen A, Fitoussi JP. Report by the Commission on the Measurement of Economic Performance and Social Progress. (2009) . Available from: http://ec.europa.eu/eurostat/documents/118025/118123/Fitoussi+Commission+report. |
[2] | Stiglitz JE, Fitoussi JP, Durand M. Beyond GDP: Measuring What Counts for Economic and Social Performance. Paris: OECD Editions; (2018) . |
[3] | OECD. How’Life? Measuring Well-Being. Paris: OECD Editions; (2018) . doi: 10.1787/9789264121164-en. |
[4] | Herrera J, Razafindrakoto M, Roubaud F. Governance, Democracy and Poverty Reduction: Lessons drawn from household surveys in sub-Saharan Africa and Latin America. International Statistical Review. (2007) ; 75: (1): 70-95. |
[5] | Herrera J, Razafindrakoto M, Roubaud F. Poverty, Governance and Democratic Participation in Francophone Africa and the Andean Region. OECD Journal on Development. Special Issue: Measuring Human Rights and Democratic Governance. (2008) ; 9: (2): 99-118. |
[6] | OECD. OECD Guidelines on Measuring Trust. Paris: OECD Editions; (2017) . |
[7] | UNSD and Praia Group. Handbook on Governance Statistics. NewYork: UNSD; (2020) . |
[8] | Quiroz A. Historia de la corrupción en el Perú. Lima: IEP; (2013) . |
[9] | McMillan J, Zoido P. How to Subvert Democracy: Montesinos in Peru. Journal of Economic Perspectives. (2004) ; 18: (4): 69-92. |
[10] | Pozsgai-Alvarez J. El ciclo político de la lucha contra la corrupción: La experiencia del Perú con su primera Comisión Nacional Anticorrupción. Derecho y Sociedad. (2019) ; 52: : 81-96. |
[11] | Herrera J, Razafindrakoto M, Roubaud F. Les sciences sociales au service du débat démocratique au Sud: enjeux, supports, retombées. Résultats d’expériences dans le champ de l’économie et de la statistique. In: Vidal L, editors. Les savoirs des sciences sociales : débats, controverses, partages. Marseille: IRD Editions; (2005) . pp. 95-123. |
[12] | Herrera J, Roubaud F. Corruption and Poverty in Peru. In: Global Corruption Report 2004. Berlin: Transparency International; (2004) . pp. 343-345. |
[13] | Assany Y, Rakotomanana F. Perceptions and Experiences in Madagascar: Origins of Differences in Terms of Corruption, Criminal Violence and Discrimination. Statistical Journal of the IAOS. (2022) (in this Special Section). |
[14] | Calvo T, Razafindrakoto M, Roubaud F. Fear of the state’ in governance surveys? Empirical evidence from African countries. World Development 123; (2019) . |
[15] | Deaton A. Analysis of household surveys. A microeconometric approach. Washington DC: The World Bank; (2019) . |
[16] | Acemoglu D, Johnson S, Robinson A. The colonial origin of comparative development. American Economics Review. (2001) ; 91: (5): 1369-1401. |
[17] | Rose-Ackerman S. The political economy of corruption. In: Elliott K, editor. Corruption and the Global Economy. Institute for International Economics; (1997) . pp. 31-60. |
[18] | Rose-Ackerman S. The economic impact of corruption. In: Rose-Ackerman S, editor. Corruption and Government: Causes, Consequences and Reform. Cambridge: Cambridge University Press; (1999) . pp. 9-26. |
[19] | Rose-Ackerman S. International Handbook on the Economics of Corruption. Edward Elgar; (2007) . |
[20] | Hunt J. How corruption hits people when they are down. Journal of Development Economics. (2007) ; 84: : 574-589. |
[21] | Hunt J. Why are some public officials more corrupt than others? In: Rose-Ackerman S, editors. International Handbook on the Economics of Corruption. Edward Elgar; (2007) . pp. 323-351. |
[22] | Yamada G, Montero G. Corrupción e inequidad en los servicios públicos. Universidad del Pacífico et CIES; (2011) . Documento de Trabajo No. 87. |
Appendices
Appendix
Figure A1.
The sub-national nature of governance. The example of departmental discrimination maps, 2015–2019.