
Transitioning an employee panel survey from telephone to online and mixed-mode data collection
Abstract
Employee panel surveys, which are essential for measuring ongoing labor market developments, are facing significant challenges of respondent recruitment and retention. Even interviewer-administered panel surveys, historically considered the gold standard form of data collection, are facing high costs and nonresponse issues that threaten their sustainability and inferential capabilities. Supplementing interviewer-administration with online data collection is a popular method of reducing costs and may improve contactability and reduce nonresponse in employee surveys. However, the effects of introducing online data collection in an ongoing panel survey of the employed population have received little attention. We address this research gap by analyzing a mode design experiment embedded in the fourth wave of a German employee panel survey. Individuals were randomly assigned to the standard telephone-only design, or a sequential web-telephone mixed-mode design. An invitation letter experiment was also conducted to test the effect of mentioning the telephone follow-ups in the web survey invitation. Introducing the mixed-mode design led to a higher response rate (59.9% vs. 50.1%), similar levels of nonresponse bias, and lower costs compared to the single-mode design. Mentioning the telephone follow-ups had no effect on participation in the web starting mode or the full mixed-mode design. Implications of these findings for survey practice are discussed.
1.Introduction
As a nation’s economic success depends on its employed population, many developed nations and research institutions conduct employee panel surveys that follow the same employees over time and measure individual-level changes in their attitudes, behaviors, and working conditions [1, 2]. Examples of large employee panel surveys are the Labour Force Surveys of Canada [3], the UK [4], the European Union, candidate and European Free Trade Association nations [5], and the Further Training as a Part of Lifelong Learning study in Germany [6]. Employee panel surveys are often collected for purposes of industry classification, comparisons between and within nations, and political decision-making [7]. Such surveys have gained increasing importance in employment research [8, 9, 10], especially due to shifts in labor market behavior caused by the COVID-19 pandemic [11, 12].
However, a major concern of panel surveys is nonresponse and attrition, which reduce sample sizes and can lead to biased estimates if respondents differ from nonrespondents on the key survey variables [13]. As nonresponse accumulates over time, the risk of nonresponse bias increases, highlighting the importance of strategies to minimize nonresponse and/or attrition in panel studies [14, 15, 16, 17]. The mode of data collection plays a major role in panel surveys. Historically, interviewer-administered modes (e.g. telephone, face-to-face) have been the gold-standard mode for maximizing recruitment and retention in panel surveys. However, with rising survey costs and the difficulty of reaching certain subgroups – including employed individuals – interviewer-administered modes are often supplemented (or replaced) with less-expensive, self-administered modes, such as web surveys [18, 19, 20].
In the context of employee panel surveys, there are multiple reasons why supplementing or replacing interviewer-administration with online data collection may be advantageous. First, for telephone panel surveys, panelists without a valid telephone number (due to number change or telephone disconnection) but with a known postal (or email) address can continue to be reached (e.g., by invitation letter with accompanying login information for the online survey) as opposed to being excluded due to the inability of establishing telephone contact. It might also be possible to match panelists with unknown telephone number to official telephone lists, however, the amount of listed telephone numbers (mobile and landline) has decreased rapidly over the years and listed numbers are likely to be selective [21, 22].
Second, introducing a web mode offers greater flexibility to panelists, especially those who are busy and work full-time, enabling them to complete the survey at their own convenience. Panelists who work on internet-enabled computers or other devices as part of their employment duties may even prefer to complete the web survey during business hours (e.g. during their lunch break), which saves time for other activities outside of work.
On the other hand, transitioning to online data collection in the middle of an ongoing panel survey may also have drawbacks. For example, panelists have become accustomed to being interviewed in their usual interviewer-administered mode and do not anticipate this changing in the future. In fact, interviewer-administration may have been the primary motivator for initially joining the panel and continuing to participate. Thus, it may come as a shock when they are pushed to the web as part of a cost-cutting move, which may reduce their motivation to participate further. Offering a sequential mixed-mode design in which web nonrespondents are followed up with the original interviewer-administered mode may mitigate the risk of nonresponse during the transition, although this may depend on whether panelists are explicitly informed from the outset that their usual interviewer mode will be offered later if they do not engage with the web mode.
Against this backdrop, the current study assesses the initial effects of transitioning from telephone-only to online and mixed-mode data collection on participation in an ongoing national employee panel survey in Germany. Specifically, we report the results of a mode design experiment in which panelists in the fourth wave of the survey were randomly assigned to the traditional telephone-only design, or a sequential mixed-mode design with web starting mode and telephone follow-ups. A random subsample of employees assigned to the mixed-mode design were also explicitly informed about the planned telephone follow-ups in the invitation letter to determine whether this knowledge affected their participation in the survey. In addition to assessing response rate effects, we utilize rich administrative data to assess the impacts of introducing the mixed-mode design on nonresponse bias and explore whether certain subgroups (e.g. full-time workers) differentially participate in the web starting mode and the full sequential mixed-mode design relative to the telephone-only design. Potential cost savings are also assessed. Specifically, we address the following research questions:
1. Does mentioning the planned telephone follow-ups in the invitation letter affect web take-up rates and participation in the mixed-mode design?
2. Does switching from a single-mode telephone design to a sequential web-telephone mixed-mode design in an ongoing employee panel survey affect response rates in the initial wave of the switch?
3. Are there differences in nonresponse bias between the telephone-only design and either the a) the web starting mode or b) the full sequential web-telephone mixed-mode design?
4. Does the likelihood of participation vary for specific employee subgroups (e.g. full-time workers) across both modes and mode designs?
5. Does the mixed-mode design yield potential cost savings (on a per-respondent basis) relative to the single-mode design?
2.Background
2.1Mixed-mode panel surveys
Panel surveys gained increasing importance at a time when interviewer-administration was the primary data collection method. Many panel surveys introduced during these times continue to use telephone or face-to-face interviewing as their primary mode of data collection. Examples include the Panel Study of Income Dynamics (PSID) [23], the German Socio-Economic Panel (SOEP) [24], and the Swiss Household Panel (SHP) [25], although some panels were forced to scale back certain forms of interviewer-administration (e.g. face-to-face interviewing) to comply with lockdown restrictions imposed during the COVID-19 pandemic [12, 26, 27, 28].
Unlike face-to-face panel surveys, telephone panel surveys have had to cope with several widespread technological developments, such as declining penetration of landline telephones [29], increasing use of telephone screening devices [30], and the rise of mobile-only households [31]. Additionally, households may change their phone number or disconnect their service without informing the survey organization. These developments have contributed to declining telephone participation and very low response rates in telephone surveys [32, 33]. To illustrate this point, response rates of US telephone surveys conducted by the Pew Research Center have declined from around 28% in 2001 to around 6% in 2018 [34].
To counter these trends, many surveys supplement (or mix) interviewer-administration with online data collection given high rates of internet coverage in many countries [35, 36]. A popular mixed-mode strategy is to deploy multiple modes sequentially, typically starting with the least-expensive, usually self-administered mode, and following up initial nonrespondents with a more expensive interviewer-administered (e.g. telephone or face-to-face) mode [30]. Sequential mixed-mode designs have greater potential for cost savings compared to concurrent mixed-mode designs as all sample units are “pushed” to the less-expensive mode from the outset [30, 37, 38], often not knowing that a more expensive interviewer-administered mode will be offered later if they do not engage with the initial mode(s). In addition to potential cost savings, introducing a self-administered mode in an otherwise interviewer-administered panel survey may afford particular benefits to panelists. Specifically, offering the web mode provides panelists with the opportunity to participate at their convenience. This is an essential feature for many working professionals, and especially full-time workers, who participate in panel studies but are difficult to reach with traditional interviewer modes. Employees who use computers at their workplace or work from home can flexibly participate in the web survey during the day without relying on an interviewer to contact them.
However, changing the data collection mode in a panel survey can also have potential negative effects. For example, panelists who have developed a good rapport with their usual interviewer may lose interest in participating if the study is pushing them to complete the survey online. Further, panelists with lower digital affinity may be put off by the mode switch and become reluctant to adopt the web mode, which could reduce their likelihood of further participation in the panel. Low digital affinity is, however, less of an issue in western nations where the share of internet usage in the population is high (e.g. Netherlands: 95%, Germany: 91%, Spain: 94%, France: 92%) [39].
Considering these potential strengths and drawbacks, it is important to evaluate the effect of introducing web on response rates, nonresponse bias, and the likelihood of continued participation in ongoing employee panel surveys. The present study addresses this understudied area of research.
We note that altering the mode design can also have implications for measurement mode effects [40, 41, 42, 43, 44, 45]. While we acknowledge the importance of measurement effects, this topic is not considered further and is left to future work.
2.2Effects of introducing web in panel surveys
A small set of large-scale population-based panel studies have experimentally assessed the participatory effects of introducing a web mode as part of a sequential mixed-mode design. In the fifth wave of the UK Household Longitudinal Study Innovation Panel (UKHLS-IP), panelists and refreshment cases were randomly allocated to a sequential mixed-mode design with web starting mode and face-to-face follow-ups, or the usual face-to-face designs; unconditional incentives were used in both mode designs. Switching panelists to the mixed-mode design in the fifth wave did not have a statistically significant effect on response rates among fourth wave respondents (mixed-mode: 81%, face-to-face: 84%;
The US National Longitudinal Study of Adolescent to Adult Health (Add Health) experimentally tested a mixed-mode design in its 5
In 2014, the SOEP, an annual primarily face-to-face panel survey, explored the effects of introducing web on response rates by experimenting with households that had previously participated in at least four waves of the face-to-face panel survey “Families in Germany” (FiD). In 2014, funding for the FiD study expired and the panelists were integrated into the SOEP core study. The FiD sample consisted of a cohort and a screening sample. The main difference between the samples was that all cohort households had children under 8 years, while all screening households had children under 18 years [49]. The screening sample was assigned to a sequential web-face-to-face mixed-mode design, while the cohort sample was allocated to a face-to-face single-mode design. The mixed-mode design had a negative effect on the response rate (face-to-face: 82%, web-face-to-face: 70%), but lowered costs relative to the single-mode design [50]. However, these results could be influenced by the aforementioned differences in household composition.
The SHP – an annual telephone panel survey – conducted an extensive mode (design) experiment over two waves in 2018 and 2019. Unconditional incentives were used in all experimental groups. Here, we describe only a side experiment in which Swiss households were interviewed primarily by telephone or face-to-face (in the case of unknown telephone number) in 2018, while these respondents were randomly allocated to telephone and face-to-face (in case of missing telephone numbers) (70% of households) or a web single-mode design (30% of households) in 2019. Households assigned to the web mode yielded a similar response rate (75%) compared to those assigned to the interviewer-administered mode (77%), which was not a statistically significant difference [51, 52], suggesting that the switch to web did not have an immediate negative effect on participation in the panel.
The US Panel Study of Income Dynamics (PSID), a biennial telephone survey, evaluated the implementation of self-administered modes in 2014. Individuals who completed the 2013 wave of the PSID were invited by mail to complete a supplemental study in 2014. All individuals who reported in the 2013 wave that they had connected to the internet at home in the past year (73%) were assigned to a web-only design, while the remaining individuals were assigned to a web-mail sequential mixed-mode design. The invitation letter sent to the mixed-mode group stated that the survey could be completed via a paper questionnaire that would be mailed to them if they did not complete the web survey within two weeks. Response rates were presented for three randomly allocated prepaid incentive groups ($0, $5, $10). Response rates in all three incentives groups were higher in the web-only design ($0: 16%; $5: 26%; $10: 30%) compared to the web-mail design ($0: 9%; $5: 16%; $10: 21%) [53], suggesting that mentioning the follow-up paper mode had a negative effect on the response rate and may have given the impression that individuals were free to choose between either mode, akin to a concurrent mixed-mode design, as opposed to being “pushed” to the web mode.
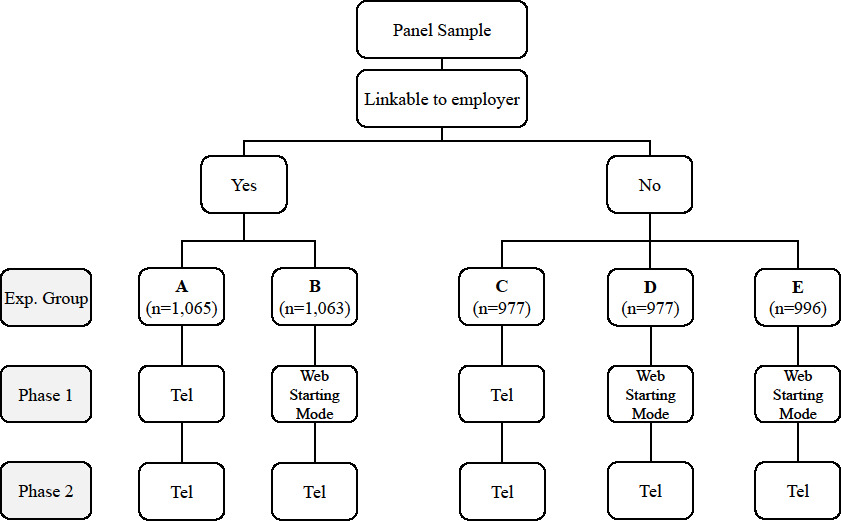
Figure 1.
Diagram of the mode design experiment. Note: The invitation letter sent to groups B and D did not mention planned telephone follow-ups, whereas the invitation letter sent to group E did mention the telephone follow-ups.
The PSID additionally conducted a targeted invitation letter experiment in 2016 with panel members at least 30 years of age by assigning the whole sample to a sequential web-paper mixed-mode design. The experiment made use of two invitation letter variations. While the first variation (mentioning group) informed the individuals that a paper questionnaire would be sent in two weeks if they did not complete the web survey, the second invitation letter variation (hiding group) did not mention the paper follow-up stage. Panel members with a predicted web response probability greater than 70% were assigned to the hiding group, while individuals with a web response probability less than 30% were allocated to the mentioning group. Panel members with a predicted web response probability between 30% and 70% were randomly allocated to both invitation letter variations. Both invitation letter variations produced similar response rates for individuals with web response probability between 30% and 70% (hiding group: 68% vs. mentioning group: 71%;
2.3Summary of previous findings and research gaps
Some conclusions can be drawn from the aforementioned literature on introducing a web-first phase in an interviewer-administered panel survey. First, the literature suggests that introducing a web-first phase in a traditional interviewer-administered panel survey does not always increase the response rate in the wave the web mode was introduced. Second, the literature suggests that introducing a web-first phase in a traditional interviewer-administered panel survey reduces survey costs [42, 48, 50].
However, nearly all of these results are gathered from general population surveys and some of these studies used incentives. Further, not all of these studies tested for statistically significant differences between response rates. Thus, it is unclear if results from these studies can be transferred to other surveys, including employee surveys that do not use incentives. For instance, as previously mentioned, employees may be more likely to participate via web compared to the general population as they are busier during the day and may use internet-enabled devices during work hours. Thus, studies are needed to experimentally test the effects of introducing web in a telephone employee panel survey. Not only are effects on response rates important, but also nonresponse bias and whether certain employee subgroups (e.g. full-time workers, commuters) differ in their likelihood to participate via web and/or mixed-mode design, compared to single-mode interviewer-administration.
What is also unknown is the effect of mentioning the follow-up interviewer-administered mode in the invitation letter. Keeping in mind that all panel cases were originally recruited and responded at least once in the interviewer-administered mode, they may be more inclined to stand pat and wait for this mode to be offered if it is mentioned in the invitation letter, which may reduce the likelihood of taking up the web starting mode and negate the intended effects of the “push-to-web” design. Given that one of the intended effects of a push-to-web design is to reduce costs, it is important to test whether mentioning the follow-up mode from the outset affects web survey participation.
3.Data and methods
3.1Study design
A mode design experiment was carried out in the fourth wave of the German employer-employee panel survey, the Linked Personnel Panel (LPP). The first part of the LPP is a biennial employer survey (conducted by the survey institute Kantar) that started in 2012 and covers topics related to human resources and digitalization. The second part is an employee survey that started in 2013 and collects biennial data on topics related to employment and human resource issues, financial aspects, and physical and mental well-being. The employee sample is drawn from establishments that once participated in the LPP employer survey. All employee interviews of the first three waves (2013, 2015, 2017) were conducted via telephone by the Institute of Applied Social Sciences (infas). The LPP employee survey is representative of all employees subject to social insurance in Germany who work in private establishments with at least 50 employees excluding the agricultural, fishing, and forestry sectors. As our focus is on the employee survey, we use the term LPP to refer exclusively to the LPP employee survey.
To address issues of declining response and coverage [55, 56, 57], the LPP experimentally implemented a sequential mixed-mode design in its fourth wave (2019). A total of 5,118 panelists from 1,662 establishments were randomly allocated to either a telephone single-mode design or a sequential mixed-mode design with web starting mode and telephone follow-ups. Figure 1 shows the experimental design. At the first stage, the employee panel sample can be distinguished between employees whose survey data can be linked to the LPP employer survey (
The mode design experiment was conducted separately for the linkable employees (randomly allocated into experimental groups A, B) and non-linkable employees (randomly allocated to experimental groups C, D, E) to control for possible differences between these two sets of employees. Employees were randomly allocated to either the sequential web-telephone mixed-mode design (groups B, D, E) or the conventional single-mode telephone design (groups A, C). Postal letters were mailed to the home addresses of the panel members on the 16
All mixed-mode groups that did not complete the survey using the web starting mode within the first two weeks were sent one reminder on the 30
3.2Data
To aid in evaluating the mode design experiment, including estimating nonresponse bias and determinants of survey participation, five external data sources are used. Table 1 provides an overview of the data sources, variables used, and variable coding and labeling.
Table 1
Variables, data sources, and variable categories
| Variables | Value labels |
|---|---|
| Demographics (source: IEB) | |
| Sex | Male, female |
| Age | Years: |
| German citizenship | Yes, no |
| Secondary education | Less than university entrance qualification, university entrance qualification |
| Higher education | Less than university degree, university degree |
| Employment (source: IEB) | |
| Employment contract | Full-time, part-time |
| Daily earnings | Euros: |
| Occupation | Production, business/administration, other |
| Years working for employer | |
| Benefits (source: IEB) | |
| Benefits last 10 years | Yes, no |
| Job seeking last 10 years | Yes, no |
| Geodata (Source CD, BA) | |
| Region | North, West, South, East |
| Urbanicity | Population: |
| Commute | Kilometers: |
| Fast internet | % of households with 100 or more Mbit/s: |
| LPP Survey | |
| Teleworking | Yes, no |
| General trust | Low, high |
| Household size | 1, 2, 3 |
| Big Five: Openness | Low, medium, high |
| Big Five: Extraversion | Low, medium, high |
| Big Five: Agreeableness | Low, medium, high |
| Big Five: Conscientiousness | Low, medium, high |
| Big Five: Neuroticism | Low, medium, high |
| Employee linkage consent | Yes, no |
| LPP Paradata | |
| Contact attempts wave 3 | |
| First interview wave | Wave 1, wave 2, wave 3 |
| Item nonresponse wave 3 | 0, 1–2, 3 |
| Employer linkage | Yes, no |
The first data source consists of administrative data from the German Institute for Employment Research (IAB) (reference year 2019) available for all employees subject to the German social insurance system [58]. From these first administrative data source, three variable groups can be formed: demographics, employment, and benefits. The demographics variable group consists of sex, age (in years;
The second data source is the Community Directory (CD) of the German Federal Office of Statistics (reference year 2019), which includes geodata (e.g. mean longitude and latitude, population size) of each German municipality. The CD data are used to generate variables on urbanicity (number of inhabitants in the city of residence) and commuting distance to work. Commuting distance (fastest way by car between the geographic center of the employer’s and employee’s residence postal code) was calculated using the R-package gmapsdistance.
The third data source is the Broadband Atlas (BAT) [59] (reference year 2019) of the German Federal Ministry of Transport and Digital Infrastructure, which contains data about internet quality and speed at the postal code level. These data are used to generate the percentage of households within the employee’s residential postal code that have access to fast internet speeds of at least 100 megabits per second. The CD and BAT data comprise the geodata variable group consisting of region (north, west, south, east), urbanicity (population count;
The fourth data source consists of LPP survey data collected from previous waves. We use the following variables: whether the employee teleworks (yes, no), level of general trust (low, high), household size (1, 2, 3
The fifth data source is the LPP paradata collected during the third wave. These data include the variables: number of item missings in wave 3 (0, 1–2, 3
Question wordings and response options (translated to English) for each survey variable (Table S1), information about coding and handling of missing values for each survey variable (Table S2), as well as descriptive statistics and distributions of each survey and administrative variable (Table S3) are available in the online appendix.
All of these variables were selected based on their prior usage in methodological research on nonresponse, mode effects, and employee samples, as well as their potential interactions with the mode design on survey participation. Sociodemographic characteristics (e.g. age, gender and education) are commonly used to study panel attrition [17, 62, 63, 64] and mode effects on nonresponse [51, 65, 66, 67]. Employment characteristics are also used to study nonresponse and other errors of non-observation [68, 69, 70, 71, 72, 73].
Research has identified paradata [74, 75, 76] and Big Five personality traits [62, 77, 78, 79] as predictors of panel attrition. These variables could also interact with the mode design indicator. For instance, difficult to reach employees requiring many telephone contact attempts in wave 3 could be more likely to participate via web compared to telephone. In addition, employees with high scores on the Big Five personality trait openness could also more likely to participate via web compared to telephone, as these individuals are likely to adopt changes more quickly (i.e. introduction of new techniques like mobile phones) [60, 61]. We note that all administrative demographic, employment, and benefit variables are measured similarly in the LPP employee survey and thus serve as suitable proxies for estimating nonresponse bias.
4.Methodology
This chapter describes the methodology used to analyze the mode design experiment and invitation letter experiment. The key outcomes of interest are response rates, nonresponse bias, predictors of survey participation (including interactions with mode and mode design), and survey costs. This section describes how these outcomes were calculated.
All analyses of the mode (design) experiment are presented separately for the telephone single-mode design, the web starting mode (treating telephone follow-up respondents as nonrespondents), and the full web-telephone sequential mixed-mode design. Note that the web starting mode is simply the first phase of the full web-telephone sequential mixed-mode design, with the telephone follow-ups conducted in the second phase. Decomposing both phases of the mixed-mode design allows for: 1) disentangling the effects of the web starting mode from the full mixed-mode sequence; and 2) performing single-mode comparisons between the web starting mode of the mixed-mode design and the telephone mode of the single-mode design.
Employees that answered every question are classified as respondents. As web interviews were possible during the entire field period, we classified employees who responded via the web starting mode after the telephone follow-up phase had started as web respondents in the forthcoming analysis. The online supplement includes the final disposition codes for both mode designs (see Table S4).
As the main focus of this study is on randomization rather than representation and because nonresponse adjustment weights were not available for the experiment, all analyses are performed unweighted using Stata 16 [80] and R [81].
4.1Outcome rate calculations
Response rates are calculated using the AAPOR [82] Response Rate 1 definition, which is the proportion of the fielded sample that completed the interview:
(1)
Contact and cooperation rates are also reported but only for the telephone-only design and the telephone follow-up stage of the mixed-mode design, as we have no definitive information about contacts and refusals for the web starting mode. The contact rate is calculated as the proportion of the fielded sample that was successfully contacted (target person or household) and the cooperation rate is the proportion of successfully contacted employees who completed the interview:
(2)
(3)
4.2Estimating nonresponse bias
Nonresponse bias is estimated for the following administrative variable groups: demographics, employment, benefits, and geodata. Estimates of nonresponse bias are constructed by calculating the difference between the proportion of a variable category (
(4)
The absolute nonresponse is also reported which simplifies comparisons between different variable categories:
(5)
In addition, we report the absolute relative nonresponse bias, which assesses the magnitude of nonresponse bias in the survey estimate relative to the full sample estimate [83]:
(6)
As summary measures of nonresponse bias, we present the average absolute nonresponse bias (AANB) and the average absolute relative nonresponse bias (AARNB) by dividing the sum of the absolute (and absolute relative) nonresponse bias estimates by the number of total bias estimates computed across all variable categories (
(7)
(8)
These summary measures are calculated separately for each variable group and overall across all variables. These aggregate estimates are used to facilitate the comparisons between the different mode designs.
4.3Modeling survey participation
Logistic regression models are used to examine predictors of survey participation, including the mode design indicator, all employee characteristics described in the data section, and interactions between both. The regression models are fitted separately for the single mode comparisons (telephone-only vs. web starting mode) and mode design comparisons (telephone-only vs. web-telephone), where the single mode comparison involving the web starting mode treats the telephone follow-up respondents as nonrespondents. Both a main effects model and an interactions model are fitted to test for mode (design) effects for specific subgroups and overall. All variables described in section 3.2 are included as predictors of survey participation (1
(9)
where
4.4Estimating survey costs
Table 2
Outcome rates for web starting mode and full web-telephone design, by invitation letter version
| Experimental group D (Telephone mode not mentioned) | Experimental group E (Telephone mode not mentioned) | |||
| Web starting mode | Web-telephone | Web starting mode | Web-telephone | |
| Sample size | 997 | 997 | 996 | 996 |
| Respondents (total) | 324 | 580 | 308 | 597 |
| Telephone | 0 | 256 | 0 | 289 |
| Web | 324 | 324 | 308 | 308 |
| Response (%) | 32.50 | 58.17 | 30.92 | 59.94 |
| Contact (%) | N/A | 86.87 | N/A | 86.93 |
| Cooperation (%) | N/A | 46.63 | N/A | 50.52 |
Notes:
Survey costs are estimated per respondent for the telephone single-mode design, the web starting mode, and the full web-telephone mixed-mode design. Though the true costs are unknown, hypothetical (yet realistic) values informed by the survey institute are applied. The web starting mode comprises mainly postal communication costs, which are 0.95 Euro for one invitation letter and 0.80 Euro for one reminder letter [84]. Printing, enveloping, and letter handling are assumed to cost 0.05 Euro per letter. The telephone mode costs consist of the aforementioned postal communication costs plus interviewer expenses, including interviewer hourly payment (11.12 EUR; [85]) and the incidental wage cost (27% of the gross earnings; [86]). Based on this information, the labor cost of one telephone interviewer per hour is approximately 14.12 EUR (
(10)
(11)
We note that both survey modes (web starting mode and telephone) also include fixed costs (e.g. questionnaire programming) which are not accounted for in these cost calculations. As we have no realistic information about fixed costs our focus lies solely on the variable costs.
5.Results
Before we present the results of the experiment, we note that we did not find substantial differences between the linkable and non-linkable groups when analyzed separately. The separated results are available as tables in the online supplement (outcome rates: S5 and S6; nonresponse bias: S7, S8, S9, and S10; participation effects: S11 and S12). Thus, all mode (design) analyses are based on the comparison of the combined single-mode telephone groups (A and C) vs. the combined sequential mixed-mode (web starting mode followed by telephone) groups (B, D, and E).
5.1Effect of mentioning follow-up mode in invitation letter
The results of the invitation letter experiment conducted in mixed-mode design groups D (telephone follow-ups not mentioned) and E (telephone follow-ups mentioned) are shown in Table 2. In short, there are no significant differences between the two groups with respect to response rates in the web starting mode (Group D: 32.50%; Group E: 30.92%) or the full web-telephone sequence (Group D: 58.17%; Group E: 59.94%), or the contact (Group D: 86.87%; Group E: 86.93%) and cooperation rates (Group D: 46.63%; Group E: 50.52%) of the telephone follow-ups.
The same conclusions were drawn when stratifying the analysis by wave of joining the panel. Table S13 shows that the respondent compositions were also similar in both invitation letter groups. Given the lack of differences between the two invitation letter groups, we combine both groups in all subsequent analyses.
5.2Outcome rates
Table 3
Response rates by mode and mode design
| Single-mode (Groups A and C) | Mixed-mode (Groups B, D and E) | ||
| Telephone | Web starting mode | Web-telephone | |
| Sample size | 2,062 | 3,056 | 3,056 |
| Respondents | 1,033 | 992 | 1,831 |
| Telephone | 1,033 | 0 | 839 |
| Web | 0 | 992 | 992 |
| Response (%) | 50.10 | 32.46 | 59.91 |
| Tel. contact (%) | 88.60 | N/A | 87.51 |
| Tel. cooperation (%) | 56.54 | N/A | 48.47 |
Notes: All employees (106 out of 992) who participated via the web starting mode after at least one telephone follow-up contact attempt were classified as web respondents. Statistically significant response rate differences were evident between the telephone single-mode design and the web starting mode (
Table 4
Average absolute nonresponse bias (AANB) and average absolute relative nonresponse bias (AARNB), by variable group and overall
| Single mode (Groups A and C) | Mixed-mode (Groups B, D and E) | |||||
| Variable group | Telephone | Web starting mode | Web-telephone | |||
| AANB (%) | AARNB (%) | AANB (%) | AARNB (%) | AANB (%) | AARNB (%) | |
| Demographics | 2.37 | 8.71 | 4.93 | 24.58 | 1.99 | 7.53 |
| Employment | 1.54 | 4.32 | 4.99 | 15.61 | 1.78 | 5.41 |
| Benefits | 2.96 | 11.81 | 9.76 | 34.24 | 3.37 | 11.95 |
| Geodata | 1.11 | 4.06 | 2.04 | 7.88 | 1.02 | 3.62 |
| Overall | 1.72 | 5.87 | 4.37 | 16.70 | 1.70 | 5.83 |
Table 3 shows the response, contact, and cooperation rates for the mixed-mode design (combined groups B, D, E) and the telephone-only design (combined groups A, C). There are three key results. First, the response rate of the web starting mode (32.46% including all login attempts that occurred before and after the telephone follow-up phase started) was significantly lower than the telephone-only design (50.10%), indicating that the web mode is an insufficient replacement for the conventional telephone single-mode design. However, implementing the full web-telephone sequence yielded a statistically significantly higher response rate (59.91%) compared to the single-mode telephone design. Second, the telephone contact rates for the web-telephone (87.51%) and telephone-only (88.60%) designs were quite similar. Third, the telephone cooperation rate for the telephone-only design (56.54%) was higher than for the telephone follow-up stage of the mixed-mode design (48.47%), indicating that some employees with high willingness to participate already responded via the web starting mode. The same conclusions were drawn when stratifying the analysis by wave of joining the panel. In summary, we conclude that transitioning a telephone employee panel to a web-telephone sequential mixed-mode panel has a positive effect on response rates.
5.3Nonresponse bias
As a higher response rate decreases the risk of nonresponse bias [83], one might assume that the web-telephone mixed-mode design yielded lower nonresponse bias, on average, than the telephone single-mode design. We now check this assumption by contrasting the mode designs on their average absolute nonresponse bias (AANB) and average absolute relative nonresponse bias (AARNB), overall and for each administrative variable group. The results, presented in Table 4, reveal two main findings. First, and unsurprisingly, aggregate nonresponse bias is higher in the web starting mode for each variable group and overall (overall: AANB: 4.37%; AARNB: 16.70%) in comparison to the telephone single-mode design (overall: AANB: 1.72%; AARNB: 5.87%). Second, aggregate nonresponse bias is similar overall between the web-telephone design (overall: AANB: 1.70%; AARNB: 5.83%) and the telephone single-mode design. Differences between the mode designs for the individual variable groups are rather small. The AANB for the employment and benefits variable groups are slightly lower for the telephone single-mode design than for the web-telephone mixed-mode design, while the opposite is true for the demographic and geodata variable groups. Overall, we may conclude that the single- and mixed-mode designs yield comparable levels of aggregate nonresponse bias. Similar conclusions can be drawn from examining median nonresponse biases (Table S14).
Next, we examine nonresponse bias (NB), absolute nonresponse bias (ANB), and absolute relative nonresponse bias (ARNB) for specific variables between the mode (designs), presented in Table S15 of the Online Supplement. The table reveals three main findings. First, the ANB is higher for 23 out of 28 administrative variables in the web starting mode compared to the telephone single-mode. The web starting mode yielded particularly higher ANB (than the telephone single-mode) for two categories (
To recap, our results show that switching an employee telephone panel survey to a web-telephone design does not affect aggregate levels of nonresponse bias. However, for half of the variable categories (14 out of 28) the nonresponse bias is lower for the web-telephone mixed-mode design compared to the telephone single-mode design. While nonresponse bias estimates for demographic variables tended to be lower for the web-telephone mixed-mode design compared to the telephone single-mode design, the telephone single-mode produced lower nonresponse bias estimates (compared to the web-telephone mixed-mode design) on variables related to employment and benefits. For the geodata variables we did not observe a clear pattern.
5.4Mode effects on survey participation
In this section, we evaluate the likelihood of survey participation by mode (design) and its interaction with employee characteristics by presenting the multilevel modeling results. The results of the main effects and interaction effects models are presented separately for the telephone single-mode vs. web starting mode comparison and the telephone single-mode vs. web-telephone mixed-mode comparison.
5.5Telephone-only vs. web starting mode
Table 5
Log-odds ratios of survey participation: Telephone single-mode vs. web starting mode and web-telephone mixed-mode
| Telephone vs. web starting mode (Groups A and C vs. B, D and E) | Telephone vs. web-telephone (Groups A and C vs. B, D and E) | |||
| Main effects model estimate (SE) | Interaction model estimate (SE) | Main effects model estimate (SE) | Interaction model estimate (SE) | |
| Intercept | 0.04(0.26) | 0.68(0.38) | 0.62(0.24) | 0.68(0.38) |
| Experimental group (EG) | ||||
| (Ref. Telephone-Only) | ||||
| Web | 0.41(0.06) | 0.33(0.50) | ||
| Sex | ||||
| (Ref. Male) | ||||
| Female | 0.09(0.13) | 0.02(0.08) | 0.09(0.13) | |
| Age | ||||
| (Ref. | ||||
| 40–55 | 0.33(0.10) | 0.29(0.14) | 0.26(0.09) | 0.29(0.14) |
| 56 | 0.15(0.10) | 0.04(0.16) | 0.04(0.10) | 0.04(0.16) |
| German citizenship | ||||
| (Ref. Yes) | ||||
| No | ||||
| Secondary education | ||||
| (Ref. Less than university entrance) | ||||
| University entrance | 0.31(0.09) | 0.22(0.14) | 0.21(0.09) | 0.22(0.14) |
| Higher education | ||||
| (Ref. Less than university degree) | ||||
| University degree | 0.20(0.10) | 0.21(0.16) | 0.16(0.10) | 0.21(0.16) |
| Employment contract | ||||
| (Ref. Part-time) | ||||
| Full-time | ||||
| Daily earnings | ||||
| (Ref. | ||||
| 93–141 | 0.18(0.08) | 0.05(0.13) | 0.02(0.08) | 0.05(0.13) |
| 142 | 0.34(0.10) | 0.24(0.16) | 0.23(0.10) | 0.24(0.16) |
| Occupation | ||||
| (Ref. Production) | ||||
| Business/Administration | 0.07(0.08) | 0.07(0.08) | ||
| Other | 0.01(0.12) | 0.04(0.08) | 0.01(0.12) | |
| Years working for employer | ||||
| (Ref. | ||||
| 10–19 | ||||
| 20 | 0.03(0.10) | |||
| Benefits last 10 years | ||||
| (Ref. No) | ||||
| Yes | ||||
| Job seeking last 10 years | ||||
| (Ref. No) | ||||
| Yes | 0.16(0.13) | 0.03(0.08) | 0.16(0.13) | |
| Region | ||||
| (Ref. North) | ||||
| West | 0.09(0.10) | 0.12(0.15) | 0.00(0.09) | 0.12(0.15) |
| South | 0.04(0.10) | 0.02(0.15) | 0.02(0.15) | |
| East | ||||
| Urbanicity | ||||
| (Ref. | ||||
| 13,000–119,999 | 0.01(0.07) | 0.04(0.11) | 0.06(0.09) | 0.04(0.11) |
| 120,000 | ||||
| Commute | ||||
| (Ref. | ||||
| 17 | 0.02(0.09) | 0.08(0.10) | 0.09(0.06) | 0.08(0.10) |
| Fast internet | ||||
| (Ref. 50–100) | ||||
| | ||||
|
Table 5, continued | ||||
|---|---|---|---|---|
| Telephone vs. web starting mode (Groups A and C vs. B, D and E) | Telephone vs. web-telephone (Groups A and C vs. B, D and E) | |||
| Main effects model estimate (SE) | Interaction model estimate (SE) | Main effects model estimate (SE) | Interaction model estimate (SE) | |
| Teleworking | ||||
| (Ref. No) | ||||
| Yes | 0.22(0.08) | 0.07(0.13) | 0.11(0.08) | 0.07(0.13) |
| General trust | ||||
| (Ref. Low) | ||||
| High | 0.06(0.07) | 0.03(0.06) | ||
| Household size | ||||
| (Ref. 3 | ||||
| 2 Person | 0.05(0.07) | |||
| Single | ||||
| Openness | ||||
| (Ref. Low) | ||||
| Medium | 0.11(0.10) | 0.01(0.16) | 0.01(0.16) | |
| High | 0.02(0.12) | 0.04(0.18) | 0.04(0.18) | |
| Extraversion | ||||
| (Ref. Low) | ||||
| Medium | ||||
| High | ||||
| Agreeableness | ||||
| (Ref. Low) | ||||
| Medium | 0.06(0.09) | 0.04(0.14) | 0.03(0.09) | 0.04(0.14) |
| High | 0.13(0.09) | 0.13(0.14) | 0.06(0.09) | 0.13(0.14) |
| Conscientiousness | ||||
| (Ref. Low) | ||||
| Medium | ||||
| High | ||||
| Neuroticism | ||||
| (Ref. Low) | ||||
| Medium | ||||
| High | 0.03(0.09) | 0.02(0.14) | 0.05(0.09) | 0.02(0.14) |
| Employee linkage consent | ||||
| (Ref. Yes) | ||||
| No | ||||
| Item nonresponse wave 3 | ||||
| (Ref. 0) | ||||
| 1–2 | ||||
| 3 | ||||
| Contact attempts wave 3 | ||||
| (Ref. | ||||
| 4–8 | ||||
| 9 | ||||
| First interview wave | ||||
| (Ref. Wave1) | ||||
| Wave2 | 0.03(0.12) | 0.03(0.12) | ||
| Wave3 | ||||
| Employer linkage | ||||
| (Ref. No) | ||||
| Yes | 0.04(0.06) | 0.03(0.10) | 0.07(0.06) | 0.03(0.10) |
| Interactions | Estimate | Std. error | Estimate | Std. error |
| Sex | ||||
| (Ref. Male) | ||||
| Female | ||||
| Age | ||||
| (Ref. | ||||
| 40–55 | 0.08(0.20) | |||
| 56 | 0.18(0.21) | |||
|
Table 5, continued | ||||
| Telephone vs. web starting mode (Groups A and C vs. B, D and E) | Telephone vs. web-telephone (Groups A and C vs. B, D and E) | |||
| Main effects model estimate (SE) | Interaction model estimate (SE) | Main effects model estimate (SE) | Interaction model estimate (SE) | |
| German citizenship | ||||
| (Ref. Yes) | ||||
| No | 0.10(0.40) | |||
| Secondary education | ||||
| (Ref. Less than University entrance) | ||||
| University entrance | ||||
| Higher education | ||||
| (Ref. Less than University degree) | ||||
| University degree | 0.02(0.21) | |||
| Employment contract | ||||
| (Ref. Part-time) | ||||
| Full-time | 0.14(0.22) | 0.19(0.21) | ||
| Daily earnings | ||||
| (Ref. | ||||
| 93–141 | 0.24(0.18) | |||
| 142 | 0.22(0.21) | |||
| Occupation | ||||
| (Ref. Production) | ||||
| Business/Administration | 0.28(0.17) | 0.27(0.17) | ||
| Other | 0.04(0.16) | |||
| Years working for employer | ||||
| (Ref. | ||||
| 10–19 | 0.22(0.19) | 0.11(0.18) | ||
| 20 | 0.20(0.20) | 0.05(0.20) | ||
| Benefits last 10 years | ||||
| (Ref. No) | ||||
| Yes | 0.13(0.22) | 0.26(0.20) | ||
| Job seeking last 10 years | ||||
| (Ref. No) | ||||
| Yes | ||||
| Region | ||||
| (Ref. North) | ||||
| West | ||||
| South | ||||
| East | ||||
| Urbanicity | ||||
| (Ref. | ||||
| 13,000–119,999 | 0.03(0.14) | |||
| 120,000 | 0.03(0.19) | |||
| Commute | ||||
| (Ref. | ||||
| 17 | 0.02(0.13) | |||
| Fast internet | ||||
| (Ref. 50–100) | ||||
| | 0.08(0.18) | |||
| Teleworking | ||||
| (Ref. No) | ||||
| Yes | 0.22(0.17) | 0.06(0.17) | ||
| General trust | ||||
| (Ref. Low) | ||||
| High | 0.21(0.14) | 0.12(0.13) | ||
| Household size | ||||
| (Ref. 3 | ||||
| 2 Person | 015(0.14) | |||
| Single | ||||
|
Table 5, continued | ||||
| Telephone vs. web starting mode (Groups A and C vs. B, D and E) | Telephone vs. web-telephone (Groups A and C vs. B, D and E) | |||
| Main effects model estimate (SE) | Interaction model estimate (SE) | Main effects model estimate (SE) | Interaction model estimate (SE) | |
| Openness | ||||
| (Ref. Low) | ||||
| Medium | 0.18(0.21) | |||
| High | ||||
| Extraversion | ||||
| (Ref. Low) | ||||
| Medium | ||||
| High | ||||
| Agreeableness | ||||
| (Ref. Low) | ||||
| Medium | 0.04(0.18) | 0.00(0.18) | ||
| High | 0.01(0.19) | |||
| Conscientiousness | ||||
| (Ref. Low) | ||||
| Medium | 0.39(0.22) | 0.36(0.22) | ||
| High | 0.40(0.20) | 0.33(0.20) | ||
| Neuroticism | ||||
| (Ref. Low) | ||||
| Medium | 0.04(0.13) | |||
| High | 0.03(0.19) | 0.04(0.18) | ||
| Employee linkage consent | ||||
| (Ref. Yes) | 0.25(0.24) | 0.14(0.23) | ||
| No | ||||
| Item nonresponse wave 3 | ||||
| (Ref. 0) | ||||
| 1–2 | ||||
| 3 | ||||
| Contact attempts wave 3 | ||||
| (Ref. | ||||
| 4–8 | 0.15(0.14) | 0.09(0.14) | ||
| 9 | 0.26(0.16) | 0.13(0.16) | ||
| First interview wave | ||||
| (Ref. Wave 1) | ||||
| Wave2 | ||||
| Wave3 | 0.04(0.16) | |||
| Employer linkage | ||||
| (Ref. Yes) | ||||
| No | 0.02(0.13) | 0.08(0.13) | ||
| N | 5,118 | 5,118 | 5,118 | 5,118 |
| AIC | 6,471.4 | 6,495.5 | 6,804.8 | 6,868.8 |
| BIC | 6,772.3 | 7,084.1 | 7,105.6 | 7,457.5 |
| Wald-Test ( | 431.83 | 469.79 | 284.57 | 303.96 |
| Wald-Test ( | ||||
| Random effect (establishment) | ||||
| ICC (empty model) | 0.04(0.01) | 0.04(0.01) | 0.02(0.01) | 0.02(0.01) |
Note:
We start with the results of the telephone-only vs. web starting mode comparison, presented in Table 5. The most relevant finding of the main effects model (2
5.6Interaction effects: Telephone vs. web-telephone
The results of the telephone single-mode vs. web-telephone mixed-mode comparison are presented next. The most important finding from the main effects model (Table 5, 3
5.7Cost comparison
Table 6
Cost analysis by mode and mode design
| Single-mode (Groups A and C) | Mixed-mode (Groups B, D and E) | ||
|---|---|---|---|
| Telephone | Web starting mode | Web-telephone | |
| Invitation letters | €2,062 | €3,056 | €3,056 |
| Reminder letters | 0 | €2,358.75 | €2,358.75 |
| Contact attempts | €4,193.63 | 0 | €5,583.05 |
| Interviews | €10,104.08 | 0 | €16,115.49 |
| Total costs | €16,359.72 | €5,414.75 | €27,113.28 |
| Interviews (N) | 1,032 | 992 | 1,831 |
| Avg. cost per respondent centered | €15.85 | €5.46 | €14.81 |
The outcomes of the cost analysis (Table 6) reveal three principal findings. First, the web-telephone mixed-mode design (€27,113.28) produces higher total costs than the telephone single-mode design (€16,359.72) and the web starting mode (€5,414.75). However, when looking at the costs per respondent, a different picture emerges. The cost per respondent, calculated as the ratio of the total cost to the number of completed interviews, is lowest for the web starting mode (€5.46) followed by the web-telephone design (€14.81) and the telephone single-mode design (€15.85). Hence, the mixed-mode design yields a small potential cost savings (of about 7%) relative to the single-mode telephone design.
6.Discussion
Telephone panel surveys are facing technical and societal changes that lead to rising survey costs and declining response rates. To compensate for this, some panel surveys have experimented with introducing online data collection. This paper reported on a mode (design) experiment conducted in the fourth wave of a German employee panel survey, where panel employees were randomly allocated to a telephone single-mode or a sequential mixed-mode design with web starting mode and telephone follow-ups. To our knowledge this is the first study that analyzed the effects of introducing a web starting mode in an ongoing telephone employee panel survey.
Our results can be summarized into five key findings. First, the different invitation letter variations (mentioning vs. not mentioning the telephone follow-ups) did not significantly affect response rates and respondent composition to the web starting mode or full mixed-mode sequence, indicating that it makes no difference whether the interviewer-administered follow-up mode is disclosed in the web survey invitation letter. Second, introducing the sequential web-telephone design yielded a roughly 10-percentage point higher response rate compared to the traditional single-mode telephone design. Third, although aggregate nonresponse bias was higher in the web starting mode compared to the telephone single-mode design, following up the web nonrespondents with telephone reduced the aggregate nonresponse bias to a level that was comparable to the telephone single-mode design. The effect on the individual nonresponse bias estimates was split, with half of the estimates having a lower nonresponse bias in the telephone single-mode than in the web-telephone mixed-mode design, and the other half having a higher nonresponse bias in the telephone single-mode (compared to the web-telephone mixed-mode design). Fourth, only two employee subgroups were differentially affected by the web starting mode – employees with a high conscientiousness were significantly more likely to participate via the web starting-mode, while past job seekers were less likely to respond via the web starting-mode. None of the employee subgroups differed in their likelihood to participate in the web-telephone mixed-mode design or the telephone single-mode design. Finally, (estimated) per-respondent survey costs were about 7% lower in the web-telephone design compared to the telephone single-mode design, indicating a small potential cost savings of mixing modes.
We note that our results are in contrast to those reported in earlier mode (design) experiments conducted with general population samples, which found a higher response rate for the traditional interviewer-administered mode compared to the web-first mixed-mode design in the initial wave of the mode change [46, 50]. The different results may be at least partially explained by the population under study. Employees (especially full-time workers and commuters) are a busy and hard-to-reach group, who can benefit from the possibility of participating online independent of the time of day. However, we note that other study design features can also influence mode differences in other studies, such as the use of incentives, paper vs. email invitations, and the layout and wording of the invitations, among other features. Disentangling the effects of these specific design features in mode design experiments is a topic for future research. From a practical viewpoint, our results suggest that transitioning to a web-first mixed-mode design in the middle of a telephone employee panel can increase response rates and decrease survey costs with little to no effect on the recruitment of employee subgroups. The lack of subgroup effects suggests that there is little difference in which mode design is used. However, in an environment of declining response rates and increasing costs [32, 33], the sequential web-telephone design may be preferred in ongoing employee panel surveys to address these concerns.
We acknowledge some limitations of the present study. First, the target population consisted of employees subject to social insurance in Germany excluding certain sectors (e.g. civil service, agricultural) and types of work (e.g. self-employed). Although we have no reason to believe the study conclusions would have changed without these exclusions, it would be prudent to replicate these findings with broader employee populations. Second, we examined the effects of transitioning to a mixed-mode design only for the initial wave of the transition to mixed mode. An important topic for future research is to assess the long-term effects of the transition on nonresponse and attrition in subsequent waves of the LPP as the panel continues to mature. Another topic for future research is to study the measurement effects of mixing web and telephone modes [87]. Such effects could affect panel analyses and estimates of change which may have consequences for substantive analyses [88]. Thus, any improvements in response rates and costs should be weighed against the possible impacts of measurement mode effects.
In conclusion, we did not identify serious drawbacks of participation in the initial phase of the transition from a single-mode telephone design to a web-telephone sequential mixed-mode design in an ongoing employee panel survey, with some advantages in terms of response rates and costs. The current challenges facing panel studies (e.g. declining participation and increasing survey costs) highlights the importance of research on exploring alternative mode designs. While our results show promise in this regard, it is only a first step in evaluating the transition. More research is needed to identify the long-term impacts of introducing online and mixed-mode data collection on continuing survey participation and attrition, as well as consequences for measurement quality and panel data analyses, which are important points to be discussed with data users as part of the transition.
Acknowledgments
The authors are indebted to Benedikt Zapf, Patrick Gleiser, and Kristina Saveska for their valuable study assistance. The study design and analysis were not preregistered. All data used in this study can be accessed directly from the respective data holders. The data of the German Federal Office of Statistics (format: excel; name: Gemeinden nach Bundesländern und Einwohnergrößenklassen) are freely available on their website (https://www.destatis.de/DE/Themen/Laender-Regionen/Regionales/Gemeindeverzeichnis/_inhalt.html). The LPP data (format: Stata; link: https://fdz.iab. de/en/Integrated_Establishment_and_Individual_Data/ lpp/LPP1819.aspx) and the LPP data linked with the administrative IEB data (format: Stata; link: https://fdz.iab. de/en/FDZ_Data_Access.aspx; DOI: 10.5164/IAB.LPP -ADIAB7519.de.en.v1) can be accessed via a Data User Agreement with the Research Data Centre of the Institute for Employment Research (IAB). The data of the German Federal Ministry of Transport and Digital Infrastructure (format; Excel; name: Breitbandatlas) can be accessed by completing the contact form on their website (https://www.bmvi.de/EN/Meta/Contact-Us/contact-us.html). All software code used in the analysis can be supplied by contacting the first author.
Supplementary data
The supplementary files are available to download from http://dx.doi.org/10.3233/SJI-220088.
References
[1] | Toepoel V. Building Your Own Online Panel Via E-Mail and Other Digital Media. In: Gidoen L, editor. Handbook of survey methodology in socialsciences. New York: Springer; (2012) . pp. 345-60. doi: 10.1007/978-1-4614-3876-2_20. |
[2] | Haunberger S. Teilnahmeverweigerung in Panelstudien. Wiesbaden: VS Verlag für Sozialwissenschaften; (2011) . |
[3] | Statistics Canada. Methodology of the Canadian Labour Force Survey. Catalogue. (2017) ; (71): 526-X. |
[4] | UK Office for National Statistics. (2022) . Available from: https://www.ons.gov.uk/employmentandlabourmarket/peopleinwork/employmentandemployeetypes/methodologies/labourforcesurveyuserguidance. |
[5] | Eurostat. Labour Force Survey in the EU, candidate and EFTA countries: Main characteristics of national surveys. Luxembourg: European Union; (2019) . doi: 10.2785/843203. |
[6] | Huber M, Schmucker A. Panel “Well”: Arbeitnehmerbefragung für das Projekt “Berufliche Weiterbildung als Bestandteil Lebenslangen Lernens”. FDZ-Datenreport. (2012) ; 03/12. |
[7] | Eurostat. Luxembourg; (2022) . Available from: https://ec.euro pa.eu/eurostat/web/lfs/overview. |
[8] | Fernandez S, Resh WG, Moldogaziev T, Oberfield ZW. Assessing the Pastand Promise of the Federal Employee Viewpoint Survey for Public Management Research: A Research Synthesis. Public Admin Rev. (2015) ; 75: (3): 38294. doi: 10.1111/puar.12368. |
[9] | Mackeben J, Ruf K, Grunau P. Arbeitsqualität und wirtschaftlicher Erfolg: Betriebsbefragung 5. Welle. Zweiter Sachstandsbericht. (2020) . |
[10] | Frodermann C, Grunau P, Hass GC, Müller D. Homeoffice in Zeiten von Corona: Nutzung, Hindernisse und Zukunftswünsche. IAB-Kurzbericht. (2021) ; 5: . |
[11] | Haas G-C, Müller B, Osiander C, Schmidtke J, Trahms A, Volkert M, Zins S. Development of a new COVID-19 panel survey: the IAB high-frequency onlinepersonal panel (HOPP). J Labour Market Res. (2021) ; 55: (1): 16. doi: 10.1186/s12651-021-00295-z. |
[12] | Sakshaug JW, Beste J, Coban M, Fendel T, Haas G-C, Hülle S, et al. Impacts of the COVID-19 Pandemic on Labor Market Surveys at the German Institute for Employment Research. Surv Res Methods. (2020) ; 14: (2): 229-33. doi: 10.18148/srm/2020.v14i2.7743. |
[13] | de Leeuw ED, Lugtig P. Dropouts in Longitudinal Surveys. Wiley Stats Ref: Statistics Reference Online. (2015) : 16: . doi: 10.1002/9781118445112.stat06661.pub2. |
[14] | Lugtig P, Das J, Scherpenzeel A. Nonresponse and attrition in aprobability-based online panel for the general population. In: Callegaro M, Baker RP, Bethlehem J, Goeritz AS, Krosnick JA, Lavrakas PJ, editors. Online Panel Research: A Data Quality Perspective. Colchester, UK: Wiley; (2014) . pp. 135-53. |
[15] | Müller B, Castiglioni L. Do Temporary Dropouts Improve the Compositionof Panel Data? An Analysis of “Gap Interviews” in the German Family Panelpairfam. Social Method Res. (2020) ; 49: (1): 193-215. doi: 10.1177/0049124117729710. |
[16] | Sakshaug JW, Huber M. An Evaluation of Panel Nonresponse and Linkage Consent Bias in a Survey of Employees in Germany. J Surv Stat Methodol. (2016) ; 4: (1): 71-93. doi: 10.1093/JSSAM/SMV034. |
[17] | Stöckinger C, Kretschmer S, Kleinert C. Panel Attrition in NEPS Starting Cohort 6: A Description of Attrition Processes in Waves 2 to 7 with Regard to Nonresponse Bias. NEPS Survey Paper. (2018) ; 35: . |
[18] | German Federal Office of Statistics; (2020) . Available from: https://www.destatis.de/DE/Themen/Gesellschaft-Umwelt/Bevoelkerung/Haushalte-Familien/Methoden/mikrozensus-2020.html. |
[19] | Kantar. UK Household Longitudinal Study: Wave 7 technical report. London: Kantar Public; (2017) . |
[20] | Olson K, Smyth JD, Horwitz R, Keeter S, Lesser V, Marken S, et al. Transitions from Telephone Surveys to Self-Administered and Mixed-Mode Surveys: AAPOR Task Force Report. J Surv Stat Methodol. (2021) ; 9: (3): 381-411. |
[21] | Beukenhorst D. The Netherlands. In: Häder S, Häder M, Kühne M, editors. Telephone Surveys in Europe. Heidelberg: Springer; (2012) . pp. 17-24. |
[22] | Stähli ME. Switzerland. In: Häder S, Häder M, Kühne M, editors. Telephone Surveys. Berlin: Springer Berlin; (2011) . |
[23] | PSID; (2022) . Available from: https://psidonline.isr.umich.edu/Guide/default.aspx. |
[24] | Schupp J. Das Sozio-oekonomische Panel (SOEP). Bundesgesundheitsblatt. (2012) ; 55: (6-7): 767-74. doi: 10.1007/s00103-012-1496-1. |
[25] | Tillmann R, Voorpostel M, Antal E, Kuhn U, Lebert F, Ryser V-A, et al. The Swiss Household Panel Study: Observing social change since 1999. Longitud Life Course Stud. (2016) ; 7: . doi: 10.14301/llcs.v7i1.360. |
[26] | Burton J, Lynn P, Benzeval M. How Understanding Society: The UKHousehold Longitudinal Study adapted to the COVID-19 pandemic. Surv Res Methods. (2020) ; 14: (2): 235-9. doi: 10.18148/srm/2020.v14i2.7746. |
[27] | Gummer T, Schmiedeberg C, Bujard M, Christmann P, Hank K, Kunz T, et al. The impact of COVID-19 on fieldwork efforts and planning in pairfam and FReDA-GGS. Surv Res Methods. (2020) ; 14: (2): 223-7. doi: 10.18148/srm/2020.v14i2.7740. |
[28] | Sastry N, McGonagle K, Fomby P. Effects of the COVID-19 crisis onsurvey fieldwork: Experience and lessons from two major supplements to the U.S. Panel Study of Income Dynamics. Surv Res Methods. (2020) ; 14: (2): 241-5. doi: 10.18148/srm/2020.v14i2.7752. |
[29] | World Bank; (2021) . Available from: https://databank.worldbank.org/reports.aspx?source=2&series=IT.MLT.MAIN.P2. |
[30] | Dillman DA. The promise and challenge of pushing respondents to the Webin mixed-mode surveys. Survey Methodol (12-001-X). (2017) . |
[31] | German Federal Office of Statistics. Wirtschaftsrechnungen: Laufende Wirtschaftsrechnungen: Ausstattung privater Haushalte mit ausgewählten Gebrauchsgütern. Fachserie 15 (Reihe 1). (2021) . |
[32] | Brick JM, Williams D. Explaining Rising Nonresponse Rates in Cross-Sectional Surveys. Ann Am Acad Pol Soc Sci. (2013) ; 645: (1): 36-59. doi: 10.1177/0002716212456834. |
[33] | Czajka JL, Beyler A. Declining Response Rates in Federal Surveys:Trends and Implications. Mathematica Policy Research. (2016) . |
[34] | Kennedy C, Hartig H. Washington DC: PEW Research. (2019) . Available from: https://www.pewresearch.org/fact-tank/2019/02/27/response-rates-in-telephone-surveys-have-resumed-their-decline/. |
[35] | Eurostat. Luxembourg. (2020) . Available from: https://ec.europa.eu/eurostat/databrowser/view/tin00073/default/table?lang=en. |
[36] | World Bank; (2021) . Available from: https://databank.worldbank.org/reports.aspx?source=2&type=metadata&series=IT.NET.BBND.P2. |
[37] | De Leeuw ED. Mixed-Mode: Past, Present, and Future. Surv Res Methods. (2018) ; 12: (2): 75-89. doi: 10.18148/srm/2018.v12i2.7402. |
[38] | Tourangeau R. Mixing Modes. Tradeoffs Among Coverage, Nonresponse, and Measurement Error. In: Biemer PP, de Leeuw E, Eckman S, Edwards B, Kreuter F, Lyberg LE, et al., editors. Total Survey Error in Practice. (2017) . pp. 115-32. |
[39] | Eurostat. Luxembourg. (2022) . Available from: https://ec.europa.eu/eurostat/databrowser/view/tin00028/default/table?lang=en. |
[40] | Allum N, Conrad F, Wenz A. Consequences of mid-stream mode-switching ina panel survey. Surv Res Methods. (2018) ; 12: (1): 43-58. doi: 10.18148/srm/2018.v12i1.6779. |
[41] | Biemer PP, Harris KM, Burke BJ, Liao D, Halpern CT. Transitioning apanel survey from in-person to predominantly web data collection: Resultsand lessons learned. J R Stat Soc Ser A Stat Soc: Series A (Statistics in Society). (2021) ; 185: (3): 798-821. doi: 10.1111/rssa.12750. |
[42] | Biemer PP, Harris KM, Burke BJ, Liao D, Halpern CT. Modeling modeeffects for a panel survey in transition. In: Cernat A, Sakshaug JW, editors. Measurement Errors in Longitudinal Surveys. (2021) . pp. 63-87. |
[43] | Cernat A, Revilla M. Moving from Face-to-Face to a Web Panel: Impactson Measurement Quality. J Surv Stat Methodol. (2021) ; 9: (4): 745-63. doi: 10.1093/jssam/smaa007. |
[44] | Dillman D. Mail and internet surveys: The tailored design method. 2nd ed. Hoboken: Wiley & Sons; (2009) . |
[45] | Voorpostel M, Lipps O, Roberts C. Mixing Modes in Household Panel Surveys: Recent Developments and New Findings. In: Lynn P, editor. Advancesin Longitudinal Survey Methodology. (2021) . pp. 204-26. doi: 10.1002/9781119376965.ch9. |
[46] | Jäckle A, Lynn P, Burton J. Going Online with a Face-to-Face Household Panel: Effects of a Mixed Mode Design on Item and Unit Non-Response. Surv Res Methods. (2015) ; 9: (1): 57-70. doi: 10.18148/SRM/2015.V9I1.5475. |
[47] | Gaia A. The Effect of a Switch to a Mixed-Mode Design on Panel Attrition: Evidence from an Experiment of the Understanding Society Innovation Panel. 5th Panel Survey Methods Workshop. (2016) . |
[48] | Bianchi A, Biffignandi S, Lynn P. Web-Face-to-Face Mixed-Mode Design ina Longitudinal Survey: Effects on Participation Rates, Sample Composition,and Costs. J Off Stat. (2017) ; 33: (2): 385-408. doi: 10.1515/JOS-2017-0019. |
[49] | infas. SOEP FiD – “Familien in Deutschland” 2013: Methodenbericht. SOEP Survey Papers. (2020) ; 906: (Series B). |
[50] | Lüdtke D, Schupp J. Wechsel von persönlichen Interviews zu webbasierten Interviews in einem laufenden Haushaltspanel. Methodische Probleme von Mixed-Mode-Ansätzen in der Umfrageforschung. (2016) ; 141-60. doi: : doi: 10.1007/978-3-658-15834-7_6. |
[51] | Voorpostel M, Kuhn U, Tillmann R, Monsch GA, Antal E, Ryser VA, Lebert F, et al. Introducing web in a refreshment sample of the Swiss Household Panel: Main findings from a pilot study. FORS Working Paper. (2020) . |
[52] | Voorpostel M, Roberts C, Ghoorbin M. Survey Methods: Insights from the Field. (2021) . Available from: https://surveyinsights.org/?p=15709. doi: 10.13094/SMIF-2021-00004. |
[53] | McGonagle KA, Freedman VA. The Effects of a Delayed Incentive on Response Rates, Response Mode, Data Quality, and Sample Bias in a Nationally Representative Mixed Mode Study. Field Method. (2017) ; 29: (3): 221-37. doi: 10.1177/1525822X16671701. |
[54] | Freedman VA, Mc Gonagle KA, Couper MP. Use of a Targeted Sequential Mixed Mode Protocol in a Nationally Representative Panel Study. J Surv Stat Methodol. (2018) ; 6: (1): 98-121. doi: 10.1093/jssam/smx012. |
[55] | infas. IAB-Beschäftigtenbefragung: Projekt Arbeitsqualität undwirtschaftlicher Erfolg: Panelstudie zu Entwicklungsverläufen in deutschen Betrieben – Personenbefragung. FDZ-Methodenreport. (2015) ; 2: . |
[56] | infas. IAB-Beschäftigtenbefragung: Projekt Arbeitsqualität undwirtschaftlicher Erfolg: Panelstudie zu Entwicklungsverläufen in deutschen Betrieben – Personenbefragung, 2. Erhebungswelle. FDZ-Methodenreport. (2016) ; 2: . |
[57] | infas. IAB-Beschäftigtenbefragung: Projekt Arbeitsqualität undwirtschaftlicher Erfolg: Panelstudie zu Entwicklungsverläufen in deutschen Betrieben – Personenbefragung, 3. Erhebungswelle. FDZ-Methodenreport. (2018) ; 11: . |
[58] | Frodermann C, Schmucker A, Seth S, vom Berge P. Sample of Integrated Labour Market Biographies (SIAB) 1975-2019: Forschungsdatenzentrum der Bundesagentur für Arbeit (BA) im Institut für Arbeitsmarkt-und Berufsforschung (IAB). (2021) . doi: 10.5164/IAB.FDZD.2101.en.v1. |
[59] | German Federal Ministry of Transport and Digital Infrastructure. Bericht zum Breitbandatlas. Teil 1: Ergebnisse. (2020) . |
[60] | John OP, Donahue EM, Kentle RL. Big Five Inventory (BFI) [Databaserecord]. (1991) . doi: 10.1037/t07550-000. |
[61] | John OP, Srivastava S. The Big Five Trait Taxonomy: History, Measurement, and Theoretical Perspectives. In: Pervin LA, John OP, editors. Handbook of Personality: Theory and research. (1999) . pp. 102-38. |
[62] | Lugtig P. Panel Attrition: Separating Stayers, Fast Attriters, Gradual Attriters, and Lurkers. Sociol Method Res. (2014) ; 43: (4): 699-723. doi: 10.1177/0049124113520305. |
[63] | Lynn P, Kaminska O, Goldstein H. Panel Attrition: How Important is Interviewer Continuity? J Off Stat. (2014) ; 30: (3): 443-57. doi: 10.2478/JOS-2014-0028. |
[64] | Müller B, Castiglioni L. Attrition im Beziehungs- und Familienpanelpairfam. In: Schupp J, Wolf C, editors. Nonresponse Bias. (2015) . pp. 383-408. doi: 10.1007/978-3-658-10459-7_12. |
[65] | Dillman DA, Phelps G, Tortora R, Swift K, Kohrell J, Berck J, Messer BL. Response rate and measurement differences in mixed-mode surveys usingmail, telephone, interactive voice response (IVR) and the Internet. Soc Sci Res. (2009) ; 38: (1): 1-18. doi: 10.1016/j.ssresearch.2008.03.007. |
[66] | Felderer B, Kirchner A, Kreuter F. The Effect of Survey Mode on Data Quality: Disentangling Nonresponse and Measurement Error Bias. J Off Stat. (2019) ; 35: (1): 93-115. doi: 10.2478/jos-2019-0005. |
[67] | Kappelhof JW. Face-to-Face or Sequential Mixed-Mode Surveys Among Non-Western Minorities in the Netherlands: The Effect of Different Survey Designs on the Possibility of Nonresponse Bias. J Off Stat. (2015) ; 31: (1): 1-30. doi: 10.1515/JOS-2015-0001. |
[68] | Büttner TJ, Sakshaug JW, Vicari B. Evaluating the Utility of Linked Administrative Data for Nonresponse Bias Adjustment in a Piggyback Longitudinal Survey. J Off Stat. (2021) ; 37: (4): 837-64. doi: 10.2478/JOS-2021-0037. |
[69] | Kreuter F, Muller G, Trappmann M. Nonresponse and Measurement Error in Employment Research: Making Use of Administrative Data. Public Opin Q. (2010) ; 74: (5): 880-906. doi: 10.1093/poq/nfq060. |
[70] | Sakshaug JW, Eckman S. Are Survey Nonrespondents Willing to Provide Consent to Use Administrative Records? Evidence from a Nonresponse Follow-Up Survey in Germany. Public Opin Q. (2017) ; 81: (2): 495-522. doi: 10.1093/poq/nfw053. |
[71] | Sakshaug JW, Eckman S. Following Up with Nonrespondents via Mode Switchand Shortened Questionnaire in an Economic Survey: Evaluating Nonresponse Bias, Measurement Error Bias, and Total Bias. J Surv Stat Methodol. (2017) ; 5: (4): 454-79. doi: 10.1093/jssam/smw039. |
[72] | Sakshaug JW, Hülle S, Schmucker A, Liebig S. Exploring the Effects of Interviewer- and Self-Administered Survey Modes on Record Linkage Consent Rates and Bias. Surv Res Methods. (2017) ; 11: (2): 171-88. doi: 10.18148/srm/2017.v11i2.7158. |
[73] | Sakshaug JW, Hülle S, Schmucker A, Liebig S. Panel Survey Recruitment with or Without Interviewers? Implications for Nonresponse, Panel Consent, and Total Recruitment Bias. J Surv Stat Methodol. (2020) ; 8: (3): 540-65. doi: 10.1093/jssam/smz012. |
[74] | Bianchi A, Biffignandi S. Social Indicators to Explain Response in Longitudinal Studies. Soc Indic Res. (2018) ; 141: (3): 931-57. doi: 10.1007/s11205-018-1874-7. |
[75] | Bristle J, Celidoni M, Bianco CD, Weber G. The contributions of paradata to panel co-operation in SHARE. Share Working Paper Series. (2014) . |
[76] | Pickery JA, Loosveldt G, Carton AN. The Effects of Interviewer and Respondent Characteristics on Response Behavior in Panel Surveys. Sociol Method Res. (2001) ; 29: (4): 509-23. doi: 10.1177/0049124101029004004. |
[77] | Cheng A, Zamarro G, Orriens B. Personality as a Predictor of Unit Nonresponse in an Internet Panel. Sociol Method Res. (2020) ; 49: (3): 672-98. doi: 10.1177/0049124117747305. |
[78] | Hansson I, Berg AI, Thorvaldsson V. Can personality predictlongitudinal study attrition? Evidence from a population-based sample ofolder adults. J Res Pers. (2018) ; 77: : 133-6. doi: 10.1016/j.jrp.2018.10.002. |
[79] | Salthouse TA. Selectivity of attrition in longitudinal studies ofcognitive functioning. J Gerontol B-Psychol. (2014) ; 69: (4): 567-74. doi: 10.1093/geronb/gbt046. |
[80] | Stata Corp. Stata Statistical Software: Release 16. College Station, TX: Stata Corp LLC; (2019) . |
[81] | R Core Team. Vienna, Austria; (2020) . Available from: https://www.R-project.org/. |
[82] | The American Association for Public Opinion Research. Standard Definitions: Final Dispositions of Case Codes and Outcome Rates for Surveys. 9th edition. Standard Definitions. (2016) . |
[83] | Groves RM. Nonresponse Rates and Nonresponse Bias in Household Surveys. Public Opin Q. (2006) ; 70: (5): 646-75. doi: 10.1093/poq/nfl033. |
[84] | German Post; (2021) . Available from: https://www.deutschepost.de/en/d/deutsche-post-direkt/addressfactory.html. |
[85] | Indeed; (2021) . Available from: https://de.indeed.com/cmp/Infas-Institut-F%C3%BCr-Angewandte-Sozialwissenschaft-Gmbh/salaries/Telefon-interviewer-(m-w). |
[86] | German Federal Office of Statistics; (2020) . Available from: https://www.destatis.de/DE/Presse/Pressemitteilungen/2020/04/PD20_142_624.html. |
[87] | de Leeuw ED. To Mix or Not to Mix Data Collection Modes in Surveys. J Off Stat. (2005) ; 21: (2): 233-55. |
[88] | Cernat A, Sakshaug JW. Estimating the Measurement Effects of Mixed Modes in Longitudinal Studies: Current Practice and Issues. In: Lynn P, editor. Advances in Longitudinal Survey Methodology. (2021) . pp. 227-49. doi: 10.1002/9781119376965.ch10. |

