
Official statistics: Providing data acumen in the advent and continuous presence of COVID-19
Abstract
COVID-19 has disturbed people’s patterns of life and sources of income, particularly the income of informal sector business operators and households worldwide. As extraordinary policy initiatives are calibrated, the requirement for timely statistics on health and economic development rises. Thus, the purpose of this research is to analyze the Internally Generated Revenue (IGR) available to Nigerian states in 2020 and 2019 by examining the disparities caused by the COVID-19 pandemic and its impact on the country’s approximately 200 million people. The exploratory research approach was used, with a particular emphasis on descriptive and trend analysis of the data acquired during the study periods. According to the findings, 46% of Nigerian states, including the Federal Capital Territory, suffered reductions in IGR generation as the pandemic surged, whereas 35 per cent of the states experienced a corresponding increase in IGR and confirmed COVID-19 infections. However, 16% of the states reported an inverse growth in their IGR as the number of verified COVID-19 cases decreased. To deal with the unprecedented shocks caused by the ongoing existence of COVID-19, which necessitate the tapping of new information and revenue streams, a continual review of countries’ revenue sources is required.
1.Introduction
COVID-19 pandemic has evolved into a global phenomenon that began spreading from country to country like an invisible foe; it works against a nation’s financial, social, and psychological behaviour. It has an impact on all aspects of human life, including religious, social, cultural, sports, career, and educational activities [1].
COVID-19 is still wreaking havoc over the world, particularly with the current third and fourth waves, dubbed Delta variant and Omicron, respectively, which have been reported as deadlier than prior waves. To curb proliferation and mitigate the ensuing economic damage, quick political decisions and harsh actions were required. The demand for wide, rapid, high-frequency information on economic and health developments has risen to prompt and calibrate extraordinary policy initiatives. COVID-19 has affected the lives and incomes of millions of individuals, particularly informal sector business operators and family households at the local government level [2, 3]. The pandemic has cleared the way for unprecedented adoption of digital technologies in the transformation of health care systems in industrialized countries. The rapid adoption of numerous innovative solutions to treat COVID-19 patients has demonstrated how much the populace can truly benefit from data-driven transformation. Contact tracing apps, according to [4], were embraced in the health industry with the introduction of COVID-19 as a data-driven innovation. Though not without its antecedent data privacy concerns, the technology served the public interest by collecting more data, while certain apps still retain high levels of compliance with data privacy requirements, which tend to meet public health objectives to a limited extent. Another data-driven innovation that came to light during the pandemic is [5] use of Blockchain technology. The author used technology to address the issues of inaccuracy and late data distribution, which were highlighted as important sources of conflict between data privacy and public health concerns.
As soon as the pandemic was identified in Nigeria and its spread continued, the government reacted by shutting down the economy, imposing restrictions on individual travel, conducting immediate publicity and public enlightenment, swift contact tracing, and enforcing social distance. The new government policy and directives on citizens’ ways of life as a result of the COVID-19 pandemic outbreak have hurt the nation’s economy and business activities, primarily on individuals and firms operating in the informal sectors, those business activities based on human face to face business transactions [6].
Due to the COVID-19 pandemic, attempts were already being made in Nigeria to boost aggregate demand through greater government spending and tax concessions for businesses. The public budget increased from 8.83 trillion nairas ($24.53 billion) in 2019 to 10.59 trillion nairas ($29.42 billion) in 2020, representing 11% of national GDP, while small businesses were exempted from corporate income tax and the tax rate for medium-sized businesses was reduced from 30% to 20%. Unfortunately, the COVID-19 situation is driving all components of aggregate demand to decline, except for government purchases [7].
When the economy of African countries, including Nigeria, slows, an increase in poverty and income inequality is unavoidable, resulting in a major slowdown in growth. The monies required to combat the trend can be raised through taxation, loans, help, and remittances.
Internally Generated Revenue (IGRs) is the type of revenue generated within the state government, which are unique and distinct at times. Collecting taxes and fees is a vital means for countries to earn public revenues that allow them to support investments in human capital, infrastructure, and the delivery of services to citizens and enterprises [8, 9]. The ability of the state government to meet the yearning expectations of the citizens within the locality is dependent on the financial resources available to the state government at all times because the local government autonomy granted by the federal government of Nigeria is not feasible. After all, the state government was in the habit of running the affairs of the local government council in addition to their functions [10, 11].
Table 1
Population of Nigerian states and federal capital territory (FCT)
| States | 2006 census population | Population projection (2016) |
|---|---|---|
| Abia | 2,845,380 | 3,727,300 |
| Adamawa | 3,178,950 | 4,248,400 |
| Akwa Ibom | 3,902,051 | 5,482,200 |
| Anambra | 4,177,828 | 5,527,800 |
| Bauchi | 4,653,066 | 6,537,300 |
| Bayelsa | 1,704,515 | 2,278,000 |
| Benue | 4,253,641 | 5,741,800 |
| Borno | 4,171,104 | 5,860,200 |
| Cross River | 2,892,988 | 3,866,300 |
| Delta | 4,112,445 | 5,663,400 |
| Ebonyi | 2,176,947 | 2,880,400 |
| Edo | 3,233,366 | 4,235,600 |
| Ekiti | 2,398,957 | 3,270,800 |
| Enugu | 3,267,837 | 4,411,100 |
| Gombe | 2,365,040 | 3,257,000 |
| Imo | 3,927,563 | 5,408,800 |
| Jigawa | 4,361,002 | 5,828,200 |
| Kaduna | 6,113,503 | 8,252,400 |
| Kano | 9,401,288 | 13,076,900 |
| Katsina | 5,801,584 | 7,831,300 |
| Kebbi | 3,256,541 | 4,440,000 |
| Kogi | 3,314,043 | 4,473,500 |
| Kwara | 2,365,353 | 3,192,900 |
| Lagos | 9,113,605 | 12,550,600 |
| Nasarawa | 1,869,377 | 2,523,400 |
| Niger | 3,954,772 | 5,556,200 |
| Ogun | 3,751,140 | 5,217,700 |
| Ondo | 3,460,877 | 4,671,700 |
| Osun | 3,416,959 | 4,705,600 |
| Oyo | 5,580,894 | 7,840,900 |
| Plateau | 3,206,531 | 4,200,400 |
| Rivers | 5,198,716 | 7,303,900 |
| Sokoto | 3,702,676 | 4,998,100 |
| Taraba | 2,294,800 | 3,066,800 |
| Yobe | 2,321,339 | 3,294,100 |
| Zamfara | 3,278,873 | 4,515,400 |
| FCT | 1,406,239 | 3,564,100 |
| Total | 140,431,790 | 193,500,500 |
Source: City population 2021.
The aggregate population by state and Federal Capital Territory (FCT) is shown in Table 1 based on the 2006 population census. As of 2016, the aggregate population per state was 140,431,790, with a projected rate of 193,500,500. As a result, the country’s population forecast for 2026 is likely to be unprecedented. Even though the COVID-19 pandemic has not ravaged the world, the increase in the population of citizens within the state has serious implications for social, economic, and infrastructural development, especially in light of the current situation in which African economic growth, of which Nigeria is a giant, is in a quagmire.
The purpose of this article is to examine the overall revenue available to Nigerian states in 2020 and 2019 while accounting for the change caused by the COVID-19 epidemic. Furthermore, this research examined the reported COVID-19 instances by state and compare them to the income collected to critically evaluate the states with the greatest COVID-19 cases and their variance in revenue generation. It cannot be overstated that the difficulties encountered in the creation and collection of official data in the aftermath of COVID-19 could constitute a barrier to state government income generation, consequently impeding the supply of social amenities. This study also discusses how governments might deal with extraordinary shocks caused by COVID-19’s constant presence, which necessitates tapping into new information sources, which are frequently held by commercial actors and government institutions in boosting respective state economies.
2.Methodology
The exploratory data analysis approach was used in the analysis of the study’s findings. Secondary data on thirty-six (36) states COVID-19 confirmed cases were collected for the years 2020 and 2021, while states IGR, including the Federal Capital Territory (FCT), were collected using a purposive sampling methodology and analyzed using descriptive statistical methods and trend analysis. The data was chosen because the states are supposed to generate revenue internally to cater for their citizenry through the provision of social amenities; given the fact that all of the states of the federation are affected by the pandemic, posing threats to their respective IGR as a result of the partial closure of both public and private sectors for months while a smaller number of them were working at full capacity. However, no government (federal, state, or local) can succeed in delivering fundamental social amenities to its citizens unless it has consistent sources of revenue. Major sources of revenues across the globe are Taxes and levies, and Nigeria is not an exception. Among such IGR collected by the State Government are not limited to the followings:
• Personal income tax in respect of Pay-As-You-Earn (PAYE); Direct taxation (Self-assessment)
– Withholding tax for Individuals.
– Capital gains tax for individuals.
– Stamp duties on instruments executed by individuals.
– Pools betting, lotteries, gaming and casino taxes.
– Road tax.
– Business premises registration.
– Development levy for individuals.
– Naming of street registration fees in State Capitals.
– Right of Occupancy fees on lands owned by the State Government.
– Market taxes and levies where State finance is involved.
– Hotel, Restaurant or Event Centre Consumption Tax, where applicable.
– Entertainment Tax, where applicable.
– Environmental (Ecological) Fee or Levy.
– Mining, Milling and Quarry Fees, where applicable.
– Animal Trade Tax, where applicable.
– Produce Sales Tax, where applicable.
– Slaughter or Abattoir Fees, where state finance is involved.
– Infrastructure Maintenance Charge or Levy, where applicable.
– Fire Service Charge.
– Economic Development Levy, where applicable.
– Social Services Contribution Levy, where applicable.
– Signage and Mobile advertisements, jointly collected by States and Local Governments.
– Property Tax.
– Land use charge, where applicable.
It is pertinent to state that, the aggregate of the IGR collected per state was utilized for inference in this research.
3.Presentation and discussion of results
The population of Nigerian states were projected in Table 1 as a basis for exploring the empirical relative relationship of the COVID-19 infected populace with the existing country’s population. Figure 1 and Table 2 represent the number of people who were affected by the state. It was shown that Lagos state had the most confirmed cases (31,321), followed by the FCT (12,083), while Kogi (5) had the fewest over the two-year study period.
Table 2
Nigerian states total number of COVID-19 cases, recoveries, deaths, tested and active cases
| States | Confirmed cases 2020 | Confirmed cases 2021 | Recoveries 2020 | Recoveries 2021 | Deaths 2020 | Deaths 2021 | Confirmed cases year on year growth (%) | |
|---|---|---|---|---|---|---|---|---|
| Abia | 1,028 | 1,101 | 968 | 909 | 10 | 23 | 3. | 4 |
| Adamawa | 424 | 733 | 238 | 860 | 25 | 7 | 26. | 7 |
| Akwa Ibom | 437 | 4113 | 385 | 3964 | 9 | 35 | 80. | 8 |
| Anambra | 328 | 2164 | 274 | 2138 | 19 | 0 | 73. | 7 |
| Bauchi | 1020 | 856 | 274 | 1552 | 17 | 7 | 7 | |
| Bayelsa | 534 | 764 | 421 | 805 | 21 | 7 | 17. | 7 |
| Benue | 532 | 1577 | 469 | 1295 | 11 | 14 | 49. | 5 |
| Borno | 806 | 746 | 738 | 762 | 36 | 8 | 9 | |
| Cross River | 169 | 556 | 157 | 533 | 12 | 13 | 53. | 4 |
| Delta | 1888 | 3103 | 1737 | 819 | 52 | 58 | 24. | 3 |
| Ebonyi | 1107 | 955 | 1072 | 932 | 30 | 2 | 4 | |
| Edo | 2902 | 4633 | 2681 | 3979 | 117 | 164 | 23. | 0 |
| Ekiti | 415 | 1513 | 395 | 1385 | 6 | 22 | 57. | 0 |
| Enugu | 1400 | 1513 | 1348 | 1517 | 21 | 8 | 3. | 9 |
| FCT | 12083 | 15144 | 7588 | 16563 | 104 | 131 | 11. | 2 |
| Gombe | 1338 | 1498 | 1001 | 1705 | 37 | 23 | 5. | 6 |
| Imo | 766 | 1544 | 722 | 1277 | 13 | 44 | 33. | 7 |
| Jigawa | 407 | 228 | 368 | 234 | 11 | 7 | | 2 |
| Kaduna | 5447 | 5132 | 4708 | 5532 | 53 | 33 | 0 | |
| Kano | 2324 | 2444 | 1930 | 2475 | 68 | 54 | 2. | 5 |
| Katsina | 1636 | 742 | 1429 | 901 | 27 | 10 | 6 | |
| Kebbi | 173 | 305 | 144 | 310 | 9 | 7 | 27. | 6 |
| Kogi | 5 | 0 | 3 | 3 | 2 | 0 | 0. | 0 |
| Kwara | 1414 | 2845 | 1094 | 2615 | 31 | 33 | 33. | 6 |
| Lagos | 31321 | 63847 | 26795 | 53268 | 247 | 514 | 34. | 2 |
| Nasarawa | 898 | 1726 | 325 | 1652 | 13 | 26 | 31. | 6 |
| Niger | 417 | 696 | 320 | 678 | 13 | 7 | 25. | 1 |
| Ogun | 2552 | 3164 | 2292 | 3149 | 34 | 47 | 10. | 7 |
| Ondo | 1843 | 3066 | 1763 | 2791 | 41 | 59 | 24. | 9 |
| Osun | 1019 | 2094 | 965 | 1994 | 24 | 65 | 34. | 5 |
| Oyo | 4035 | 5966 | 3402 | 5525 | 52 | 141 | 19. | 3 |
| Plateau | 4997 | 5201 | 4560 | 5494 | 44 | 29 | 2. | 0 |
| Rivers | 3572 | 11288 | 3209 | 7624 | 64 | 90 | 51. | 9 |
| Sokoto | 380 | 430 | 270 | 512 | 18 | 10 | 6. | 2 |
| Taraba | 217 | 1052 | 187 | 1035 | 7 | 25 | 65. | 8 |
| Yobe | 201 | 301 | 144 | 346 | 8 | 1 | 19. | 9 |
| Zamfara | 112 | 263 | 82 | 272 | 5 | 4 | 40. | 3 |
| Total | 90147 | 153303 | 75044 | 137405 | 1311 | 1728 | ||
Source: NCDC COVID-19 situation report, 2020 and 2021.
Furthermore, based on the development of recovered pandemic patients as shown in Fig. 2, Lagos was found to have the greatest recovery rate among the federation’s other states, including the FCT, validating its designation as the pandemic’s epicentre. The recovery was followed by FCT, with Kogi recording the fewest recovery cases. It is worth noting that all recoveries are proportionate to the infection rate per state.
The number of death cases depicted in Fig. 3 showed a significant improvement in the management of the pandemic in Lagos state when compared to the confirmed cases presented for the state in Fig. 1. Edo state was ranked 7th in terms of infected cases and recorded the second highest number of deaths due to the pandemic, superseding FCT, Rivers, Plateau, Oyo and Kaduna states respectively. The mortality rates in each of the states were found to be steady due to the pro-activeness of each state government in handling the pandemic in order not to pose an adverse effect on her respective economy.
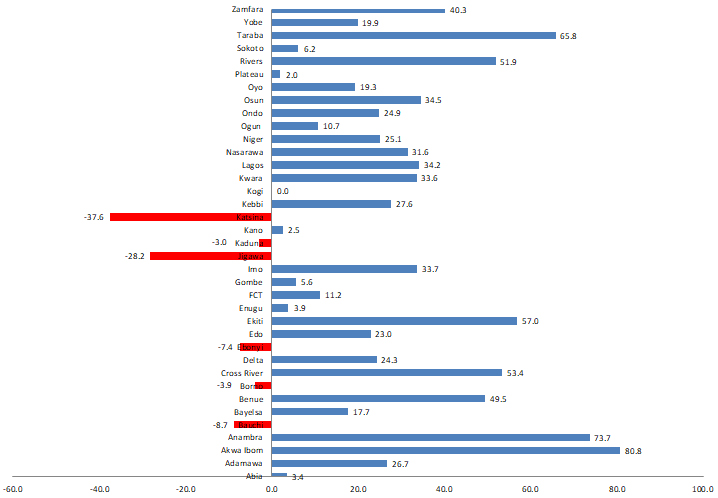
Confirmatory analysis of the year-on-year variation in the number of confirmed cases of COVID-19 shown in Fig. 4, revealed that lifting the lockdown and reopening all sectors of the economy to full capacity increases the number of confirmed cases in the majority of states, despite the government’s stringent measures. Only six (6) states appeared to have experienced a decrease in the number of affected people. Katsina, Kaduna, Jigawa, Ebonyi, Borno, and Bauchi are among these states. Except for Ebonyi, all of these states have been beset by instability ranging from insurgency to banditry and kidnapping, reducing the testing capacity of those who may have been infected. Furthermore, the majority of their citizens live in internally displaced persons’ IDP camps, where COVID-19 infection is likely to be high due to a high level of interactions. The Kogi state status is an uncommon static scenario, with no growth or decline cases. This was due to the state government’s administrative stance in ensuring that the Nigerian Center for Disease Control (NCDC) was not permitted access into the states to conduct COVID-19 tests on the people.
Figure 1.
Trend analysis of Nigeria COVID-19 confirmed cases, 2020–2021.
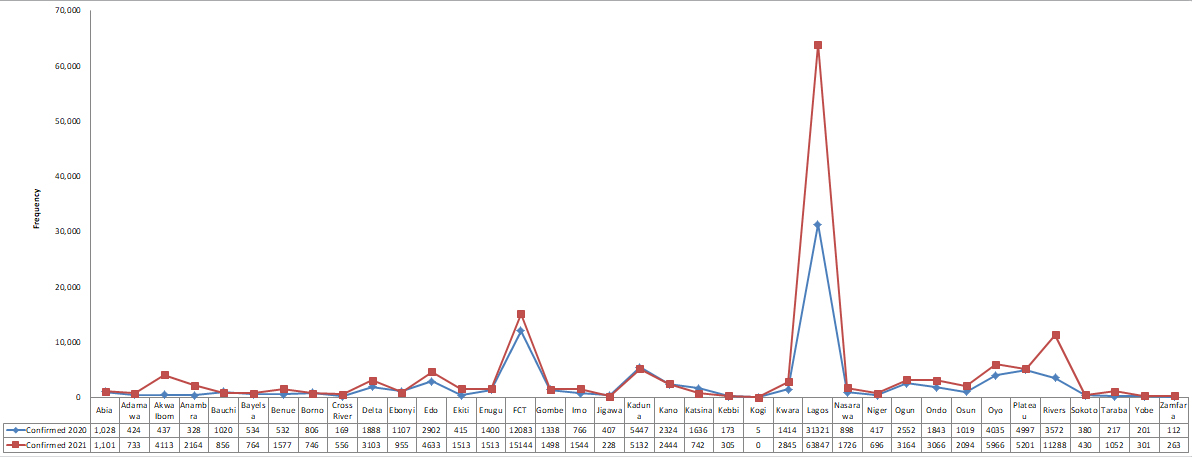
Figure 2.
Trend analysis of Nigeria COVID-19 recovered cases, 2020–2021.
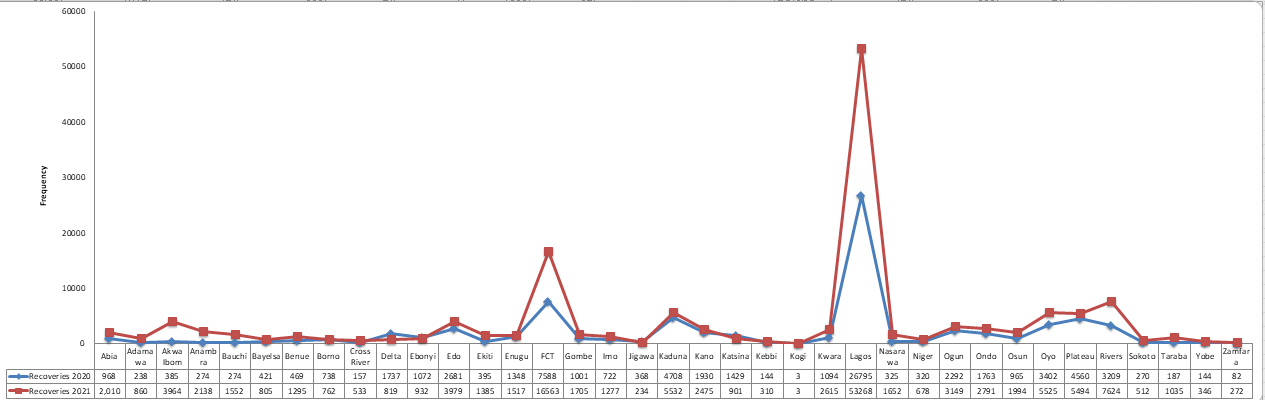
Figure 3.
Trend analysis of Nigeria COVID-19 death cases, 2020–2021.
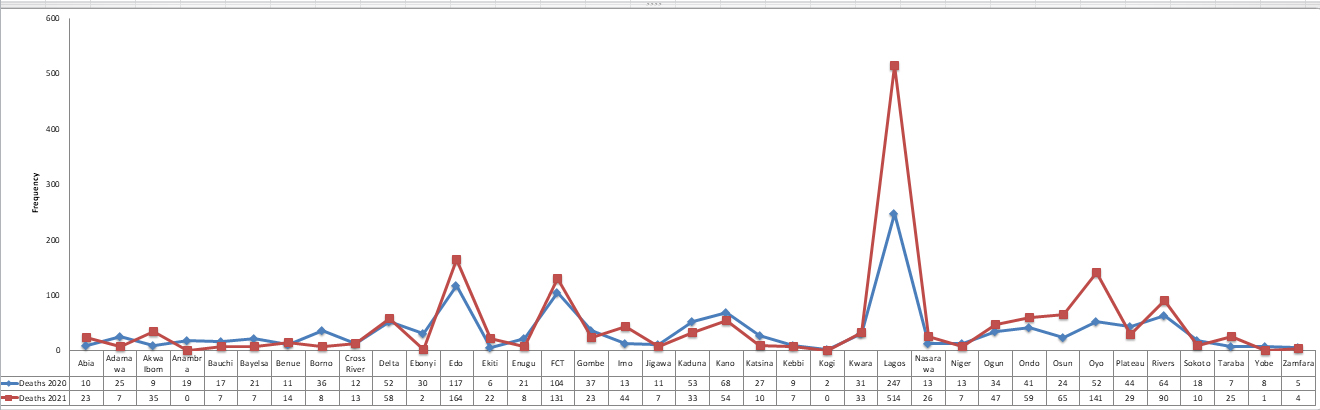
Figure 4.
COVID-19 confirmed cases year on year adjustment (2020 and 2021).
The trend analysis of the Internally Generated Revenues (IGR) performance for the pre-COVID-19 and COVID-19 years under consideration as shown in Fig. 5, demonstrated that the thirty-six (36) states, including the Federal Capital Territory (FCT), generated a consistently increasing IGR over time. In 2019, the consolidated IGR for the states was 1,334,226,010,281.36, compared to a consolidated IGR of 1,306,075,020,100.82 in 2020. While the majority of states witnessed a reduction in IGR growth during the pandemic year 2020, Lagos state and the FCT were able to sustain stable growth of IGR, albeit with less variance than could have been expected in the absence of COVID-19. This modest rise can be attributed to the role of Lagos state as the nation’s economic hub and FCT as the seat of government, as well as the advanced level of technology already in use in the management of official data in Lagos state and FCT. In the advent of COVID-19, the overall performance resulted in a 1.1% reduction in IGR. The considerable decline in the IGR can be linked to several sectors of the economy, particularly small size firms that were excused from tax payment to mitigate the consequences of the pandemic lockdown. This means that the pandemic will hurt the various states’ IGRs in 2020.
With over 200 million Nigerians requiring government assistance, an IGR of 1,306,075,020,100.82 as a result of the COVID-19 pandemic dealt a significant blow to governance in Nigeria, and widespread starvation was experienced. In her magnanimity, the federal government aided states with bailout monies, while state governments also handed some assistance packages to the imprisoned citizens. Due to their dense population, Lagos, Rivers, FCT, Delta, Kaduna, Ogun, Oyo, and Kano were identified as the states most hit by the pandemic [see Table 1]. Lagos state is the epicentre, serving as the southwestern region’s commercial hub, while Rivers, FCT, and Kano serve as the commercial centres for Nigeria’s south-south, north-central, and northwestern regions, respectively. Because of its proximity to Lagos and Oyo states, Ogun state has a higher number of confirmed COVID-19 cases.
Figure 5.
Total IGR by states of the federation (2019–2020)
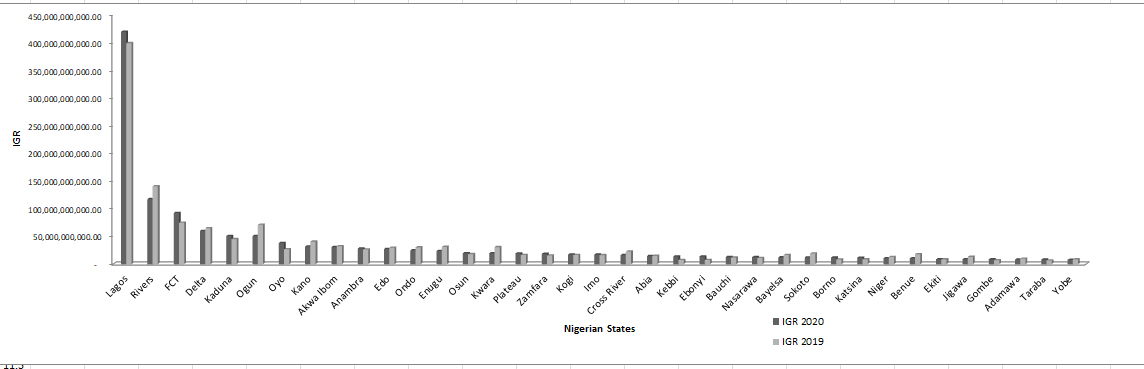
Table 3
Analysis of the effect of COVID-19 pandemic on the total revenue per states
| States | IGR 2019 | IGR 2020 | Year on year growth % |
|---|---|---|---|
| Lagos | 398,732,246,493.38 | 418,988,587,897.11 | 2.48 |
| Rivers | 140,398,744,302.70 | 117,189,729,245.29 | (9.01) |
| FCT | 74,564,180,835.31 | 92,059,700,897.42 | 10.50 |
| Delta | 64,678,796,991.57 | 59,732,882,662.97 | (3.98) |
| Kaduna | 14,956,576,583.38 | 50,768,523,407.34 | 54.49 |
| Ogun | 70,922,590,495.89 | 50,749,595,850.07 | (16.58) |
| Oyo | 26,746,460,235.93 | 38,042,733,036.47 | 17.44 |
| Kano | 40,593,701,332.48 | 31,819,816,711.74 | (12.12) |
| Akwa Ibom | 32,291,014,771.52 | 30,696,770,278.96 | (2.53) |
| Anambra | 26,369,195,864.89 | 28,009,906,580.48 | 3.02 |
| Edo | 29,478,406,024.31 | 27,184,350,734.90 | (4.05) |
| Ondo | 30,135,881,918.26 | 24,848,466,192.88 | (9.62) |
| Enugu | 31,069,466,913.00 | 23,650,723,357.00 | (13.56) |
| Osun | 17,922,394,523.43 | 19,668,371,916.01 | 4.64 |
| Kwara | 30,646,731,408.92 | 19,604,303,787.64 | (21.97) |
| Plateau | 16,480,111,593.83 | 19,122,375,801.59 | 7.42 |
| Zamfara | 15,416,043,399.76 | 18,499,252,091.61 | 9.09 |
| Kogi | 16,389,026,388.86 | 17,357,833,531.99 | 2.87 |
| Imo | 16,095,299,620.59 | 17,081,878,984.93 | 2.97 |
| Cross River | 22,597,063,882.55 | 16,183,341,456.32 | (16.54) |
| Abia | 14,769,307,658.56 | 14,376,871,322.30 | (1.35) |
| Kebbi | 7,367,334,837.13 | 13,778,260,800.14 | 30.32 |
| Ebonyi | 7,455,294,676.59 | 13,591,038,584.15 | 29.15 |
| Bauchi | 11,696,955,884.75 | 12,502,599,363.55 | 3.33 |
| Nasarawa | 10,858,822,422.98 | 12,476,738,650.15 | 6.93 |
| Bayelsa | 16,342,762,531.98 | 12,180,775,243.00 | (14.59) |
| Sokoto | 19,005,093,541.11 | 11,796,827,128.19 | (23.40) |
| Borno | 8,175,248,326.42 | 11,578,518,120.67 | 17.23 |
| Katsina | 8,496,742,119.00 | 11,399,650,509.67 | 14.59 |
| Niger | 12,765,034,972.30 | 10,524,281,921.17 | (9.62) |
| Benue | 17,850,480,389.57 | 10,463,674,280.73 | (26.09) |
| Ekiti | 8,546,875,648.24 | 8,716,460,193.84 | 0.98 |
| Jigawa | 12,926,658,146.29 | 8,667,720,607.78 | (19.72) |
| Gombe | 6,803,064,814.10 | 8,537,983,927.43 | 11.31 |
| Adamawa | 9,704,660,185.42 | 8,329,870,706.65 | (7.62) |
| Taraba | 6,533,106,447.27 | 8,114,973,143.14 | 10.80 |
| Yobe | 8,444,634,099.09 | 7,779,631,175.54 | (4.10) |
| Total | 1,334,226,010,281.36 | 1,306,075,020,100.82 |
( |
Table 4
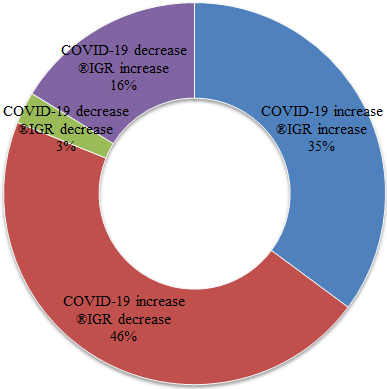
Frequency and %age analysis of states IGR status and advent of COVID-19 pandemic in Nigeria
| Status | States |
| % |
|---|---|---|---|
| COVID-19 increase | Ekiti, Lagos, Imo, Anambra, Osun, Nasarawa, Plateau, Zamfara, FCT, Taraba, Gombe, | 13 | 35 |
| Oyo and Kebbi | |||
| COVID-19 increase | Benue, Sokoto, Kwara, Ogun, Cross River, Bayelsa, Enugu, Kano, Ondo, Niger, Rivers, | 17 | 46 |
| Adamawa, Yobe, Edo, Delta, Akwa Ibom and Abia State | |||
| COVID-19 decrease | Jigawa | 1 | 3 |
| COVID-19 decrease | Bauchi, Katsina, Borno, Ebonyi, Kogi and Kaduna | 6 | 16 |
| Total |
36 States | 37 | 100 |
Figure 6.
IGR year on year growth (2019 and 2020).
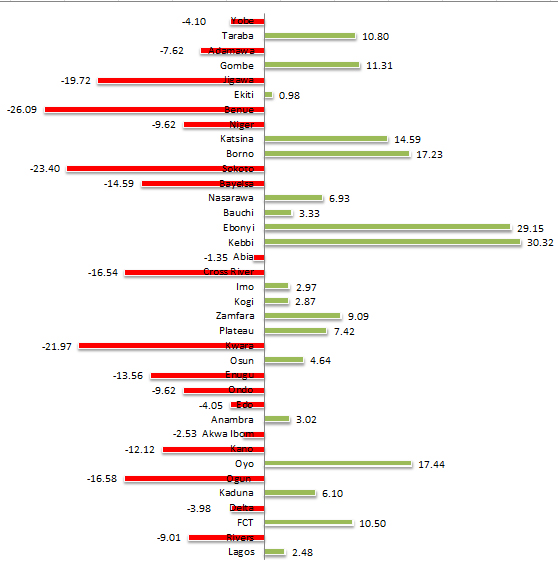
Figure 7.
%age of states based on COVID-19 and IGR trends.
Comparative analysis of state IGR trends over the years under consideration revealed an upward trend for Lagos (2.48%), FCT (10.5%), Kaduna (54.59%), Oyo (17.44%), Anambra (3.02%), Osun (4.64%), Plateau (7.42%), Zamfara (9.09%), Kogi (2.87%), Imo (2.97%), Kebbi (30.32%), Ebonyi (29.15% This means that each state adapted to new trends in data collecting (taxes and rates) that do not involve face-to-face interaction between taxpayers and collectors. With many statutes adopted into legislation to verify the new normal in the administration of official statistics, the use of technology aided in the process. Despite the advancement of technology in the acquisition of official data, several states were unable to withstand the pandemic era in terms of income generation, resulting in a decreasing trend in IGR. These stats as presented in Fig. 6 are listed as Rivers (
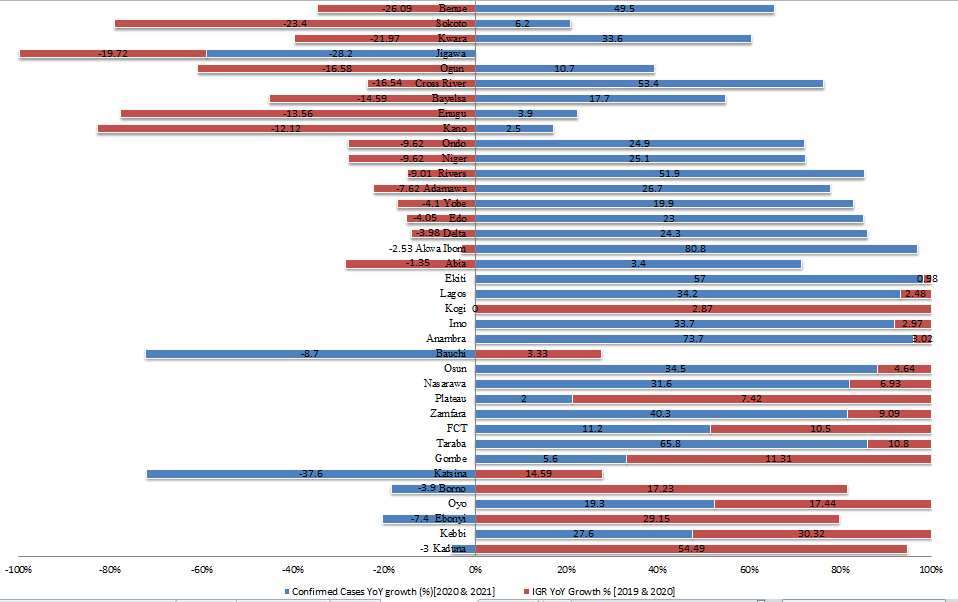
Figure 8.
Comparison between confirmed cases and IGR based on YoY growth.
As shown in Fig. 7, 46% of all states had an increase in COVID-19 between 2020 and 2021, with a commensurate fall in IGR. This conclusion implied that the governments of such nations loosened tax collection, particularly on a small and medium scale, and they were unable to fully innovate new data gathering methods as mandated by COVID-19. For that purpose, the use of technology to generate money through the introduction of digital channels such as banks, POS, online Apps, and so on has not been properly employed in those states. Furthermore, 35% of all states were found to have an increase in COVID-19 cases and an increase in IGR throughout the specified years. This means that considerable initiatives were put in place to mitigate the effects of the pandemic, ultimately increasing the individual states’ economies.
In addition, 16% of the entire states were also found to record a decrease in the number of COVID-19 cases and an increase in IGR while 3% of them recorded a decrease in COVID-19 as well as in IGR [See Table 4 for the details]. Graphical representation of the analysis is also depicted in Fig. 8 with respective states’ percentage increase/decrease in both COVID-19 and IGR on display.
4.Conclusion and recommendations
Many lives, businesses, and governments have been impacted by the COVID-19 pandemic in Nigeria and around the world; production and consumption of official statistics have suffered greatly during the pandemic era, negatively impacting the internally generated revenue of numerous states governments in Nigeria. Reports and documentation of COVID-19 infected patients were also prohibited, as seen in the case of Kogi state and other states with relatively smaller recorded numbers. Despite this, revenue generation during the pandemic dropped generally in the entire country, Nigeria. Though some states experienced a minute level of increment due to their economically advantaged position in the country. These results are the realization of states that have embraced technology-driven mechanisms for mobilizing IGR and other essential official data where direct connections may be prohibited. The relevance of public trust in the attainment of quality official statistics should be understood by policymakers to corroborate government efforts at all levels of governance. Furthermore, taking computerization and digitalization into account, there should be an acceptable update in maintaining a comprehensive revenue register and quality revenue data when physical contacts are prohibited as experienced during the pandemic. Furthermore, the revenue assurance principle should be implemented by state governments to minimize revenue loss, reduce fraudulent practices, and all forms of misappropriation through the timely collection of accurate income. To ensure that state governments continue to meet their objectives during the pandemic, measures that ensure effective and efficient revenue generation should be implemented to reduce leakages and improve financial capability for the provision of goods and services, thereby slowing the spread of the pandemic and not impeding the country’s economic growth.
Acknowledgments
The authors wish to acknowledge the online data producers through which the data for this research were sourced.
References
[1] | Mo Ibrahim Foundation. COVID-19 in Africa: What does it mean for young people – Now Generation Network Survey – Retrieved July 26, (2020) , from https://mo.ibrahim.foundation/sites/default/files/2020-07/ngn-survey-report.pdf. |
[2] | McKibbin W, Fernando R. The global macroeconomic impacts of COVID-19: Seven scenarios. Asian Economic Papers. (2020) ; 20: (2): 1-30. |
[3] | Ozili P, Arun T. Spillover of COVID-19: Impact on the global economy. MPRA Paper No 99850. (2020) . |
[4] | Kolasa K, Mazzi F, Leszczuk-Czubkowska E, Zrubka Z, Péntek M. State of the Art in Adoption of Contact Tracing Apps and Recommendations Regarding Privacy Protection and Public Health: Systematic Review. JMIR Mhealth Uhealth. (2021) ; 9: (6): e23250. URL: https://mhealth.jmir.org/2021/6/e23250. doi: 10.2196/23250. |
[5] | Khurshid A. Applying Blockchain Technology to Address the Crisis of Trust During the COVID-19 Pandemic. JMIR Med Inform. (2020) ; 8: (9): e20477. URL: https://medinform.jmir.org/2020/9/e20477. doi: 10.2196/20477. |
[6] | Ozili P. COVID-19 pandemic and economic crisis: The Nigeria experience and structural causes. Retrieved from: https://mpra.ub.unimuenchen.de/103131/MPRA Paper No. 103131, posted 28 Sep 2020. |
[7] | OECD. Revenue statistics in Africa. 1990–2017. Paris: OECD, (2019) . |
[8] | Aprigliano V, Ardizzi G, Monteforte L. Using payment system data to forecast economic activity. International Journal of Central Banking. (2019) ; 15: (4): 55-80. |
[9] | Nabena D. Setting the social minimum through a tax for service programme. NGF 7 |
[10] | Adekoya AA, Agbetunde LA, Akinrinola OA. COVID-19 Pandemic and Internally Generated Revenues in Local Gov-ernments: Nigeria Experience. International Journal of Applied Economics, Finance and Accounting. (2021) ; ISSN 2577-767X(9): 63-75. doi: 10.33094/8.2017.2021.92.63.75. |
[11] | United Nations Committee for the Coordination of Statistical Activities. (2020) . https://unstats.un.org/unsd/ccsa/. |


