
Developing a future pipeline of applied social researchers through experiential learning: The case of a data fellows programme
Abstract
This paper presents an innovative model for developing data and statistical literacy in the undergraduate population through an experiential learning model developed in the UK. The national Q-Step (Quantitative Step change) programme (2013–2021) aimed to (i) create a step change in teaching undergraduate social science students quantitative research skills, and (ii) develop a talent pipeline for future careers in applied social research. We focus on a model developed at the University of Manchester, which has created paid work placement projects in industry, for students to practise their data and statistical skills in the workplace. We call these students data fellows.
Our findings have informed the development of the undergraduate curriculum and enabled reflection on the skills and software that we teach. Data fellows are graduating into careers in fields that would previously have been difficult to enter without a STEM (Science, Technology, Engineering and Mathematics) degree. 70% of data fellows to date are female, with 25% from disadvantaged backgrounds or under-represented groups. Hence the programme also addresses equality and diversity.
The paper documents some of the successes and challenges of the programme and shares insight into non-STEM pipelines into social research careers that require data and statistical literacy, A major advantage of our approach is the development of hybrid data analysts, who are able to bring social science subject expertise to their research as well as data and statistical skills.
Focusing on the value of experiential learning to develop quantitative research skills in professional environments, we provoke a discussion about how this activity could not only be sustained but also scaled up.
1.Introduction
This paper introduces an initiative, established at the University of Manchester, UK, in 2013 that seeks to develop skills in statistical and data literacy for social science undergraduates. The programme of work which we expand upon in this paper rests on two planks. First, quantitative data, and the skills needed to critically evaluate and use these data in research, are included in all aspects of the social science curriculum, from Year 1 of the degree course. And second, the opportunity to undertake a two-month long paid work placement – to be a data fellow – is available to students at the end of their second year of their (typically) three-year degree. Moreover, students have the option to specialise as they progress through their degree on a pathway with ‘quantitative methods’ in the title. The paper focuses on reporting the findings of the combination of the teaching approach taken, and the data fellows programme developed. To contextualise and illustrate the findings, examples of the curriculum taught, the use of real world data (in the classroom and the workplace), the optional data fellows programme, and the career trajectory of a current data scientist who has graduated from this scheme, are all covered. The aim of the approach is to develop a future pipeline of applied social researchers through data-driven teaching that is embedded in social science subject domains, and which opens up experiential learning opportunities hosted in organisations undertaking quantitative social research.
The paper is largely discursive with the following structure. In Section 2, we provide the background to the data fellows programme, explaining how this was developed as part of the University of Manchester’s experiential learning-based approach to quantitative skills development in the undergraduate social science curriculum. This section draws on experiential learning literature generally and the emerging (but sparse) area of research on the pedagogy of developing quantitative skills. In Section 3 we introduce some examples of how quantitative research skills are taught across the social sciences at the University of Manchester, in the first two years of the undergraduate degree, using three different subject areas (Politics and International Relations, Criminology and Politics). This section illustrates the topics, software and methods taught, and highlights the applied and practical nature of the teaching. In Section 4, through focusing more closely on the data fellows programme, we provide examples of how students have enhanced their data skills through immersion in the professional workplace. We show the breadth of organisations that value these skills sufficiently to provide these data fellow opportunities, indicating the industry demand for quantitatively trained social scientists. Examples of student outputs, produced whilst on placement, are also included. Section 4 concludes with a case study from a graduate seven years on from being a data fellow to demonstrate the sorts of organisations and social research roles that our former data fellows graduate into, and the types of career trajectories that are open to them. Finally, we conclude by reflecting on the challenges and opportunities that have arisen through this initiative to date, and discuss related activity, and some ideas for future sustainability, and scaling up, of the programme. Whilst the paper makes reference to official statistics, the teaching and the data fellows programme we include cover data and statistical literacy more broadly.
2.The background to the data fellows programme
Here we introduce the history of the national programme that provides the context for this paper.
2.1Q-Step programme – teaching ‘quant skills’
The aim of the UK-wide Q-Step programme was to create a step-change in teaching quantitative research methods to social science undergraduates, as a ‘systematic response to the shortage of quantitatively skilled social science graduates.’ [1]. David Willetts, the former government minister who announced the launch of the programme, referred to the need for ‘STEM skills in the social sciences’ [2]. The seventeen Q-Step Centres funded through the programme across the UK were encouraged to be experimental and innovative in their approaches to developing undergraduates’ ‘high-level quantitative skills’ [3, p. 1]. Although the Centres took differing approaches several common themes emerged. These included: developing new data-driven curricula; understanding how to develop and improve the quantitative skills pipeline from undergraduate to postgraduate study, and careers; and addressing the need for more practice-based opportunities for students to grapple with the realities of data analysis. Research work placements and internships, and summer schools, sprang up across the Centres as a way to address the need to learn how to do data analysis outside of the classroom. Practising data skills in real world contexts and developing, within and outside the classroom, the pipeline of graduates able to undertake quantitative social research, came to characterise the Q-Step programme.
Grundy [3, p. 5] provides a summary of the background to and inception of the Q-Step programme, together with a snapshot of the multiple outputs across the centres drawing on the mid-term external evaluation of the programme. He further expands on the programme’s definition of ‘quant skills’ which includes the ability to:
• Design surveys and experiments, and understand how to analyse and interpret the data they generate
• Analyse and interpret data from other sources, such as social media data, data collected by government departments and agencies, and data from longitudinal cohort studies
• Evaluate the quality of data collection and analysis as well as develop an understanding of what constitutes good – and bad! – evidence and how you can use it to make decisions.
The work reported in this paper focuses largely on the ‘quant skills’ listed above. We use a broad definition to capture the wide range of analytical and research skills required to undertake quantitative social research. This paper cannot reflect on how these skills were taught across the Centres, although this forms the basis of a forthcoming external evaluation of the programme. Rather we seek to illustrate how one of the Q-Step Centres addressed the need to develop data and statistical skills training in its undergraduate student population, and how this was made possible through the introduction of a work placement – data fellows – initiative. Importantly, this involved building on a teaching approach that taught these skills through a social science subject lens thereby equipped students with the knowledge, skills and confidence to apply for these experiential learning opportunities.
University of Manchester’s Q-Step Centre and the data fellows programme
The University of Manchester’s Q-Step Centre provides the case study upon which this paper is developed. Being just one of the seventeen Q-Step Centres we make no claim regarding the generalisability of the findings, offering it rather as an example of what was achieved at one research-intensive UK university, and thus illustrating what is possible when universities work in partnership with industry.
Our response to developing quantitative social scientists at the University of Manchester is two-fold. We aim:
“first, to expose all social science students from the start of their degree to quantitative data and skills teaching and, second, to put in place training for future quantitative researchers. We want to find the future researchers and teachers who can develop quantitative capacity in university education, as well as in the professions that engage in social research.” [4, p. 81]
In Section 2 of this paper we provide some examples of how we teach data analysis in three of our degree courses to achieve our aims. Elsewhere we discuss the approach we have developed to teaching quantitative research methods that are embedded in substantively led social science [5, 6]. Approaches developed by others in teaching quantitative social science (and indeed social science research methods more generally) at different levels indicate this is a growing, but under-researched, area [7, 8, 9]. There is a strong literature on how quantitative skills and statistical reasoning are taught, although this appears most prominently in STEM and educational (rather than social science) spaces. For example, the International Association for Statistical Education’s (IASE) Statistical Education Research Journal (SERJ) provides papers by academics and practitioners spanning more than a quarter of a decade and the Guidelines for Assessment and Instruction in Statistics Education (GAISE) report provides comprehensive guidelines and posits a blueprint for teaching statistics [10]. Moreover, the IASE’s International Statistical Literacy project11 which was originally established in 1994 (as the World Numeracy Program) to ‘spread quantitative skills around the world in areas and populations … that could benefit from increased knowledge of numbers and their applications, with particular regard to statistics’ is an educational initiative that shines a light on the pedagogy of statistics. Education in general, and STEM education in particular, thus has a rich history in teaching and reflecting on the acquisition of quantitative skills. There is also a vast literature on experiential learning, especially in vocational teaching (see [11, 12]). Koparan and Guven show how experiential learning approaches, such as project-based learning, can result in success in teaching statistics (specifically data representation) in the secondary school classroom [13]. There is a paucity of research however examining how quantitative skills relevant to applied social research are acquired in the workplace; that is to say, how experiential learning supports the acquisition of data and statistical skills in the workplace. This paper sets out to address one way in which we can address this gap, through providing examples which evidence how a data fellows programme equips students with the skills and experience to enter graduate careers which require training in quantitative research methods and data analysis.
Here we provide a summary of the data fellows programme, with a more thorough exposition available in ‘Work placements, internships and applied social research’ [14]. The University of Manchester’s Q-Step Centre established a paid internship programme, through which social science undergraduates studying data analysis units as part of their degree courses could optionally apply to undertake a summer work placement in a host organisation. We opened the programme in 2013, with 19 students participating in the summer of 2014. By the summer of 2019 we had placed a total of 236 data fellows in over sixty host organisations. The students were paid the living wage to undertake these data-driven research projects which were co-designed with the host organisation (we call them hosts, rather than employers, as the students became casual employees of the University for the duration of the internship). This required significant input from the data fellows programme lead, but the return on investment has proven to be encouraging, as this paper shows.
One measure of success for the data fellows programme is the establishing of partnerships and graduate employment opportunities between the university and organisations undertaking applied social research (see also Section 4). Eight of the ten case studies in Carter’s book [14] are taken from the programme, with vignettes provided from early career researchers in social research roles. Examples of organisations that have hosted our students include government departments (including the Office for National Statistics, the Department for Education and the Home Office), think tanks and data consultancies, market and social research agencies (e.g. Ipsos) and polling companies (e.g. YouGov), charities and voluntary organisations (AgeUK, Respect), media organisations (BBC, the Times) and The World Bank. These hosts are selected to reflect the types of organisations we want our undergraduates to acquire experience in, and taking the broad definition of ‘quant skills’ as presented earlier, we focus on projects that will enable them to apply the skills they have learned in the classroom and PC lab. After all, statistics and data analysis require practitioners as well as theoreticians. We were mindful of creating practical experiences, to build on the taught components of the research methods curriculum and help develop graduates who will consequently be able to evidence their skills, in part gained through experience in the workplace, and therefore be in a strong position to enter the labour market. A framework for supporting data fellows to elicit and capture analytical and research, and professional, skills is provided by Carter (14, Chapters 7 and 8).
2.2Data and statistical literacy skills needs
The data fellows programme described is set firmly against the backdrop of a global need for data and statistical skills development. The most obvious example of this is the UN Sustainable Development Goals22 (SDGs), which have established the need for a data literate global citizenship, and we report elsewhere on how we are exploring the potential of the data fellows model to develop skills capacity to deliver on the SDGs [15].
There is clearly a societal need for data and statistical skills development, globally, nationally, regionally and locally. Our response to this need is to align a social science university education with the public, private and not-for-profit sectors to support skills training. The capacity development is also spearheaded by the IASE’s ISLP,33 a global project to coordinate efforts to improve statistical literacy through education. Much human capital investment is needed if we are to deliver on the skills development required to achieve these ambitious global goals.
The UK National Data Strategy (NDS) [16] makes reference to a ‘data skills taskforce’ which contributes to ‘the data skills ecosystem in order to improve the leadership and facilitation of new and better collaborations between industry, the public sector, universities and institutes’ [16]. The NDS also uses a broad definition of data skills, noting that basic data literacy should be included, which requires ‘some knowledge of data uses, some ability to assess the quality of data and its application, and the skills to conduct basic analysis’ – a definition which accords with the ‘quant skills’ one given above. Rather than attempt to define precisely the terms data and statistical literacy or skills, in this paper we adopt these looser and pragmatic definitions. Our teaching and the skills our data fellows acquire and develop in the workplace create a self-reflective iterative feedback loop which enables us to be responsive to industry needs, whilst creating tailored opportunities for our students building on how we teach them.
2.3Experiential learning
We noted above that whilst data analysis is a practical skill set, publications reflecting the teaching of it at least in the social sciences seem not to have permeated the literature on experiential learning. We argue here that this is a gap that needs to be filled and propose that experiential learning provides a useful framework for the teaching of quant skills, especially when delivered through work-placed project-based experiences.
Carter (14, Chapters 1 and 2) covers the theoretical background to experiential learning and its relevance to applied social research as well as the benefits to different stakeholders (that align with those acknowledged in the National Data Strategy cited above). In his typology for early career learning, Eraut [17, p. 187] provides a potentially valuable framework for monitoring and assessing work processes and actions relevant to the acquisition of data analytical skills. These include, for example, problem solving and trying things out (as work processes with learning as a by-product) and reflecting and learning from mistakes (as learning actions located within work or learning processes). This typology is sufficiently general to encompass the sorts of data skills training covered through the data fellows programme, but also with its focus on early career learning is valuable to the development of our students. As such this provides a useful high-level framework which informs the tools created to assist data fellows to baseline and monitor their analytical and research skills development. A framework that evaluates more precisely the data and statistical skills required of early career applied social researchers would be extremely valuable in helping support the development of specific skills and competencies acquired through the workplace. The UK’s ESRC (Economic and Social Research Council) has commissioned a project to explore the skills needs of social sciences to support data-driven research which will report shortly and inform future skills training for social researchers [18]. We need research on this especially as it relates to the acquisition of data skills in the workplace, The UK Government Public Sector Data Science Skills Capability report [19] is a step in the right direction although it fails to make reference to the subject expertise that social scientists bring to their research. This paper raises the question of what we can do, as a social science community, to ensure that quantitative research skills acquired in the workplace can enhance understanding of the sorts of experiences that educators need to develop for their students. We argue here that this is an under researched area and we need to improve our understanding of how it can contribute to developing the pipeline of applied social researchers that forms the focus of this paper.
3.Quantitative skills training in the social science classroom
This section provides information on the training that social sciences students at the University of Manchester are given as part of their undergraduate degree. It is intended to provide an overview, using three course units on three different degrees to offer examples of the learning outcomes, as well as the methods and software taught, and to show which data sources are used to teach students data analysis embedded into their degree subject.
At the time of writing, and seven years since the Q-Step Centre was initiated, we have taught statistics and data analysis to around 3000 undergraduate students, introduced five new course units, taught across multiple degree programmes, and placed almost 240 of those in the workplace as data fellows. We have introduced prizes for quantitative dissertations, run ‘celebration events’ (student conferences) for our data fellows, and used the learning from our experiences to adapt the curriculum to reflect the needs of employers. This section is a snapshot of the teaching we currently offer to students, with a particular focus on enabling them to be in a position to apply to undertake a data fellowship (noting that these are optional). Eligibility onto the work experience programme operates at two levels. First students need to be on a specific social science degree (economics degrees were excluded from the Q-Step funding, as they were regarded as already including quantitative skills training) and they need to undertake at least one prerequisite course unit. The examples covered here reflect both levels of eligibility. The list of degree subjects within scope of the University of Manchester Q-Step Centre are: Criminology; English language and linguistics; Philosophy; Politics and International Relations; Politics, Philosophy and Economics (PPE); Social Anthropology; and Sociology. Further information about eligibility criteria at course unit level can be found at the Q-Step website.44
3.1Three example course units
Three course units are discussed in this section taken from Politics and International Relations, Criminology and Sociology degree offerings.
3.1.1Example course unit 1: Making sense of politics
This is a first year (Level 1) compulsory unit for all Politics and International Relations students. The unit was introduced in 2014, following the appointment of a new lecturer as part of the Q-Step Centre team building. This unit provides opportunity for first year undergraduates on a Politics and International Relations degree to engage with theoretically informed and topical, empirical political research questions. Students have a mix of lecture-based teaching and lab-classes, where they are introduced to quantitative research data in both SPSS and Excel (Excel is used predominantly for data visualisation). The assessed reports they produce enable them to apply their newly acquired skills using a topic of interest to them. They start with descriptive statistics and progress to undertaking bivariate analyses and producing and interpreting chi-square tests. The data used in the course differs each year (and depends largely on which lecturer is teaching); in 2020 the students were introduced to data from the British Social Attitudes Survey, the European Social Survey, the British Elections Study and a dataset collated by a political science academic (https://www.pippanorris.com/).
A full description of the course unit is available online.55 We summarise here the core material relevant to this paper:
Description of the course unit:
“Making sense of politics” introduces students to the idea of using data to resolve central questions in politics research, and to the methods used to gather, analyse and present data. The main goal is to develop the ability to conduct primary research and to develop a critical awareness of the use of data in political and media debate. The course takes a hands-on and applied approach: students get the opportunity to analyse real data and obtain original research findings around key questions in politics research. The unit will draw very widely from across the discipline, using examples from relevant political topics which should engage student interest. The topics explored are revised every year to ensure the most recent data available is used and to capture relevant events taking place around the time of the course (e.g. an election). For all those looking to understand and use data in the study of politics and society, the unit provides an essential foundation in the basic skills of data collection, evaluation and analysis.
Learning outcomes:
Students will be able to demonstrate the following skills:
• An ability to analyse some of the central questions in politics research empirically;
• Knowledge about how politics researchers develop strategies to analyse relevant and contemporary questions;
• Knowledge of widely used data analysis techniques and software (SPSS and Excel);
• Knowledge of some of the most widely used data resources, such as election studies, comparative surveys or databases of democracy;
• A critical awareness of the strengths and weaknesses of different methods of gathering data and applying them to political research questions;
• A critical awareness of the use of data in political and media debate;
• Knowledge of how data resources can be found and used to inform research on central political and social issues;
• An ability to communicate ideas in writing and verbally.
Course schedule (lecture followed by tutorial)
1. The process of measurement/Finding quantitative data online
2. Surveys and sampling/Introduction to SPSS
3. Analysing quantitative data (I)/Descriptive analysis in SPSS
4. Analysing quantitative data (II)/From SPSS to Excel
5. Analysing quantitative data (III)/Q&A session about first assessed report
6. Analysing quantitative data (IV)/Crosstabs in SPSS
7. Introduction to qualitative methods/Developing a topic guide
8. Analysing qualitative data/Qualitative analysis
9. Other quantitative approaches in politics research/Quantitative content analysis
10. Wrap-up and final assessment support
Mode of assessment
• Report 2,000 words 45%
• Report 2,500 words 55%
Examples of topics explored
The topics examined in the course will cover the full range of politics research, including:
• Political behaviour: Why do some people vote (and why do others stay home)? When and why do protest movements emerge? When and why do people support extremist movements and parties?
• Comparative politics: When and why do dictatorships rise and fall? When does democracy emerge, and what makes it stable?
• International relations: When and why do nations go to war? When and why do civil wars happen?
3.1.2Example course unit 2: Making sense of criminological data
This is a second year (Level 2) optional unit which can be taken by Criminology students. Students who want to apply for a data fellowship must take this course. It builds on a first-year mandatory unit entitled ‘Criminological research methods’ which introduced quantitative and qualitative methodologies and research design.
The ‘Making sense of criminological data unit was also developed as part of the Q-Step Centre programme. It is the first of two second year units for criminology students and takes place in the first semester (the other entitled ‘Modelling Criminological Data’ is taught in the second semester, using R). It provides an opportunity for second year undergraduates to develop their data analysis skills through examining topics of interest to the lecturer. All the practical materials have been made available online through GitHub. The delivery mode is a combination of lab classes where students work in groups with the support of the lecturer and a Graduate Teaching Assistant (using remote teaching in 2021) and lectures. The unit uses Excel for the quantitative analysis, and students analyse data from the Crime Survey for England and Wales, and some local police force data. NVivo is used for qualitative analysis.
The course outline and other materials are available online.66 All the course materials for the practical sessions are also available online.77 We summarise here the core material relevant to this paper:
Description of the course unit:
“Making sense of criminological data” provides a first insight into dealing with quantitative and qualitative data. By the end of this module students are expected to have a critical and practical understanding of descriptive data analysis and be able to summarise and draw meaningful conclusions from various forms of data. They will be proficient in the use of Excel and NVivo. This course is designed to get students working with data related to crime and criminal justice, as well as other aspects of everyday life. It is designed to be both fun, and requires a lot of hard work, as students will be acquiring a new skill. No previous knowledge or special disposition towards maths or stats, is required. Students are required do all the reading, watch all the videos, ask questions, follow all the tasks and activities, try new things, make mistakes, get feedback, ask questions, ask for help, help each other, ask questions, ask for help, ask questions.
Learning outcomes:
After this course, students should be able to:
• Identify the principal data sources for a number of key areas in criminology and other cognate areas of social policy
• Demonstrate a critical awareness of key data quality issues and how they are linked to research design decisions
• Produce, read, and interpret quantitative information in the form of tables and graphs
• Understand the basic tenets and concepts of exploratory data analysis (e.g. measures of central tendency and spread, various types of charts), as well as principles of good data visualisation
• understand the different levels at which social and personal characteristics (variables) are measures and how resulting data are distributed
• Become aware of the range of existing qualitative data and basic approaches to their analysis
Course schedule (lab session followed by lecture)
1. Data sets and variables
2. Describing and visualising single variables
3. Making comparisons I: the basics
4. Concepts, operationalization, measurement
5. Making comparisons II: the relevance of research design
6. Data visualization
7. Looking at trends
8. Qualitative methods 1
9. Qualitative methods 2
10. Wrap up and project support
Mode of assessment
• Weekly homework (from lab sessions) 20%
• Research Report 2,500 words 80%
Practical skills
• Read and interpret quantitative information in the form of tables and graphs
• Understand some of the basic principles underlying statistical analysis including: samples and populations, distributions, statistical significance, hypothesis testing
• Understand the different levels at which social characteristics (variables) area measured and how resulting data are distributed
• Become aware of the range of existing qualitative data and basic approaches to their analysis
• Be in a position to consider conducting secondary data analysis for their third year UG dissertations (after taking Modelling Criminological data in their 2nd term).
3.1.3Example course unit 3: The survey method in social research
This is a second year (Level 2) mandatory (for single honours Sociology students) unit which can be taken as an elective by other Sociology students taking joint degrees. The lecturer who has been teaching this for fifteen years has won teaching awards and recognition. The course unit attracts students who are interested in learning how to do data analysis.
Students are taught through a mix of full-class teaching and small-group lab-classes, and the software used is SPSS. As a consequence of having to move to online teaching during the COVID-19 pandemic, the lecturer their flipped his teaching and is unlikely to revert to how they previously taught it. This course unit provides an excellent example of how teaching through remote desktop login to a PC in a campus lab has been embraced by the students on the course, particularly if they can’t download SPSS to their personal devices. The assessed reports they produce enable them to critically evaluate secondary data sources and methods for analysing them. The course unit sets them up for considering undertaking a third-year dissertation using secondary data analysis. Focusing on survey data, the course unit takes them through – with a strong emphasis on practical application – descriptive statistics to statistical significance and questions of causality. Students build up to producing and interpreting chi-square tests and adding a third control variable. The data used in the course is drawn from nationally representative government surveys, such as the British Social Attitudes Survey.
A full description of the course unit is available online.88 We summarise here the core material relevant to this paper:
Description of the course unit:
The “Survey method in social research” course unit provides an introduction to the theory and practice of quantitative survey research. It is taught in 3 parts. In part one (weeks 1–3) the characteristics of social surveys and their importance as a source of evidence about society for academic research and policy debate are considered. In part 2 (weeks 3–6) the way survey data can be analysed are explored. For this a range of real survey data are used and a basic training in the data analysis software SPSS is provided. In part 3 (weeks 7–10) different ways of using surveys in research with a particular focus on final year dissertations are considered. The pros and cons and steps involved in conducting your own survey versus use of existing survey datasets (secondary data analysis) are explored.
Learning outcomes:
On completion of this unit students will be able to:
• Understand the ways social surveys can be used to better understand the social world in a range of research and policy settings;
• Understand the characteristics of a social survey dataset and the process by which survey data is derived;
• Understand and be able to apply a range of techniques for the analysis of survey data using specialist data analysis software (SPSS);
• Accurately and critically interpret the output from secondary data analysis and use it to write a research report;
• Identify and evaluate a range of secondary sources of survey data;
• Be able to design a survey with consideration of questionnaire, sampling and fieldwork;
• Evaluate the relative strengths and weaknesses of survey methods in social research;
• Write a dissertation research proposal based on the survey method.
Course schedule (weekly briefing session (whole class), practical clinics (small groups))
Part 1 Introduction: About Social Surveys
1. Why a course about surveys?
2. About Survey data
3. Surveys in research
Part 2 How to analyse survey data
4. How to analyse survey data 1
5. How to analyse survey data 2
6. How to analyse survey data 3
7. Part 2 review
Part 3 Using Surveys in your own research
8. A dissertation using survey data?
9. Secondary analysis of an existing survey …
10. … or doing your own survey=
11. Part 3 review
Mode of assessment
• Essay 2,000 words 50%
• Essay 2,000 words 50%
Examples of topics explored in student assignments
Research questions which previous students have examined include:
• The impact of media consumption on public attitudes towards unemployment benefit recipients
• The effect of educational level on attitudes to the Brexit referendum
• How employment status and gender affect reported stress levels
3.2Summary of teaching approach to quant skills
These examples provide information to not only show the teaching approach we adopt, but also provide information about the skills and statistical techniques we teach, the different types of data sources students are introduced to, and the modes of delivery and types of assessments we employ.
There is much commonality between these three course units. For example, they all build students’ confidence up gradually, taking them from exploratory and descriptive statistics through to the building blocks for inferential statistics. They all use real world data (from sources relevant to the subjects being taught). They are all ‘topic driven’, in other words they aim to answer research questions of substantive interest to the students studying on a particular degree course (in these three examples, politics and international relations, criminology and sociology). That said there is also variation in the software taught (Excel, SPSS and R are mentioned for quantitative analysis with NVivo for qualitative analysis). Different students will therefore be equipped to different degrees with these skills and software tools by the time they apply for a data fellow position.
The modes of teaching also cover the lecture format (this is becoming a point of discussion where much of our teaching has moved online due to the COVID-19 pandemic), as well as lab classes and tutorials. We are increasingly using the term ‘whole class teaching’ to reflect that what we have previously called lectures are the sessions where we expect the whole class to be present. However, unlike the days when these classes were delivered in a lecture theatre, with data analysis training we are beginning to deliver these sessions after the practical lab classes, which are often online and asynchronous. There is a whole other paper to be written to explore post-pandemic teaching models for data analysis, but our experiences have not only forced us to pivot to online (and hybrid) teaching but consider this as an opportunity for continuing in this manner.
Data sources as we have shown reflect the subject nature of the course unit. Note that in almost all cases the data are taken from nationally representative surveys or studies. It is not stated in the course unit summaries given, but the datasets used in teaching are likely to have been pre-prepared either by the lecturer or the service from which they were downloaded. For example, the UK Data Service99 provides teaching datasets which are subsets of surveys. No third-year courses were included in the three examples, but at that stage students would be expected to move into studying inferential statistics and are more likely to be asked to create the subset of the sample to be used for their analysis. In the first two years we do not do much data cleaning – in large part due to the very restricted time we have with undergraduates to cover the statistical methods in lab classes – as outlined here.
It should be noted that the examples included in this paper are from course units taught in the first two years of the degree course. The students are introduced to many different types of data. Whilst it is the case that some nationally representative surveys (such as the British Social Attitudes Survey) and some locally collected data (e.g. from Greater Manchester Police Force) are used in teaching, and in some cases social media data are scraped from the web and analysed. We note here that the emphasis in the first two years is not on Official Statistics, but rather on developing awareness of relevant data (and skills) for the degree subject. For example, the first-year politics course included above includes a practical session where students are introduced to a wide range of data sources, including official statistics. Students in this session are given an inventory of data sources including links to websites for: the Office for National Statistics (ONS); the Scottish Government Statistics; Northern Ireland Statistics and Research Agency (NISRA); Open Data; and the Electoral Commission and others. Students, as part of this session, select a website and develop a research question reflecting the data that could be obtained and downloaded to answer it. The Criminology course included in this paper uses a sample from the Crime Survey for England and Wales (CSEW) which meets Official Statistics requirements1010 (but as presented above it also uses other data too). And a third-year demography course introduces students to different sources of official statistics including registration data and population estimates from which students produce fertility measures, for instance. Our purpose in this paper was to illustrate the types of data literacy skills social science students are taught, within the context of their substantive subject, to enable them to understand these sufficiently to apply these in the workplace (see Section 3) with a range of different data sources (including official statistics) and to scaffold their learning in their final year of their degree.
A final note on data sources is worth emphasising to acknowledge that these students are studying (and will graduate with a degree in) social science, not statistics. By embedding the statistical and data skills training in the course units we find that students are motivated to learn, seeing the techniques and tools as a necessary building block to enable them to do this. Gunn has critically evaluated this as a successful strategy for methods teaching in the social sciences [20] and other social science educators, such as Scott Jones and Goldring, have developed and evaluated their own teaching methods [21].
The purpose of this section was primarily to uncover the sort of teaching we undertake in the first two years of our degree courses, to prepare students to think about applying to undertake a data fellowship. We have not included more advanced statistical training here, though they have the opportunity to pursue this in their third year, and it is important to point out that students are able to take more theoretical statistical courses as they progress through their degree, and select quantitative methods pathways should they choose to focus on this. Our aim remains always to demonstrate the practical application of the techniques to real world complex social research.
The next section moves on to explore how the learning from these teaching units has direct relevance to the workplace. Chapters 3 and 4 in Carter [14] addresses how a student from a social science degree can prepare for and be successful in an interview to gain an applied work placement experience.
4.Data fellows in the workplace
Following the previous section exploring what and how students are taught data analysis in the social science classroom, in the first two years of their degree, we move on to focus more closely on the data fellows programme which is open to them to apply to. Here we show the breadth of organisations that value these skills sufficiently to provide these data fellow opportunities, indicating the industry demand for quantitatively trained social scientists. We provide evidence of how students have enhanced their data and analytical skills in the professional workplace by showing several examples of students’ outputs, produced whilst on placement. And finally, a case study is provided to showcase a former data fellow’s career trajectory, to illustrate what is possible when social science students are taught statistics and can put their learning into practice through a data internship.
4.1Which organisations in which sectors host data fellows?
Since beginning the initiative, we have hosted almost 240 students in around fifty organisations. Note that the programme did not run in 2020 due to the COVID-19 pandemic. Table 1 categorises these hosts into six groups: polling/data companies; media organisations; Universities; Local government; National government; and not-for-profit organisations. The majority of host organisations we find projects with are public sector or not-for-profits with far fewer in the private sector. In part this reflects the networks and connections we have as a social science team. It also reflects the type of organisations that attribute value to what we teach our students, and indeed who employ quantitatively trained social science graduates. We have designed and developed the programme in response to the demand from applied social research and data analytics organisations.
Table 1
Data fellows projects: by host organisation type and year
| Year | |||||||
|---|---|---|---|---|---|---|---|
| Organisation type | 2014 | 2015 | 2016 | 2017 | 2018 | 2019 | Total |
| Polling/data | 8 | 11 | 6 | 8 | 10 | 5 | 48 |
| Media organisations | 0 | 3 | 2 | 3 | 3 | 3 | 14 |
| Universities | 7 | 6 | 10 | 8 | 4 | 4 | 39 |
| Local government | 2 | 5 | 4 | 1 | 1 | 2 | 15 |
| National government | 0 | 10 | 11 | 11 | 10 | 9 | 51 |
| Not-for-profits | 2 | 10 | 13 | 9 | 9 | 10 | 53 |
| Total | 19 | 45 | 46 | 40 | 37 | 33 | 220 |
The types of projects students undertake varies widely, but it is imperative that the host organization can offer a data-driven research project of up to 8 weeks duration. Projects are often defined at the start (when students are applying) and then change as the student progresses, but it is important that there is sufficient scoping and bounding of the project to enable us to advertise it to eligible students so that they can apply. An example of how the projects are advertised to students can be found on the website.1111
Figure 1.
Data fellows projects: by host organisation type and year.
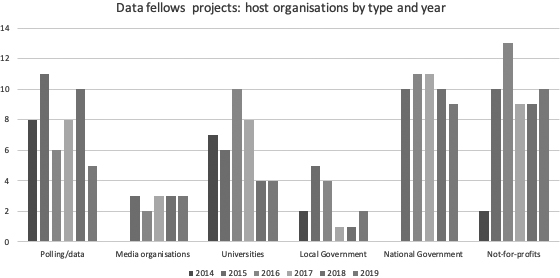
Table 1 and Fig. 1 show the number of student projects between 2014 and 2019 by host organisation type (as described above). Note the numbers do not correspond exactly to the numbers of students placed as some organisations deployed more than one student on a project.
Table 1 and Fig. 1 show that the types of organisations that have engaged most with the data fellows programme over the period reported are national government departments, not-for-profit organisations and polling and data companies who have collectively provided around 70% of the projects. Universities have hosted a healthy 18% of the projects (which cover both academic research and professional services activity), with the remaining ones being in media organisations and local government. These last two categories are interesting as data journalism is still maturing (the media companies have small teams who work with data) and local government departments have suffered from disinvestment in analytical teams and their capacity to host a student is limited, at least compared to their national government peers who work in much larger analytical teams.
These summary data are valuable in providing information regarding the types of organisations that offer projects to students to enable them to undertake short term data-driven applied social research in the workplace. Whilst we do not routinely collect information from the hosts to elicit their feedback, we do know – as they return year upon year to engage with the data fellows programme – that they cherish the opportunity to host a student. The main benefits to the organisations of providing these opportunities are covered in Carter [14, pp. 39–40].
1. Create and support talent pipelines – find bright minds
2. Support junior staff to develop their supervisory skills
3. Help to understand the research methods and software tools training that undergraduate and postgraduate students are learning
4. Help to connect with universities, especially around a corporate social responsibility (CSR) agenda
5. Help to fill skills gaps
6. Help to bring dedicated resources to business or academic research projects.
It is important to note here that the data fellows work is not formally assessed, and the experience does not contribute to a student’s final grade. Nonetheless, year after year students comment that the internship was one of the most beneficial parts of their degree experience. For further evidence to capture the benefits to data fellows we developed short films, which are available on the Q-Step website, reflecting students’ experiences.1212 These short videos prove popular for students who contemplate applying for a placement, as well as at University open days to attract students to apply to our courses. We do however insist upon ongoing self-reflection to help the data fellows process their learning. The self-reflection framework used is covered in detail in Carter (14, Chapter 6). We also require all data fellows to produce a poster when they return to university in their final year. These are all displayed the Q-Step website under the ‘Student Stories’ section (link provided above) and is the best way to showcase the vast range of projects and data analysis that the data fellows undertake. The poster provides input into a student half-day conference which serves as a celebration event which we run in the autumn after they complete their work placement experience. Each event has a prize-giving element in which we award an audience-choice and a judges’ panel prize to the best poster and the best three-minute presentation (for those students who select to enter this part of the conference). We list here the titles of the celebration events in recent years.
2016 – Is Data Literacy the New Black? 2017 – Go Figure 2018 – The 39 Q-Steps 2019 – Social Science by Numbers
The next sub-section provides examples of some of the outputs that organisations benefit from through students undertaking these data fellowship opportunities.
4.2Student outputs created through the data fellows programme
Students can produce a lot in just eight weeks. The four examples included here are indicative of what the data fellows have produced over the period since the programme started. They are included to show what these social science undergraduates have the capacity to offer host organisations, in supporting them to deliver on their quantitative research activities. We find out about these outputs not because we ask students, but because their reflective pieces, which they submit three times whilst on placement, alert us to the work they are undertaking and the outputs they are creating. Through establishing a closed social-media networking group whilst the students are on placement, we manage to maintain contact with the majority of former data fellows once they graduate; this can prove beneficial in tracking the career trajectories of students.
1. Policy reports
The think-tank IPPR North which hosts data fellows has acknowledged their research by naming them as contributors to their flagship report ‘State of the North’ which is published annually.1313 One of their former interns (a Politics, Philosophy and Economics graduate) now works there. He provides a case study for [14] and whilst there uncovered a ‘killer statistic’ which became known as ‘the early years’ gap’, which revealed that just 47% of the poorest children in the north of England achieve a good level of development in their early years compared to 59% in the south. An article and short film are available with more information about this student’s contribution whilst on placement.1414
2. Blog posts
Blog posts are often popular with organisations to help students share their learning, and for the organization to provide a platform for dissemination of the work covered. An example1515 where the data fellow (studying for a sociology and quantitative methods degree) talks about her work on the development of the updated Carstairs Index of Deprivation based on the (then) latest available census data, provides an example of where a student intern used official statistics. She went on to develop this methodology further in her return to her final year, using it to form the basis of her third-year dissertation topic, and continued to pursue this in her Master’s thesis. This former intern secured a graduate position at the Office for National Statistics.
3. Databases and datasets
The development of datasets (often linked from multiple sources) is an increasingly popular way to help students develop their data skills through the work placement. Many students, having been given well-behaved data as part of their university course, are surprised that they might spend half of their time on their placement doing this. A good example of this is another case study taken from Carter [14] where the General Medical Council as host supported an intern (a Politics, Philosophy and Economics undergraduate) to create a linked dataset which they continue to this day to use.
4. Conference presentations and academic papers
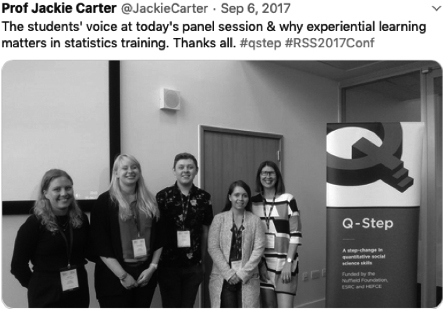
Not many students are fortunate enough to be able to develop material for a conference, although many have had the opportunity to attend a conference whilst on placement. One student (a Politics and International Relations undergraduate) who undertook her data fellowship with an international organisation in 2017 accompanied the author of this paper to a conference (the Royal Statistical Society) in 2018 to present her work. Moreover, her 2017 project formed the basis for a 2018 project with the same host organisation, which also resulted in a project to explore taking the data fellows model to Latin America to support the skills capacity development to deliver on the SDGs. Another student (studying sociology) – who features as a case study in Carter et al. [4] was placed in a university research institute. She was named as co-author on a paper that was published eighteen months after she undertook the work placement. Figure 2 shows a tweeted photo taken in 2017 where four Q-Step students from four different Q-Step Centres came together to present a panel session entitled ‘Getting down and dirty with data: how Q-Step Centres are training students in the workplace.’
Figure 2.
Photo tweeted by Jackie Carter taken at the Royal Statistical Society annual conference, 2017. Shared with permission of everyone pictured.
In summing up this sub-section it is important to note that most of these outputs are incidental rather than designed in at the outset of the placement. Nevertheless, these four examples indicate the potential for the data fellows programme to build on the students’ taught skills (as covered in Section 3) by providing opportunities to engage in applied social research at the level and standard expected by the host organisation. In other words, the students start their placements as novice social researchers, but in many cases transform into early career applied social researchers. The skills and methods we teach them position them well to make this transition, and they return to their final year supremely well-equipped, and highly motivated, to undertake quantitative social research projects, having gained an insight into professional roles and careers that they could undertake.
4.3A case study of a former data fellow’s career trajectory
To bring this section together, we now report what is possible upon graduating with a social science degree that teaches quantitative research methods and provides experiential learning opportunities through a data fellows work placement. The case study that follows, we call them Sam (not their real name), is not intended to reflect a typical experience and certainly is not suggested as a representative example of the graduates of the programme. The intention rather is to illustrate that social science graduates, with the types of teaching we have developed, coupled with acquisition of real world data skills gained through the workplace, have the potential to enter careers in which these skills are sought after.
4.3.1Case study: Sam – sociology graduate
Sam is Sociology graduate who was successful in securing a data fellowship opportunity with a data consultancy organisation that was able to provide a variety of research projects that helped in the development of Sam’s statistical and data analysis skills. As a result of the work placement Sam was employed part-time by the internship organisation, and undertook research with them (whilst completing the final degree year). The skills learned in the classroom, and then enhanced in the workplace through both the data fellowship and the part-time position, positioned Sam upon graduating to secure a data analyst position with an online retailer.
Combining my understanding of social science and quantitative skills was something I wanted to do in my career. That intersection was the right place for me. An online retailer took a chance on me, took me on as a data analyst in the customer insights division – recognised that I had done quite a lot of quantitative research in my internship. This really helped me grow and develop my interests and become a bit more technical.
Whilst employed in this first role, Sam also studied for a Master’s in Social Research Methods and Statistics, which ‘was definitely just a direct consequence of having done that internship’. On completing their Master’s degree, Sam reported that they were contacted by organisations offering data analytics roles.
The year’s work experience I had (my internship and part-time work for them afterwards) on my CV was such a good signal to potential employers because I already had experience. You can absolutely evidence the skills you have developed … so when asked competency-based interview questions – sometimes it’s quite tricky to use your University studies, whereas I had real hands-on experience of working with quantitative research.
Sam’s next role (just a couple of years after graduating), as a data analyst in a large online technology company, enabled them to take the opportunity to expand their skillset and change focus. Commenting that most analytics positions in the region focused on digital analytics (Google analytics for example), Sam instead used their background in social science, and interest and experience in statistical analysis, to lead on ‘customer centricity’.
That was the shining light for the recruitment manager, … she was really, really interested in what I could bring to the role and how we could get some deeper insights, using the statistical techniques I’d learned. And whilst I was there, I had a shift in my focus, going from the most at-sea person – the social scientist – to being one of the technical leaders. I found myself excelling and my trajectory was rapid. I ended up being promoted to team lead.
Sam stayed at this company for a few years and then decided they needed a new challenge. They moved into a data science role in a large technology communications company which helped them focus on learning and using machine learning. Whilst in this role Sam was headhunted for a position at a global online tech company and although the bar was set very high for the position, Sam passed each of the interview stages and was recruited to a role as data scientist.
Asked to reflect on the blend of social science (as a degree subject) and statistical and data analysis techniques (as a skillet) in assisting them to progress rapidly through their early career, Sam commented as follows.
Whilst a lot of businesses do data analytics with a transactional or financial focus, you know – just looking at the raw numbers – there’s not so much of a focus on how the customer behaves or feels. And that’s something that the social science side really helped with because we’re trained in social research methods – like what are people’s attitudes, and how to measure people’s behaviour – how do we look at the big picture, the context? No one was really thinking through that relationship, which I think people – especially from a social science background like sociology – are well-equipped to think about. So I brought that strength. And from statistics I brought knowledge of things like regression analysis and dimensional reduction, so you know, how do we find the underlying factors in people’s behaviours – things like that, plus the technical skills that came from knowing these statistical techniques helped me pick up predictive analytics really quickly. In my current job I’m now back to applying sampling theory – so sort of back to my roots.
Sam concluded by speaking about the importance of having hybrid teams or bringing social scientists into data analytics and data science teams to strengthen them. The final remarks: ‘it’s so important and beneficial, and it’s such a natural way to get more diversity into teams, and this leads to great achievements.’
Our summing up of this section is short, but we believe that the rigorous statistical training undergraduate social scientists are given in their degree courses, coupled with the experiential learning opportunities afforded through the data fellows programme, demonstrates that like Sam there are exciting careers pathways and opportunities available to them. Our intention in this section has been to show how interns can evidence their applied workplace learning to open doors to data-driven careers, not only through the outputs they produce whilst on placement, but through reflecting on the skills and experiences they acquire, and ensuring they capitalise on these in applying for future roles.
5.Discussion and next steps
The paper presents a model for training undergraduate social science students in data and statistical skills – or quant skills – based on an approach taken at the University of Manchester, UK. The combined strengths of the focus on teaching statistics in a way that embeds the research methods into the subject curriculum, together with work placement experiences provided through the data fellowship programme we have developed, is hitting a sweet spot for those who embrace these opportunities. The case study included, whilst only one example, shows the art of the possible.
Whilst we have not covered third-year courses in this paper, we do observe that the experiential learning gained through being a data fellow in a professional environment, builds confidence in our student body. On completion of a research placement, when students return to university for their final year of undergraduate study some are motivated to build on their learning by undertaking a secondary data analysis research dissertation, and some focus on quantitative research methods in their final two semesters (social network analysis and demography are popular choices). Like Sam in the case study presented here we have also seen students have their heads turned towards undertaking a Master’s degree in social research methods and statistics, and in some cases they progress to do a PhD. The interventions delivered through our Q-Step Centre, in years 1 and 2 of the undergraduate degree, have assisted in supporting a skills training pipeline into postgraduate quantitative methods training too.
We do not suggest this is the only approach that will produce quantitatively trained social science graduates who can move into social research careers. We do however contend, on the basis of the evidence presented in this paper and drawing on the case studies in Carter [14], that this combination – practical teaching of data analysis in undergraduate courses coupled with data fellowships – produces a cohort of highly employable social science graduates for 21st century applied social research careers. We would further argue that these graduates can develop into ‘hybrid data professionals’ – that is to say they can bring their social science training into teams, develop higher level quantitative skills themselves but also bring subject expertise into the organisation. The case study included exemplified this. The data science community are starting to recognise that subject matter expertise is an important consideration in order to develop solutions that understand the context of the problem (see for example [22]) and initiatives like Data Science for Social Good,1616 DataPop Alliance1717 and the Data Science doctoral Fellowships in UK Government1818 are increasingly acknowledging the importance of subject expertise developed in the social sciences that accompanies data science skills. We would like to see this subject expertise being reflected in all data driven project teams.
We expanded upon the data fellows programme developed at the University of Manchester and using data spanning six years provided evidence to show which types of organisations create a demand for our undergraduate interns. As we draw to the end of the Q-Step funding (the grant ran 2013–2021 and was supplemented by University of Manchester internal funds) the question that we must face is ‘who pays?’. To date the host organisations have enjoyed a no-cost-to-them resource (granted there is an overhead to them in supervising students, but this is offset by the benefits to them of having an extra pair of hands). A challenge that this poses to those who run internship programmes, and to us specifically for the data fellows programme, is how to quantify the benefits and present this to organisations to convince them to co-fund these opportunities. We are currently exploring this with business organisations who are used to working in this way; the benefits of hosting an intern are not straightforward to measure and present ongoing challenges, although we continue to explore the notion of the talent pipeline to support us with evidencing the value of these opportunities to our host organisations.
Our efforts to track students and follow their careers is the start of what could become a longitudinal study – but this would require investment. An obvious direction to take this in would be to explore the extent to which the data fellows programme helps to provide equity of access to the workplace, to create a more diverse talent pipeline. 70% of interns to date have been female with 25% from disadvantaged backgrounds or under-represented groups. How might we scale this effect up, and ensure that the intervention programme we have developed – to create a talent pipeline into data careers – can also help support equality and diversity? We seek support from other organisations who are in this space to work with us to help achieve this.
The paper has illustrated a demand for, and a supply of, data and statistical skills developed in the social sciences. The experiential data fellows programme is receiving attention both within the UK and internationally. The author has been named a ‘One in Twenty Women in Data’ (2021) and her work has been recognised through a National Teaching Fellowship prize. At the time of writing we are entering our busiest year yet for the data fellows programme – with 62 students undertaking data-driven projects in summer 2021. Many organisations have been so impressed with the calibre and skills of the students they have interviewed that they have asked for more than one. Some have even offered to contribute funding to support a second (or third) data fellow. In part this is due to us emerging from the pandemic, as organisations have pivoted to working remotely and consequently the majority of this year’s projects will be carried out online.
The case for expanding the data fellows programme has, we believe, been made. The challenge remains in how to both sustain it and scale it up. As an innovative and successful development in teaching statistics to non-STEM students there is much to be gained in achieving both.
Notes
10 A full list of Official Statistics for the UK can be found at https:// osr.statisticsauthority.gov.uk/national-statistics/.
13 https://www.ippr.org/research/publications/the-state-of-the-north-2015, https://www.ippr.org/research/publications/the-state-of-the-north-2016, https://www.ippr.org/research/publications/state-of-the-north-2017, https://www.ippr.org/research/publications/state-of-the-north-2018, https://www.ippr.org/research/publications/state-of-the-north-2019.
Acknowledgments
The author would like to thank the funders of the Q-Step programme (The Nuffield Foundation and the Economic and Social Research Council, and formerly the Higher Education Funding Council for England) and the University of Manchester who collectively enabled the Q-Step Centre data fellows programme to develop and grow. I would also like to thank all the organisations who have hosted our interns over the years since the programme began in 2014, as well as the students who have participated so eagerly and professionally. Finally I would like to especially thank the former interns who feature in this paper through the inclusion of their project outputs and the case study.
References
[1] | Nuffield Foundations Economic and Social Research Council [ESRC], Higher Education Funding Council for England (HEFCE). Aims and activities of the Q-Step centres [Internet]. (2014) [cited 25 May 2021]. Available from: https://www.nuffieldfoundation.org/sites/default/files/files/Aims%20and%20Activities%20of%20the%20Q-Step%20Centres(1).pdf. |
[2] | Rt Hon David Willetts MP, Minister for Universities and Science, addresses Q-Step Conference. The Importance of Quantitative Skills for Social Science [Internet]. (2013) [cited 25 May 2021]. Available from https://www.youtube.com/watch?v=3J0VN3b2LTA. |
[3] | Grundy S. The Past, Present and Future of Q-Step – A Programme Creating a Step-Change in Quantitative Social Science Skills. Numeracy 13, Iss. 1 2020 Article 2. doi: 10.5038/1936-4660.13.1.2. |
[4] | Carter J, Brown M, Simpson K. From the classroom to the workplace: how social science students are learning to do data analysis for real. Stat Educ Res J [Internet]. (2017) [cited 25 May 2021]; 16: (1): 80–101. Available from: https://iase-web.org/documents/SERJ/SERJ16(1)_Carter.pdf. |
[5] | Buckley J, Brown M, Thomson S, Olsen W, Carter J. Embedding quantitative skills into the social science curriculum: case studies from manchester. Int J Soc Res Methods [Internet]. (2015) [cited 25 May 2021]; 18: (5): 495-51. Available from: doi: 10.1080/13645579.2015.1062624. |
[6] | Carter J, Brown M. Innovations in Statistical Training: Reflections from the UK Q-Step Initiative. ICOTS Contributed Paper. (2018) [cited 25 May 2021]. Available from: http://iase-web.org/icots/10/proceedings/pdfs/ICOTS10_C121.pdf?1531364318. |
[7] | Nind M, Kilburn D, Luff R. The teaching and learning of social research methods: developments in pedagogical knowledge (editorial). Int J of Soc Res Methodology: Theory and Practice. (2015) ; 18: (5): 455–461. doi: 10.1080/13645579.2015.1062631. |
[8] | Clark T, Foster L. ‘I’m not a natural mathematician’: Inquiry-based learning, constructive alignment and introductory quantitative social science. Teaching Public Administration. (2017) . doi: 10.1177/0144739417711219. |
[9] | Lewthwaite S, Nind M. Teaching Research Methods in the Social Sciences: Expert Perspectives on Pedagogy and Practice BJ Ed Studies. (2016) ; 64: (4): 413–430. |
[10] | Carver R, Everson M, Gabrosek J, Horton N, Lock R, Mocko M, Wood B. Guidelines for assessment and instruction in statistics education (GAISE) college report 2016 Alexandria, VA: American Statistical Association. [Online: https://www.amstat.org/asa/files/pdfs/GAISE/GaiseCollege_Full.pdf]. |
[11] | Harris M, Chisolm C. Beyond the Workplace: Learning in the LIfeplace The SAGE Handbook of Workplace Learning. 2013 London, Sage. |
[12] | Warhurst C, Mayhew K, Finegold D, Buchanan J. The Oxford Handbook of Skills and Training (eds). (2017) . |
[13] | Koparan T, Guven B. The effect of project based learning on the statistical literacy levels of student 8th grade. European Journal of Educational Research. (2014) ; 3: (3): 145–157. doi: 10.12973/eu-jer.3.3.145. |
[14] | Carter J. Work Placements, Internships and Applied Social Research. 1 |
[15] | Carter J, Mendez-Romero R, Jones P, Higgins V, Samartini A. EmpoderaData: Sharing a Successful Work-Placement Data Skills Training Model Within Latin America, to Develop Capacity to Deliver the SDGs 2021 In press. |
[16] | United Kingdom Government Department for Digital, Culture, Media and Sport Policy Paper: National Data Strategy [Internet] gov.uk (2020) [cited 25 May 2021]. Available from: https://www.gov.uk/government/publications/uk-national-data-strategy/national-data-strategy. |
[17] | Eraut M. How researching learning at work can lead to tools for enhancing learning. In Malloch M, Cairns L, Evans K, O’Connor BN. (eds). The SAGE Handbook of Workplace Learning London: Sage. (2011) . pp. 181–97. |
[18] | ESRC Economic and Social Research Council Scoping the Skills Needs of Social Sciences to Support Data Driven Research 2021 [Internet] [cited 25 May 2021]. Available from: https://esrc.ukri.org/skills-and-careers/scoping-the-skills-needs-of-social-sciences-to-support-data-driven-research/. |
[19] | Data Science Campus Growing Public Sector Data Science Capability 2020 [Internet] [cited 25 May 2021]. Available from https://www.ukauthority.com/media/9894/tomsmith.pdf. |
[20] | Gunn A. Critical Debates in Teaching Research Methods on the Social Sciences Teaching Public Administration 2017 [Internet] [cited 25 May 2021] Available from: doi: 10.1177/0144739417708837. |
[21] | Scott Jones J, Goldring J. Telling Stories, Landing Planes and Getting Them Moving – A Holistic Approach to Developing Student’s Statistical Literacy Stat Educ Res J 2017 [Internet] [cited 25 May 2021]; 16: (1): 102–119. Available from: https://iase-web.org/documents/SERJ/SERJ16(1)_Jones.pdf. |
[22] | Yablon D, Chakrobroty I. Machine learning 3: the importance of subject matter expertise. Wiley Analytical Science Magazine. (2020) [cited 25 May 2021]; 16: (1): 102–119. Available from: https://analyticalscience.wiley.com/do/10.1002/micro.3507. |


