
A proposal to enhance national capability to manage epidemics: The critical importance of expert statistical input including official statistics
Abstract
Given the high level of global mobility, pandemics are likely to be more frequent, and with potentially devastating consequences for our way of life. With COVID-19, Australia is in relatively better shape than most other countries and is generally regarded as having managed the pandemic well. That said, we believe there is a critical need to start the process of learning from this pandemic to improve the quantitative information and related advice provided to policy makers. A dispassionate assessment of Australia’s health and economic response to the COVID-19 pandemic reveals some important inadequacies in the data, statistical analysis and interpretation used to guide Australia’s preparations and actions. For example, one key shortcoming has been the lack of data to obtain an early understanding of the extent of asymptomatic and mildly symptomatic cases or the differences across age groups, occupations or ethnic groups.
Minimising the combined health, social and economic impacts of a novel virus depends critically on ongoing acquisition, integration, analysis, interpretation and presentation of a variety of data streams to inform the development, execution and monitoring of appropriate strategies. The article captures the essential quantitative components of such an approach for each of the four basic phases, from initial detection to post-pandemic. It also outlines the critical steps in each stage to enable policy makers to deal more efficiently and effectively with future such events, thus enhancing both the social and the economic welfare of its people. Although written in an Australian context, we believe most elements would apply to other countries as well.
1.Introduction
Given the high level of global mobility, pandemics are likely to be more frequent, and with potentially devastating consequences as has been demonstrated by COVID-19. This article describes what needs to be done to develop the statistical information needed to manage pandemics effectively. Whilst it is based on our experience in Australia, we believe our proposal applies more generally.
Whilst parts of Australia experienced a second wave of COVID-19, the country is in relatively better shape than most others and, at the time of writing this article, is virtually virus free. That said, we believe there is a critical need for improvements in the strategic statistical oversight of the whole process of anticipating, managing and analysing pandemics, using the experience of the COVID-19 to improve the quantitative information and advice available to policy makers. The proposal in the article outlines the quantitative aspects of a plan to enable policy makers to deal more efficiently and effectively with future such events, thus enhancing both the social and the economic welfare of its people.
Whilst the standard epidemiological data was available for the COVID-19 pandemic, and appeared to be of good quality, a dispassionate assessment of Australia’s health and economic response to the pandemic revealed some important inadequacies in available data, and the statistical analysis and interpretation used to guide Australia’s preparations and actions. For example, one key shortcoming was the lack of data to obtain an early understanding of the extent of asymptomatic and mildly symptomatic cases and the differences in reproduction characteristics across age groups, occupations or ethnic groups. In our view, this has meant that that Australian Governments were impaired in their ability to carry out their responsibilities.
We believe that managing the health, social and economic impacts of a novel virus concurrently requires a risk management (as distinct from risk avoidance) approach. This cannot be done without understanding the risks in quantitative terms and this depends critically on the ongoing acquisition, integration, analysis, interpretation and presentation of a variety of data streams to inform the development, execution and monitoring of appropriate strategies. Figure 2 (later in the article) captures the essential components grouped into four basic phases (Initial Detection; Prediction and Accumulation of Knowledge; Monitoring; and Post-pandemic Analysis), and the critical steps in each phase to plan for and acquire the diverse data needed. It is referred to as a Pandemic Information Plan (PIP) in this article. A broad range of statistical skills, knowledge and know-how is needed to support most aspects of the PIP. Official statistics have an important role to play and, given the audience for this Journal, these are discussed separately.
Furthermore, it is our strong recommendation that a multi-disciplinary Task Force be established to develop the PIP in more detail in anticipation of the event of a pandemic. As well as those involved from the policy side, the membership should include a statistician with expertise in statistical modelling and analysis, an official statistician, an epidemiologist, a medical researcher, an economist, a social psychologist and a public health official.
This article is organised as follows. Section 2 discusses what we have learnt from the COVID-19 experience in Australia. Each country has tackled COVID-19 differently but we believe the lessons learnt in Australia apply more generally. Section 3 presents an epidemiological model used to support the discussion in the article. The Section could be easily adapted to other epidemiological models. Section 4 discusses the importance of understanding heterogeneity and dispersion for managing the virus. In our view, this is not being given sufficient attention. Section 5 discusses the proposal to develop a PIP in more detail and presents the key elements of a PIP. Section 6 considers the return to normalcy as the pandemic abates. Section 7 provides a discussion on the role of official statistics; then we make some concluding remarks.
2.Learning from the COVID-19 experience
Despite the criticisms below, the following important steps were taken to inform the government’s management of COVID-19 and also to keep the public abreast of the progress of the virus.
1. The testing program was scaled up quickly. Although implementation was the responsibility of State Governments, national standards were adopted and, as a result, there was consistent data available on the number of tests and the number of persons who tested positive to COVID-19. Core demographic data (e.g. age, sex, geographic location) was available for positive cases.
2. Reliable data was recorded of the number of persons requiring hospitalisation with a separate count of those requiring intensive care.
3. The number of deaths due to COVID-19 was generally available within 24 hours together with information about whether the person had other significant morbid conditions.
4. Arrangements were made quickly to enable model-based estimates of important parameters such as the reproduction number to help understand the likely progress of the virus and the net impact of interventions to reduce the spread. Statisticians were not involved in this work so, in our view, there were some weaknesses in the modelling.
5. The Australian Bureau of Statistics (ABS) implemented a number of initiatives in very quick time (see www.abs.gov.au/covid-19).
(a) Monthly surveys of the impacts of COVID-19 on household and businesses started in March 2020. There was flexibility in the data content of the surveys.
(b) There was early release of a number of statistics important to understanding the impact of the pandemic e.g. jobs and wages, international trade, mortality.
(c) There were a number of special articles written to inform users of the impact of COVID-19 on some important statistics e.g. the impact of population estimates as a result of significantly reduced migration, the impact on macroeconomic statistics of a number of special government programs that were introduced to mitigate the economic impacts of the virus.
(d) Data collection methods for their ongoing collections were adapted. The biggest impact was on the Monthly Labour Force Survey where face-to-face interviews were no longer possible and telephone interviews and on-line questionnaires were used. The impacts on data quality were also described.
What could be improved?
1. Early estimates of the extent of the pandemic and its impacts were far too high, resulting in much more expenditure on the health system than was required, as well as cancellations of surgeries. Early estimates were necessarily based on estimates of the reproduction number (largely derived from Wuhan data) but the reduction over time in the reproduction number11 used in these estimates did not take sufficient account of the combined impact of quarantine, social distancing and hygiene messages, and other restrictions, resulting in a significant over-estimate of the infection rate. Sensitivity analysis is one means of understanding the uncertainty around these estimates. It was used to a limited extent but did not seem to take sufficient account of knowledge from previous epidemics, where over-estimated projections also resulted in significant resource wastage [11]. Work was commissioned to develop early estimates of the reproduction number but these were based on identified positive cases only, a data source with some weaknesses, especially given the variability in testing volumes.
2. The initial assumptions on asymptomatic cases, proportion of symptomatic cases being tested, etc. proved to be wrong. For example, the initial assumption that there were no asymptomatic cases that were not pre-symptomatic was badly wrong as shown by many international and Australian studies (e.g. [6] and references therein). As an example, an Australian anti-body study22 based on elective surgery patients estimated that 85–90% of patients who had anti-bodies had not been tested, indicating that a high proportion of them had either been asymptomatic or symptomatic (presumably with relative mild symptoms) and not tested. The results are broadly consistent with the finding in a large UK survey run by the Office of National Statistics that 29% of identified positive cases showed no symptoms at the time of the survey. (Subsequent surveys have shown similar results.) Initially, there was no alternative to using assumptions based on international knowledge about the virus; however, our proposals to collect useful Australian specific-data through ongoing random surveys were ignored or rejected although the ABS was prepared to assist with these surveys. Subsequent experience further convinces us that such random surveys play a vital role in the information acquisition process, including during the vaccine roll-out.
3. No processes were initiated to capture Australian data about some of the most basic questions, such as
a. How many people are infected by the virus?
b. How many people who are infected are not yet exhibiting symptoms (pre-symptomatic)?
c. How many people who are infected do not exhibit symptoms (asymptomatic)?
d. How many who are infected and exhibit symptoms but have not been tested?
e. How many people have recovered from the virus (only known for those who have been tested and were positive)?
It is not possible to accurately answer these questions without bias if you are only reliant on those who self-select for testing. The actual number of positive cases can only be estimated reliably from testing scientifically selected random samples from the whole population and these should have complemented the testing regime as soon as sufficient test kits were available.
4. There was little socio-demographic information available on the tracking of the virus and therefore about the extent of heterogeneity in the population based on this information. Yet it is obvious that infection rates, the effective reproduction number and case fatalities will vary very considerably between sub-populations and that policy responses may be different. For COVID-19, the key socio-demographic characteristics seem to be geography, age and gender, industry and occupation, and ethnicity. This has policy implications because the risk management and messaging should be quite different for each of these sub-populations and for different types of settings.
5. The level of dispersion of the virus was not estimated. This measure tells you about the relative importance of super-spreading events in spreading the virus. Endo et al. [3] estimate that super-spreading may be the cause of the majority of COVID-19 infections or, perhaps more commonly, super-spreading events. Specifically, they found that an estimated 80% of secondary transmissions may have been caused by a small fraction of infectious individuals. This is extremely important in understanding the need for emphasis on curtailing super-spreading settings, especially as restrictions are eased.
6. The full statistical potential of contact tracing was not realised. In Australia, contact tracing improved considerably during the course of the pandemic with much better use of automated rather than manual processes. A rather complex questionnaire was used in contact tracing. It was designed to capture a lot of information but it was not set up in a way that the full statistical potential of that information could be realised. As an example, data from the questionnaire could have provided insights, disaggregated by socio-economic characteristics, that would have been useful inputs for modelling reproduction numbers and understanding heterogeneity and dispersion characteristics. It was not just a problem in Australia. According to the Royal Statistical Society [14], “the delivery of test and trace has focussed purely on operational goals, with not enough consideration given to collecting and reporting data directly relevant to epidemiological purpose.”
7. It took some time for alternative data sources such as waste-water testing to be given attention by the health authorities and it is not clear that the tests have been implemented in an optimal way. Statisticians were not involved in the implementation. There are important statistical issues in the efficient and effective design and analysis of the testing (including procedures to minimise false positives as a result of any lack of specificity in tests: it was 30% before implementation started but the accuracy of the tests may have improved since then) that need to be resolved. There is a need for optimisation of the whole protocol: sampling, sample storage and concentration, extraction and detection/quantification. This needs to be done in collaboration with water biologists. Adaptive sampling is possible for waste-water surveillance and is particularly useful when the number of COVID-19 cases is relatively small. However, it has not been used in Australia (although it has been in Singapore). There should be a national strategy if these tests are to achieve their intended purpose but design responsibilities are now distributed across State and local governments and are probably less than optimal. False positives are a particular concern as they stimulate a lot of costly activity and public concern which may be unnecessary.
8. Measures of excess deaths provide an alternative measure of the net increase in fatalities as a result of the pandemic but have not been publicised causing more angst than was necessary. Excess deaths remove some uncertainty in specifying the true cause of death, particularly when people are co-morbid. Measures of excess deaths also includes deaths from other causes because medical services are not being sought or are not easily available owing to pressures on the health system. They also take account of any reductions in deaths from other sources (e.g. influenza) because of additional public precautions that are being taken. A study by Imperial College [10] showed that there were no excess deaths in Australia at the time of the study although approximately 900 deaths were attributed to COVID. Some will have died during the period in question because of their morbid conditions but there would also be some compensation as a result of deaths from other causes. As a comparison, the number of excess deaths in England and Wales was 37% at the time of the study.
9. The impacts of various interventions to reduce infection transmission rates is largely anecdotal rather than the result of professional analysis. As noted by prominent epidemiologists in Australia, there is not a lot of science informing lockdown measures. However, there is a lot of public debate and significant variation in the intervention strategies used by State Governments. There should be some post hoc analysis of the impacts on COVID-19 because interventions can have significant economic and social costs. It will not be easy as there has been significant confounding between the different types of interventions. Advanced statistical techniques are needed to make sense of the data that is available.
10. The unavailability of a national household survey means that a lot of the detail on the vaccine roll-out, as it applies to individuals, will be limited. There will be estimates of the number of people who have been vaccinated, with some limited socio-demographic information, but limited data on those who have not been vaccinated and the reasons why. Australia does not have a population register so a household survey is the best means of obtaining this information.
Figure 1.
(This diagram has been slightly modified from the corresponding diagram in Hao et al. 2020.) Illustration of the SAPHIRE model. Hao et al. extended the classic SEIR model to include seven compartments and their relationships: S: susceptible; E: exposed; P: Infective; I: ascertained infectious; A: unascertained infectious; H: isolated; Rem: removed. Two parameters of interest are:
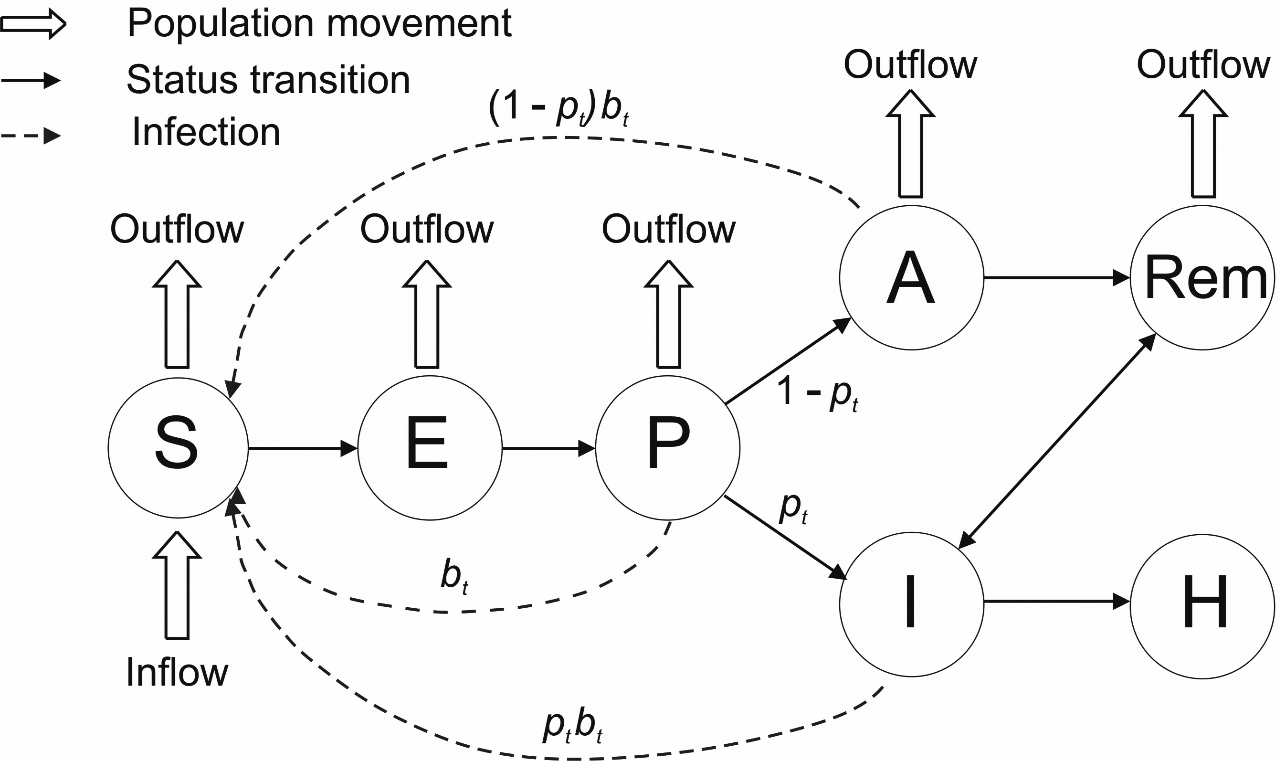
Table 1
Sources of answers in the SAPHIRE model
| Quantity | Model parameter | Status | Best data source |
|---|---|---|---|
| Susceptible | S | Known | ABS population data adjusted for those who have immunity |
| Exposed | E | Good | Mainly population ABS data |
| approximation | |||
| Infectious | P | Unknown | Random Survey to adjust epidemiological data |
| True infection rate |
| Unknown | Analysis is mainly based on |
| Ascertained infectious | I | Known | Epidemiological data but in a national survey in UK only 29% of positive |
| persons at time of test showed symptoms | |||
| Symptomatic but not tested | A part | Unknown | Random Survey |
| Pre-symptomatic | A part | Unknown | Random Survey |
| Asymptomatic | A part | Unknown | Random Survey |
| Ascertainment rate |
| Unknown | Random Survey (In UK only 29% of positive persons at time of test showed |
| symptoms) | |||
| Recovered, including Recovered | REM part | Known | Epidemiological data and follow-up of sample of infected cases |
| and Re-infected | |||
| Deaths | REM part | Known | Epidemiological data and mortality data |
| Isolated | H | Unknown | Number of persons who should be isolating should be known but the |
| proportion who are actually isolating is unknown |
3.Epidemiological models
Epidemiologists use a variety of models but the information needed to support the models is broadly consistent. Many of them are variants of the classic SEIR (Susceptible, Exposed, Infectious, Removed) model. For the purposes of illustrating the information requirements, we have used the model from Harvard University [6].
At present, in Australia, only I is known with reasonable accuracy, and then only to the extent that testing is accurate. However, all compartments are important for understanding the path of the virus. The reproduction number should be based on
The unascertained (A) component contains a number of different categories: pre-symptomatic, asymptomatic, and symptomatic but not yet ascertained (tested). Knowledge of each is important for understanding current infections levels as well as the efficacy of the testing protocols.
Regular scientifically random surveys of sufficient size will enable both A and I to be estimated with a reasonable degree of accuracy and hence
Table 2
Community prevalence of SARS-CoV-2 virus in England during May 2020 and January 2021
| Age group | Round 1 | Round 8 |
|---|---|---|
| 5–12 | 0.16% (0.10%, 0.26%) | 1.71% (1.39%, 2.10%) |
| 13–17 | 0.15% (0.08%, 0.27%) | 2.26% (1.85%, 2.77%) |
| 18–24 | 0.27% (0.18%, 0.43%) | 2.51% (1.95%, 3.22%) |
| 25–34 | 0.17% (0.12%, 0.26%) | 2.06% (1.75%, 2.42%) |
| 35–44 | 0.14% (0.09%, 0.21%) | 1.61% (1.39%, 1.86%) |
| 45–54 | 0.14% (0.09%, 0.20%) | 1.59% (1.40%, 1.81%) |
| 55–64 | 0.10% (0.06%, 0.15%) | 1.31% (1.16%, 1.49%) |
| 65 | 0.07% (0.05%, 0.12%) | 0.94% (0.83%, 1.07%) |
| Prevalence | ||||
|---|---|---|---|---|
| Round 1 | Round 8 | Round 3 | Round 4 | |
| Occupation | ||||
| Care home worker | 0.71% (0.24%, 2.06%) | 2.53% (2.05%, 3.12%) | NA | 0.71% (0.24%, 2.06%) |
| Health care worker | 0.47% (0.30%, 0.75%) | 2.53% (2.05%, 3.12%) | NA | 0.09% (0.04%, 0.21%) |
| Other essential worker | 0.17% (0.12%, 0.25%) | 1.86% (1.65%, 2.09%) | 0.04% (0.02%, 0.07%) | 0.10% (0.08%, 0.12%) |
| Other worker | 0.09% (0.06%, 0.13%) | 1.55% (1.40%, 1.71%) | 0.03% (0.02%, 0.04%) | 0.07% (0.06%, 0.08%) |
| Not regular worker | 0.14% (0.09%, 0.21%) | 1.35% (1.21%, 1.50%) | 0.03% (0.02%, 0.05%) | 0.06% (0.05%, 0.07%) |
| Ethnicity | ||||
| Asian | 0.24% (0.13%, 0.43%) | 2.61% (2.10%, 3.21%) | 0.07% (0.03%, 0.16% | 0.14% (0.10%, 0.18%) |
| Black | 0.17% (0.05%, 0.61%) | 3.42% (2.41%, 4.83%) | 0.03% (0.02%, 0.04% | 0.15% (0.09%, 0.28%) |
| White | 0.13% (0.11%, 0.15%) | 1.45% (1.36%, 1.55%) | 0.10% (0.03%, 0.36% | 0.07% (0.07%, 0.08%) |
| Mixed | 0.18% (0.07%, 0.45%) | 1.77% (1.23%, 2.52%) | 0.04% (0.01%, 0.20% | 0.10% (0.06%, 0.17%) |
| Other | 0.21% (0.06%, 0.77%) | 2.20% (1.33%,3.62%) | 0.07% (0.01%, 0.41% | 0.16% (0.08%, 0.28%) |
There are several points to note:
• Gender. There is no statistical evidence for gender differences (not shown in the Table).
• Age. (1) The prevalence for children is slightly higher than that of 35–44 year olds. (2) The prevalence for 18–24 year olds was double that of 35–44 year olds in the early stages of the pandemic but that ratio has declined over time. (3) The prevalence for 65
• Occupation. The prevalence for care home worker and health care worker are extremely high although has declined significantly over the two rounds shown in the Table. Care home and health care workers were combined in round 8.
• Ethnicity. The prevalence for people of Black ethnicity and Asian ethnicity (who were mostly of South Asian ethnicity in this study) is significantly higher than white ethnicity.
As stated by Georgiou [5],
What is needed, instead, is an expansion of the usual tools of official statistics to include testing of biological samples from respondents in the context of a statistical survey aimed at inferring the prevalence of COVID-19 in the population.”
The Rem component of A includes two main categories – infected and deaths. Some of the infected potentially may also be re-infected although the evidence suggests this is rare.
4.Heterogeneity and dispersion
A noteworthy aspect of the impact of COVID-19, which is policy relevant, is its differential impact on different sub-groups of the population. It is vitally important to be able to characterise this heterogeneity in order to manage a pandemic effectively. Customising strategies according to geography, age, industry/occupation, ethnicity or some combination of these, may enable the development of smarter interventions that have
far less impact on people’s well-being and on the economy. There are several ways in which information about heterogeneity can be used to advantage, including:
• reducing the impact of compulsory isolation, by better localisation.
• helping to inform the most effective health interventions for different sub-populations.
• better targeted communications combined with better feedback mechanisms to ensure that important messages have been received and understood by the target population.
There are different ways at looking at heterogeneity. It may refer to (a) the probability (odds) of obtaining the virus, (b) the reproduction characteristics, or (c) the risk of serious illness or death.
With respect to (a), Table 2 shows the prevalence of swab-positive cases for different sub-populations in England, UK. They are derived from a series of scientifically random surveys of 100,000 people conducted to understand COVID-19 infections. Only the first and January 2021 rounds are shown.
The key messages from Table 2 are the highest prevalence is in young adults and the lower prevalence is with seniors. There is little difference by gender. There is a high prevalence with care home and health workers although the relative difference has declined over time presumably as protections for these workers has improved. Persons from an ethnic background have a higher prevalence.
In Australia, the anecdotal evidence suggests that the age and occupation patterns of COVID prevalence may have been similar to the UK when case numbers were high in the first and second waves. Furthermore, it also appears that the relative prevalence in migrant population may have been significantly higher than for the rest of the population. The high number in migrant numbers may have been associated with higher risk through employment, larger family sizes, and communication difficulties.
It is also important to understand the heterogeneity in reproduction characteristics. It may enable answers to the following questions and development of appropriate interventions:
• Which socio-demographic groups are more likely to be super-spreaders?
• What is the rate of reproduction of children given that for COVID-19 they were mostly asymptomatic, or mildly symptomatic, but less likely to socially distance?
• What are the high-risk workplaces (e.g. medical centres, care facilities and meat works)?
Knowledge of the heterogeneity characteristics of fatality rates is essential in order to make sensible decisions about protections for those most at risk (e.g. aged care residences). Failure to address this adequately was the cause of most COVID-19 deaths in Australia. There were protections for visitors to care facilities but the main risk was actually with employees who might have contacted COVID-19 externally and spread it to the care facilities. Furthermore, many of these employees had part-time jobs across a number of care facilities.
To provide a simple example of the impact of heterogeneity on the effective reproduction number (R), if 20% of the population has an effective reproduction number of 2.5 or higher say (defined by geography, age, occupation/industry etc.) and 80% of the population has an effective reproduction number of less than 1.0, then the overall reproduction number will be a weighted combination of the two with the weights dependent on the number of active cases in each sub-group. R will be close to that of the first sub-group if that also, as expected, has the highest number of active cases. Reducing R below 1 for the population as a whole requires (1) targeted interventions to the first sub-group, (2) less stringent interventions for the second sub-group but sufficient to keep their reproduction number below 1, (3) interventions to minimise leakage between the two sub-groups (e.g. border restrictions, protective clothing) and (4) steps to reduce the risk for those most at risk of fatality (e.g. the elderly). If this can be achieved, it should result in the desired health outcomes but with reduced impact on the overall economy and well-being.
One limitation of the reproduction number is the averaging nature of the models underpinning the estimates. To partially overcome this, many of the models also incorporate what is known as the dispersion factor (k). It is a measure of how much some infected people transmit the virus and how little others do and therefore the relative importance of super-spreaders and super-spreading events. There was not much work in Australia in understanding dispersion with COVID-19, possibly because of the lack of suitable data to understand it, although there has been a lot of focus in interventions on avoiding super-spreading. A possible data source is test-and-trace data, obtained during contact tracing, but it has to be retained in a way that it can be used subsequently for statistical analysis. For COVID-19, there was a lot of reliance on anecdotal evidence.
Endo et al. [4] estimated a dispersion factor of 0.1 for COVID-19, which suggests that 80% of secondary transmissions may have been caused by a small number of infectious individuals. They concluded that “as most infected individuals do not contribute to the expansion of an epidemic, the effective reproduction number could be drastically reduced by preventing relatively rare super-spreading events.”
A low value of k means that a relatively small number of infected individuals are driving transmissions. It follows that if you can identify and reduce the situations that disproportionately drive transmissions, then the focus can be on these situations and other measures can be less disruptive. This is particularly important in the latter stage of a pandemic when the focus is on preventing future outbreaks.
In summary, data collections should be put in place to enable heterogeneity and dispersion to be estimated. Data scientists with statistical skills need to be involved in the design of these collections and the information models to set up the data so that it can be used for analysis.
Table 3
Possible sources of data required to manage a pandemic
| Data type and current usage | Explanation | Potential use |
|---|---|---|
| Epidemiological data on tests, deaths, etc. | These are the core data traditionally used by epidemiologists. Some geo-demographic detail would be available. | It is used in all phases to provide headline statistics. It is used to monitor the progress of the virus. It is used to provide inputs into models including the models to estimate the effective reproduction number. |
| Test-and-trace (contact tracing) data. | This data would be collected as part of the testing protocols but needs to be set up in such a way that its statistical potential can be fully exploited. | It could be used to provide information to support the estimation of the reproduction number and the dispersion factor. Socio-demographic analysis would be possible if this data were also collected. |
| Testing people randomly selected from the population or from sub-populations. Data would be acquired on an ongoing basis. The sample survey would be based on a stratified random sampling, possibly with a longitudinal element, and tuned to specific pandemic management requirements. | This provides the only means of obtaining reliable estimates of several important unknown quantities (cf. Step 2.6). The official statistical agency, in partnership with a health care provider, could prepare and deploy the process, which should provide vital monitoring information about the progress of the pandemic in different areas and amongst different subpopulations, and about the effect of interventions. It could also be used in combination with the self-selected test data. See Appendix 2. | Relevant to both Phases 2 and 3. Because the process requires significant resources to deploy, and you are trying to survey a relatively rare population, it is likely to be applicable only when the virus has attained a certain level of prevalence. See Appendix 2. Pooled testing arrangements could be used when there are resource shortages for analysing tests. |
| Specific studies of high-risk environments. | For example, hospitals, aged care centres, meatworks. | Targeted surveys for environments that may require special interventions. |
| Capturing important demographic and socio-economic information from each person who is tested. | Once people have returned a positive test for the virus, several covariates can be captured readily, providing an important data resource. | All phases and all relevant data sources. The information should inform the sample survey design and help focus collection of WWS data (d) and data from indirect sources (f). |
| Capturing test data on international arrivals. | These would be used to better understand the riskier countries to inform policies on managing international travellers. | Understanding the prevalence rates of travellers from different countries. |
| Information from household and business impact surveys. | This would be similar sample surveys to those currently conducted by the ABS (for example) in respect of COVID-19. | The content of these sample surveys may vary over time depending on the issues of concern so also have a role in the recovery phase as well as Phases 2 and 3. |
| Waste-Water Surveillance (WWS). | When a suitable test is available, WWS is a relatively inexpensive way of providing early-warning surveillance for detecting small levels of the virus at the community or population levels. | Primarily Phases 2 & 3, but possibly Phase 1 as well, depending on the availability of a proven WW marker, with possible utilisation of techniques like pooled testing. May have important ‘upstream’ application relating to detection of the virus among prospective travellers to Australia, for example by WWS for vessels arriving in Australia. |
| Capturing data on daily numbers of close contacts outside the household. | This would be collected through household sample surveys, perhaps as a data item in the household survey referred to in (b) or as a by-product of the random sample for testing. If the sample survey was large enough, it would allow separate estimates for important sub-populations based on geography, age, occupation group and ethnicity. | Relevant to phases 2 and 3. This is a more direct proxy for reproduction behaviour than the mobility indicators currently being used and could be used to support estimates of the effective reproduction number. It can also be used to study the effectiveness of restrictions to help control the virus. |
| Mobility data from Google GPS and direction seeking software. | This is available from Google GPS mobility data and Apple and City Mapper data on request for directions subject to privacy provisions. | This can be used to analyse the effectiveness of restrictions. It can also be used in combination with epidemiological data to obtain estimates of the effective reproduction number. It is relevant to both phases 2 and 3. A significant limitation is that it is only available for Smart Phone users who may not be representative of the population as a whole. |
| Indirect sources such as data from smart thermometers, | None of these sources is necessarily specific to a pandemic virus, although separately, and in combination, they may provide a rich observational data base to track spatio-temporal evolution of a virus. | All phases, in combination with other data. Very cheap to capture real-time data. |
5.The proposal for pandemic information
Epidemiological data (tests undertaken, number of positive cases, deaths) were the main data sources for learning about the COVID-19 pandemic and how it was tracking. These were supplemented from time to time by mobility indicators from sources such as Google GPS to understand the impact of interventions on mobility. Occasional small-scale surveys and research studies have also been conducted to throw some light on specific issues. More recently, waste-water surveillance has been used but only to detect the potential presence of the virus. The ABS also conducted regular surveys of the impact of the pandemic on households and businesses, with the capability to vary the subject content from survey to survey.
However, there are several other important, indeed essential sources of data that could also be tapped to inform intelligent management of a pandemic and are included in our proposed PIP. These sources include:
(a) infection testing of people randomly selected by scientific random surveys of the population or from the sub-populations most affected by the pandemic
(b) specific surveys of high-risk environments such as hospitals, aged care centres, meat works
(c) tests of international arrivals and capturing the data in a form that it can be related to international arrivals data
(d) capturing test-and-trace (contact tracing) data in a form amenable to subsequent statistical analysis
(e) capturing additional important demographic and socio-economic information from each person who is tested, whether through the random sample or the targeted testing
(f) data from the waste-water surveillance programs [2] in a form that can be associated with active pandemic cases in the capture area
(g) data that would support analysis of the comparative effectiveness of different interventions to reduce the spread of the virus
(h) potentially, more indirect sources such as data from smart thermometers, internet search engines, social media conversations, and routine blood testing for other purposes. The potential information in such data requires further investigation for validity.
Figure 2.
The diagram represents management of a pandemic in four main phases, focusing on the requirements for data acquisition, expert analysis and interpretation, and presentation in each phase. Each box outlined in red involves tasks requiring statistical expertise. A variety of statistical skills, knowledge and knowhow is essential for efficient and effective management of the pandemic. Each of the numbers corresponds to more detailed information in Appendix 1. NPCC
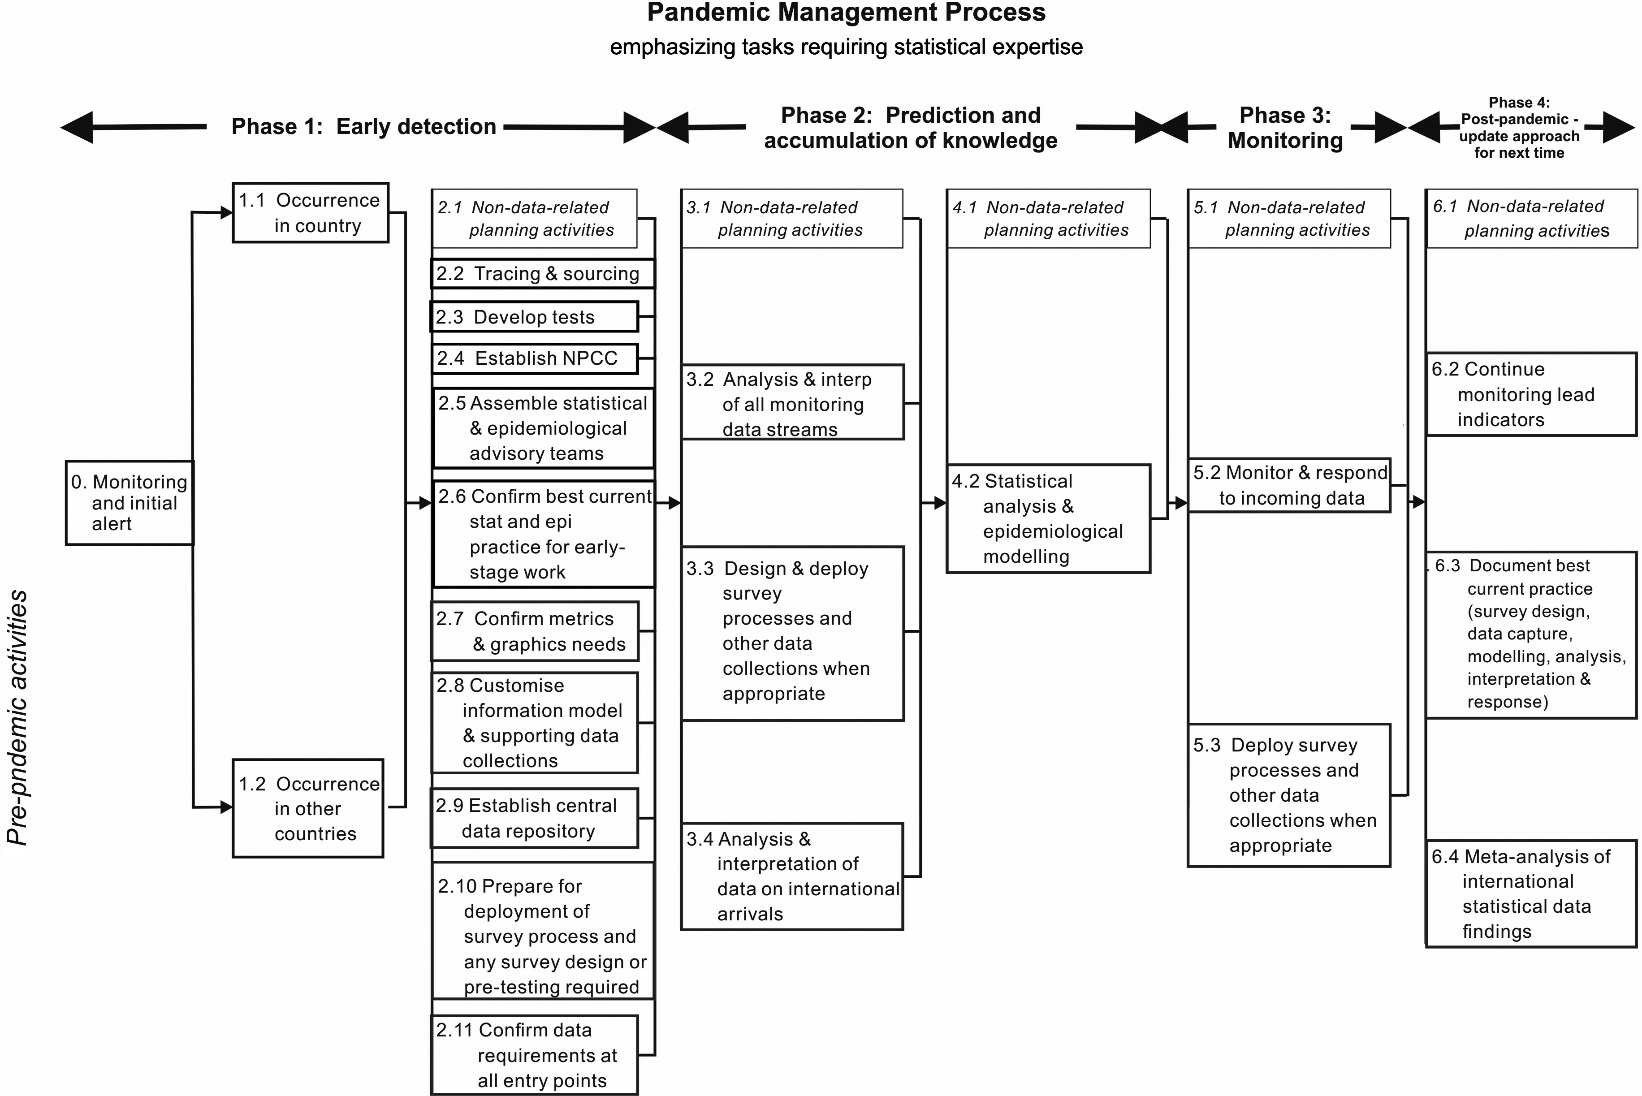
Table 3 summarises the range of data that might be used to inform a pandemic. It refers to four phases:
• Phase 1 relates to early detection of the onset of a pandemic, and the data sources that might assist in this regard.
• Phase 2 is concerned with triggering all the structures, data collection, capture and repository mechanisms and services needed to inform management of the pandemic.
• Phase 3 lists the main monitoring data source activities required.
• Phase 4 refers to post-pandemic activities.
Table 3 begs the question: Why wasn’t all this information available for COVID-19? Important reasons include:
• health experts relying largely on a single source for tracking the virus – epidemiological data and forecasts mostly based on epidemiological models44
• aside from ABS advice relating to official statistics, lack of clear, independent, authoritative and reasonable professional statistical advice resonating at the highest level of government
• lack of an information plan specifying what data are needed and for what purpose
Pandemics such as COVID-19 lead to crisis. And in a time of crisis, it is essential that people and groups who are generally in (healthy) competition work collaboratively and collegially. Data, information, models and approaches need to be made available for learning, exploitation, critical peer assessment and comparison, so that the Government can be confident that it is receiving the best possible advice available. The PIP (see Fig. 2) seeks to correct these deficiencies.
Figure 2 displays the four basic phases for managing a pandemic. The figure clearly omits a large amount of complex activity that does not depend directly on data and analysis, although statistical and operations research techniques might be relevant to ensure these activities are performed effectively. This is captured in the single line of steps across the top of the chart.
It is immediately evident from the figure that there is a very large requirement for expert statistical advice. For the COVID-19 pandemic, very few of these steps were in place. The figure also omits data related to understanding the economic and social impacts of the interventions to control the pandemic and what is required to support the economic recovery. In these areas, the ABS has the main responsibility for providing the required data and, based on past performance, it would be expected that they would collaborate closely with the key users such as Treasury on their statistical requirements as they did with the COVID-19 pandemic.
The numbers associated with the process steps in Fig. 2 correspond to subsections of Appendix 1 to this document which, with varying levels of detail, provide a description of these steps. Table 3 also provides a discussion of how the data sources relate to the pandemic management phases. It includes the data sources used to help manage the COVID-19 pandemic as well as potential new data sources.
There needs to be agreement on the information requirements to support the responses to a pandemic. In fact, this should be done as soon as possible, utilising the COVID-19 experience, so there is a ‘blueprint’ before the next pandemic eventuates. This would include addressing questions such as:
(a) How will we make early detections of the presence of a pandemic?
(b) What model or models should we use for tracking the path of the virus and for forecasting the future path noting that averaging of estimates across different models can often lead to a more accurate estimate?
(c) What data items do we need to support those models?
(d) What dis-aggregations do we need (e.g. geography, age, sex, occupation, ethnicity)?
(e) What information do we need to understand the impacts on businesses or households?
(f) What information should be used to monitor the potential for second and subsequent waves?
There will no doubt be other information requirements that should be considered by the proposed multi-disciplinary Task Force we propose be set up for the purpose of determining the information requirements. Furthermore, measures of uncertainty are also important to enable sound interpretation of the data for policy analysis purposes. Once the information requirements are decided, the Task Force should consider the most appropriate data collections, and who should be responsible, so that development work can commence and they can be deployed at relatively short notice if required.
The effective reproduction number (
We believe that the whole-of population-estimate of
To conclude this section, we emphasise that a well-designed scientifically random survey of the relevant population plays a very important role in satisfying many of the information requirements, including more accurate estimates of the effective reproduction number (as shown by the work of the REACT study [12] in the UK in respect of the COVID-19 pandemic. The (unidentified) survey data can also be used to support micro-simulation models developed to better understand likely patterns of transmission. Furthermore, such surveys will enable more detailed data to be obtained on the progress of the vaccine roll-out.
6.Return to normalcy
A key decision for governments is whether the underlying strategy is to be suppression or elimination. In many countries, elimination was not an option but it was an option for island countries like Australia and New Zealand. For COVID-19, the National Cabinet in Australia agreed on a suppression strategy although the interventions of the State governments suggest they are actually pursuing elimination strategies. Monitoring (Phase 3 on Fig. 2) is crucial to both strategies. A return to normalcy requires early detection of new cases so that testing, isolating and tracing can be put in place quickly and health systems do not get overwhelmed by large case numbers. If detected and controlled early, the interventions do not need to be as economically and socially damaging. In particular, it could avoid the huge damage due to disruptions and uncertainty caused by moving in and out of different levels of restrictions over time.
For COVID-19, in Australia the reliance was on epidemiological data for early detection (based on an extensive self-selected testing program) but there can be important lags in detection which can make its management more difficult. Waste-water surveillance and testing provided an opportunity to detect viruses much more quickly. Studies at Yale University (see https://globalnews.ca/news/6958321/sewage-coronavirus-ottawa-yale/) estimate that it is a 5-day leading indicator of people showing up positive in testing.
Waste-water surveillance is a key element of Box 5.2 (Fig. 2) but it needs to be done well. A good spatial sample design is crucial to optimise the probability of detecting traces of the virus whilst ensuring the tests are being used efficiently. The spatial sampling design would need links to data about the population (e.g. Census data) from which the waste-water has been derived. Adaptive sampling techniques could be used whereby positive tests at a relatively broad catchment area could be used to initiate tests in smaller catchment areas.
As with all tests there is the risk of false positives, depending on the degree of sensitivity of the tests, and false negatives, depending on the specificity of the tests. If the sensitivity is not 100%, multiple tests should be taken to minimise the chance of and expenses associated with reacting to what might be a false positive test. Likewise, the testing strategy needs to account for any lack of specificity. There can also be technical failures and anomalies, leading to measurement error, which will require statistical models to detect and correct.
There were many positive waste-water tests that have not led to the identification of positive COVID cases. It is commonly thought that this might be due to people who have previously had the virus still shedding fragments. Another explanation may be lack of sensitivity in the tests. There is a need to calibrate the strength of the test results to the likelihood of actual positive cases.
A suitable vaccine is also key to the return to normalcy. One would hope that experienced statisticians are involved in the development and testing of the vaccine. They should also be involved in the design of the roll-out (when operations research techniques such as queueing theory come to the fore). They also need to be involved in the design of the monitoring system, including information system design. For countries with population registers, these could provide the framework for understanding who specifically has had the vaccine and enable links to health system data bases. For other countries, a well-designed household survey may be required. It could be the same survey we have proposed for better understanding the prevalence of the virus. A survey may also be required, even for countries with registers, if some of the required information is not available from linked registers (e.g. reasons for not being vaccinated).
7.The role of official statistics
We think the following steps undertaken by the ABS in respect of COVID-19 were excellent and a good starting point for this discussion (see https://abs.gov.au/abs-responds-covid-19).
They produced a range of statistical products providing relevant insights on households, employment and industry to inform government, business and community responses to the pandemic. These included:
• Business impacts such as cash flow and turnover
• Additional monthly analysis of hours worked, including reasons for working fewer hours, and quarterly-hours-worked analysis by industry
• Preliminary retail turnover data
• Preliminary import and export data
• COVID-related employment and health implications for households
• Earlier release of mortality data
Access to confidentialised microdata for Australian businesses was made available to researchers through a remote access facility, known as TableBuilder,66 so that researchers can produce their own tables, graphs and maps.
They also explored the use of new data sources. These included:
• Bank transactions data – aggregated, de-identified transactions data from major banks to inform the compilation of official ABS estimates of business sales, household consumption and Gross Domestic Product (GDP), and assist in understanding the evolution of the Australian economy during the period affected by COVID-19.
• Energy consumption data – to understand how electricity usage is changing for businesses and households at a geographic level, and whether power consumption provides any understanding about changes in economic activity.
• Mobility data – samples of aggregated, de- identified data on mobility and location from a commercial provider, based on mobile device GPS, to assess the value of these types of data to inform short-term population movements.
The ABS produced a range of analytical products, based on ABS data, that improved understanding of the impact of COVID-19. These included analytical products on topics such as economic and labour market impacts.
Importantly, the ABS rapidly introduced new monthly surveys of the impacts on households and businesses of COVID-19. Estimates from these surveys were produced very quickly. Also, the content could vary from month to month, depending on issues of interest.
There are some other initiatives that could be undertaken with future pandemics. The ABS infrastructure could be used more extensively. This includes its household survey framework and household interviewers. In particular, the infrastructure could be used to provide the additional data we believe is vitally important for informing pandemics, as discussed earlier in this article.
Furthermore, the official statistical agency could assist with the integration of data from a range of different sources to provide a more coherent picture. This could be by means of analytical articles aided by an integrating framework, should a suitable one be available. For example, how can you get a balanced view of the real death rate taking account of death registration data, health data, excess death calculations and data on co-morbidity?
International comparisons are extremely important. For the comparisons to be valid, they need to be compiled in accordance with agreed international standards. Each pandemic will have its own characteristics but the underlying variables and parameters that are used to drive the epidemiological models will be the same (see Fig. 1). Work could be done now on identifying and defining them. They should be accompanied by estimates of the level uncertainty. For example, data on positive cases needs to be disaggregated by the type of test (e.g. swab or serological) as the specificity and sensitivity of these tests vary. There would be other areas where international standards would be important – such as the core demographics to be used, and definitions to be used for the effective reproduction number (
8.Concluding remarks
There is a critical need for strategic statistical involvement in the whole process of learning from the COVID-19 pandemic to identify how to improve the quantitative information and advice provided to policy makers for future pandemics. The costs of collecting and analysing additional data are small compared with the human and economic costs of a pandemic. The additional data will provide important insights that were not available from the data used during the COVID-19 pandemic and help provide better economic and social outcomes.
Tests based on an ongoing national, scientifically random survey are one important response (undertaken in some Western European countries for COVID-19) but were rejected in Australia seemingly because of initial concerns about wasted tests but later because it was felt that ‘self-selected’ tests provided sufficient information: that is, the value provided by random surveys was not understood. They are not wasted if they provide information about the actual level of infection with socio-demographic characteristics (e.g. children) including asymptomatic and symptomatic cases that have not been tested. They are not wasted if they can provide timely information about the efficacy of interventions. And they are not wasted if supplemented by data on characteristics such as the number of close contacts in the previous 24 hours and other information that is useful for better managing the pandemic and the vaccine roll out. As it turned out, more than 15 million COVID-19 tests had been conducted at the time of writing and a household survey would have only required a small proportion of these tests. Countries with population registers may be able to use them in lieu of sample surveys.
Test-and-trace is a vital response to pandemics. Potentially, it also can provide a rich source of data for understanding the path of the virus but the data bases need to be established and managed in a way that it can be used for subsequent statistical analysis.
There is much to be learnt, at relatively low cost, from less direct data sources such as Waste-Water Surveillance to provide early alerts to the presence of a virus. These tests will not be available at the beginning of a pandemic but their development should be a high priority with statisticians intimately involved in this development work.
There were various interventions used to help manage COVID-19 (e.g. lockdowns of various types). These have significant economic and social effects and may or may not be effective. We need to learn from the COVID-19 experience. The analysis is complex and requires sophisticated statistical methods. However, the benefits to managing future pandemics are so strong, this work has to be done.
Finally, we strongly recommend a multi-disciplinary Task Force be established to determine the information requirements for managing a pandemic in more detail and how they might be met utilising the experience of the COVID-19 pandemic. The membership should include a statistician with statistical modelling and analysis expertise, an official statistician, an epidemiologist, a medical researcher, an economist, a social psychologist and a public health official.
Notes
1 The reproduction number, usually written
4 Indeed, the failure of epidemiological modelling has been in evidence in many countries, not just Australia. See [8] for a detailed analysis. To quote from their first paragraph, “COVID-19 is a major acute crisis with unpredictable consequences. Many scientists have struggled to make forecasts about its impact …. However, despite involving many excellent modelers, best intentions, and highly sophisticated tools, forecasting efforts have largely failed.”
Acknowledgments
We would like to thank the reviewer for very helpful comments.
References
[1] | Biemer P, Amaya A. Total Error Framework for Found Data. Chapter 4 in Hill et al. (2020) . |
[2] | Daughton CG. Wastewater surveillance for population-wide Covid-19: the present and future. Science of the Total Environment. (2020) ; 736: : 139631. Available from https://www.sciencedirect.com/science/article/pii/S004896972033151X. |
[3] | Di Gennaro Splendore L. Random testing, quality of data and lack of information: COVID-19. Data & Policy Blog April 11, (2020) . Available from https://medium.com/data-policy/random-testing-quality-of-data-and-lack-of-information-covid-19-a6e09a398d1d. |
[4] | Endo A, Abbott S, Kucharski AJ, Funk S. Estimating the overdispersion in COVID-19 transmission using outbreak sizes outside China. (2020) ; Wellcome Open Res 5:67. Available from doi: 10.12688/wellcomeopenres.15842.3. |
[5] | Georgiou AV. Defeating the pandemic requires high quality and ethical official statistics. J Off Stat. (2020) ; 36: (4): 729–736. Available from doi: 10.2478/JOS-2020-0036. |
[6] | Hao H, Cheng S, Wu D, Wu T, Lin X, Wang C. Reconstruction of the full transmission dynamics of COVID-19 in Wuhan. Nature (2020) . Available from doi: 10.1038/s41586-020-2554-8. |
[7] | Hill CA, Biemer BP, Buskirk TD, Japec L, Kirchner A, Kolenikov S, Lyberg LE. Big Data Meets Survey Science: A Collection of Innovative Methods. 4 September (2020) . Wiley Online Library. doi: 10.1002/9781118976357.ch4. |
[8] | Ioannidis JPA, Cripps S, Tanner MA. Forecasting for COVID-19 has failed. (2020) . https://forecasters.org/blog/2020/06/14/forecasting-for-covid-19-has-failed/. |
[9] | Kim J-K, Tam S-M. Data integration by combining big data and survey sample data for finite population inference. Int Statist Rev. (2020) ; 88: (3). Available at doi: 10.1111/insr.12434. |
[10] | Kontis V, Bennett JE, Rashid T, Parks RM, Pearson-Stuttard J, Guillot M, et al. Magnitude, demographics and dynamics of the effect of the first wave of the COVID-19 pandemic on all-cause mortality in 21 industrialized countries. Nat Med. (2020) ; 26: : 1919–1928. Available at doi: 10.1038/s41591-020-1112-0. |
[11] | Rhodes T, Lancaster K, Lees S, Parker M. Modelling the pandemic: attuning models to their contexts. BMJ Global Health. (2020) . https://gh.bmj.com/content/5/6/e002914. |
[12] | Riley S, Ainslie KEC, Eales O, Jeffrey B, Walters CE, Atchison C, et al. Community prevalence of SARS-COV-2 virus in England during May 2020: REACT study. (2020) . Available from doi: 10.1101/2020.07.10.20150524. |
[13] | Riley S, Ainslie KEC, Eales O, Jeffrey B, Walters CE, Atchison C, et al. Resurgence of SARS-CoV-2 in England: detection by community antigen surveillance. (2021) . Available at https://www.imperial.ac.uk/media/imperial-college/institute-of-global-health-innovation/public/Resurgence-of-SARS-CoV-2-in-England–detection-by-community-antigen-surveillance.pdf. |
[14] | Royal Statistical Society. Statistics, Data and Covid: Ten Statistical Lessons the Government can Learn from the Past Year”. (2021) . Available from https://rss.org.uk/policy-campaigns/policy/covid-19-task-force/statistics,-data-and-covid/. |
Appendices
Appendix 1. Detailed discussion of the steps in the Pandemic Information Plan
Phase 1: Early detection
Step 0 Monitoring and Initial alert
If not already in place, processes should be instantiated ready for deployment as the situation demands. This relates particularly to “upstream” activities that may hinder or prevent the arrival of the virus in countries. Statisticians skilled in the analysis of large and complex spatio-temporal data will need to be involved, to develop the basic methods for extracting helpful and timely information, and to devise and implement interactive graphical displays that make it easy for decision-makers to interrogate the information.
Step 1.1 Virus initially detected
Take the first step towards deploying the agreed data collection processes.
Step 1.2 Virus initially detected in other countries
Take the first step towards deploying the agreed data collection processes.
Step 2.2 Tracing and Sourcing
There are two forms of tracing. The first form is when a positive infection has been ascertained in a person. Statistical expertise is required to determine the optimum contact tracing arrangements (it is a limited resource) and the data that should be obtained as part of tracing. The full statistical potential of this important source of data was not realised for COVID-19. For example, it could have been used to learn the characteristics of super-spreaders.
The second form will depend on how the virus has been detected. The relevant data streams (e.g. through waste-water testing) will need to be developed, possibly in conjunction with new sources of data, to ascertain the initial location and spread. There is a clear need for statistical expertise.
Step 2.3 Develop tests
Biostatistical methods are an indispensable part of the development, evaluation and deployment of tests; for example, analysis of the sensitivity and specificity of tests and procedures for overcoming deficiencies in these tests – there will always be some form of measurement error which can lead to anomalies which can be misinterpreted.
Step 2.4 Establish a National Pandemic Coordination Commission (NPCC) or similar body
Depending on the charge for the NPCC, a senior expert statistician needs, ideally, to be a member of the NPCC. The statistical skills available within the official statistical agency are very important but the statistical skills required for a pandemic go beyond those available in the official statistical agency.
Step 2.5 Assemble statistical and epidemiological advisory teams
Pandemics such as COVID-19 are times of crisis. And in a time of crisis, it is essential that people and groups who may be in (healthy) competition need to work collaboratively and collegially so that all their respective skills are brought to bear.
Step 2.6 Confirm best current statistical and epidemiological practice for early-stage work
Step 2.7 Confirm metrics and graphics needs
The core quantities that need to be estimated are described in section 3 on Models.
For the COVID-19 pandemic, no reliable method was in operation to provide satisfactory estimates of all the components of the Model. Such estimates would need to be based on selecting people randomly from the population and administering tests.
To manage the response to a virus efficiently, it is also essential to understand how these quantities are changing over time, and the differential effects for a number of variables, including, (i) regions and parts of cities and towns, (ii) age groups, (iii) ethnic communities, and (iv) industries and workplaces.
Step 2.8 Customise information requirements and supporting data collections
Each pandemic will have its own characteristics although the core information requirements will be the same. Epidemiologists, statisticians, health policy officials and economists should collaborate on the actual information requirements for the current pandemic. This should happen under the oversight of the NPCC.
Step 2.9 Establish the central data repository
It is important that there be a central data repository be established so that all AUTHORISED persons (only) can access the same data and undertake the research effort required to support Government decisions. It would be centralised in a logical sense but may comprise more than one physical data base. However, there would need to be a Data Custodian to manage the repository, the integrity of uploaded data, authorisation of access, the security of the data bases, and to ensure the confidentiality and privacy requirements are met.
Step 2.10 Prepare for the deployment of survey process, including any pre-testing required
See Appendix 2
Step 2.11 Confirm data required at all entry points
The statistical data requirements should be determined whether quarantine is used or not. You would imagine that some testing would be done on arrival and some days after arrival depending on the incubation period. Information such as countries visited in the last 2 weeks would be important to associate with the test data. It should also be related to overall arrivals so that prevalence rates by source country can be defined.
Phase 2: Prediction and accumulation of knowledge
Step 3.2 Analysis and interpretation of all monitoring data streams
Epidemiological data will be a very important data source. Epidemiologists will have the main responsibility for the interpretation of this data with support from statisticians especially when modelling is not straight forward. There will be other important data streams such as random surveys, waste-water sampling and ‘big data’ sources. Statisticians should have the main responsibility for the analysis, interpretation and presentation of these data for the use by the NPCC, health policy officials, epidemiologists and others.
Step 3.4 Design and Deploy survey processes when appropriate
The official statistical agency could provide the address/contact file used as a framework for the survey, and they may also be involved in the data collection together with a health partner. They are also well positioned to undertake the design work on the survey.
The survey deployment would be the responsibility of the service provider. External statistical advice may be useful in determining when the prevalence of the virus is sufficiently high to justify a random survey – a survey is of more limited value when the numbers are relatively small. The survey does not need to be deployed nationally. It could be deployed at the State or regional level depending on where the virus is present.
Step 3.4 Analysis and interpretation of international arrivals data
Statistical expertise essential for the compilation and analysis of test data obtained in respect of international arrivals.
Step 4.2 Statistical analysis and epidemiological modelling
Epidemiologists in collaboration with statisticians, especially on the fitting of models, when data are subject to uncertainty. If multiple models are used, meta-analysis or a sound averaging procedure may be important.
Phase 3: Monitoring
This is the phase when the first wave of the pandemic has largely finished but there is a need to guard against second and subsequent waves.
Step 5.2 Monitor and respond to incoming data streams
Early detection is crucial to the management of the pandemic. The main data sources will be waste-water data, epidemiological data, and potential Google search and social media data. If a valid test for waste-water surveillance is available, the tests should be ongoing possibly using pooled sampling arrangements to reduce the cost of the testing and analysis if required. Statistical expertise is essential in their presentation and interpretation especially when the numbers are relatively small.
Step 5.3 Deploy survey process and other data sources when appropriate
External statistical advice may be useful in determining when the prevalence of the virus is sufficiently high to justify a random survey. The survey does not need to be deployed nationally. It could be deployed at the State or regional level depending on where the virus is present.
Phase 4: Post-pandemic
Step 6.2 Continue monitoring lead indicators
See Step 5.2.
Step 6.3 Document best current statistical practice (data capture, modelling, analysis, interpretation and response)
There is strong international collaboration among statisticians, both formally under the auspices of Institutes like the International Statistical Institute, and through informal networks. For example, there has been a lot of collaboration between UK and Australian statisticians. There should be comparisons of the strengths and weaknesses of different statistical practices to attempt to identify best practice for particular circumstances.
Step 6.4 Meta-analysis of the different statistical findings
Meta-analysis of the different statistical findings (e.g. asymptomatic cases and their demographic profile) would also be worthwhile. As one example, the survey conducted by the UK Office of National Statistics showed that only 29% of the persons who tested positive showed symptoms at the time of the test. It was even lower for children.
Appendix 2. Outline of proposed Random Sample Survey process
The focus of epidemiologists and public health officials is to identify as many positive cases as possible through testing higher risk populations, including those identified by tracing. A random sample survey is aimed at obtaining estimates of prevalence and the characteristics of infected people, including those not being tested, to support the management of society and economy. Both strategies are important and the strength of both can be combined (see below).
In the study of the prevalence of COVID-19 in the UK in May 2020 by the RSS Covid-19 Task Force [12], the authors conclude by suggesting that
“… [a] nationally-representative population-based surveys of SARS-CoV-2 infection may greatly improve situational awareness. An important feature of the data presented here is that they are independent of service-oriented testing processes, the representativeness of which varies substantially over time and space. Repeated rounds of studies similar to that reported here will enable continued monitoring of key epidemic properties, including R estimates at regional and local levels, to guide locally-optimized interventions.”
We recommend the following arrangements for developing and implementing a random sample survey process for Australian purposes. This would complement (and potentially combine with) the data obtained through existing testing regimes:
• It should be conducted by the ABS partnering with health authorities, epidemiologists and other health researchers assisting with the design.
• The ABS address file should provide the framework from which the sample is selected. All persons within the selected household, including children, should be included in the survey.
• To optimize the use of resources, those areas not affected, or minimally affected by the pandemic, should be excluded.
• Stratification and optimum allocation would be used to improve the efficiency of the sample design. There would be some clustering in the design to improve cost-effectiveness but, since probabilities of selection will be known, unbiased estimates can still be obtained. Adaptive or network sampling techniques might be used to further improve efficiency.
• The ABS Business Register should used to obtain a separate sample of workplaces at high risk. This would include samples of health workers identified through their workplace (if not already done through existing testing regimes). Sufficient information should be obtained to adjust for the fact that these persons will have multiple chances of selection in the survey.
• The ABS would use its usual survey procedures and through a telephone or internet interview following initial mail contacts to maximise response. It would obtain the required socio-demographic information (including occupation/industry), information on the number of close contacts, permissions to undertake virus testing, and other information relevant to managing the pandemic (e.g. vaccines). The actual testing would be managed by the health authorities.
• The usual contact tracing arrangements would apply to positive cases detected.
• The survey should not be undertaken until there was a critical mass of at least 30 cases per week. For a sample of 10,000 per week, and a population of 4 million in the target areas, this will occur when it is forecast to be 12,000 active cases (adjusting for asymptomatic cases and symptomatic cases that have not been tested). If the target population is 1 million, this will occur when there are 3,000 active cases. The survey should be deployed when it is expected that there will be at least 30 cases identified in the sample. In Melbourne, there were more than 6000 cases at the end of July 2020.
• The sample size would accumulate over time, increasingly improving the accuracy of the data on
the characteristics of persons who are positive to the virus. It would also enable longitudinal analysis.
• The information collected by the ABS would be under the provisions of the Census and Statistics Act. The ABS would be responsible for compiling and publishing aggregate tables. Authorised researchers would be able to do research based on the microdata.
• The accuracy of the survey is quite dependent on the proportion of persons who are prepared to take the test. If this could be made compulsory, as has been done for breath testing for alcohol or illicit drugs, a more accurate survey would result. The required legal provision should not be part of the Census and Statistics Act but a separate Act to support activities to manage the pandemic.
• Survey estimates would be unbiased and it is possible to estimate confidence intervals for these estimates. It would also be possible to use these estimates to get more accurate estimates of case fatality rates. Neither is possible for self-selected or volunteer samples.
There is potential to combine the data from the survey with that obtained from volunteer (or self-selected) testing. There is rapidly developing survey research on the development of hybrid estimates utilizing the respective strengths of big data (identified positive cases to the virus in this case) and survey data ([1, 9]).


