
Using e-surveys in Malaysia to modernise data collection in short-term economic surveys1
Abstract
Response rates, data quality and data confidentiality were identified as the critical success factors in Malaysia’s short-term economic survey. According to the facts, the Department of Statistics Malaysia (DOSM) has outlined a few initiatives in its strategic plan (2011–2015) and transformation plan (2016–2020) over the past ten years to improve and modernise data collection, processing and dissemination methods. This paper presents the practices of two DOSM short-term economic surveys i.e the monthly manufacturing survey (MM) and the quarterly construction survey (QCS) to raise the response rate, enhance data quality and manage data confidentiality by e-survey. The factors influences the participation of the MM and QCS e-survey are discussed. This empirical study shows that the response rates of the both short-term surveys have improved through the e-survey. Comparison of data received by various survey modes also indicated that the e-survey provides the best prospects for reducing non-sampling error and protecting data against unintentional disclosure.
1.Introduction
The Department of Statistics Malaysia (DOSM) is the government agency responsible for collecting, interpreting and disseminating quality, user-oriented and timely statistics in monitoring national economic performance and social development. Surveys are the main technique used to gather primary data from a targeted population. Face to face interview, postal, telephone, facsimile and email were the popular conventional methods of data collection in Malaysia’s short-term economic surveys before 2010.
E-surveys have become increasingly popular in the field of data collection because they can gain information faster, lower operational costs and provide better data quality with good survey design [1, 2, 3]. Realising that it could also benefit both the respondents and the Department, especially in handling the confidentiality of information provided by respondents, the Department outlined a few related initiatives in its strategic plan (2011–2015) and transformation plan (2016–2020).
Chambliss and Schutt [4] defined an e-survey as a survey that sends and receives questions via a computer. They also defined a web survey as a survey that is sent and responded to via the World Wide Web. In the meantime, e-surveys can be done via personal computer or a network system [5]. DOSM e-surveys are used for the Monthly Manufacturing survey (MM) and the Quarterly Construction survey (QCS), where the survey instruments are accessed and responded to only by registered users via a website (www.statistics.gov.my).
The number of broadband subscriptions in Malaysia registered 5.7 million in 2011 (population: 29.1 million). The number grew to 30.8 million in 2015 (population: 31.2 million) and 39.4 million in 2018 (population: 32.4 million) [6, 7, 8]. In 2015, 67.7 per cent of the establishments in the construction sector used internet in their business. This percentage increased to 85.6 per cent in 2017 [9, 10]. The significant improvement in the use of computers and internet offered a great potential for DOSM to introduce the QCS e-survey in 2013. The QCS and MM e-survey response rates are expected to rise in the future as establishments are becoming more digitally focussed in their operations.
This paper presents the strategies adopted and adapted for implementing e-surveys in two establishment surveys (the MM and QCS), as well as evaluates their performance in raising response rates, enhancing data quality and managing data confidentiality of MM and QCS e-survey. Finally, the current performance of the MM and QCS e-survey will be provided and discussed.
2.Methodology
The MM survey was conducted to collect the data required for the publication of industrial production index (IPI) and monthly manufacturing statistics (MMS). IPI covers 245 manufacturing industries classified according to the Malaysia Standard Industrial Classification (MSIC) 2008, Rev 1.0 which adhere to the International Standard Industrial Classification of All Economic Activities (ISIC) Rev. 4. Meanwhile, MMS covers 251 industries. MM survey needs approximately 6,600 responses from establishments every month across the nation in 2019.
QCS survey covers all projects worth RM500,000 and above, registered with Construction Industry Development Board (CIDB). The value of work done by project will be obtained quarterly from approximately 5,300 establishments in 2019. The construction sector performance will be compiled according to the 72 construction industries in the MSIC 2008 Rev. 1.0.
The MM and QCS surveys in Malaysia were conducted using face to face interview, postal, telephone, facsimile, email and e-survey. The application of mixed-mode designs is a strategy to boost both surveys response rates [11]. Every mode has its own advantages and the mode best suit the establishment culture will help to enhance response, as well as receive return complete questionnaire within the stipulated time. Likewise, the surveys cost will also reduce with the methods using technologies such as email, telephone, fax and e-surveys that do not involve high recurring expenses.
These surveys are conducted using postal questionnaire at the initial stage. Respondents will be provided with questionnaire, survey cover letter, questionnaire filling guides and brochures related to survey information (including e-survey participation guide). Respondents will be contacted (telephone or e-mail in the database) to confirm receipt of the instrument survey after 3 days posted and encouraged to return complete questionnaire by e-survey or e-mail. Field enumerator (FE) will provide further information on the survey and obtain contact information for the responsible officer of the survey. They are given two weeks to complete and return the questionnaire to the Department. In the immediate vicinity of the survey closing date (usually 2 days before the closing date), FE will remind/follow-up with the establishments, which have not returned the questionnaire.
The operational records of MM and QCS were paperless. The status of data collection, processing, analysis and dissemination were monitored through National Enterprise Web Statistical System (NEWSS). The system was developed in 2008 to integrate the operational and data processing works. The system also provided a platform for DOSM to start implementing the MM e-survey in 2009 and QCS e-survey in 2013.
E-survey is one of the options currently being used by MM and QCS respondents to return completed questionnaires to the Department. This mode is expected to reduce operating costs, boost response rate and improve data quality with careful attention to the design [2, 12]. Therefore, understanding which techniques increase response rates in web surveys is increasingly important [13]. A literature reviews by Bengü Börkan [14] suggests factor that would influence participation rates were complexity of web-based designs. The simple design questionnaire not only obtains a higher response rate, but also is more likely to be fully completed. Reducing respondents’ burden by not require them to provide an answer to each question before allowing them to answer subsequent items will help improve response rate. The gender, education, locality and industry are another factor to influence participation rates.
Figure 1.
Electronic questionnaire design of monthly manufacturing survey.
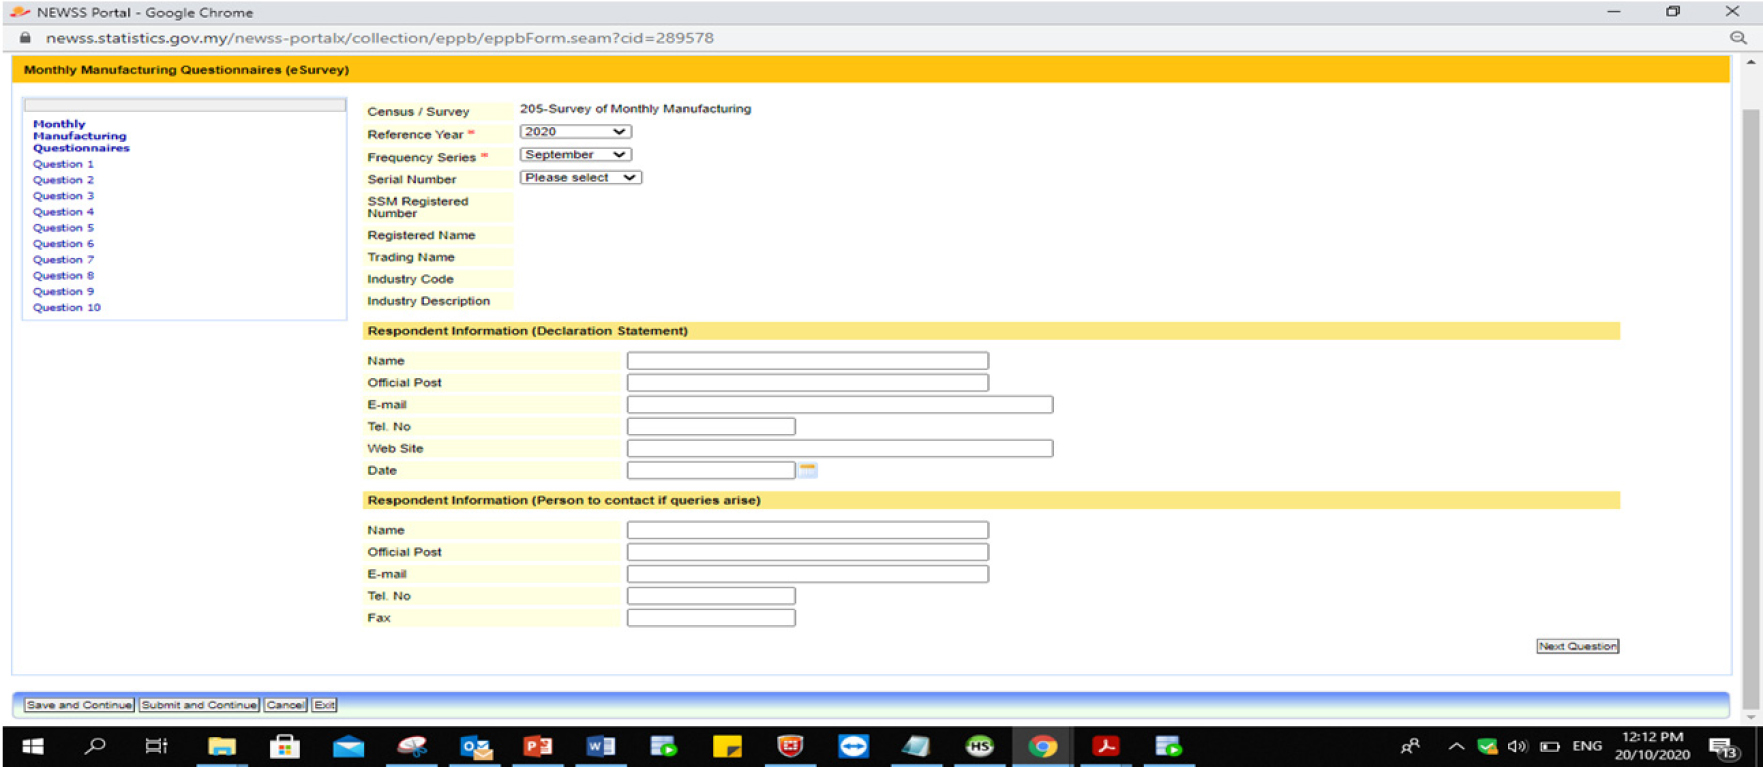
Figure 2.
Electronic questionnaire design of quarterly construction survey.
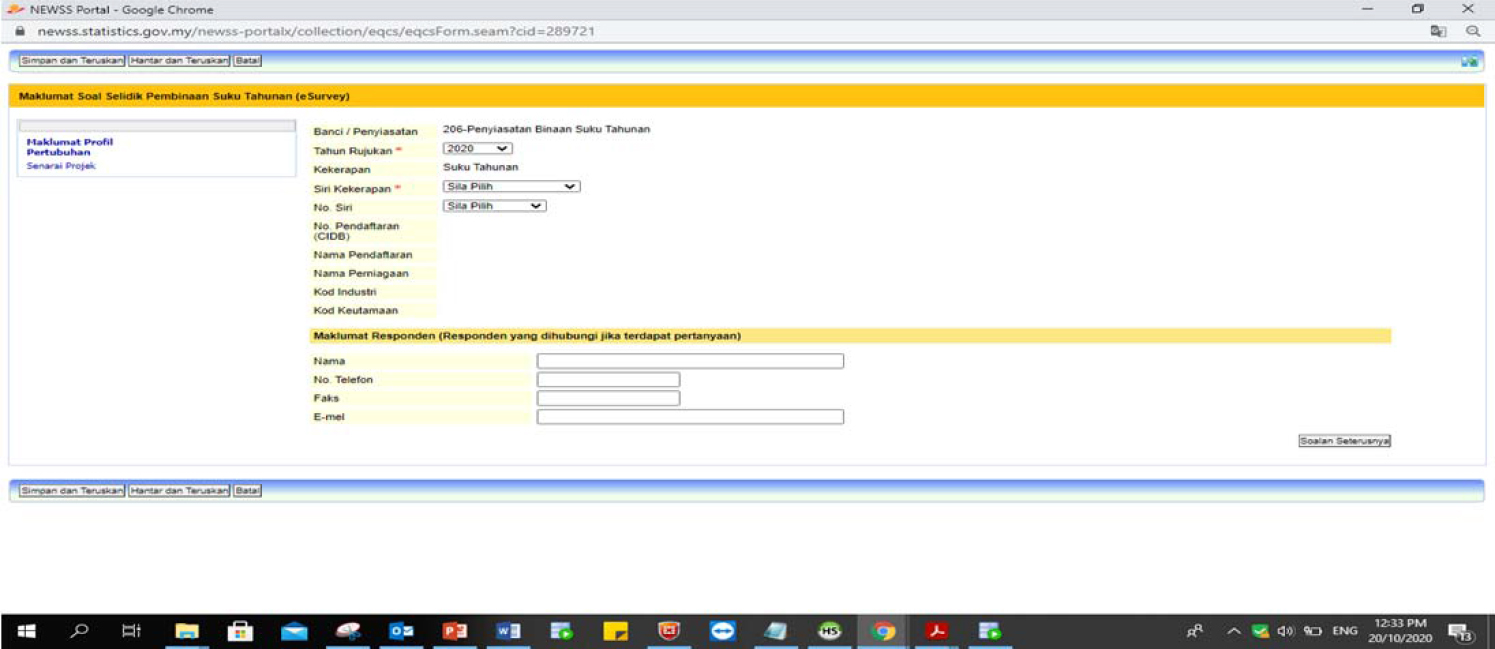
The QCS and MM e-surveys is designing to be simple and short in each page (Figs 1 and 2). Respondent can review all the questions and provide information according to the availability of information within the stipulated time. All information keyed in the questionnaire will be automatically stored and amendable by respondent until submitted to the Department. The system is also designed to send reminders to respondents who have not sent complete questionnaire to the Department a week before the survey closing date. In the effort to increase the use of e-surveys, FE will target/promote QCS and MM e-surveys to high-tech industry respondents, professional category respondents and women. They are a group that has the knowledge to use computers, has emails and is willing to accept and learn new things.
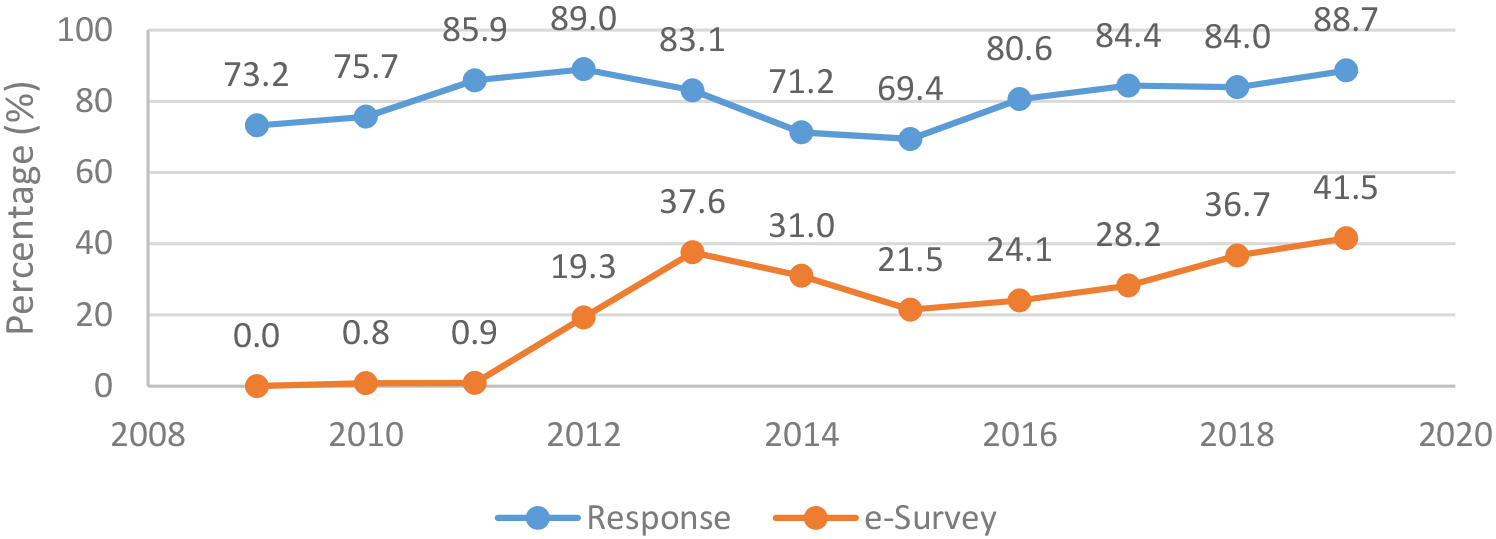
Figure 3.
Average response rate and contribution of MM e-survey, 2009–2019.
The e-survey in NEWSS begins with ID registration by respondent. Each registered respondent will be given a user ID and password to access the related web questionnaire and to submit the required information. This aims to prevent duplication and errors in submission by the respondent. It also means every individual data is traceable and supports better data management. The completed questionnaires will be sent directly to DOSM via the internet. The information recorded in the questionnaire is directly transferred to the database in the DOSM server. At the same time, to ensure the confidentiality of individual data, only authorised officers can access the system to read, verify, and update the information in the database.
The department has outlined a few operational strategies to ensure QCS and MM e-surveys becoming the primary choice of respondents. These include:
(i) Determining target e-survey response rates to be achieved by FE;
(ii) Sending pamphlets and brochures on e-survey to establishments to promote e-survey;
(iii) FE with a good relationship with respondents to contact (call, email, or visit) and invite, as well as follow up with all non e-survey respondents to participate in e-survey;
(iv) Organising e-survey hands-on sessions at least once a year at every state office to educate respondents to use e-survey;
(v) Assisting respondents in e-survey ID registration during site visit or by follow-up call.
The increase in the use of e-surveys is expected to help reduce human error and data outliers because the system performs a preliminary review of the received data. Other than the individual ID and password, the application of a hypertext transfer protocol secure (HTTPS) aims to give extra data security in terms of information being lost during data transfer to the DOSM server.
3.Results
The initiative to offer an MM e-survey in 2009 received a great response from the establishments and contributed to the increase in survey response rates, according to two measures.
Firstly, the average number of completed MM questionnaires received increased to 88.7 per cent in 2019 from 73.2 per cent in 2009 (Fig. 3). The average response rate here being the total number of completed questionnaires received in twelve months divided by the total number of establishments selected in the reference year.
Secondly, the average MM e-survey response rates/ contribution measures the total e-survey questionnaires received in the reference year over the total number of completed questionnaires received each month in the reference year. This increased tremendously from 21.5 per cent in 2015 to 41.5 per cent in 2019.
The average response rate may be considered as better to evaluate the strategies to increase e-survey instead of monthly response because of establishment take a few months to register, learn and get used to continuing to respond by e-survey. MM e-survey response rate increased tremendously in 2012 and 2013 was contributed by the system improvements, FE have become proficient in MM e-survey, State Office started giving hands-on training sessions to respondent starting in 2012 and site visit to promote e-survey. A decrease in response rates was experienced in 2014 and 2015. This was attributed to the changing of the sampling method for the selection of establishment, meaning some of the e-survey’s establishments that had responded previously were not selected in the sample.
Figure 4.
Average response rate and contribution of QCS e-survey, 2013–2019.
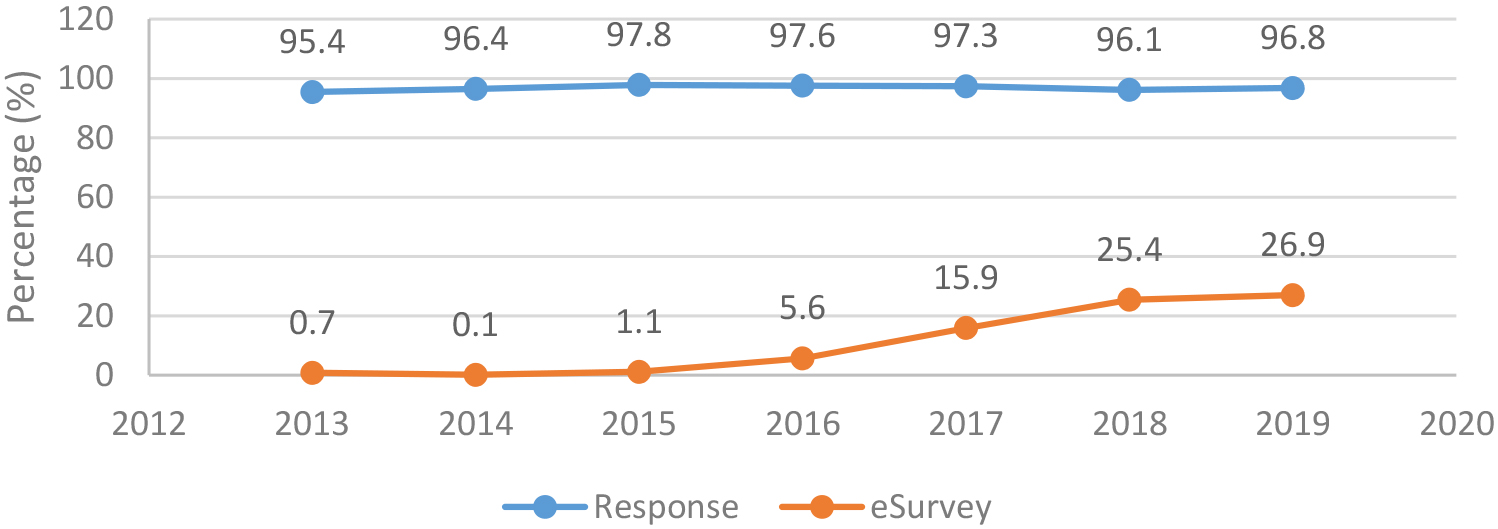
Figure 5.
MM e-survey response rate, and system bug and change request, 2009–2019.
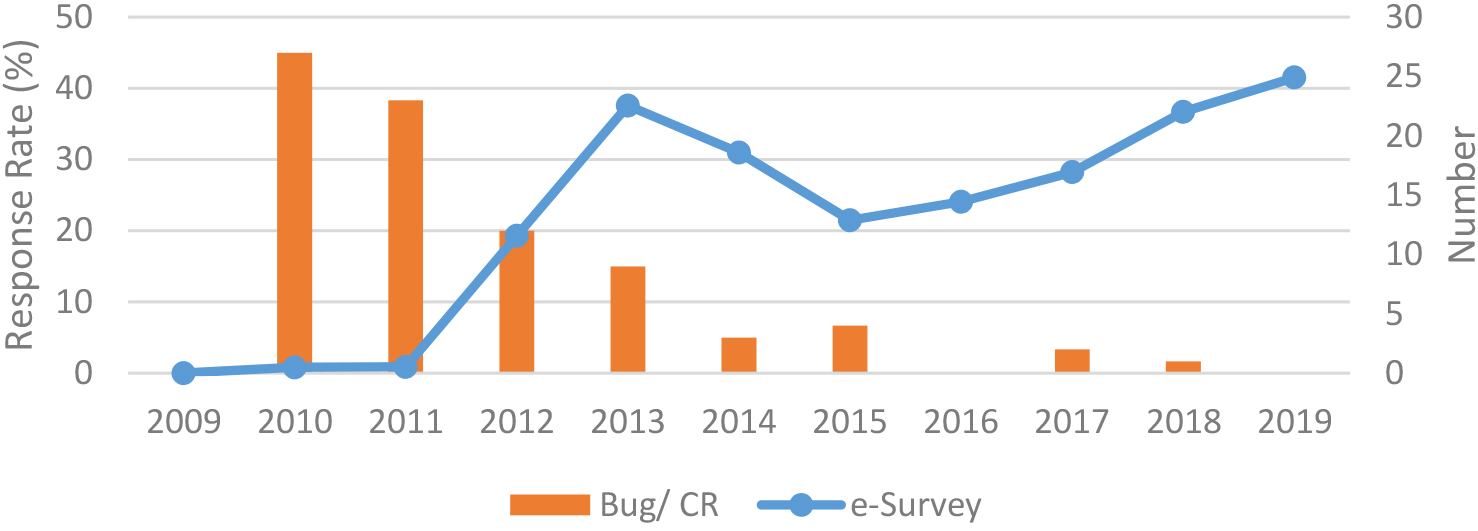
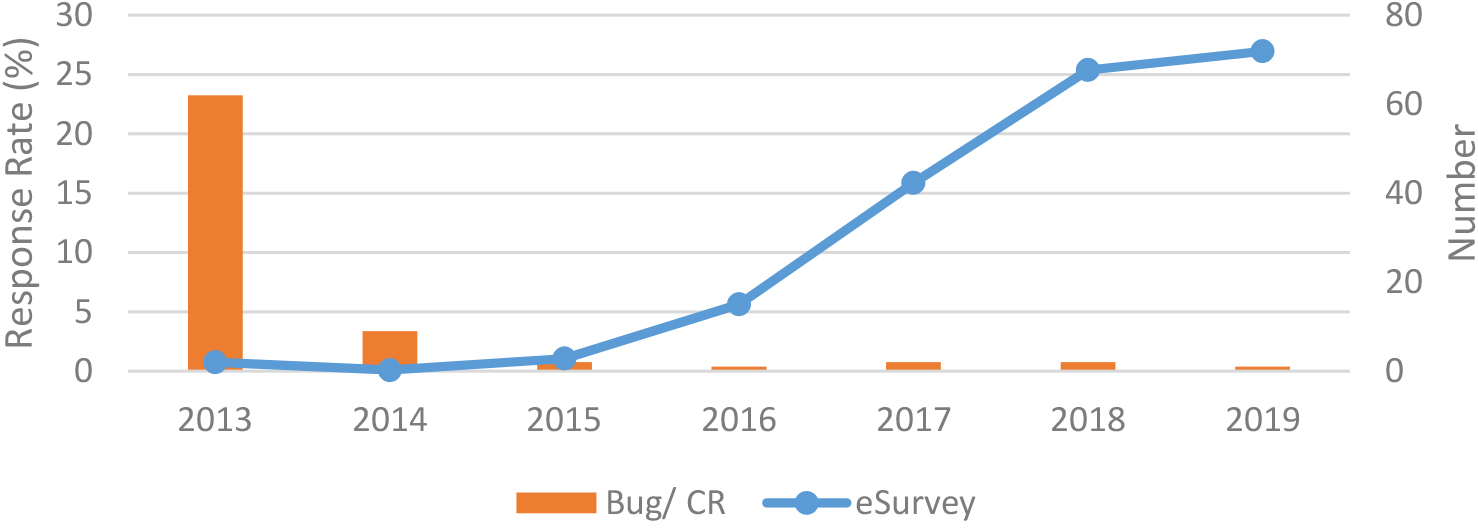
Figure 6.
QCS e-survey response rate, and system bug and change request, 2013–2019.
Applying the same strategies, the QCS gained encouraging results using an e-survey. By 2019, more than one quarter of QCS questionnaires were received via e-survey (Fig. 4). The QCS e-survey is increasingly popular for construction companies because it gives a longer period than other methods to qualify for the ‘CCD’ points in returns programme. The Contractor Continuous Development (CCD) programme is designed to ensure contractors registered with the Construction Industry Development Board (CIDB) are continually well-informed. A CCD point is acquired for contractors to renew their registration. The e-survey offers a more convenient and secure way for respondents to return the completed questionnaire to the Department and data received is better in quality.
In the early stages of implementing the e-surveys, the DOSM spent about three years to promote and educate respondents in using the system. At the same time, the respondents provided suggestions for improvements and any identified system weaknesses were redesigned. This resulted in the number of e-survey returns increasing and respondents’ complaints decreased significantly after 3 years (Figs 5 and 6). The total number of system bugs identified for the QCS e-survey was significantly higher than the MM e-survey at the development stage and decreased significantly when both e-surveys shared the same platform and experienced IT personnel.
QCS and MM e-survey response rates continued to increase from 2015 to 2019 mainly contributed by the higher internet usage in the manufacturing and construction sectors from 2015 to 2017 [9, 10]. Use of internet in business by manufacturing and construction establishments registered 88.1 per cent and 67.7 per cent in 2015 respectively. The numbers increased to 89.7 per cent and 85.6 per cent respectively in 2017. The higher internet usage in business opens opportunities for more establishments to respond QCS and MM by e-survey.
Second, the e-survey questionnaire design is simple, clear and enable respondents to provide information according to their time, receive a good response from respondents. The main challenge in providing QCS and MM survey information is the coordination of data between divisions. E-surveys allow data filling in stages have helped respondents from miss place data received at different times and divisions. Additionally, the system was designed to send reminder to uncomplete respond one week before survey closing date, boost response rate at the last week of survey.
Figure 7.
Contribution of MM survey response by mode, 2009–2019.
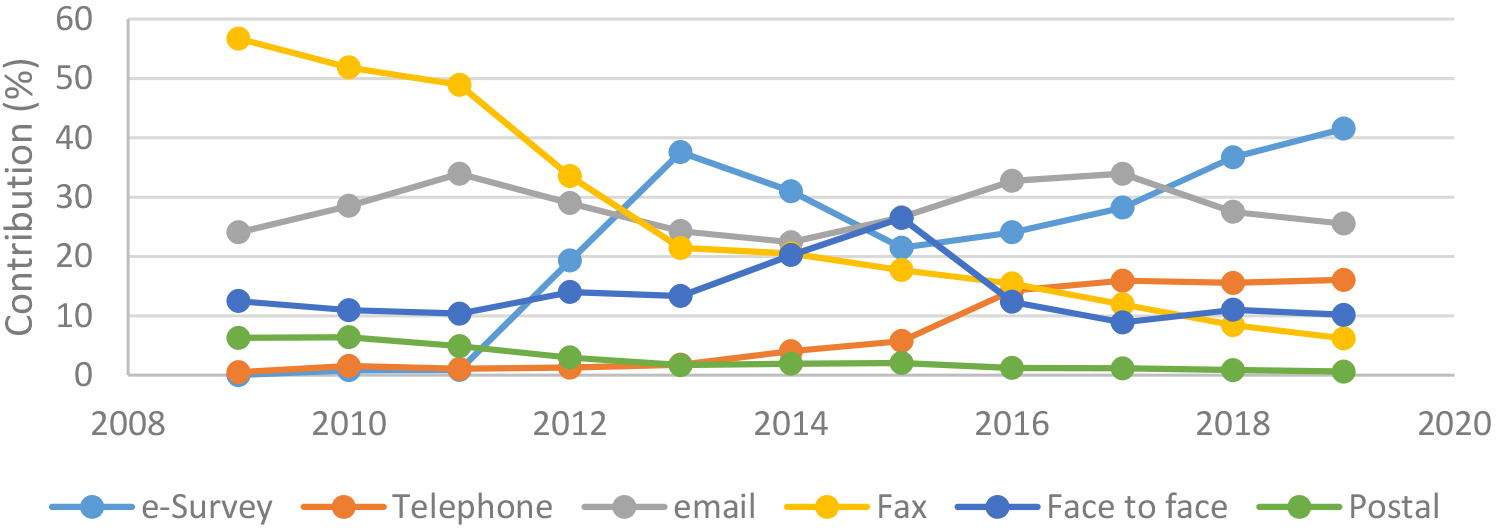
Figure 8.
Contribution of QCS response by mode, 2013–2019.
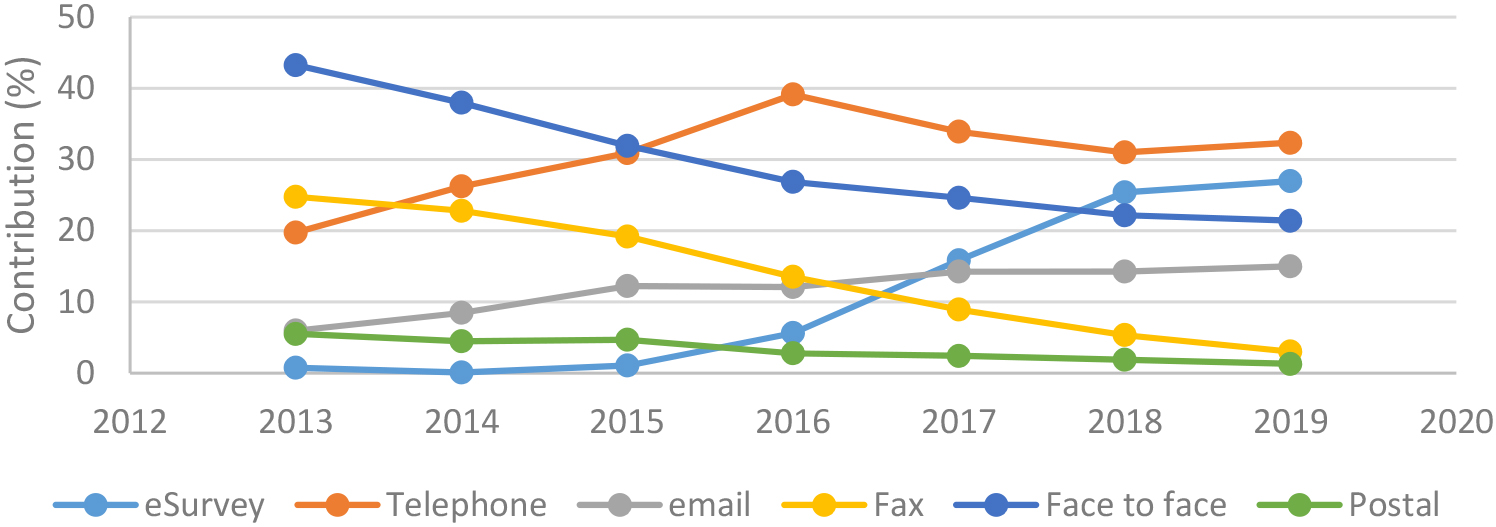
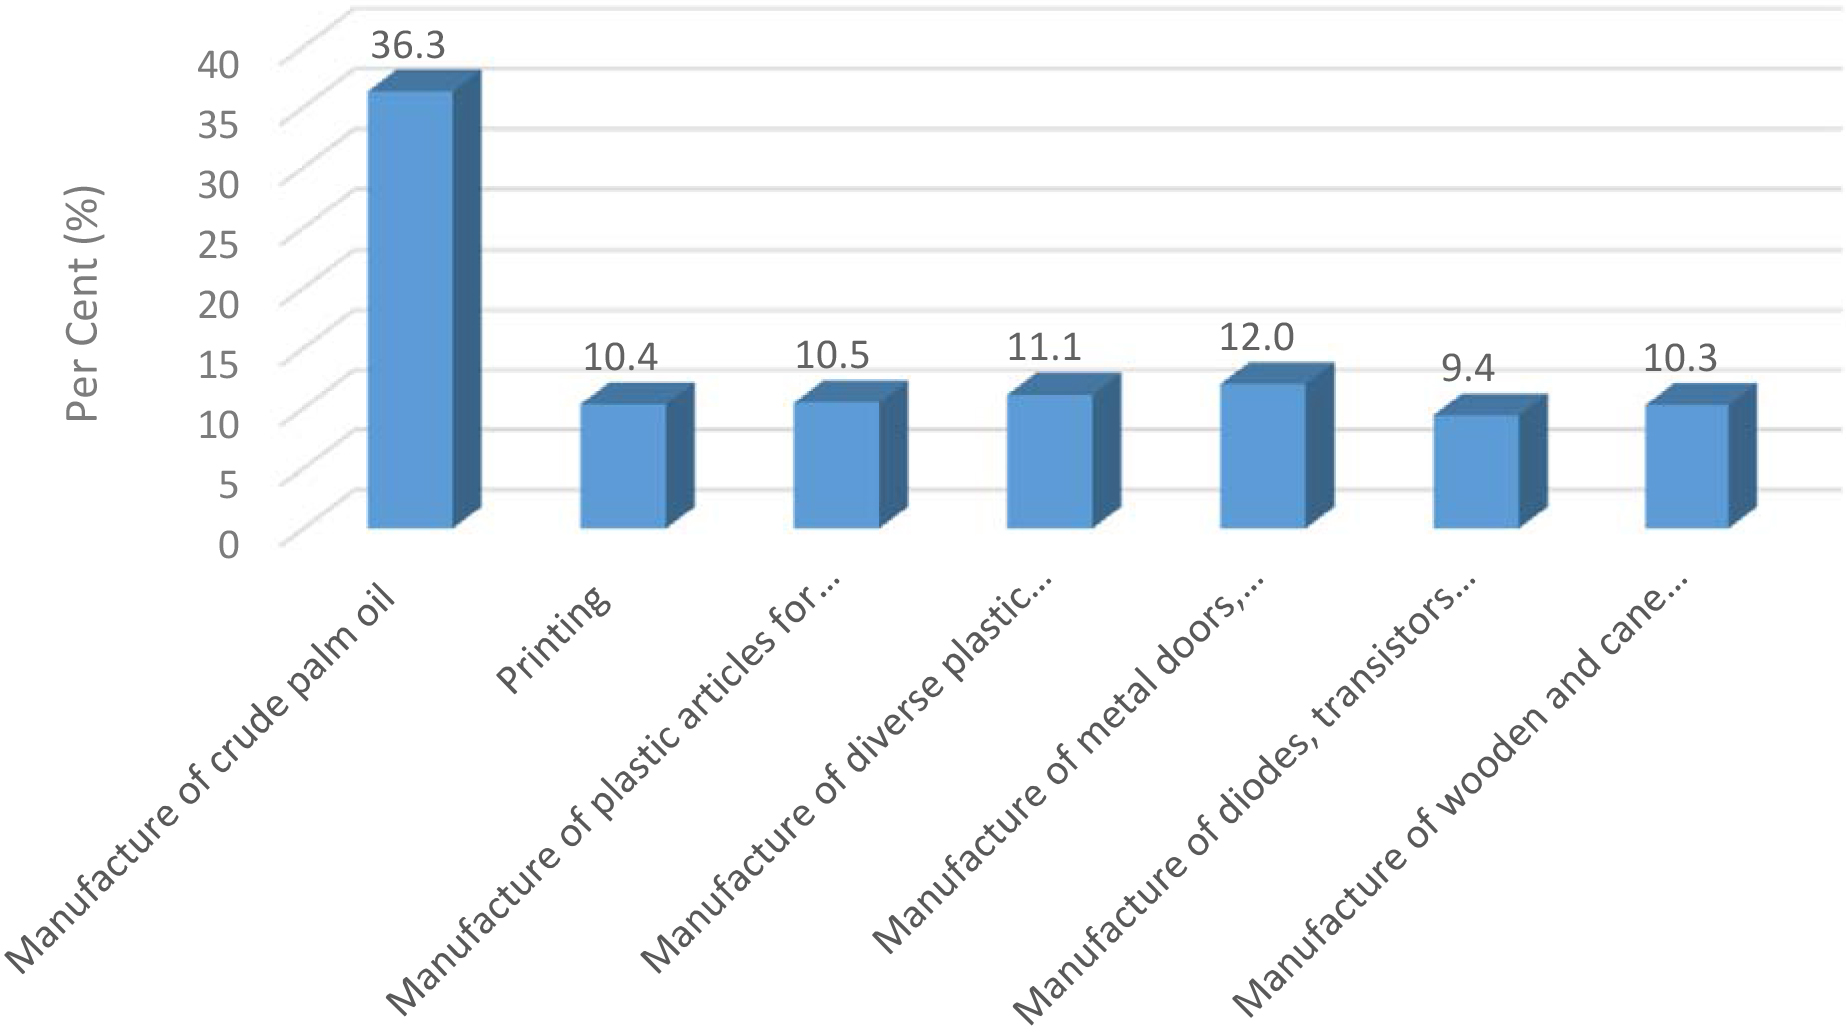
Figure 9.
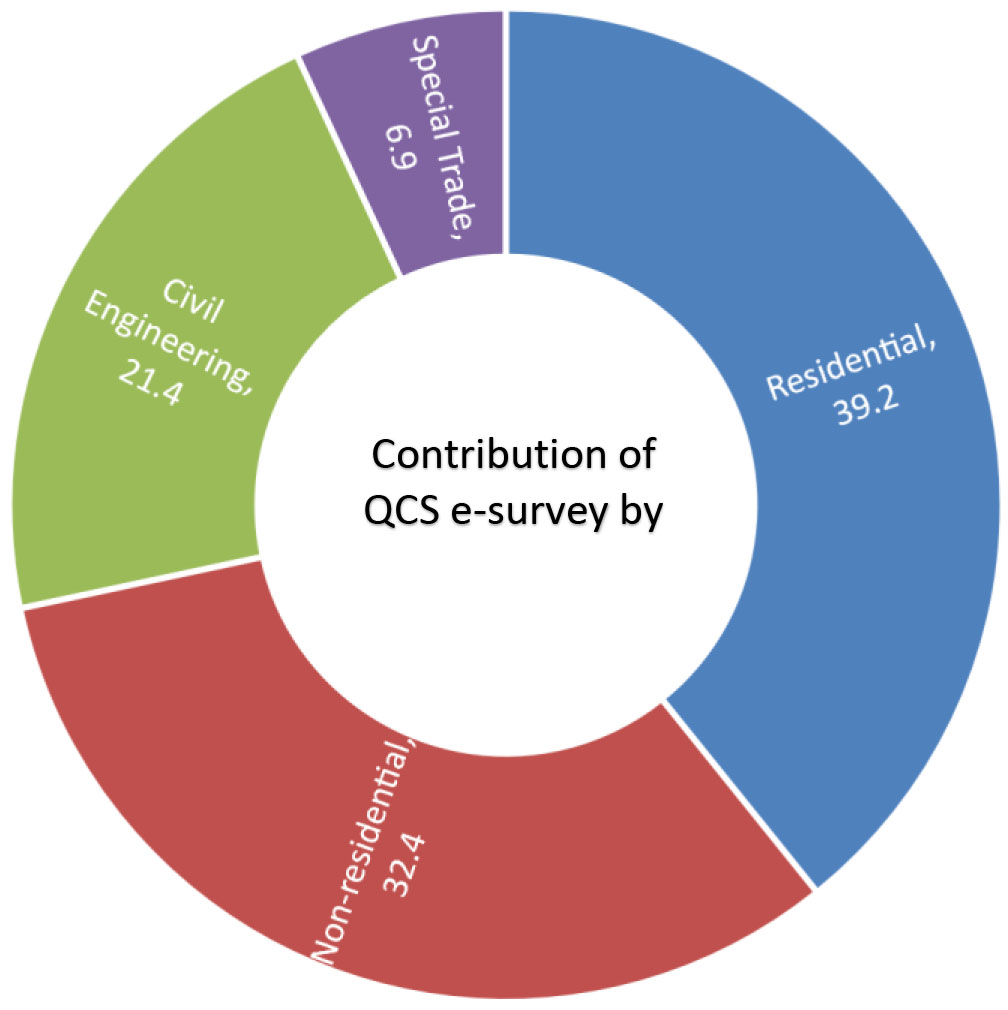
Figure 10.
Contribution of MM e-survey by sub-sector.
Third, QCS and MM surveys are recurring surveys with the same sample. Thus, FE was given KPI to get response from the e-survey. FE with a good relationship with establishments has contacted the respondents and explained the advantages of e-survey, as well as providing hands-on training during the visit. The e-survey account registration assistance and one-to-one hands-on training convinced respondents to use the new methods in submitting complete questionnaire to the Department.
According to the latest QCS and MM e-survey user profiles, establishments in the Residential sub-sector (39.2%) and the Manufacture of crude palm oil sub-sector (36.3%) used the e-survey the most (Figs 7 and 8). Further studies show that most establishments in these sub-sector use computers and internet in business. Respondents responsible for the survey are at position executive and above with higher education level and skilled in using computer. The number of women is higher in these sub-sectors compared to others. Establishments in these two sub-sectors are favoured to the e-surveys and should be emphasized to use e-survey, especially those newly selected in the sample.
The percentage of completeness with e-surveys was higher than other methods. This is assumed to be the case as the MM and QCS e-survey design required all the important fields to be filled and information and logic checks are performed before data is transmitted through the system. Respondents will be informed of any detected outliers and asked to provide justification.
Since 2009, there has not been any information returned by the e-surveys that was lost or unreadable. This reflects the application of HTTPS by DOSM to protect respondents’ connection to the e-survey portal. Data sent using HTTPS is encrypted and cannot be modified or corrupted during transfer.
4.Discussion
The contribution of completed questionnaires returned by facsimile and postal decreased significantly since the implementation of e-survey for MM and QCS. In MM, the facsimile returns declined 50.5 percentage points from 2009 to 6.2 per cent in 2019. Meanwhile, the postal returns contracted 5.7 percentage points to record 0.6 per cent in the same period (Fig. 9). The QCS returns via facsimile and postal only contributed 3.0 per cent and 1.3 per cent respectively in 2019, compared with 24.8 per cent and 5.5 per cent in the last 6 years (Fig. 10).
The main reasons of reduction in the use of facsimile and postal services by respondents were uncertainties, data quality, and confidentiality issues. Postal service may lead to delays and misplacement during delivery. Meanwhile, the quality of the facsimile machine print can lead to poor readability and follow up calls from the Department. The additional cost to resend questionnaires and ongoing inquiries are not favourable to respondents. This made respondents more likely to provide information electronically lately and contributing to the increase in receiving questionnaires by email and e-survey.
Receiving information over the phone, especially smartphones is increasingly important as data is needed before the survey deadline and respondents are working in the field. Telephone contributed to 16.0 per cent and 32.3 per cent respectively of the total responses for the MM survey and QCS in 2019.
High response rates in the MM and QCS provide limited space for e-surveys to further improve response rates. The further increase in the e-survey is however expected to contribute to better quality and security of the data received. While facsimile and postal responses have been minimal, telephone is needed for respondents who are not always in the office. Therefore, face-to-face cases is the best to emphasize in using the e-survey because field enumerators are able meet with them regularly. Consideration of respondents using email may also be useful because they are known to have the email required to register for the e-survey.
5.Conclusion and recommendations
Increased computer ownership and access to internet networks by establishments has opened opportunities for NSOs to collect information quickly, effectively, and securely by e-survey. This innovative method benefits both the NSO and the respondents. The implementation strategies/SOP of e-surveys prepared and used previously [15] are still relevant today. As a result, the QCS and MM e-surveys not only boosted overall response rates to 96.8 per cent and 88.7 per cent respectively in 2019 but also contributed 26.9 percent and 41.5 per cent respectively to the total number of questionnaires received.
This study shows the e-surveys can also successfully improve the quality of data by reducing the number of queries to respondents. In the Malaysian experience, logic-based system revisions have successfully reduced human error, and the time and cost required to compile statistics for publication. The time from collection to publication was reduced to less than 6 weeks by 2019. There were also no reports indicating any data lose occurring during the data transmissions to the server since 2009.
However, scientific measures to identify potential respondents are still unclear and increasingly important. Analysis of ‘big data’ based on existing e-survey user profiles are expected to be helpful in increasing the possibility of using e-survey for establishments that are new to completing surveys for official statistics.
References
[1] | Schmidt, W.C. World-Wide Web survey research: benefits, potential problems, and solutions. Behavior Research Methods, Instruments & Computers, (1997) ; 29: (2), 274–279. |
[2] | Couper, M. Web surveys: a review of issues and approaches. Public Opinion Quarterly, (2000) ; 64: (4), 464–494. |
[3] | Sohn, Changsoo. Validity of Web-based Survey in IS Related Research as an Alternative to Mail Survey. AMCIS 2001 Proceedings, (2001) ; 318. http://aisel.aisnet.org/amcis2001/318. |
[4] | Chambliss, D.F. and Schutt, R.K. Making Sense of the Social World: Methods of Investigation. Pine Forge Press, (2009) ; 179. |
[5] | Kalantari, D.H., Kalantari, D.E. and Malekic, S. E-survey (surveys based on e-mail & web). Procedia Computer Science 3, (2011) ; 935–941. |
[6] | Malaysian Communications and Multimedia Commission. Communications and multimedia, Pocket Book of Statistics, Q1 2012, (2012) ; 10. |
[7] | Malaysian Communications and Multimedia Commission. Communications and multimedia, Pocket Book of Statistics, Q4 2015, (2016) ; 6. |
[8] | Malaysian Communications and Multimedia Commission. Communications and multimedia, Pocket Book of Statistics, 2018, (2019) ; 10. |
[9] | Department of Statistics Malaysia. Economic Census 2016 – Usage of ICT by Businesses and e-commerce. (2017) ; 69. |
[10] | Department of Statistics Malaysia. Usage of ICT by Businesses and e-commerce by Establishment. (2019) ; 43. |
[11] | Groves, R.M., Fowler, F.J., Couper, M.P., Lepkowski, J.M., Singer, E. and Tourangeau, R. Survey methodology (2nd ed.). Hoboken, NJ: John Wiley, (2009) . |
[12] | Dillman, D.A. Mail and internet surveys: The tailored design method (2nd ed.). New York: John Wiley & Sons, (2000) . |
[13] | Porter, S.R. and Whitcomb, M.E. The impact of contact type on web survey response rates. Public Opinion Quarterly, (2003) ; 67: , 579–588. |
[14] | Bengü Börkan, M.A. Effectiveness of mixed-mode survey designs for teachers using mail and web-based surveys, The Ohio State University, (2006) . |
[15] | Jamaliah Jaafar. e-Survey di Jabatan Perangkaan Malaysia. Journal of Department of Statistics, Malaysia, Volume 1 2012, (2012) ; 41. |

