
Towards big data as official statistics: Case study of the use of mobile positioning data to delineate metropolitan areas in Indonesia
Abstract
Nowadays, the use of so-called big data as a new data source to complement official statistics has become an opportunity for organizations focusing on statistics. The use of big data can lead to a more efficient data collection. However, currently, there has not been any standard business process for big data collection and processing in BPS-Statistics Indonesia. Meanwhile, the adoption of technologies alone cannot determine the success of big data use. It is widely known that big data use can be challenging, since there are issues regarding data access, quality, and methodology, as well as the development of required skillsets.
This paper proposes a framework for a business process that is specifically designed to support the use of big data for official statistics at BPS-Statistics Indonesia along with how existing technology will support it. The development of this framework is based on the wider Statistical Business Process Framework and Architecture (SBFA) developed by BPS-Statistics Indonesia to describe and manage its overall statistical business processes. The paper uses the example of the use of Mobile Positioning Data (MPD) as a big data source to delineate Metropolitan Areas in Indonesia as a way to explain the implementation of the framework.
1.Introduction
As stated in the Statistical Law of Indonesia, BPS-Statistics Indonesia is allowed to collect data through censuses, surveys, administrative data from various government institutions, and through the means of modern science and technology. Contrary to data collection from censuses, surveys, and administrative data, which are performed regularly, data collection using modern science and technology is still in the early exploration phase, especially the use of so-called big data as a new data source to support official statistics. Based on Gartner in [1] big data are often characterized by 3Vs which is high-volume, high-velocity, and high-variety. Meanwhile, the United Nations Economic Commission for Europe (UNECE) classifies types of big data into three classes, which are social networks, traditional business systems, and internet of things [2]. With its characteristics, the use of such big data is expected to reduce the time needed to deliver official statistics to the public and respondent burden, which in turn should increase cost effectiveness. However, big data does not only offer benefits but also brings challenges. The most common challenges are related to data quality and accessibility, along with having the required expertise to exploit this data source effectively [1], also in designing effective business process models that adapt to the emerging big data environment.
Figure 1.
Statistical business framework architecture (SBFA).
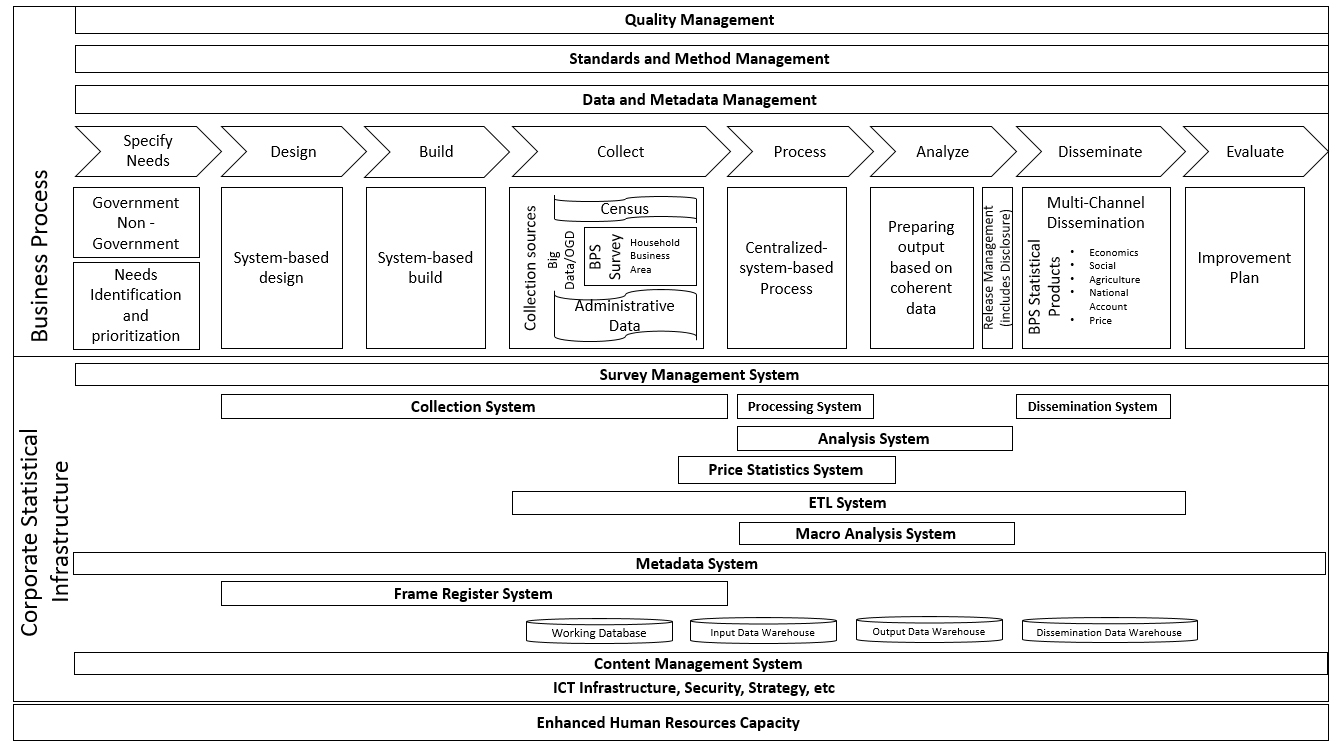
It needs to be emphasized that BPS-Statistics Indonesia uses the Statistical Business Process Framework and Architecture (SBFA), a framework that was developed based on the Generic Statistical Business Process Model (GSBPM), as a guideline to conduct its statistical activity. Similar to the GSBPM, the SBFA contains eight main processes from “specifying needs” up to “evaluating the process cycle” [3]. As clearly stated in the UNECE Official website, “GSBPM is designed to be applicable regardless of the data source, so it can be used for the description and quality assessment of processes based on surveys, censuses, administrative registers, and other non-statistical or mixed sources” [4]. Since SBFA are based on GSBPM, it is justified to assume that it is also applicable to various data source. In addition, the SBFA also provides a detailed statistical activity procedure for several product classes, for example census and survey data, national accounts data, and derived data. However, a firm business process for big data use has yet to be defined in BPS-Statistics Indonesia. Whereas in order to take full advantage of big data, a standardized procedure is very much needed like the other product classes.
This paper aims to explain a framework specifically designed to support the use of big data in official statistics, along with how existing technology in BPS-Statistics Indonesia will support it. The paper will use the example of Mobile Positioning Data (MPD) to delineate metropolitan areas in Indonesia as a way to explain the various transformation processes in SBFA. This paper is divided into several sections, Section 2 will describe the methodology used in designing the framework, Section 3 will explain the implementation of framework, and Section 4 will discuss conclusions and recommendations.
2.Methodology and framework
The BPS big data framework has been designed to support the effective integration of big data-derived statistics in the business processes of BPS-Statistics Indonesia. Several steps are conducted to design the framework, which are: identifying the problem, initial design, implementation of use cases, and continuous improvement. The business processes and supporting technology stated in the SBFA is used as an input during literature study and the design of the business process. SBFA as in Fig. 1 provides a blueprint as to how to structure BPS’s processes and ICT infrastructure [3].
Table 1
Big data use in BPS-Statistics Indonesia
| No | Big data source | Supported official statistics |
|---|---|---|
| 1 | Mobile Positioning Data (MPD) from major Mobile Network | Delineating Metropolitan Areas |
| Operator (MNO) | Commuting pattern in major cities | |
| Tourism Statistics: Number of domestic visitors | ||
| Migration Statistics | ||
| 2 | Web scraping from accommodation and hotel websites | Tourism Statistics: Hotel occupancy rate |
| 3 | Web scraping from marketplaces | Price Statistics: Consumer Price Index |
| 4 | Web scraping form Google trends and twitter | Employment Statistics, including the unemployment rate |
2.1Identifying the problem
In the digital era, data may be considered as becoming ubiquitous and obtainable through increasingly various sources. One of the statistics transformation principles stated in the SBFA is the use of paperless data collection. Data can be collected in digital formats using non-traditional data collection modes, such as Computer Aided Web Interviewing (CAWI) and Computer Assisted Personal Interviewing (CAPI) or using automated acquisition from other systems through ETL (Extract, Transform, Load) tools and machine-to-machine approaches. This principle combined with a modernization strategy to conduct better acquisition and use of technology, alongside the existence of vast amounts of digital data now being produced by human and machine activity, becomes a strong reason to enrich big data use. Since 2016, BPS-Statistics Indonesia has therefore performed various preliminary studies and researches regarding the use of big data to support the production of official statistics. From several researches and experimental uses of big data in BPS-Statistics Indonesia that stated in Table 1, the use of MPD to produce commuting and tourism statistics are close to becoming official statistics.
These researches and experiments give clear evidences that the use of big data as a data source indeed changes several aspects in the statistical business process. In the Design phase, the sampling activity is not usually relevant considering the data source that is being used is pre-existed/given [4]. In the Build phase, the common traditional collection instrument is the questionnaire, be it paper based or more recently paperless, whereas big data usually require collection tools such as a scraping tool or web service. In the Collect phase the changes are most noticeable, since data are not obtained directly through respondents but through systems/machines. In big data collection, there are significant implications for the way in which sampling and field work could be used. Besides that, there are also some adjustment in Processing until the Dissemination phase.
To overcome these differences and ensure the quality of future implementations, using big data for producing official statistics needs to be based on a clear and standard business process model, similar to census or survey data and other product classes. Business process implementation also needs the support from stakeholders, human resources with certain skillsets, and specific technology and infrastructure. The integration of all components will also increase the likelihood of success in big data use. Therefore, BPS-Statistics Indonesia has started designing a framework for big data use, including the required architecture, the business process, and the supporting technology platform.
2.2Designing the framework
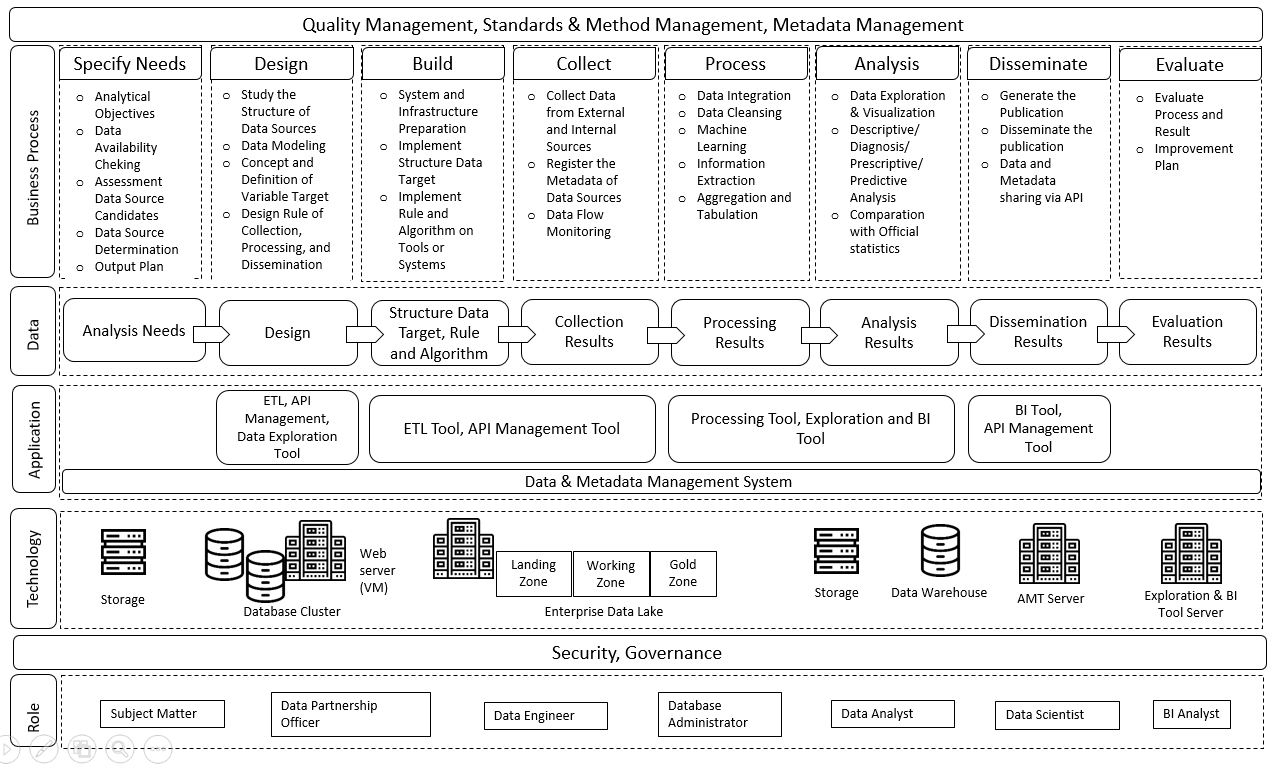
The framework for a big data is being developed to answer the problem in big data use in BPS-Statistics Indonesia and is based on Enterprise Architecture (EA) principles and the BPS SBFA. The proposed framework, as shown in Fig. 2, consists of four main layers: business, data, applications, and technology. The rest are supporting layers that ensures the main layer would work smoothly. The explanation for each layer is as follows.
Figure 2.
Design of BPS big data framework.
2.2.1Business process layer
The Business layer is the first thing that needs to be designed because this layer determines the data flow, along with the applications and technologies required to improve business value. Considering the huge amount of potential big data to be explored, some might prefer to collect as much data as possible without carefully considering the actual output they need. However, it would be wise to perform a preliminary literature study and assessment to obtain clear objectives for any data analysis based on user needs, and not merely driven by data availability. According to [5], more data does not necessarily mean more insights. Referring to the United Nations Statistical Quality Assurance Framework (UN-SQAF), big data does not need to be treated differently from other potential data sources in the Specify Needs phase [6]. Big data’s potential as a data source in producing statistics needs to be evaluated just like any other data sources through an assessment of whether the collected data would meet user requirements and, if it does, then how to efficiently obtain and process that data.
The business process layer in this proposed framework offers a solution to overcome the different treatments that are needed to handle big data. In the Design phase, it is more recommended to study the structure of the data source and select the required variables compared to the needs of the design frame and sample. In the Build phase, the focus is on preparing the system and infrastructure along with implementing the designed rules and algorithms for data collection in the system. In the Collect phase, data collection activity in principle can start right away without the need of either sample selection or field-force management, although sampling issues and field-force type interactions may need to be addressed later to deal with emerging quality issues. There are also some differences in the Process and Analyze phase, mostly in the statistical method. In addition to traditional statistical methods, the processing and analyzing of big data often uses machine learning and information extraction. It is also important to compare big data results to relevant official statistics and other data during the Analysis phase for benchmarking or calibrating. The result of this benchmarking and calibrating can then be used to determine the appropriate type of publication during the Dissemination phase.
All of the existing processes are open to iteration, meaning it is possible to roll back into previous processes when adjustment is deemed necessary in big data use. It is also important to consider the benchmarking result before deciding whether the results would be published as official statistics, supporting information, experimental statistics, or even a mere research paper or report. In order to publish official statistics from big data sources, a lot more things need to be properly validated and assured. Therefore, it is important to define quality assurance indicators to help monitoring the success in each phase, not least in monitoring whether user needs can be met under the required dimensions of data quality. For example, in UNECE Big Data Quality Framework, there is the selectivity dimension. This dimension explains how it would be helpful to have a reference data set to measure the coverage of the data source obtained from big data. The result of this measurement can then be used to address the issue of data representativeness before publishing the result from big data as official statistics.
Figure 3.
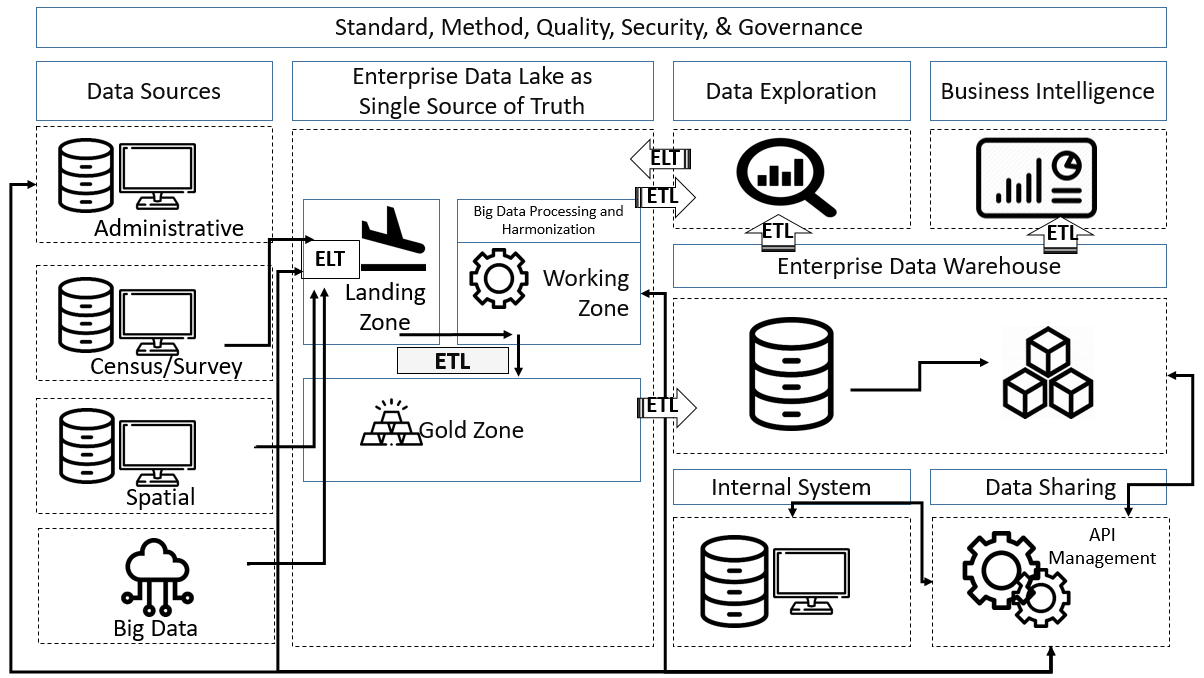
Design of a big data platform.
2.2.2Data layer
The Data layer represents the data components that need to be considered in each process. Figure 2 shows that the data layer encompasses the main output in each process, which if detailed will result in many entities and attributes. For example, the Process phase requires both data structure modeling for the expected results from data cleansing and information extraction, as an input to produce relevant clean data and tabulations as an output. Data needs to be linked to its metadata to help users understand the data and further address data quality issues such as timeliness, completeness, and consistency with other relevant data. Each process should produce metadata that later will be used for the next process. With well-documented metadata, its reusability would be possible. This will furthermore help other divisions in BPS-Statistics Indonesia to learn from and re-create/adapt previous big data projects, be it in the analysis of the purpose, rules and algorithms, collected variables, or the analysis and evaluation of the results.
2.2.3Application layer
The Application layer describes the supporting systems that enable each process to run well. The way each system contributes to the business process is shown in Fig. 2. The previously mentioned data and metadata will serve as inputs and outputs that will flow from/to the data and metadata management systems (DMS and MMS respectively). Among all those systems, DMS and MMS are enablers that provide over-arching support throughout all business processes. Systems like an Application Programming Interface (API) Management Tool also can be used every now and then as a main means of communication for all systems regardless of the business process.
Figure 3 shows the process flow in a DMS as a single source of truth in a big data platform. Data sources can be obtained through administrative products, census, surveys, external websites, and even internal systems. Related to the resources that are needed for big data storing and processing, there is an alternative option to access data from big data providers. Data providers and BPS-Statistics Indonesia can collaborate in sharing resources such as raw data. The data could remain in a data provider’s repository and a data engineer from a BPS-Statistics Indonesia can process the data using the data provider’s resources. The processing results in the form of aggregate data could then be accessed and stored in BPS-Statistics Indonesia repository. All data will be stored in a working database and later than be loaded into an enterprise data lake (EDL). There are several zones in an EDL: landing (for newly loaded data with incomplete metadata), working (for data processing in EDL), and a ‘gold’ zone (for processing results and storing data with complete metadata). Data in the gold zone will then be loaded into a data warehouse for further access by internal systems and the dissemination system via an API. A Business Intelligence (BI) Tool can then access data from the EDL gold zone and the data warehouse.
2.2.4Technology layer
The Technology layer describes the infrastructure used in the big data ecosystem. The biggest difference in the technology layer for big data is the existence of an EDL, which contains several nodes that are used to store and process large data in a distributed approach. Besides the EDL, there are database clusters, data warehouses, and other kind of storages each for certain purposes. There is also a dedicated server for an API Management Tool to support data interoperability and a BI tool to support data visualization. The use of all these technologies are optional and can be adjusted accordingly.
2.2.5Roles
An appropriate division of roles is vital to ensure that business processes run smoothly. In using big data, BPS-Statistics Indonesia takes the role of data consumer and if needed could coordinate with data providers and other NSOs who have conducted big data projects before [7]. Besides that, each role must communicate with all other so that the result would be in concordance with the predefined output. There are several proposed main roles: Data Partnership Officers, Subject Matter Experts, Data Engineers, Database Administrators, Data Scientists, and BI Analysts.
2.2.6Quality management, standard and method management, metadata management, security, and governance
2.2.6.1. Quality management
Quality management is a mechanism to ensure the quality of each performed business process, including inputs and outputs, in order to meet the needs of users. Even if the big data project is a mere exploration or experimental, quality aspects should always be taken into account for optimal results. Quality has an important role in building confidence in the products produced by NSOs. Each NSO can develop their own Statistical Quality Assurance Framework (SQAF) as a guideline for producing better quality statistics. For example, a quality assurance framework (QAF) addressing the assurance of quality at each stage of processing: 1) quality of input data, 2) quality of statistical processes (throughput), and 3) the quality of the product (output). With these three stages of quality assurance, the quality of statistical data will be well maintained because it is always checked at every stage of the process of statistical production. However, it is important to note that assessing the quality of big data is quite different from those of traditional datasets. Referring to Big Data Quality Framework (QAF) designed by UNECE Big Data Quality Task Team, three general principles are proposed when evaluating Big Data quality [8]:
• Fitness for use, that is ensuring that the data source is appropriate for the purpose
• Generic and flexible, the quality dimensions should be general and applicable for various situations
• Effort versus gain, the effort taken to obtain and analyse the data should worth the gained benefits.
2.2.6.2. Standards and methods management
In conducting statistical activity, BPS-Statistics Indonesia implements statistical standards to ensure user needs are met, not least in the comparability of the produced output, be it nationally or internationally. Beside standards, there would be a statistical method used in the Design phase and its implementation in the Collection, Processing, and Analysis phases. For big data, there are several underlying issues, such as how to create a general and replicable model. With the uncertainty factor in big data, repetitive simulations are required to evaluate the model [9].
2.2.6.3. Metadata management
Similar to the GSBPM, the SBFA uses metadata as a key element that can be obtained and recorded through each phases in statistical business process. Metadata can be collected manually or automatically in using system services and it also can be reused. In statistical activity the functions of metadata could be described as follows [3].
1. Metadata can be used to manage standards, methods, classifications, and quality issues relevant to any statistical activity. Proper documentation can help BPS-Statistics Indonesia to explain the methodology in producing official statistics to data users.
2. Metadata is a communication tool between systems. Integration between systems can be implemented with the help of metadata, as it will ensure that each system uses the same standards. It will also support automation in statistical business process.
3. Metadata improves data management because all information related with data storing, processing, versioning, and accessing can be stored using metadata.
2.2.6.4. Security
As an additional layer, security is related to mechanisms that ensure all components involved in the statistical business process run in a secure manner. For a properly secure architecture, support from governance, including policy and procedure, in business layer is important to ensure compliance during its implementation in data, application, and technology layer.
2.2.6.5. Governance
Governance relates to guidelines consisting of policies and procedures that will be implemented throughout running the processes. These guidelines could be detailed into their technical aspects and later be applied in the application and technology that is being used. For example, a policy is established to ensure that collected data must have and be linked to its metadata.
2.3Implementation of framework
After identifying the problem and designing the framework, implementation by use cases should be conducted to evaluate the proposed framework. In this phase, layers in the big data architecture are implemented and adjusted according to the use cases. The Data, Application, and Technology layers will follow the business process needs. Standards, method, quality, security, and governance considerations are also implemented in each of these main layers. Meanwhile, roles are determined at every phase in business layer. This paper will set out the results of applying a use case to the Framework.
2.4Evaluation and improvement
Evaluation can be conducted by comparing the previous state before framework implementation and after its implementation. The comparison can be seen from the perspective of inputs, processes, and outputs. The evaluation phase will provide results such as alternatives for the improvement of inputs, processes, outputs, and a general road map for improvements.
3.Implementation of BPS big data framework
BPS-Statistics Indonesia has been using mobile positioning data (MPD) for inbound tourism statistics since 2016 also commuting and domestic tourism statistics since 2018. MPD that used here is passive positioning data obtained from Mobile Network Operator (MNO). For inbound statistics, the data used is signaling data, while for commuting and domestic tourism both signaling and Call Detail Record (CDR) data are used. Currently, the utilization of MPD is being explored for other purposes such as metropolitan statistical area (MSA). For MSA, MPD was employed to measure mobility patterns by connecting inter-temporal locations. The following section will explain the use of MPD to delineate Metropolitan Areas in Indonesia as a use case for implementing the proposed big data framework.
3.1Business process layer
The Government of Indonesia through the National Medium-term Development Plan (RPJMN) has a major project in urban development which aims to reduce inequality and ensure equity [10]. It sets out that the development of metropolitan areas – as economic growth centers – outside of the island of Java needs to be increased, because urban development in Indonesia is too Java-centric. In this regard, proper methods to delineate metropolitan areas are urgently needed. It is expected that metropolitan areas in Indonesia can be delineated properly so that national spatial and budgeting planning could be conducted appropriately.
The United States is one country that had used a metropolitan approach in budget planning. The US Office of Management and Budget used the term MSA to provide standard statistical area delineations in the country [11]. The general concept of MSA is associated with the urbanized large population area. The area consists of an urban core plus surrounding hinterlands that have a high degree of integration with the urban core. One aspect that can be used to measure the degree of integration are commuting patterns. A high percentage of an outlying area’s residents who commute to the urban core for work may indicate the high degree of social and economic integration between areas.
Commuting patterns can be measured with commuting statistics. BPS-Statistics Indonesia has already produced commuting statistics using a conventional survey since 2014. However, due to the budget constraints on conducting surveys, commuting statistics can only be produced every 2 years in 5 metropolitan areas consecutively. The statistics are also limited to regency/municipality level (the second level of local area unit in Indonesia). In addition, it takes a long time to conduct conventional surveys, from designing it to disseminating the results. These limitations have driven BPS-Statistics Indonesia to begin exploring another source of data to produce official statistics. From experience of working with MPD, it has been shown that it is possible to produce statistics in a shorter time lag, at a lower level of administration area, and to increase the coverage without increasing the budget.
Figure 4.
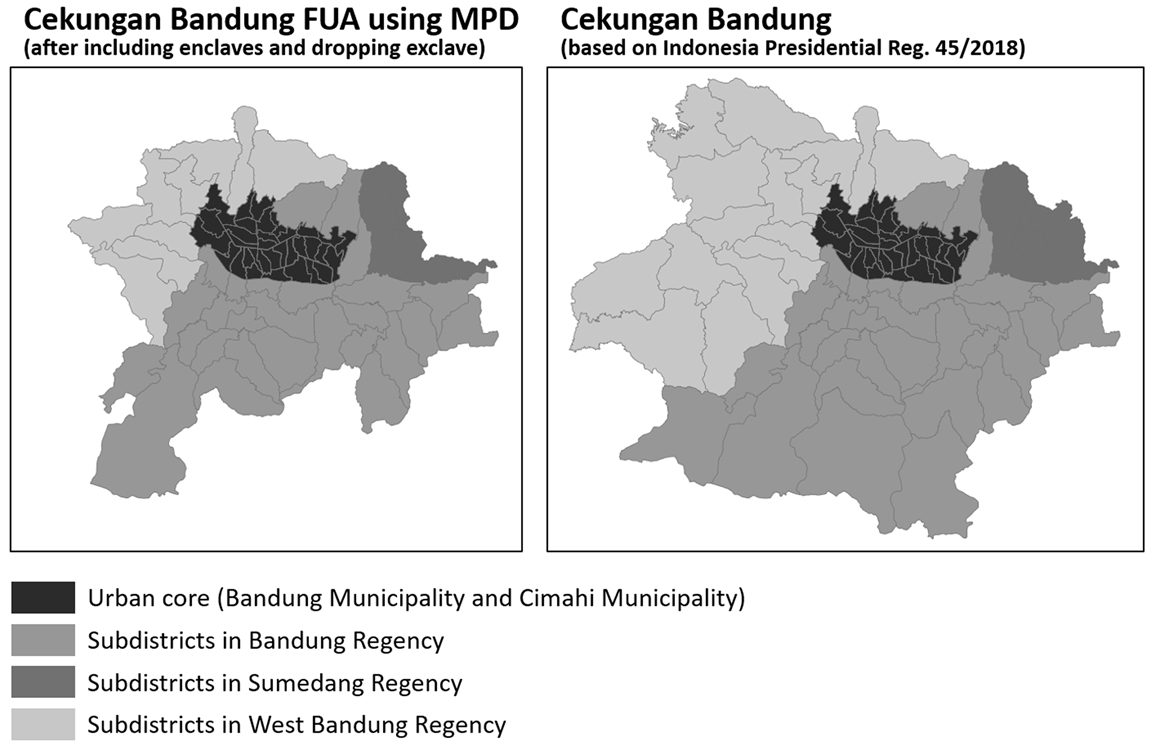
Cekungan bandung delineation.
In 2019, BPS-Statistics Indonesia worked with the Indonesian Ministry of National Development Planning (BAPPENAS) to conduct a pilot project. The project explored the use of MPD to delineate metropolitan areas, with a case study in Cekungan Bandung, one of the metropolitan areas that have been delineated. Cekungan Bandung was used because the MPD results were initially planned to be compared with the last commuting survey when the project was conducted. The data itself was obtained from Telkomsel, one of the largest MNO in Indonesia, which is a state-owned private enterprise. There were 50,907 Telkomsel subscribers used as the sample within November 2019. To analyze commuter patterns using MPD, BPS-Statistics Indonesia developed algorithms to identify commuters and estimate commuting flows at sub-district level (the third level of local area unit in Indonesia). The commuting flows were used to measure the integration between the urban core and surrounding hinterlands in Cekungan Bandung.
The Design phase was conducted by BPS-Statistics Indonesia, whereas the Build and Collect phases were conducted by Telkomsel. For Process Phase, BPS-Statistics Indonesia developed the algorithms and logic of processing by exploring raw data samples of MPD. After it is ensured that the algorithm work correctly in producing the expected output, Telkomsel then performed the algorithm against all collected data. Telkomsel has a Public-Private Partnership agreement with BPS-Statistics Indonesia, Telkomsel started storing the MPD – which came from their subscribers signaling data – over a longer period and developed capabilities for processing it [7]. To verify the result of MPD algorithms, the validation process was carried out using some volunteers who were a subset of Telkomsel subscribers. The volunteers verified or annotated their movements through a travel diary survey. The algorithms results from the MPD were then compared with the results of the volunteers’annotations that used an application called MEILI. Therefore, there is a repetition of process from the Design phase until the Process phase in the statistical business process for the MPD to ensure data validity.
Furthermore, from the final aggregate data obtained from Telkomsel, BPS-Statistics Indonesia then analyzed it to determine which subdistricts included in Cekungan Bandung should be considered as part of its metropolitan area, by calculating their commuting rate. The delineation from MPD results were then compared to the delineation already determined by the Government of Indonesia [12], to identify which subdistricts were included in the metropolitan area by law but have a low rate of commuting flow. The results will be a recommendation for the Government of Indonesia to help determine a more appropriate delineation by using MPD, especially in Cekungan Bandung. In the future, similar projects will be carried out in other metropolitan area to improve the MPD algorithms and delineation thresholds. Figure 4 shows the visualization of MPD delineation and Indonesian Government delineation comparison on Cekungan Bandung metropolitan area in this study.
Table 2
Example of raw data
| Hashed_msisdn | Datetime | Source_data | Bts_lat | Bts_lon |
|---|---|---|---|---|
| OAC********** | 08/02/2018 13:33:03 | LBA_ALL | 120.35833 | |
| OAC********** | 08/02/2018 13:51:39 | CHG_POST | 120.30377 | |
| OAC********** | 08/02/2018 14:00:33 | CHG_POST | 120.30337 | |
| OAC********** | 08/02/2018 14:03:08 | CALL | 120.30377 | |
| OAC********** | 08/02/2018 14:17:06 | LBA_ALL | 120.38343 |
Table 3
Example of results from determination subscriber’s location process
| Hashed_ msisdn | Start_time | End_time | Province | Regency | Subdistrict |
|---|---|---|---|---|---|
| OAC*********** | 06/20/2019 07:32 | 06/20/2019 09:20 | West Java | Sumedang | Sukasari |
| OAC*********** | 06/20/2019 07:40 | 06/20/2019 08:11 | West Java | Bandung | Cimenyan |
| OAC*********** | 06/20/2019 08:10 | 06/20/2019 08:40 | West Java | West Bandung | Rongga |
Figure 5.
Illustration of the process, data, and application involved in MPD use.
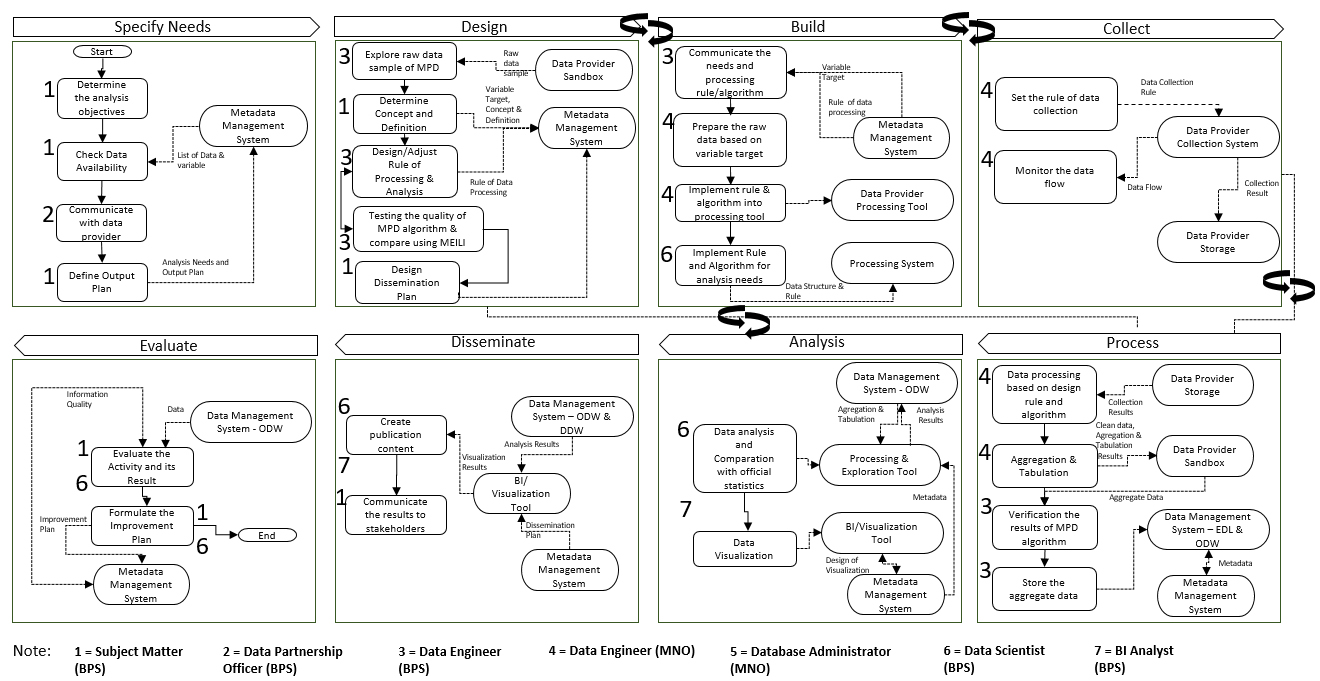
Figure 6.
Functional urban area (Genova, Italy).
The difference between these two delineations depend on the commuting rate threshold used in MPD delineation. The higher the threshold, the fewer subdistricts are included. Based on defined threshold in this study, there were 40 subdistricts included in MPD delineation compared to 52 subdistricts from Indonesian Government delineation. The result suggests that the metropolitan area delineation determined by Indonesian Government on Cekungan Bandung has a lower commuting rate than the threshold. Therefore, it is important to identify the best commuting rate threshold to delineate metropolitan areas in Indonesia.
3.2Data layer
MPD is large-scale location data of MNO subscribers as previously mentioned in the beginning of Section 3. MPD can produce inter-temporal locations of subscribers from the location of their mobile devices (using Mobile Station International Subscriber Directory Number/MSISDN). The location data recorded in the MPD comes from the Base Transceiver Station (BTS) coordinate, which is recorded for every transaction conducted by the subscriber, such as call activities, sending and receiving SMS, signal searching, or activities that require an internet connection. Thereafter, the subscriber’s location is obtained from the location aggregation of the BTS. Examples of raw data and results of subscriber’s location determination can be seen in Tables 2 and 3.
3.3Application and technology layers
There is collaboration between BPS-Statistic Indonesia and Telkomsel in the form of sharing resources such as infrastructure for storing and processing MPD. Telkomsel provides a data sandbox that can be accessed by the data scientists and data engineers of BPS-Statistics Indonesia. Rules are implemented in data accessing in order to ensure the confidentiality and security of data. The technology used to store and process data is a Hadoop cluster, which enables the storage and processing for mass amount of data in a distributed way [13]. Aggregated data that is obtained from Telkomsel will be stored in BPS’s ‘data lake’ for the next step in data processing and analysis. Figure 5 illustrates application and input/output flow in the statistical business process of MPD.
3.4Standard, method, and quality assurance
3.4.1Commuter identification
Based on the definition used by BPS-Statistics Indonesia, the term ‘commuter’ refers to someone who routinely does a round-trip within 24 hours to work/school/course outside his administrative area of residence. There are two aspects to consider: a spatial aspect and a routine aspect. When using MPD, the location of someone’s residence and the location of his/her main activity (work/school/course), or their round-trip routine cannot be determined directly by interviewing respondents as in conventional survey. Therefore, it is necessary to adjust those two aspects to determine commuters using MPD.
The location of residence and the location of main activity in MPD can be described using the Usual Environment scheme [14]. The residence location (home) is the subscribers location in the nighttime, while the main activity location (work) is the subscribers location in the daytime. The highest aggregate time duration of home and work in subdistrict level will be chosen. If the chosen home and work of a subscriber are in a different sub-district, the subscriber fulfills the spatial aspect of a commuter. Subsequently, the subscriber fulfills the routine aspect of commuter when he/she made a round-trip from home to work at least once a week in two different weeks on a one-month observation period. If the subscriber fulfills spatial and routine aspects, he/she is classified as a commuter. The commuting flows were then identified for every subscriber from origin/home to destination/work. BPS-Statistics Indonesia developed home, work, and commuter algorithms using this concept and adapted to conditions in Indonesia.
3.4.2Metropolitan area delineation
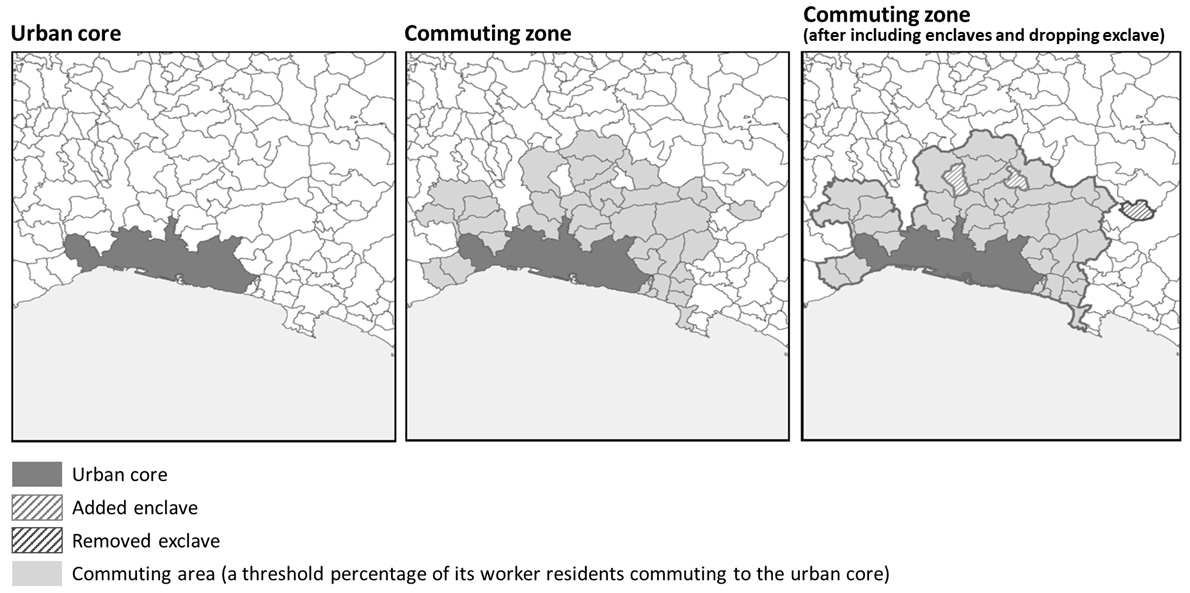
According to the Ministry of Public Works of Indonesia, the establishment of a metropolitan area delineation considers various aspects; one of them is the high rate of commuter mobility between the urban core and surrounding hinterlands [15]. The metropolitan area delineation based on commuter patterns is carried out in various countries, including European countries, the United States, and Japan. Many European countries determine surrounding hinterlands that are included in a metropolitan area by using the Functional Urban Area/FUA [16]. FUA consists of the city and its commuting zone. In this approach, based on an example from Eurostat in Fig. 6, a commuting zone can be identified based on commuter patterns using the following steps:
1. Define the urban core.
2. Identify all surrounding hinterlands with a certain threshold percentage of its worker residents commute to the urban core.
3. Surrounding hinterlands that share at least 100 percent of its land border by FUA are included (named enclave) and non-contiguous surrounding hinterlands are dropped (named exclave).
Different country has different thresholds in determining the surrounding hinterlands that fall within the commuting zone. Many European countries use at least 15 percent [16], while the United States uses at least 25 percent [11]. Meanwhile, Japan determines at least 5 percent of worker and student residents [17]. The percentage was obtained by dividing the number of commuting workers with the total workers in each hinterland. However, in MPD, the subscribers can not be classified as workers or students. According to the commuter survey result in Cekungan Bandung, 69.19 percent of commuters in surrounding hinterlands were commuting for work purposes. Hence, in this study, most subscribers were assumed to be workers so that the percentage of commuters used was the number of commuting subscribers divided by total subscribers. In addition, based on 2018 Indonesian Labor Force Survey (Sakernas), 8.91 percent of surrounding hinterlands workers in Cekungan Bandung commuted to its urban core. Therefore, this study used 5 percent threshold.
3.4.3Quality assurance of MPD
To obtain trusted statistics, quality checking is conducted before data processing, the quality of raw data is examined in terms of diurnal distribution records, missing data, removing non-human (machine) data etc. Then, to validate the result of MPD algorithms, this study employed MEILI, an open-source mobile application that records the location of multiple users over a period-of-time and can be annotated to verify each trip. This validation method was used only for identifying the commuting pattern differences between MPD and MEILI results. So that the more sample used, the more commuting patterns can be analyzed. Due to budget constraints, this project used 907 volunteers who were subset from Telkomsel subscribers.
Basically, MEILI is a travel diary survey that uses mobile phone as a data collection mode. While MPD uses passive geo-positioning to determine someone’s location (aggregate BTS location), MEILI uses GPS, an active geo-positioning to determine the location of the mobile phone. Thus, location information resulting from MEILI is more accurate compared to location information from MPD. However, there are some disadvantages to MEILI. This application needs to be installed on a mobile phone with certain specifications, consumes a high amount of battery, and requires a user’s permission to activate the GPS feature.
Through the MEILI application installed on a mobile phone, volunteers annotated their locations, trips, and the purpose of each trip. Thus, the location of volunteers’ home/work can be known by looking at the trip purpose. The location was identified as home when the trip purpose annotation is “my house” or “my family/friend house”, the stay location in the nighttime, or the stay location in days off. On the other hand, the location was identified as work when the trip purpose annotation is “my office” or “my school/course place”, or the stay location on working hours. The identification of home and work locations result from MEILI were then compared to the MPD result can be seen in Table 4. Therefore, the higher the similarity level of home and work identification between MPD and MEILI, indicate the better commuting flows produced from MPD.
Table 4
The number of MEILI volunteers by identification and similarity of MPD and MEILI
| Identification | Similarity of MPD and MEILI results | |
|---|---|---|
| Match | Mismatch | |
| Home | 518 | 220 |
| Work | 424 | 314 |
| Home and work | 313 | 425 |
4.Discussion, conclusion and recommendations
Based on the implementation of the proposed framework in the use of MPD for the delineation of a metropolitan area, it has become clear that the implementation of quality assurance processes to ensure the validity of the analysis of big data is an important aspect. This aspect even gains in importance as the Build and Collect phases were not conducted by BPS-Statistics Indonesia, but by Telkomsel. Statistical business processes are not always performed sequentially where there is an iteration between the Design and Process phases in order to maintain the quality of MPD results before an in-depth analysis is carried out. In addition, data scientists at BPS-Statistics Indonesia are able to implement the proposed framework, where supported by an adequate big data infrastructure. Moreover, it is important to establish a sustainable collaboration with MNOs to ensure data availability.
The proposed framework from BPS-Statistics Indonesia is still a high-level design and will need adjustment according to each use case and, if adapted by other NSOs, adjusted to their characteristics. The proposed framework is expected to help overcome the challenges of big data in the following ways:
1. Regarding quality, the use of metadata in each phase will serve as lessons learned which can help improvement in future projects. Besides that, by applying quality indicators, a firm business process, and governance aspects, each process and its output quality will be more controlled.
2. Regarding accessibility, the case study shows that data accessibility can be solved with careful planning and sustainable partnership with data provider.
3. Regarding skillsets, with a clear division of roles it would be easier to identify the required skillsets then form and train a team to meet the requirement, and further establish partnerships with relevant stakeholders if needed.
Business processes developed for big data needs to be performed with caution to ensure data accessibility and quality, and adaptations are required as necessary for other different data sources. Like in censuses, surveys, and other product classes, a firm business process is needed as a guideline in using big data, starting from Specify Needs up to Evaluate. In the end, hopefully with the application of the proposed framework, BPS-Statistics Indonesia can improve their big data utilization and realize big data as official statistics, not only as experimental research.
Acknowledgments
We thank Ronald Jansen from the UN Statistics Division in New York for his helpful comments during discussions throughout the preparation of this paper, also Matthew Shearing and the related UN ESCAP committee for their feedbacks and guidance on our conference papers up to the final draft. The perspective conveyed in this paper remain those of the authors and do not necessarily represent the views of the UN ESCAP nor BPS-Statistics Indonesia as a whole organization.
References
[1] | Cornelia L, et al. Big Data: Potential, Challenges, and Statistical Implications, IMF Staff Discussion Note. (2017) Sept. |
[2] | United Nations Economic Commission for Europe [UNECE Statswiki]. Switzerland: Classification of Types of Big Data; (2020) [Updated 2020 June 19; cited 2020 September 28]. Available from: https://statswiki.unece.org/display/bigdata/Classification+of+Types+of+Big+Data#app-switcher. |
[3] | BPS-Statistics Indonesia. Statistical Business Framework and Architecture version 4.5. BPS-Statistics Indonesia, Jakarta. (2016) . |
[4] | United Nations Economic Commission for Europe [UNECE Statswiki]. Switzerland: Description of Phases and Sub-Processes; (2020) [Updated 2020 July 14; cited 2020 October 14]. Available from: https://statswiki.unece.org/display/GSBPM/V.+Descriptions+of+Phases+and+Sub-processes. |
[5] | MacFeely S. Big data and official statistics, the united nations conference on trade and development (UNCTAD). Switzerland. (2018) Dec; 2: : 25–54. Available from: doi: 10.4018/978-1-5225-7077-6.ch002. |
[6] | United Nations. United Nations Statistical Quality Assurance Framework. (2018) . |
[7] | Lestari TK, Esko S. Lessons for Effective Public-Private Partnerships (PPPs) from the use of Mobile Phone Data in Indonesian Tourism Statistics Paper presented in Asia-Pacific Economic Statistics Week 2019, Bangkok, 17–21 June (2019) . |
[8] | UNECE. A Suggested Framework for the Quality of Big Data v4.01. Jakarta. (2014) . |
[9] | Bühlmann P, Van de Geer S. Statistics for big data: a perspective, statistics and probability letters. (2018) ; 136: : 37–41. Available from doi: 10.1016/j.spl.2018.02.016. |
[10] | Government of Indonesia. 2020–2024 National Medium-term Development Plan. Presidential Reg., 18. (2020) . |
[11] | US Office of Management and Budget. 2010 Standards for Delineating Metropolitan and Micropolitan Statistical Areas; Notice. Fed. Reg., 75(123): 37246–37252. (2010) . |
[12] | BPS-Statistics Indonesia. Gross Regional Domestic Product (GRDP) by Regency/Municipality in Indonesia 2014–2018. BPS-Statistics Indonesia, Jakarta. (2019) . |
[13] | Databricks. Hadoop Cluster. [Cited 2020 October 13]. Available from: https://databricks.com/glossary/hadoop-cluster. |
[14] | Putra AP, Setyadi IA, Esko S, Lestari TK. Measuring Commuting Statistics in Indonesia Using Mobile Positioning Data. Paper presented in Asia-Pacific Economic Statistics Week 2019, Bangkok, 17–21 June (2019) . |
[15] | Ministry of Public Works of Indonesia. Guidelines for the Preparation of National Strategic Areas Spatial Planning. Ministry Reg., 15. (2012) . |
[16] | Eurostat. Methodological Manual on City Statistics 2017 Edition. Luxembourg: Publications Office of the European Union. (2017) . doi: 10.2785/708009. |
[17] | Kurahashi, Toru. The Definition of Metropolitan Areas in Japan and Analysis Relating to Them. Paper presented in IAOS Conference on Official Statistics, Kiev, 12–14 September (2012) . |

