
Implementation of online questionnaires in the General Household Survey in Hong Kong
Abstract
The General Household Survey (GHS) of Hong Kong is a monthly household survey on labour force characteristics and household income. Traditionally, data collection was conducted via face-to-face interviews through field visits and computer-assisted telephone interviews (CATI). In July 2017, the Census and Statistics Department (C&SD) introduced an online questionnaire (OQ) in the GHS to enhance its services to survey respondents. Considering the importance of GHS statistics, the tight monthly survey cycle and the complexities involved in adding a new data collection mode, a phase-by-phase approach was adopted with close monitoring of data quality of the survey estimates. With satisfactory trial results, the OQ was fully implemented in the GHS in January 2019. Being a convenient and privacy-assured channel, the OQ helps entice sampled households to respond to the GHS and increases the contact rate of those households who are more difficult to reach by the conventional data collection methods. During COVID-19 when face-to-face interviews had to be adjourned, the OQ provided a powerful channel for data collection. With targeted messages appealing for response by OQ sent to sampled households in a more proactive manner, the take-up rate of the OQ increased by as much as 10 percentage points, partly compensating the loss due to the suspension of field visits such that monthly labour force statistics could continue to be published during the epidemic.
The paper was prepared under the kind mentorship of Ms Lisa Bersales, former Chief Statistician of the Philippines.
1.Introduction
The General Household Survey (GHS) of Hong Kong is a monthly household survey on the characteristics of the labour force and household income. In each month, a random sample of about 9,000 households is enumerated, of which about half are new cases sampled for the first time and half are repeated cases that had been sampled 3 months ago. In the past, data collection for the GHS dealt with repeated cases without telephone numbers (including cases which could not be enumerated and cases which were enumerated but the respondents concerned were unwilling to provide telephone numbers in the first round) and new cases (all without telephone numbers) via face-to-face interviews through field visits, while repeated cases with telephone numbers were enumerated through computer-assisted telephone interviews (CATI).
With the wider penetration and advancement of information technology, adopting online questionnaires (OQ) in statistical surveys has become more feasible in recent years. The successful experience of the Hong Kong 2016 Population By-census in adopting an electronic questionnaire demonstrated that society was ready to respond to statistical surveys via the online mode. In addition, households were increasingly difficult to reach by field visits as people were returning home later from their daily activities and many preferred not to be disturbed at home. Tighter security control in many residential buildings also increased the cost and difficulty in reaching households by field visits.
These challenges prompted the Census and Statistics Department (C&SD) to consider introducing OQ as a new self-reporting channel in the GHS to cater for the living styles and preferences of modern households. The C&SD started to introduce the OQ on a trial basis in July 2017 as an additional mode of data collection in the GHS, on top of its existing channels via face-to-face interviews and CATI. This paper summarises the implementation experience of the OQ as a new data collection mode in a labour force household survey, with Section 2 discussing the review of literatures and precedent relevant activities undertaken prior to the implementation, and Section 3 presenting our approach to implementation. Section 4 describes the methodology of evaluation of the trial in terms of levels of adoption of the OQ and data quality. Section 5 presents the evaluation results and Section 6 provides conclusions and recommendations.
2.Literature review
There are many literatures discussing methodologies and precedent cases of OQ implementation in National Statistical Offices (NSOs), particularly in labour force surveys. In the course of planning for the OQ implementation in the GHS, desktop research had been conducted and references had been drawn from the experiences of other NSOs on the stages of data collection methodology and design, system and questionnaire design, and implementation approach.
As there are already two data collection modes in place in the GHS, a sequential mixed-mode design was adopted by the C&SD in which the OQ is provided to respondents as the first option introduced in the invitation letter that is mailed to the sampled households. If they do not respond to the OQ by a certain date, then the field officers will follow up with field visits or CATI (for repeated cases with telephone number available). Such design has been widely studied and adopted. Bethlehem and Bifflgnandi explained that mixed-mode surveys are increasingly common to reduce survey costs and maintain response rates [1]. Dillman et al. noted that offering multiple data collection modes can attract different types of respondents to respond, which in turn can improve timeliness, reduce coverage errors, improve response rates and reduce nonresponse errors [2]. While some previous case studies and literature noted that response rate may not go up with the introduction of an online mode in a mixed-mode design, other cases suggested that a sequential mixed-mode design could perform better and bring improvement to the response rate [1, 3, 4, 5].
In the GHS, such sequential mixed-mode design fits the C&SD’s goal of increasing the likelihood of receiving responses from those households that could not be normally reached or interviewed by field visits, hence reducing coverage error and nonresponse error. In addition, starting off with OQ as the first data collection option which is relatively less costly than face-to-face interviews, data collection costs can be reduced with increased participation from sampled households, in line with other preceding cases [4, 6]. Also, studies have suggested that allowing the respondents to choose the mode of responding could bring the benefits of higher data quality with less rounded numerical responses and higher completion [7].
References can also be drawn to the system and questionnaire design of similar implementations in other NSOs that aimed to ensure that the computer system interface is user-friendly and the question wordings and instructions are suitably tuned to the perspectives of the respondents. With the experiences from NSOs such as the United Kingdom Office for National Statistics, Statistics Canada, the Federal Statistical Office of Germany and Statistics Netherlands, and examples in literatures, the C&SD paid particular attention to the visual design, questionnaire flow, error checks and ease of navigation of the online questionnaire system [8, 9, 10, 11, 12]. In particular, in order not to overburden the respondents to the extent that they would drop out in the middle of completing the OQ, only essential routing and edit checks that are less sophisticated than interviewer-administered modes are included in the OQ for checking on the spot [3, 13]. After receiving the completed OQ, further rounds of validation checks are conducted at the office and field officers will follow up on those cases that do not pass the checks.
Another important aspect to consider in adopting mixed-mode design is the mode effect. Broadly speaking, mode effect refers to the differences in results compiled from data collected via different modes in a survey [10]. Mode effects can affect various types of errors, including coverage error, nonresponse error and measurement error [6]. These different types of errors tend to be confounded with one another, since the impact of sampling, questionnaire construction and implementation are difficult to disentangle from measurement errors [3, 4, 13, 14]. In order to accurately measure the “pure” mode effects on measurement errors with other confounding factors removed, dedicated experiments are required [4, 10, 14, 15]. Tourangeau et al. noted that in case such experiments cannot be conducted, indirect measures can be used to evaluate data quality in different modes, such as the missing data and breakoff rates [10]. De Leeuw et al. also noted that matching could be an option if no separate experiments could be set up to measure mode effects [4]. Specifically, matched subjects based on variables independent of mode can be studied to see if the results collected from different modes are different. Although this is less robust than randomised experiments, it can still provide insights regarding potential mode effects.
In planning for testing and implementation, it was noted that many NSOs put in much time to test out the system, questionnaire, and workflows. For instance, in United Kingdom Office for National Statistics, a limited-scale testing was conducted in 2015, and further testing was conducted in 2018 before the planned live-run in 2020 [8, 16]. Statistics Canada also phased out the roll-out of their online electronic questionnaire in LFS by one rotational group at a time, and completed the roll-out to all groups in 6 months [17]. It seems prudent to adopt a longer implementation time frame to allow time for testing, fixing any system or questionnaire problems, and examine the data quality before full implementation.
3.Implementation approach
The GHS is a monthly survey. Statistics of moving 3-month periods compiled from the GHS, including size of labour force, unemployment, underemployment, and household income, are vital statistical indicators of economic conditions and are published monthly. It is thus imperative to ensure that data collection remains uninterrupted such that these data series will continue to be available as scheduled without affecting its continuity. On the other hand, adding a new data collection mode to existing ones is operationally and technically complex. If a full-blown implementation approach was adopted, it would take a long time to get all testing completed, operational procedures well planned and all staff trained up at the same time, and it would be prone to service disruption when unexpected problems with the new system or operations occurred. In particular, in view of the short data collection period of the survey, any hiccups in the new operations might pose high risks to the timely dissemination of the survey results.
In view of the above considerations and making references to the implementation experiences in other NSOs, it was decided to roll out the OQ on a trial basis first, starting with a small number of cases and then gradually increasing the scale of the trial month by month. The trial was divided into 2 stages. The first stage of trial implementation focused on testing the adequacy of the OQ computer systems and operational arrangements, the effectiveness of the OQ questionnaire design, and the receptiveness of GHS respondents. The second stage involved a gradual rollout of the OQ to representative sub-samples of the GHS sampled cases of increasing size month by month, focusing on studying the take-up rate and impacts on key survey estimates and manpower resources requirement.
The first stage of trial implementation lasted from July 2017 to April 2018 for 10 months. It began with only 81 cases (less than 1% of all sampled cases in a month) invited to use the OQ in the first month of trial; more cases were invited in each subsequent month, reaching 364 cases in the 10
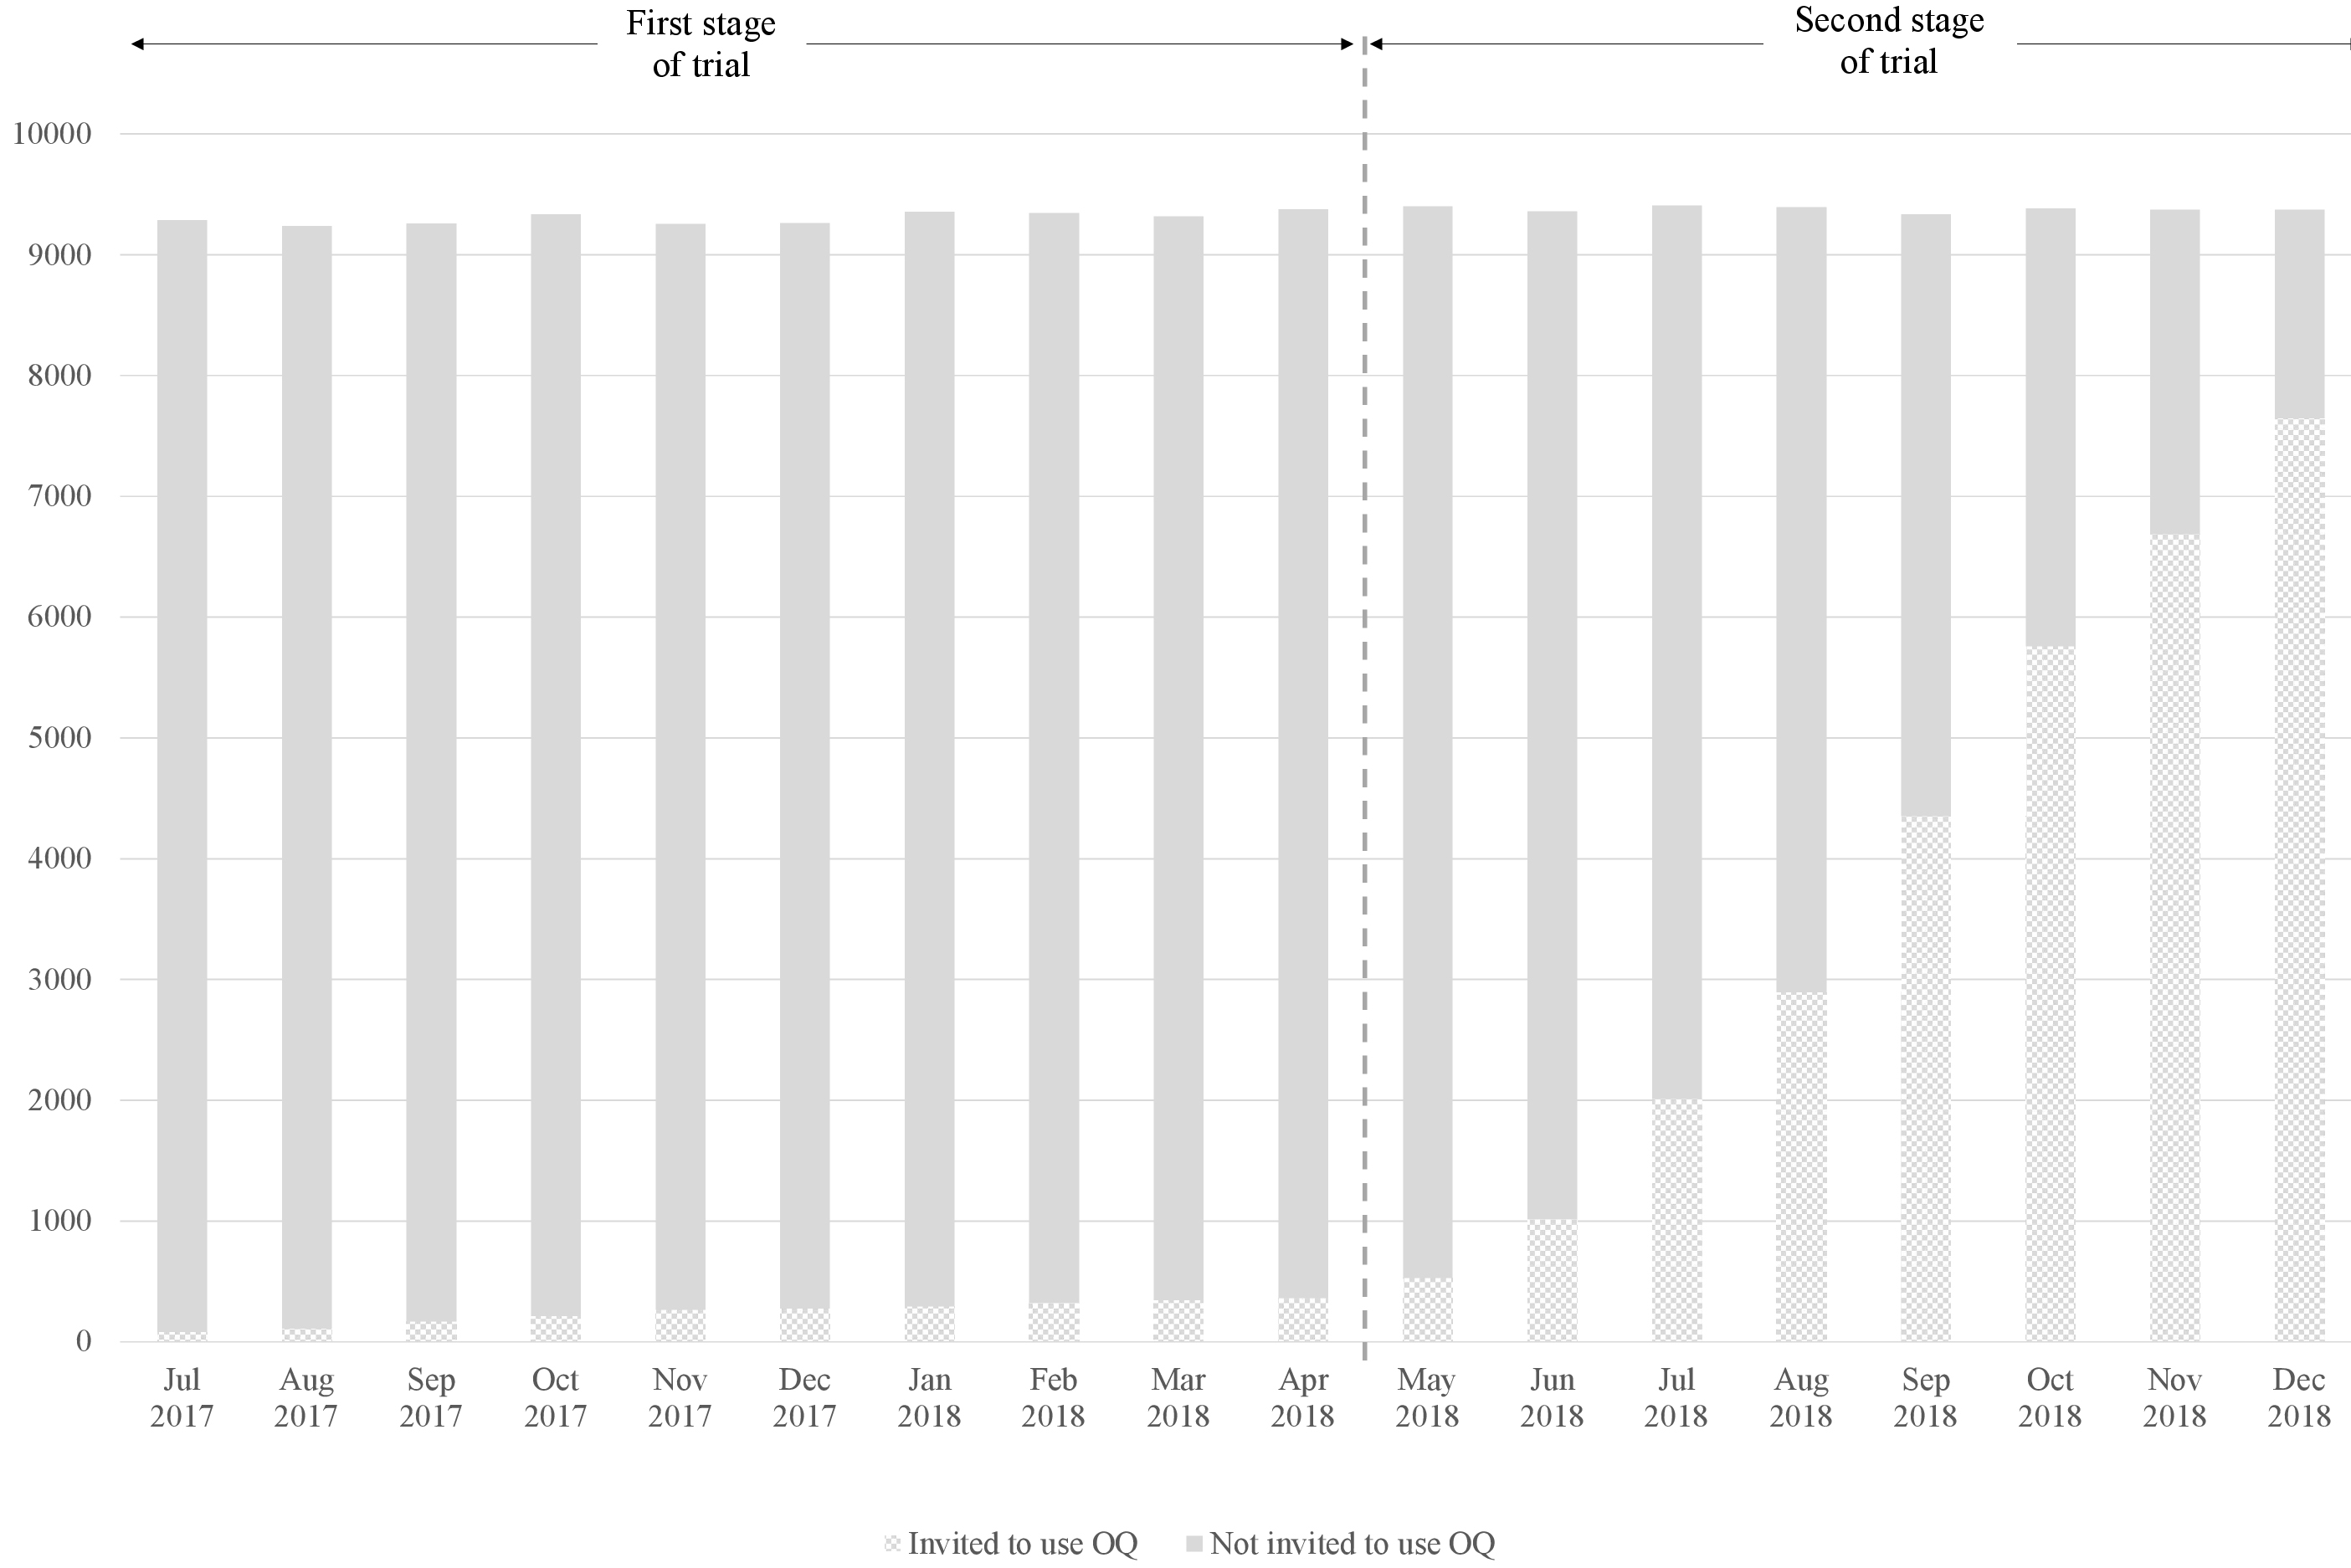
The second stage of trial implementation commenced in May 2018 and lasted for 8 months up to December 2018. The monthly sample of the GHS consists of 18 replicates of quarters (housing units), each being a representative sample of quarters in Hong Kong. In the first month of the second stage of trial implementation, one replicate was invited to participate in the GHS via the OQ. Introducing the OQ to one out of 18 replicates allowed expanding OQ adoption in a controlled manner. In case something went wrong, the remaining 17 replicates could still be used to compile representative survey results. This replicate-by-replicate approach also allowed comparison of the OQ replicates and non-OQ replicates to understand the impacts of introducing the OQ on key survey estimates. The number of replicates invited to complete the OQ then gradually increased every month, until all 18 replicates were invited in the last month of trial implementation in December 2018 (Fig. 1).
Figure 1.
Number of GHS sampled cases invited to use OQ during trial implementation (July 2017–December 2018).
It is important to ensure that the data collected via this new data collection mode is of as high quality as those collected via the usual modes (i.e. face-to-face interview and CATI). During the first stage of trial implementation, all OQ cases were selected for quality checking in order to fully assess their data quality by verifying with the respondents the key information (such as economic activity status) provided on the OQ, and to identify potential areas for improvement in the computer system. Towards the second stage of trial implementation, a sampling plan was formulated to select a certain proportion of the OQ cases for quality checking. The plan took into consideration which data items in the submitted OQs are subject to higher risk of reporting errors and thus which categories of the submitted OQs should be subject to a higher rate of checking, response burden of OQ respondents as well as time and manpower required for the checking.
4.Methodology of evaluation of trial
The evaluation of trial implementation involved both qualitative evaluation with descriptive measures, and quantitative assessment on take-up and data quality. The questionnaire, system design and operational flows were mainly tested and evaluated qualitatively based on the feedback of field officers and respondents who had participated in the trial. The trial began with only a handful of respondents invited to use the OQ, and their comments provided valuable feedback for the team to review and fine-tune the questionnaire and workflows. The number and contents of all enquiries were duly monitored throughout the trial period as a measure of system performance and ease of use from respondents’ perspective.
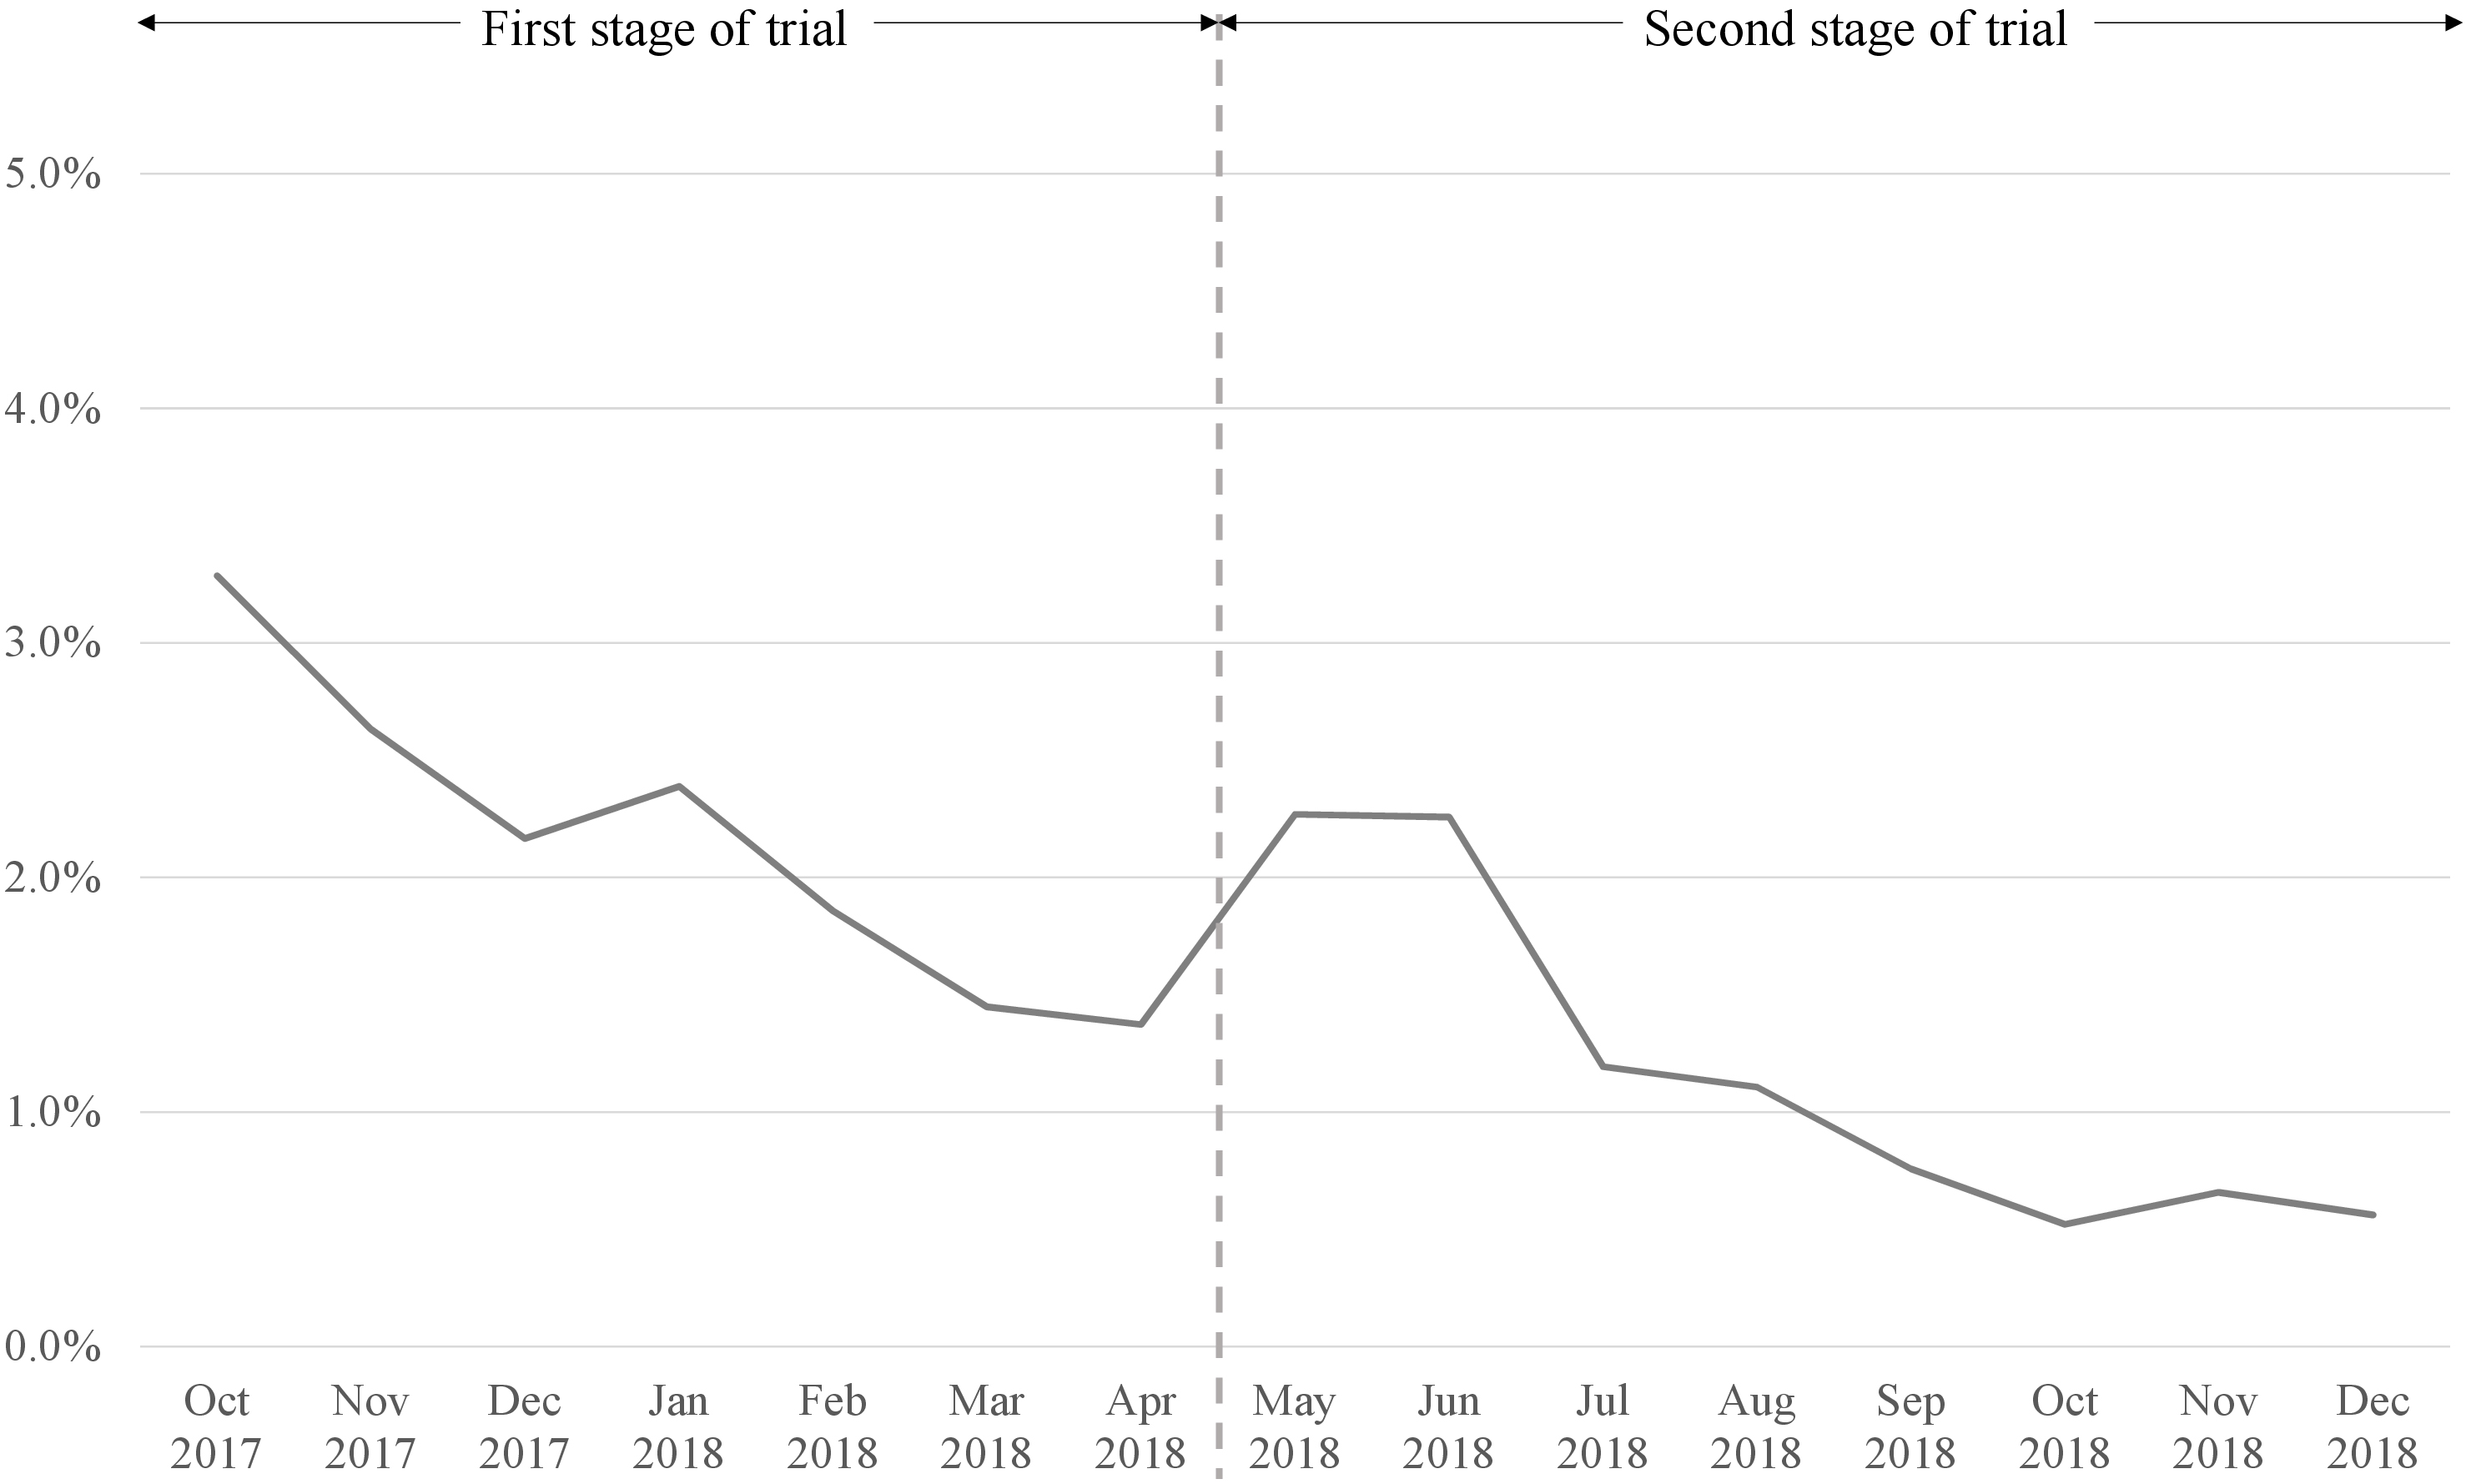
Figure 2.
Number of OQ-related enquiries as a percentage of cases invited to use OQ during trial implementation in GHS (October 2017–December 2018).
The level of take-up can be measured and analysed by looking at the number of enumerated cases using the OQ out of the number of households invited. Since the sampling scheme of the GHS is based on replicates (each being an independent and representative sub-sample) and the OQ was introduced gradually by replicates in the trial period, replicates that were invited to fill out the OQ (OQ replicates) were compared with those not invited to fill out the OQ (non-OQ replicates). The demographic profiles of respondents in the OQ and non-OQ replicates can be compared by chi-square tests to study if they differ significantly. The mode effect (in the sense of measurement errors and nonresponse error) between the existing data collection channels and the newly introduced OQ would be difficult to measure precisely without setting up experiments to collect additional data. Due to resources and operational considerations, no embedded experiments were set up in the trial for testing the mode effect. A method similar to the “matching” method proposed by de Leeuw et al. and similar testing done in Statistics Canada was used instead, in which the key statistics compiled from the OQ replicates and non-OQ replicates were compared to assess if the introduction of this new data collection mode have any impact on the key statistics [4, 15].
5.Results
5.1Error rate and enquiries
The error rate in the OQ data, as measured by the number of OQ cases with errors identified in quality checks over the total number of cases responded by the OQ (including partially responded cases), was in general low (
Enquiries received during the trial implementation period also provided valuable information on users’ experiences. Throughout the trial implementation, the number of OQ-related enquiries (as a percentage of cases invited to use OQ) had been dropping to a very low level as seen in Fig. 2. The mild increase in May and June 2018 as the trial entered the second stage was due to system problems, which had been quickly rectified. Most of the enquiries were related to account and login questions (39%) and problems in completing the questionnaire (33%). Detailed comments were requested from these enquirers, so that enhancements could be made promptly on the questions, system functionalities and performance.
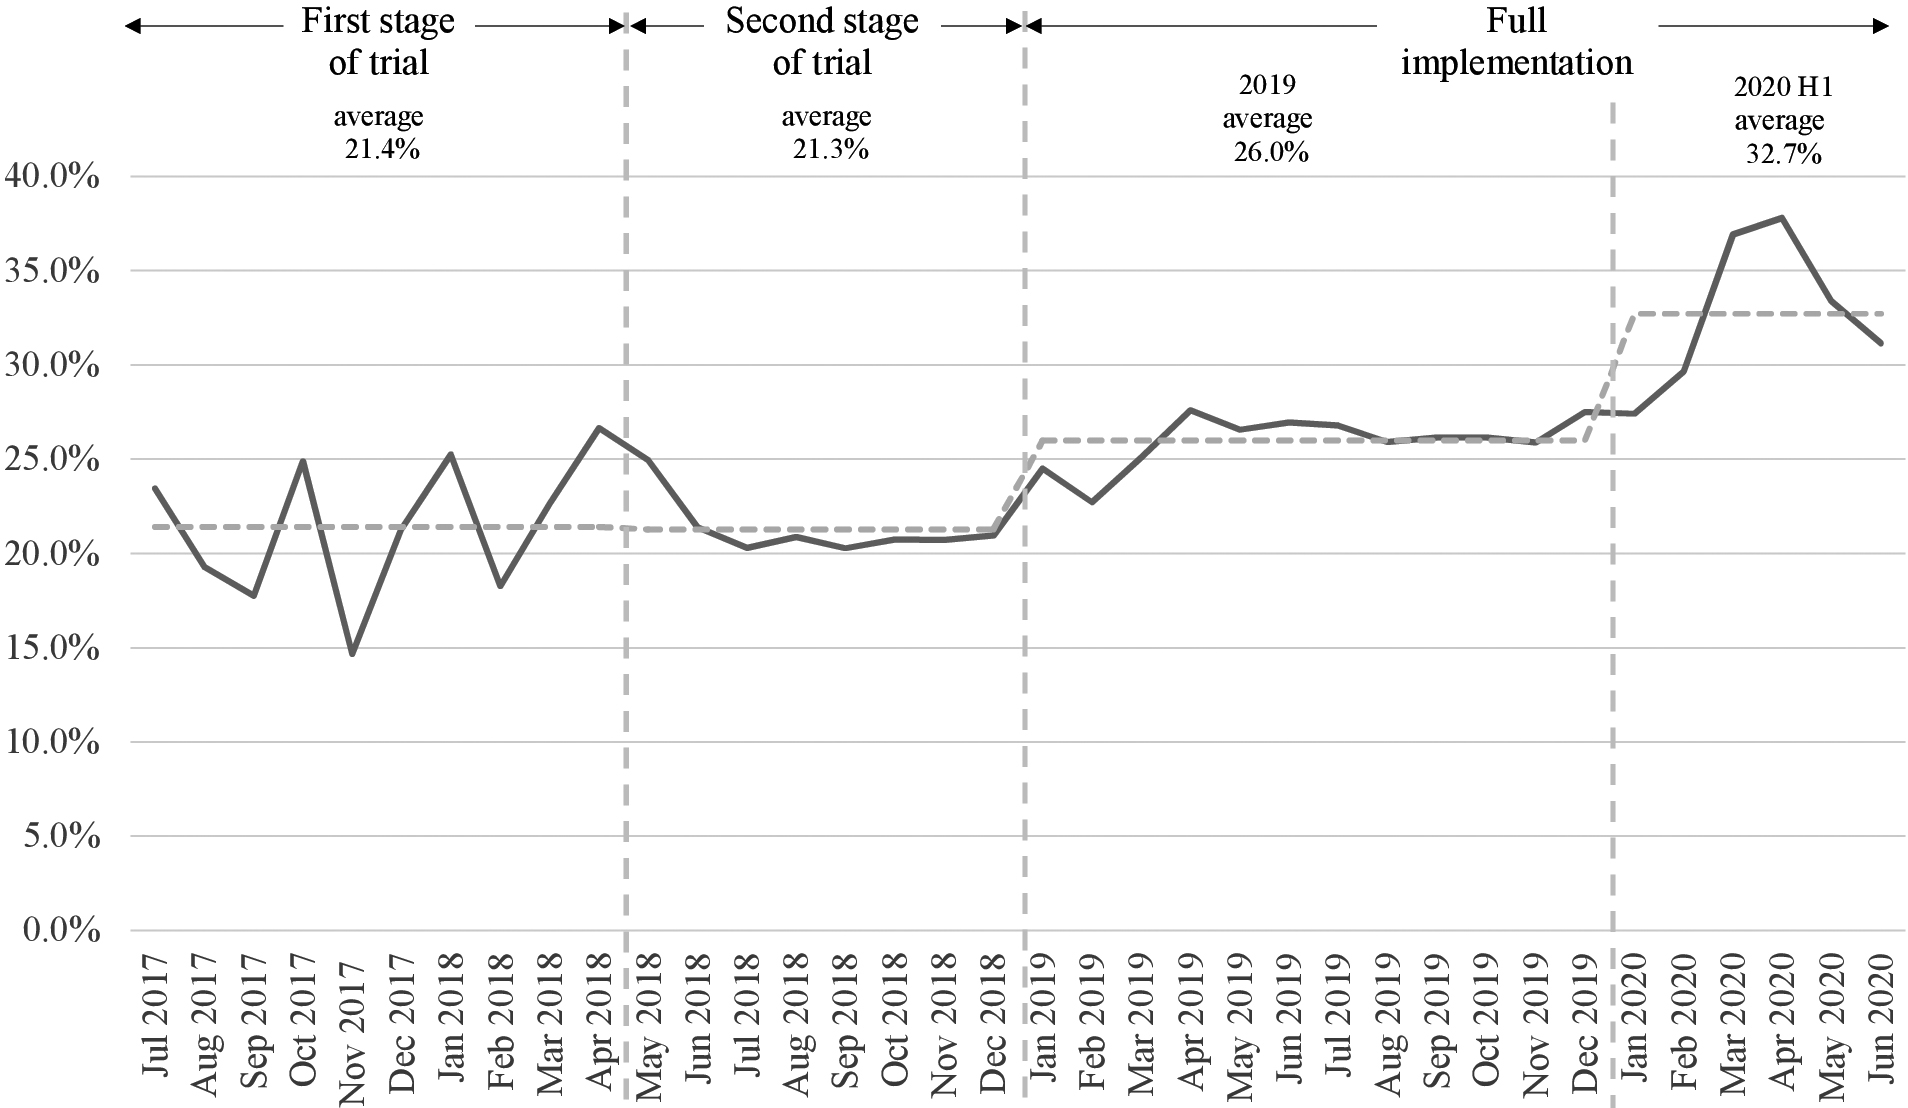
Figure 3.
OQ take-up rate in GHS during trial implementation and after full implementation (July 2017–June 2020).
5.2Take-up of OQ and response rate
The take-up of the OQ was satisfactory from the beginning of implementing the trial. Figure 3 shows the overall take-up rate of OQ (in terms of number of cases responded to OQ over all cases invited to use OQ). In the first stage of trial implementation, OQ cases were selected based on field officers, and since each officer handled assignments of a different geographical area, the geographical coverage of cases varied month by month. Therefore, the OQ take-up rate showed fluctuation as some geographical areas with higher elderly population might not use the OQ as much as other areas with more younger households. The average take-up rate in the first stage of the trial was 21.4%, notably higher than the planned level.
The OQ take-up rate remained above 20% towards the second stage of trial implementation, with an average of 21.3%. This was very encouraging in light of the GHS being a voluntary survey with a short OQ reporting period of about 10 days only. The take-up rate was also comparable to those of 20–25% in the Labour Force Surveys of Australia and Canada, which are both mandatory surveys [17, 18]. After full implementation, the OQ take-up rate was further boosted with better communications with sampled households who seemed reluctant to take a face-to-face survey. The average OQ take-up rate in the first year of full implementation reached 26.0%.
Since the introduction of OQ, it was noticed during the trial period that the average response rate of OQ invited cases was consistently higher than that of non-OQ cases by 2–3 percentage points. Apparently, the OQ has the added benefit of facilitating data reporting of some sampled households who have difficulties to respond to the GHS under conventional interviewing modes, such as persons being at home only at a late time of the night or weekends (and cannot be reached by field officers), persons not willing to disclose their personal information to strangers face-to-face, and persons feeling intruded when being called or visited by strangers. This helped to improve the overall response rate and data quality of the GHS.
5.3Impact on GHS statistics
In general, there were no significant differences observed in the demographic profiles of persons and households enumerated between the OQ replicates and the non-OQ replicates during the 3-month period of August to October 2018 (with similar numbers of sampled cases in the OQ replicates and non-OQ replicates) (Table 1).
Table 1
Demographic profiles of enumerated persons and households in OQ and non-OQ replicates in GHS, August–October 2018 and
| Demographic variable | Aug-Oct 2018 | ||
|---|---|---|---|
| OQ replicates | Non-OQ replicates | ||
| Persons enumerated | 30 046 | 28 957 | |
| Proportion (%) | |||
| Gender | Male | 45.8 | 45.6 |
| Female | 54.2 | 54.4 | |
| Age groups | 11.3 | 11.4 | |
| 15–24 | 10.0 | 9.9 | |
| 25–34 | 13.8 | 14.2 | |
| 35–44 | 16.0 | 15.9 | |
| 45–54 | 16.1 | 15.4 | |
| 55–64 | 15.9 | 16.1 | |
| 65 | 16.9 | 17.0 | |
| Education | Primary and below | 26.1 | 26.1 |
| Lower secondary | 15.2 | 15.8 | |
| Upper secondary | 30.1 | 30.7 | |
| Post-secondary: diploma/certificate/sub-degree | 7.5 | 6.7 | |
| Post-secondary: degree | 21.1 | 20.7 | |
| Employed persons enumerated | 15 722 | 15 178 | |
| Proportion (%) | |||
| Monthly employment income (HK$) | 16.8 | 17.1 | |
| 8,000–15,999 | 31.6 | 30.9 | |
| 16,000–23,999 | 22.2 | 23.2 | |
| 24,000–31,999 | 11.2 | 11.3 | |
| 32,000–43,999 | 7.0 | 6.9 | |
| 44,000–79,999 | 8.2 | 7.7 | |
| 3.1 | 2.9 | ||
| Households enumerated | 10 404 | 9 859 | |
| Proportion (%) | |||
| Household size | 1 | 16.5 | 15.2 |
| 2 | 27.5 | 27.2 | |
| 3 | 25.4 | 25.3 | |
| 4 | 18.8 | 20.0 | |
| 5 | 11.8 | 12.4 | |
| Household income | 14.1 | 13.7 | |
| 8,000–19,999 | 21.8 | 21.6 | |
| 20,000–31,999 | 19.9 | 20.3 | |
| 32,000–43,999 | 14.1 | 14.2 | |
| 44,000–55,999 | 11.9 | 11.9 | |
| 60,000–79,999 | 7.6 | 8.2 | |
| 10.6 | 10.2 | ||
Nevertheless, it is noticed that respondents’ education level in the OQ replicates was significantly (statistically) higher than that in the non-OQ replicates (
On the aspect of data quality, literatures suggested that respondents would be more likely to report more accurate answers in self-responding modes than in interviewer-administered modes due to social desirability bias [13, 14]. This bias reduction in responses happens in our case as evidenced in, for example, the more precise reporting of income figures in OQ (e.g. HK$17,300 in OQ as compared to HK$18,000 in telephone or face-to-face interview). Moreover, as after the OQ is launched, more respondents who were more receptive to OQ, such as working persons with higher education and persons in one-person household, could be enumerated, the sampling error is lowered for compiled statistics concerning these sub-groups. Given that these “newly included” respondents who could not be enumerated via field visits prior to OQ introduction are small in number (as the response rate of OQ replicates was only some 2–3 percentage points higher than non-OQ replicates during the trial) and only account for a small proportion in the total number of responded cases, the overall unemployment rates and underemployment rates compiled with the OQ and non-OQ replicates in all the moving 3-month periods in the second stage of trial implementation showed no notable differences upon statistical testing.
6.Conclusions and recommendations
As the take-up rate was satisfactory and no impact to major labour force statistics was observed, the OQ was eventually fully implemented in January 2019. The OQ implementation in the GHS was successful, with favourable responses from respondents and minimal disruption to monthly survey operations. A number of key success factors in the implementation have been identified.
6.1Phased implementation approach
Instead of a full-blown implementation, a long trial implementation period was adopted with gradual increase in the scale month by month. Although it took a long time (1.5 years), impacts on monthly survey operations and statistics compiled were minimised. This approach also allowed a longer time frame for testing and refining the system functionalities, question wordings and flow, as well as the operational procedures involved in incorporating this new mode of data collection. Any effect on the sample (e.g. more respondents of higher education using the OQ cases) could also be smoothed out as the OQ was introduced to replicates over a long period of 8 months. This ensured that there was no sudden disruption in the key data series.
6.2Training of staff
As the trial period was long, the core team responsible for OQ-related enquiries and support received sufficient training from working with trial cases and became familiarised with the new system and operational procedures. Those field officers who are not directly responsible for providing support related to the OQ were also trained up, so that they understood the implementation plan well, and could answer any questions that respondents might have and promote the use of the OQ to respondents who did not prefer to answer the survey face-to-face.
6.3Data privacy and security
Data privacy and security was one of the main concerns of the public in using the OQ. With this in mind, the GHS OQ system was designed with full regard to data privacy and security, on top of conforming to all relevant government standards and guidelines. Messages to emphasise the security of using the OQ were included in various communication materials with respondents where appropriate. This helped strengthen the confidence of the respondents in using the OQ. Indeed, respondents seldom raised concerns on data privacy and security of the OQ during the trial period.
6.4Continuous improvement and fine-tuning
The OQ system and working procedures were continuously improved and fine-tuned throughout the trial period, as the phased implementation approach provided scope and time for this. Respondents were asked about their user experience when data verification was conducted, and enquiries on OQ were properly recorded and analysed to identify problems and enhancement opportunities. The GHS OQ system was also designed with maximum flexibility from the onset, such that question wordings and instructions can be enhanced with relatively little effort and time.
6.5Communications with respondents
During the recent COVID-19 outbreak in 2020, face-to-face enumeration had to be suspended in the few months when the epidemic situation was worse. Since early February 2020, additional efforts have been put in place to encourage respondents to make use of the OQ to respond to the GHS, including issuing press releases to the public and appeal letters/reminder letters/SMSs to sampled cases with clear and targeted messages to solicit their participation through the OQ. With these new measures, the OQ take-up rate further increased to a record high of 37.7% in the survey month of April 2020, which was more than 10 percentage points higher than the average for 2019; and the average OQ take-up rate in 2020 at the time of writing is some 7 percentage points higher than that in 2019 (Fig. 3). As a result, the overall response rate for the GHS, which relied mostly on OQ and CATI in the affected months during 2020, could still be maintained at an acceptable level in face of fieldwork suspension. This has enabled the compilation and dissemination of labour force statistics to continue as scheduled without any interruption.
6.6Concluding remarks
The use of OQ effectively provides an additional convenient and round-the-clock channel for the sampled households to respond to the GHS in Hong Kong. It minimises disturbance to them that may otherwise be caused by field visits and telephone calls. With a phased and gradual implementation approach, meticulously designed computer system and operational procedures, attention to data quality, and clear communications with both internal staff and the public, the implementation of the OQ was smooth and successful, with no disruption to monthly survey operations and the compilation of statistics.
Acknowledgments
The author would like to thank Ms Marion Chan, Mr Leo Yu and Ms Agnes Lo for their guidance and thoughtful feedback; Mr Michael Chu and Mr Shui-sing So for the stimulating discussions and support; Dr. Lisa Bersales for her mentorship; and Mr Matthew Shearing and reviewers for their valuable comments on earlier versions of the paper.
References
[1] | Bethlehem J, Bifflgnandi S. Handbook of web surveys. Hoboken, NJ: John Wiley and Sons. (2012) . |
[2] | Dillman D, Smith J, Christian L. Internet, Mail and Mixed-Mode Surveys – The tailored design method. Hoboken, NJ: John Wiley and Sons. (2009) . |
[3] | Betts P, Lound C. The application of alternative modes of data collection on UK Government social surveys: Literature review and consulation with National Statistical Institutes. London: Office for National Statistics. (2010) . |
[4] | de Leeuw ED, Hox JJ, Dillman DA. International handbook of survey methodology. New York: Taylor & Francis Group, Psychology Press. (2008) . |
[5] | Dillman DA, Phelps G, Tortora R, Swift K, Kohrell J, Berck J, et al. Response rate and measurement differences in mix-mode surveys using mail, telephone, interactive voice response (IVR) and the Internet. Social Science Research. (2009) ; 38: (a): 1–18. |
[6] | Roberts C. Mixing modes of data collection in surveys: A methodological review. London: ESRC National Centre for Research Methods. (2007) . |
[7] | Conrad FG, Schober MF, Antoun C, Yan HY, Hupp AL, Johnston M, et al. Respondent mode choice in a smartphone survey. Public Opinion Quarterly. (2017) ; 81: (S1): 307–37. |
[8] | Betts P, Cubbon B. Adapting Labour Force Survey questions from interviewer-administered modes for web self-completion in a mixed-mode design. Statistical Journal of the IAOS. (2015) ; 31: (4): 629–44. |
[9] | Aubrey-Smith SA, Blanke K, Gravem DF, Jarvensivu M, Meertens V, Runz P. Report WP II “Web Data Collection”: Testing web questionnaires for the Labour Force Survey in five countries. ESSnet DCSS, Collaboration in Research and Methodology for Official Statistics, European Commission. (2014) . |
[10] | Tourangeau R, Conrad FG, Couper MP. The science of web surveys. Oxford University Press: New York; (2013) . |
[11] | Couper MP. Designing effective web surveys. Cambridge: Cambridge University Press. (2008) . |
[12] | Karaganis M, St-Denis M. Electronic Questionnaire Collection at Statistics Canada. United Nations Economic Commission for Europe. Conference of European Statisticians, Seminar on New Frontiers for Statistical Data Collection. (2012) October 31–November 2; Geneva, Switzerland. |
[13] | Betts P, Lound C. The application of alternative modes of data collection on UK Government social surveys: A report for the Government Statistical Service. London: Office for National Statistics. (2010) . |
[14] | Jäckle A, Roberts C, Lynn P. Assessing the effect of data collection mode on measurement. International Statistical Review. (2010) ; 78: (1): 3–20. |
[15] | Hsu JW, Mcfall BH. Mode effects in mixed-mode economic surveys: Insights from a randomized experiment. Finance and Economics Discussion Series 2015–008. Washington: Board of Governors of the Federal Reserve System. (2015) . |
[16] | United Kingdom Statistics Authority Business Plan (Apr 2016–Mar 2020). London: UK Statistics Authority. (2016) . |
[17] | Francis J, Laflamme G. Evaluating Web Data Collection in the Canadian Labour Force Survey. Paper presented at the Federal Committee on Statistical Methodology Research Conference. Ottawa. (2015) . Available on: https://nces.ed.gov/fcsm/pdf/H2_Francis_2015FCSM.pdf. |
[18] | Australian Bureau of Statistics. Labour Force, Australia, Detailed – Electronic Delivery, Feb 2016: Online Collection in the Labour Force Survey. Australian Bureau of Statistics. (2016) . Available on: https://www.abs.gov.au/AUSSTATS/[email protected]/Lookup/6291.0.55.001Main%20Features5Feb%202016. |

