
A pilot project of area sampling frame for maize statistics: Indonesia’s experience1
Abstract
A critical issue in the context of food policy in Indonesia is the accuracy of crops statistics, particularly rice and maize. In 2018, Statistics Indonesia (BPS), in collaboration with the Indonesian Agency for Assessment and Application of Technology (BPPT), successfully implemented the area sampling frame (ASF) method to improve the accuracy of paddy harvested area estimation, which previously was estimated by conventional methods, mainly by the human eye (‘eye-estimate’). The achievement has encouraged BPS to replicate the method to estimate the harvested area of maize, for which there were indications it suffered from overestimation. In 2019, BPS initiated a pilot project on the implementation of the ASF for maize. One of the most challenging aspects in replicating the ASF method for maize is the frame construction. This issue arises due to insufficient spatial information on land that is specifically dedicated to maize cultivation. To address this challenge, BPS constructed the frame by making use of different sources of spatial information. This paper provides a comprehensive look at the development of the ASF for maize statistics. The discussion in this paper covers two main issues, namely the methodology applied and the business process of data collection.
1.Introduction
The accuracy of crop statistics, particularly rice and maize, has become instrumental in planning and evaluating food policy in Indonesia. Rice and maize are most critical since they are the country’s two major food crops. However, when it comes to production data, some researchers argued that there is an overestimation issue with paddy production due to inaccuracies in the estimation of the harvested area [15]. Unfortunately, the same issue was also experienced with maize statistics [16]. Technically, the production figure of maize is calculated by multiplying two variables, namely the harvested area and productivity (yield per hectare). The harvested area has been suspected as the primary source of upward bias in production data since it was collected through subjective measurements, mainly the ‘eye-estimate’ method. In the implementation phase, the eye-estimate method was used as a method to estimate the area of crops in a subdistrict to be reported as administrative data by extension officers. Estimates were made by visually sense-checking the area in the field.
In 2018, Statistics Indonesia (BPS), in partnership with the Indonesian Agency for Assessment and Application of Technology (BPPT), has successfully implemented the area sampling frame (ASF) method to improve the accuracy of estimations of the harvested area of paddy crops [13]. The result was made public in October 2018 and received appreciation from many parties. The success story of the ASF implementation on rice statistics motivated BPS to replicate the same technique to estimate the harvested area of maize, which suffered from the issue of potential overestimation for many years. Indeed, the results of the 2013 Agricultural Census and the 2018 Inter – Censal Agricultural Survey, for instance, strongly indicate that the maize harvested area statistics obtained using the conventional method, the so-called eye estimate, was overestimated. The harvested area data, which is the main component in the maize production computation besides the yield, has created a prolonged public debate around its accuracy as a policy input, particularly around how it influences the importation of maize for price stabilization. There are many criticisms from many parties such as academia, economic observers and politicians regarding this issue.
The need for an objective measurement and the fact that the ASF method was successfully implemented for estimating the harvested area of paddy crops, motivated BPS to conduct a pilot project on the implementation of the ASF for maize. The project has been implemented since April 2019. This paper provides a detailed description of the project. It covers the methodology applied, the business process of data collection, current progress and preliminary results. It also looks at some of the challenges faced which could be the subject of innovation and improvement in the future.
2.Literature review: Related experiences
One primary variable in agricultural production surveys is a crop area. There are several methods recommended by the Food and Agricultural Organization (FAO) to estimate crop area, such as the use of farmer declarations or memory recalls, the use of land surveying tools, including a Global Positioning System (GPS), and the utilization of remote sensing technology [7].
As of 2015, BPS conducted a study on the use of the memory recall approach for estimating harvested area through a household-based survey. In the survey, harvested area information of paddy and secondary food crops is collected from farmers’ declarations. Besides, a measurement by GPS was also performed for 10 percent sample of the households for comparison. The survey covered seven different provinces in Indonesia, with the sample size of 300.000 households to provide harvested area estimations up to the district level. This large sample size made the operation of the survey costly, mainly due to a massive number of field enumerators to be deployed. The survey found that the use of the farmer recall method in estimating harvested area resulted in underestimation after compared to the GPS measurement.
Our finding strongly advocates the use of GPS instead of the farmer declaration method for crop area estimation as recommended by the FAO [1]. However, our experience also pointed out that the use of GPS is less operational for a large-scale survey, particularly due to high operational costs for tracking the plots and the number of enumerators needed for conducting it. Besides, the plot measurement using GPS suffered from an accuracy issue for some parts of the survey locations, particularly in remote areas with technical problems such as the atmospheric conditions, position of satellites, and signal obstruction due to geographical reasons [7]. On the other hand, remote sensing has a great potential to estimate crops area in Indonesia. But, it is also challenging due to Indonesia’s vast geographical territory and the possibility of cloud cover. Another challenge that should be addressed is the heterogeneity of crops cultivated in a land parcel that is typical of crops cultivation in Indonesia. Thus, a further study should be conducted before the implementation of remote sensing to estimate crops area in Indonesia can be done on a wider scale.
In the case of Indonesia, there is a need for monthly information on harvested area of main crops, including maize, as the base of policy making. It is not easy to meet this need through an agricultural survey based on a list-frame. For these reasons, the use of an Area Sampling Frame (ASF) has become a preferred alternative to estimate harvested area of main crops in Indonesia. By using ASF, enumerators do not have to track the whole area of land parcels. In fact, they only need to observe the characteristics at the centre point of the statistical units, which is easier from an operational perspective. The estimation of the area is then generated from the average proportion of each observed characteristic. The ASF method may also be a useful alternative when there is a need for the estimation up to the district level. In this regard, the ASF can reduce the number of enumerators. Moreover, the field operation becomes faster and more efficient than that of a list frame survey. Besides, the territory boundaries are usually constant and more stable than the population of agricultural households [8]. Therefore, the construction of the area frame can be used in years before they need to be replaced [5] while in a list frame based survey the frame must be updated more frequently.
Since 1970s, area sampling frames have been widely used in many countries [14]. However, the studies of area frame methods have actually been initiated since decades ago. In 1938, Iowa State University began the construction of area frames for agricultural surveys. Furthermore, in the mid-1950s, the National Agricultural Statistics Service (NASS) initiated a study on the use of area sampling frames in the United States to provide a vehicle for establishing probability surveys based on complete coverage of the farm sector. It was started by conducting area frame surveys in ten states in 1954. The surveys were then expanded over time and were implemented in 1965 in the contiguous United States [5].
In China, the use of area sampling frames has been shown to be a practical and efficient means for estimating crop areas. Nevertheless, the method performs better for a crop that is cultivated on a large area than smaller varieties of crop [14]. In Rwanda, the implementation of area sampling frames used pieces of territory as segments. When the units of an area frame are pieces of territory, they should have a size that allows undertaking the groundwork in less than one working day, which usually covers an average of 10–20 fields per segment. However, in the case of landscapes with very small fields, a much greater number in segments may be cost-efficient [11]. Area frame design may give a disadvantage when the holders are to be interviewed and live far from the selected area unit. It may cause their identification to become difficult and expensive [5].
Moreover, the results of experiments in the use of area sampling frames in three pilot areas (Savvanakhet in Lao PDR, Ang Thong in Thailand, and Tahi Binh in Viet Nam) indicate that utilization of GIS technique and remote sensing provide relatively high precision in estimating rice area and production. The use of handheld devices with GPS applications make it easier for enumerators to reach the selected meshes, identify plot owners, and conduct area measurements [6].
The area sampling frames for agricultural surveys are also used in Guatemala, Costa Rica, and Ecuador. Practically, they implemented a dual sampling frame, which consists of area frames and list frames. The stratification of area frame is obtained by utilizing the percentage of cultivated surface, which sourced from a land-use map in Guatemala and Ecuador and a geo-referenced agricultural census in Costa Rica [2]. Inadequate access to the selected segments during the raining season and lack of equipment, such as GPSs and vehicles, are some of the problems faced in Guatemala [8].
Area frame designs make it possible to conduct an objective estimation of characteristics by observing on the ground, without conducting interviews. An area-based sample may provide timely estimates of the main crops area with high precision and a low response burden [5]. Besides, it is a useful alternative when list frames are not sufficiently updated. Despite the disadvantages, the completeness of the frame and non-overlapping units in an area frame are easier to be ensured compared to list frames. Moreover, the extrapolation factors are reliable and easy to compute [11].
Unfortunately, most emerging economies in Asia and the Pacific region rely on conventional or traditional methods to obtain crop statistics. The lack of detailed cadastral information and the limited number of personnel skilled in GIS and remote sensing techniques in National Statistics Offices have become the two primary reasons for area frames not being used. However, the adoption of area frames may be easier and more effective in the future due to better and cheaper satellite data [6].
3.Methodology
3.1Construction of area sampling frame for maize
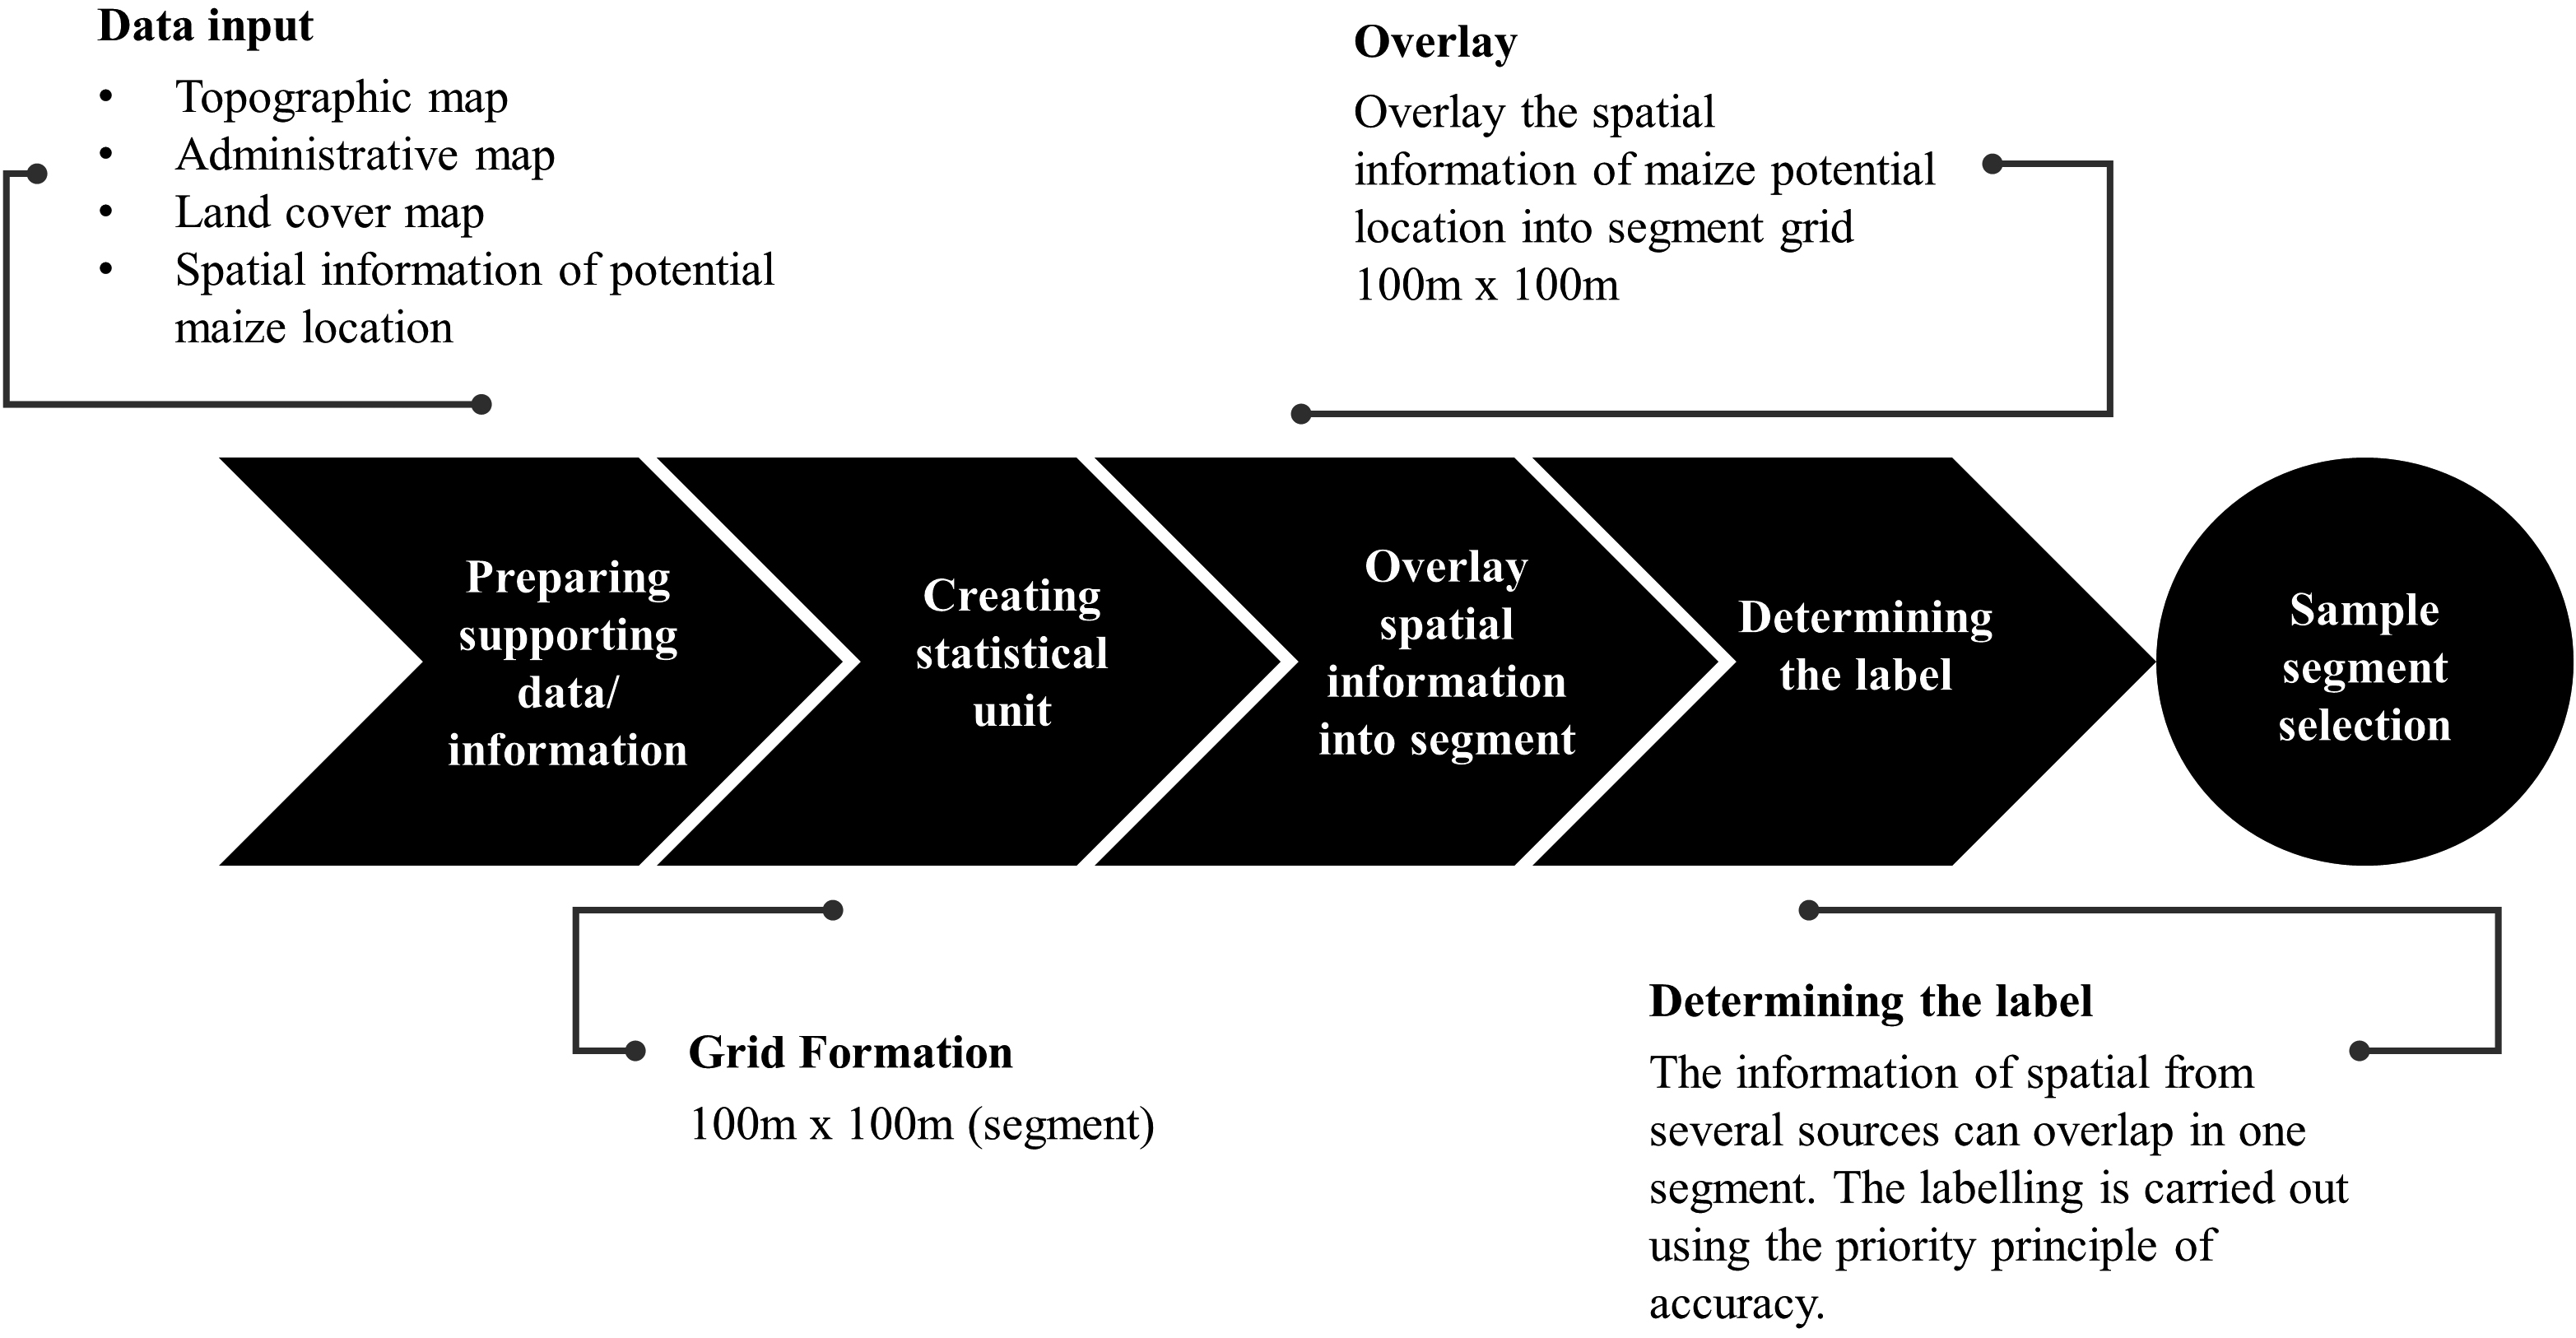
The construction of an area sampling frame (ASF) for maize in Indonesia started with collecting spatial information on the distribution of the potential location of maize cultivation as a frame. The frame construction for maize is very challenging due to insufficient spatial information about land that is specifically dedicated to maize cultivation. This was different for the construction of area sampling frame for paddy crops because of the availability of information on paddy field areas that could be obtained from satellite imagery, which is collected and officially released by the Indonesian Ministry of Land and Spatial Planning/National Land Agency. To address this challenge, BPS in collaboration with the Agency for the Assessment and Implementation of Technology (BPPT) made use of different sources of spatial information to construct the frame. There are four information sources of potential maize cultivation locations exploited in the frame construction:
Source 1: Coordinate points of maize cultivation obtained from the results of the area sampling frame for paddy.
Source 2: Field identification. Surveyors took geotagged photographs of maize cultivation locations to obtain the coordinates of land planted with maize.
Source 3: Coordinates of maize cultivation location provided by the Directorate of Cereals, in the Indonesian Ministry of Agriculture (MoA).
Source 4: Polygons of potential areas of agricultural commodities, including maize, obtained from the Agricultural Data and Information Center, MoA.
Figure 1.
Illustration of overlay process of maize locations coordinates information into segment. Source: Statistics Indonesia (BPS).
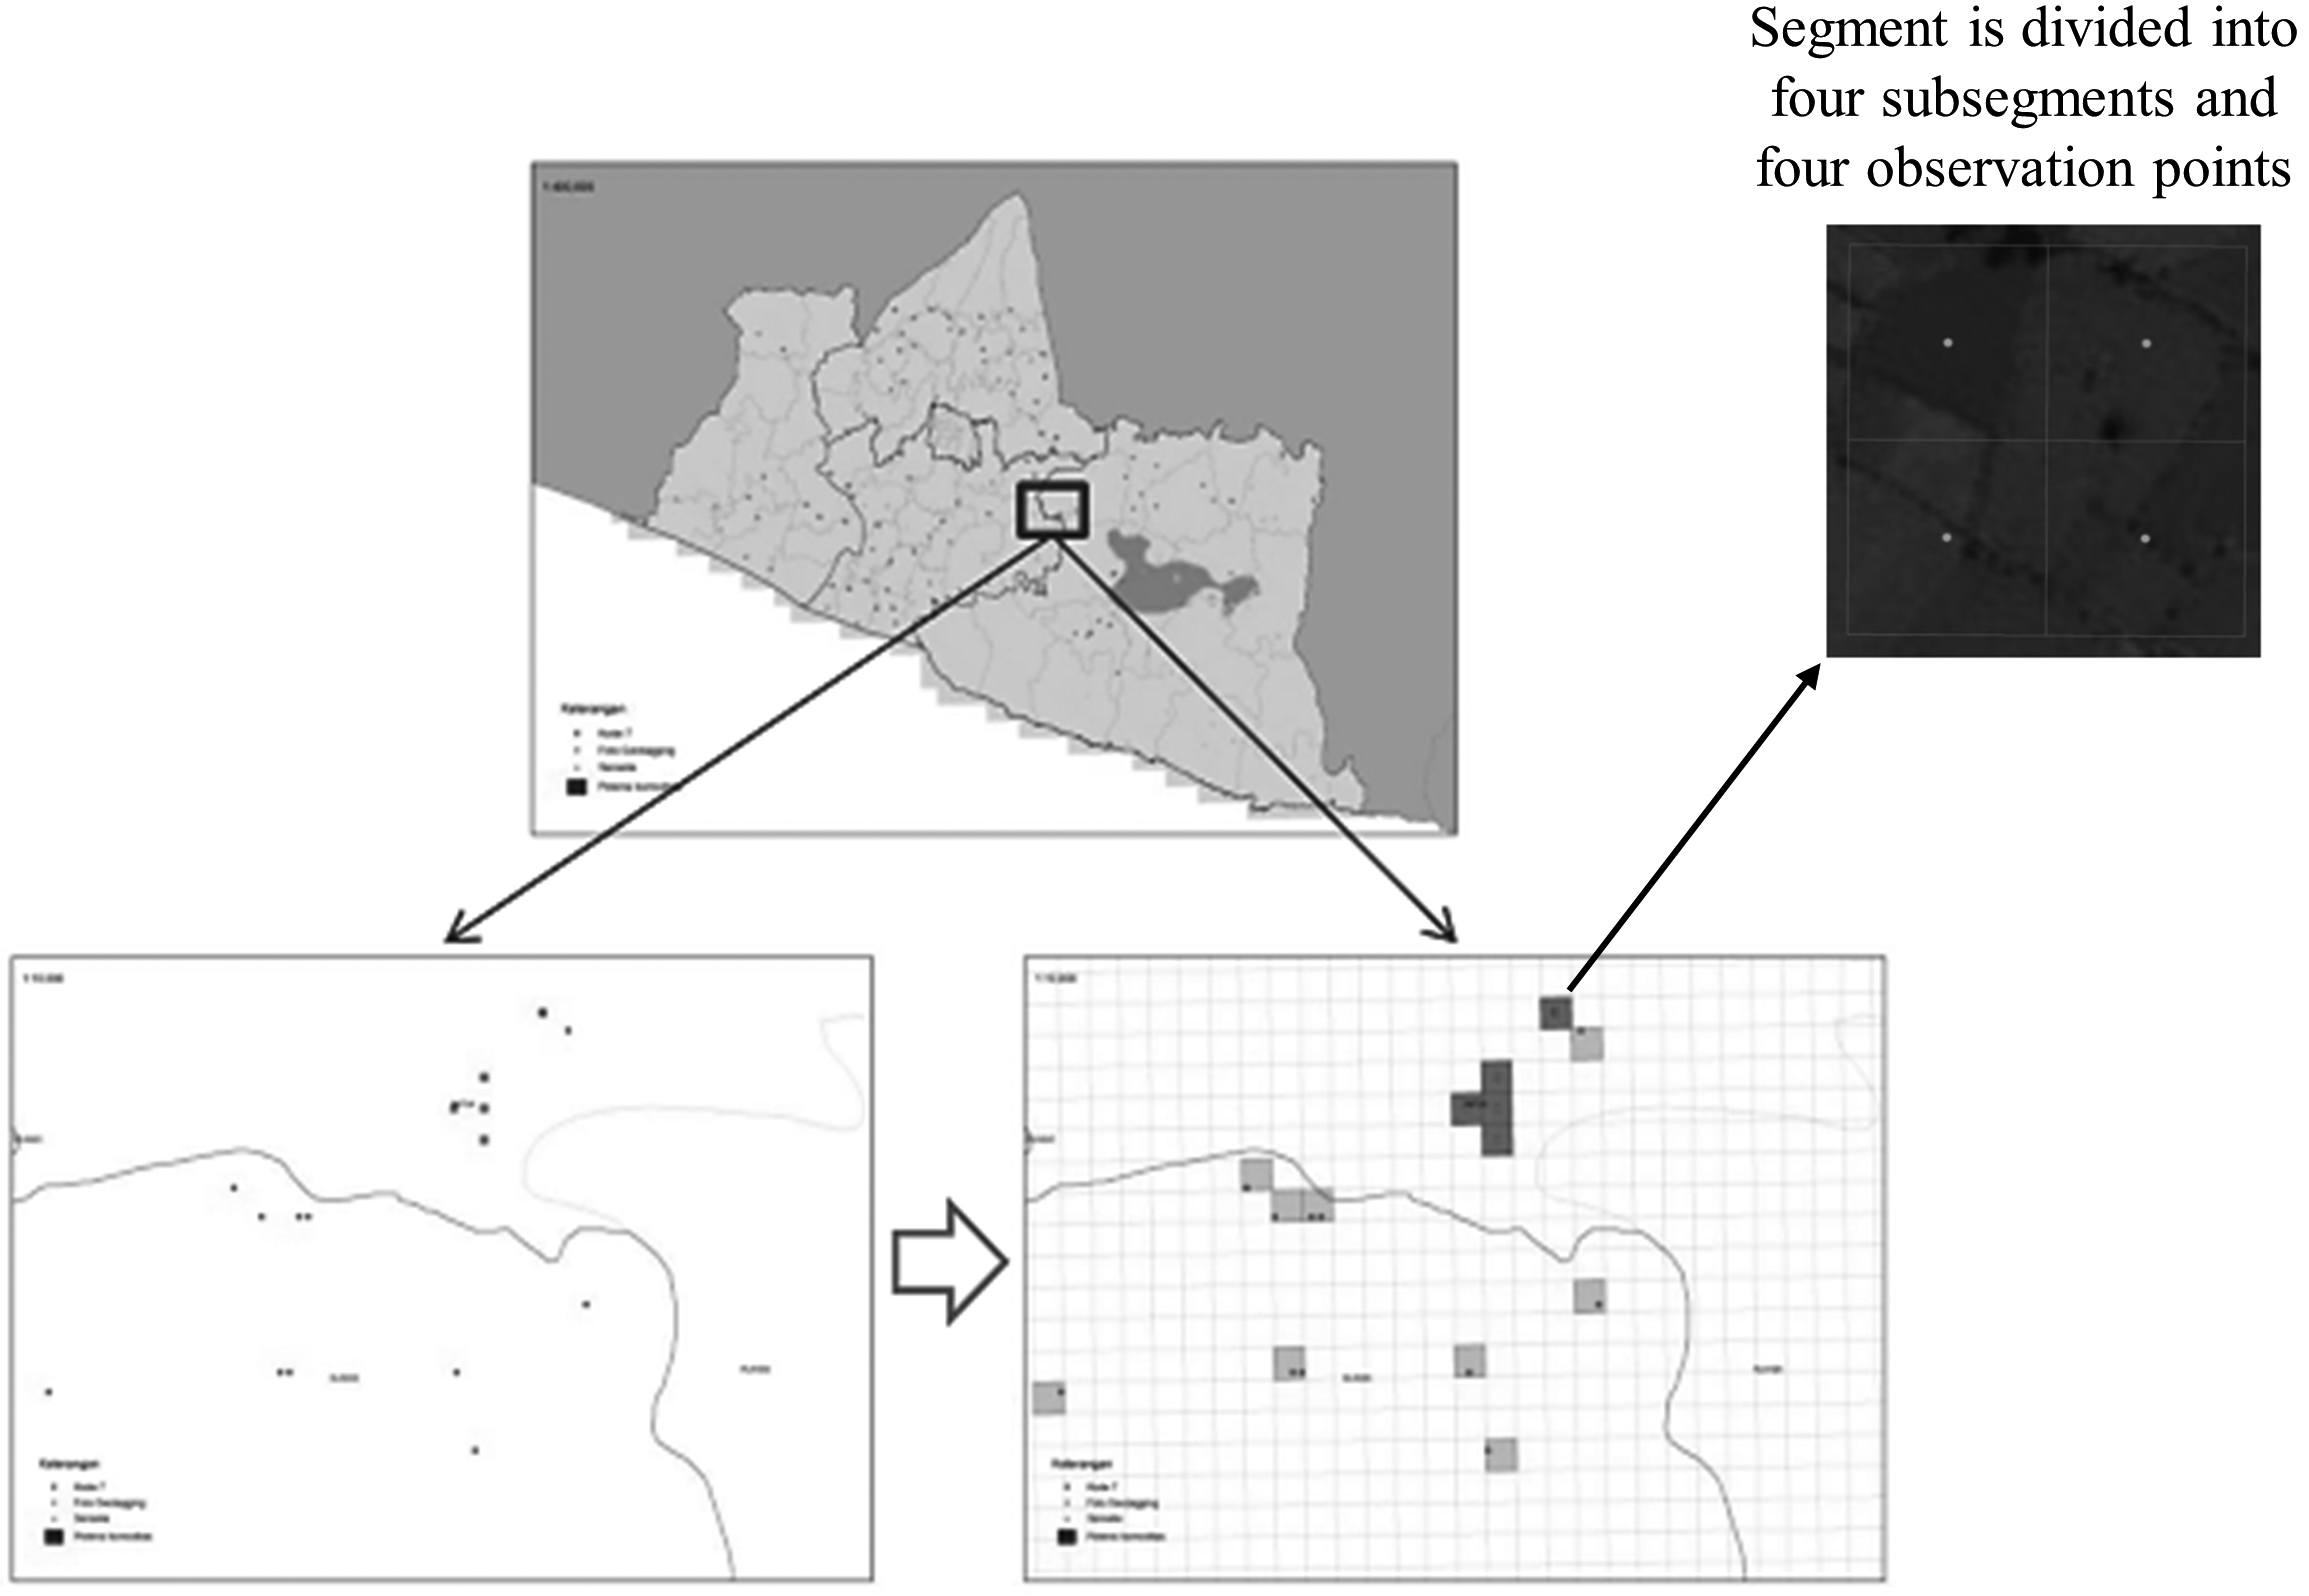
The second step was the formation of a statistical unit in the area of study. The units of an area frame can be points, transects (lines of a certain length), or pieces of territory [11]. In this project, the statistical unit is a 100 m
In the final stage, all information about the potential location of maize from the first stage was overlaid into the grid segment. If there was overlapping information, the segment labelling was conducted by selecting the following order of four possible sources previously mentioned: Source 1, Source 2, Source 3, then Source 4. Figure 1 illustrates the overlay process of maize potential location coordinates and segment grid of 100 m
To obtain the representation of observation points in each statistical unit, each segment is divided into a 50 m
Figure 2.
Construction of area sampling frame for maize.
3.2Sample size and estimation
The computation of the segment population makes use of the maximum maize planting area in 2017 obtained from the previous administrative report sourced from the Indonesian Ministry of Agriculture. The information is used because of the unavailability of information on maize field area sizes. The maximum planting area is then divided by the segment size of 100 m
(1)
In this project, the number of segment samples for each sub-district is 1 per cent of the segment population. The sample size of 1 per cent was considered as an optimum sample size to get a reliable estimation up to provincial level (the highest level of sub-national government in Indonesia). The total sample size used in this study was 21,965 segments spreading out all over 34 provinces. As each segment consists of 4 points of observation location, in total there are 87,860 points of observation locations. The selection of the segment samples utilizes a simple random sampling technique with a distance threshold of 250 meters. This means that a selected segment will be removed if it is drawn with a distance of fewer than 250 meters to any of the previously selected segments. The distance threshold approach aims to avoid the concentration of the segment samples in some areas [10].
For the sake of data management, a unique nine-digit identifier was assigned to each selected segment as implemented in ASF for paddy [13]. The first two digits represent the provincial code, following two digits represent the municipality code, the next three digits are the sub-district code, and the last two digits are the serial number of a segment in a sub-district.
The area estimation begins by estimating the average proportion of each growth phase obtained from the field observation. The average proportion is then multiplied by the area of land, which is the frame of this ASF to estimate the area of each maize growth phase. Mathematically, the estimation formula can be written as follows:
1. the average proportion of the
(2)
where
(3)
Note:
2. Total planted area for maize of each province is as follow:
(4)
the level of precision of the estimation results is measured using the relative standard error (RSE). The formula is as follow:
(5)
Note:
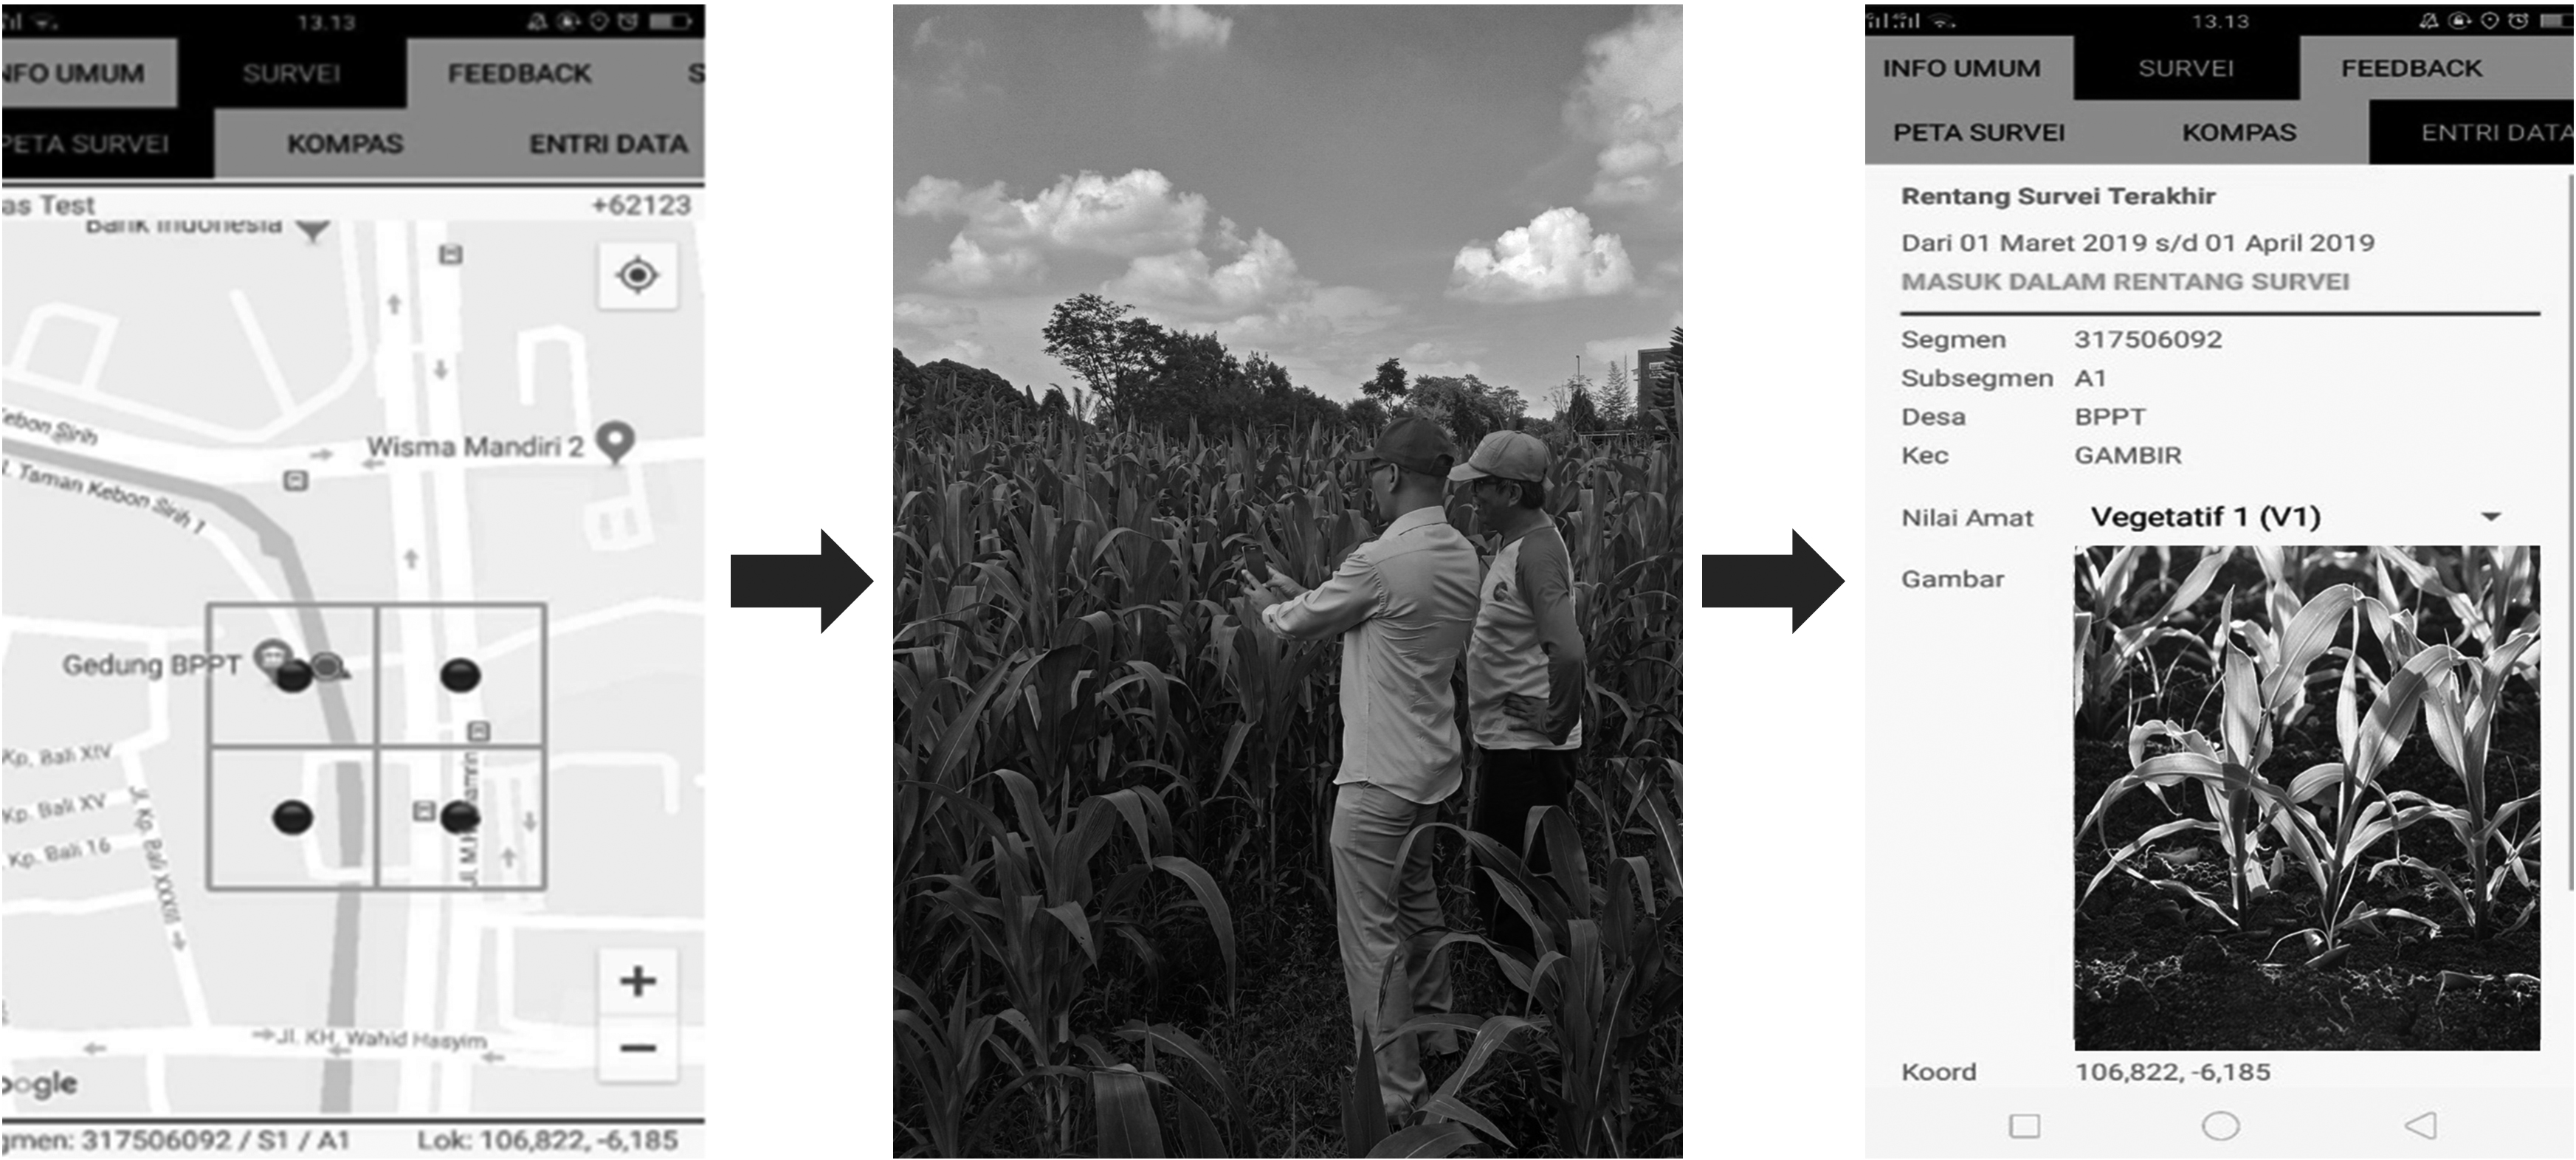
Figure 3.
Illustration of field observation and the application display. Source: Statistics Indonesia (BPS).
3.3Implementation
In conducting the field observation, enumerators used their smartphone equipped with an Android-based application that was specially developed for this project. In practice, the enumerators observe and identify the condition of the growth phase of maize at the centre points of subsegments; and ultimately take a photograph of the centre point of all subsegments in each selected segment. However, when it is not possible to reach the centre point of a subsegment, the enumerators can observe the condition of the crops within the radius of 10 meters from the centre point. The objective is to ensure the enumerators make observations within the specified sample segment location and to support the monitoring process. Direct observation at the observation points will provide objective and unbiased information [12]. The collected information on the growth phase of maize includes:
• early and final vegetative
• early and final generative
• maize harvest for livestock
• harvest in the form of sweet and baby maize, and
• standard maize harvest (dry shelled maize).
Other information collected includes land preparation, land for other crops, non-agricultural field, and damaged.
Enumerators need to know the physical boundaries of the sample segments in the field according to the coordinates of selected segments. Boundaries that can easily be located by the enumerator and supervisor are the key to quality enumeration [17]. Physical boundaries in the field can be determined using features in the application. Figure 3 shows the illustration of field observation and the application display.
The grey circle/pin in the top left hand square of the segment in the first pane represents the position of the enumerator, the four dots show the point of observation, and the rectangle is the boundary of the segment (which is divided into four subsegments). The enumerator position works properly only by activating the Global Positioning System (GPS) in their devices before visiting a selected segment.
After enumerators have completed data recording in each subsegment within a selected segment, they must send the results to the server through the application. The results consist of information on the maize growing phase and the images of vegetation at the centre point of each subsegment. However, if internet access is not available in the sample location, they can continue to observe other selected segments and send the results all together once internet access is available so long as it is completed during the observation period. During the field observation, enumerators do not have to locate the farmers since the information of maize growth phase is collected by observing the center point of the samples directly.
The observation is carried out during the last seven days of every month. In the first five days of the following month, the observation results are validated by supervisors based on images of the maize growing phases sent by the enumerator. The quality control is assured by using a web-based monitoring system specifically dedicated to make sure that an enumerator makes a visit to an assigned coordinate location and to check the consistency of the photograph with the growth phase identification reported.
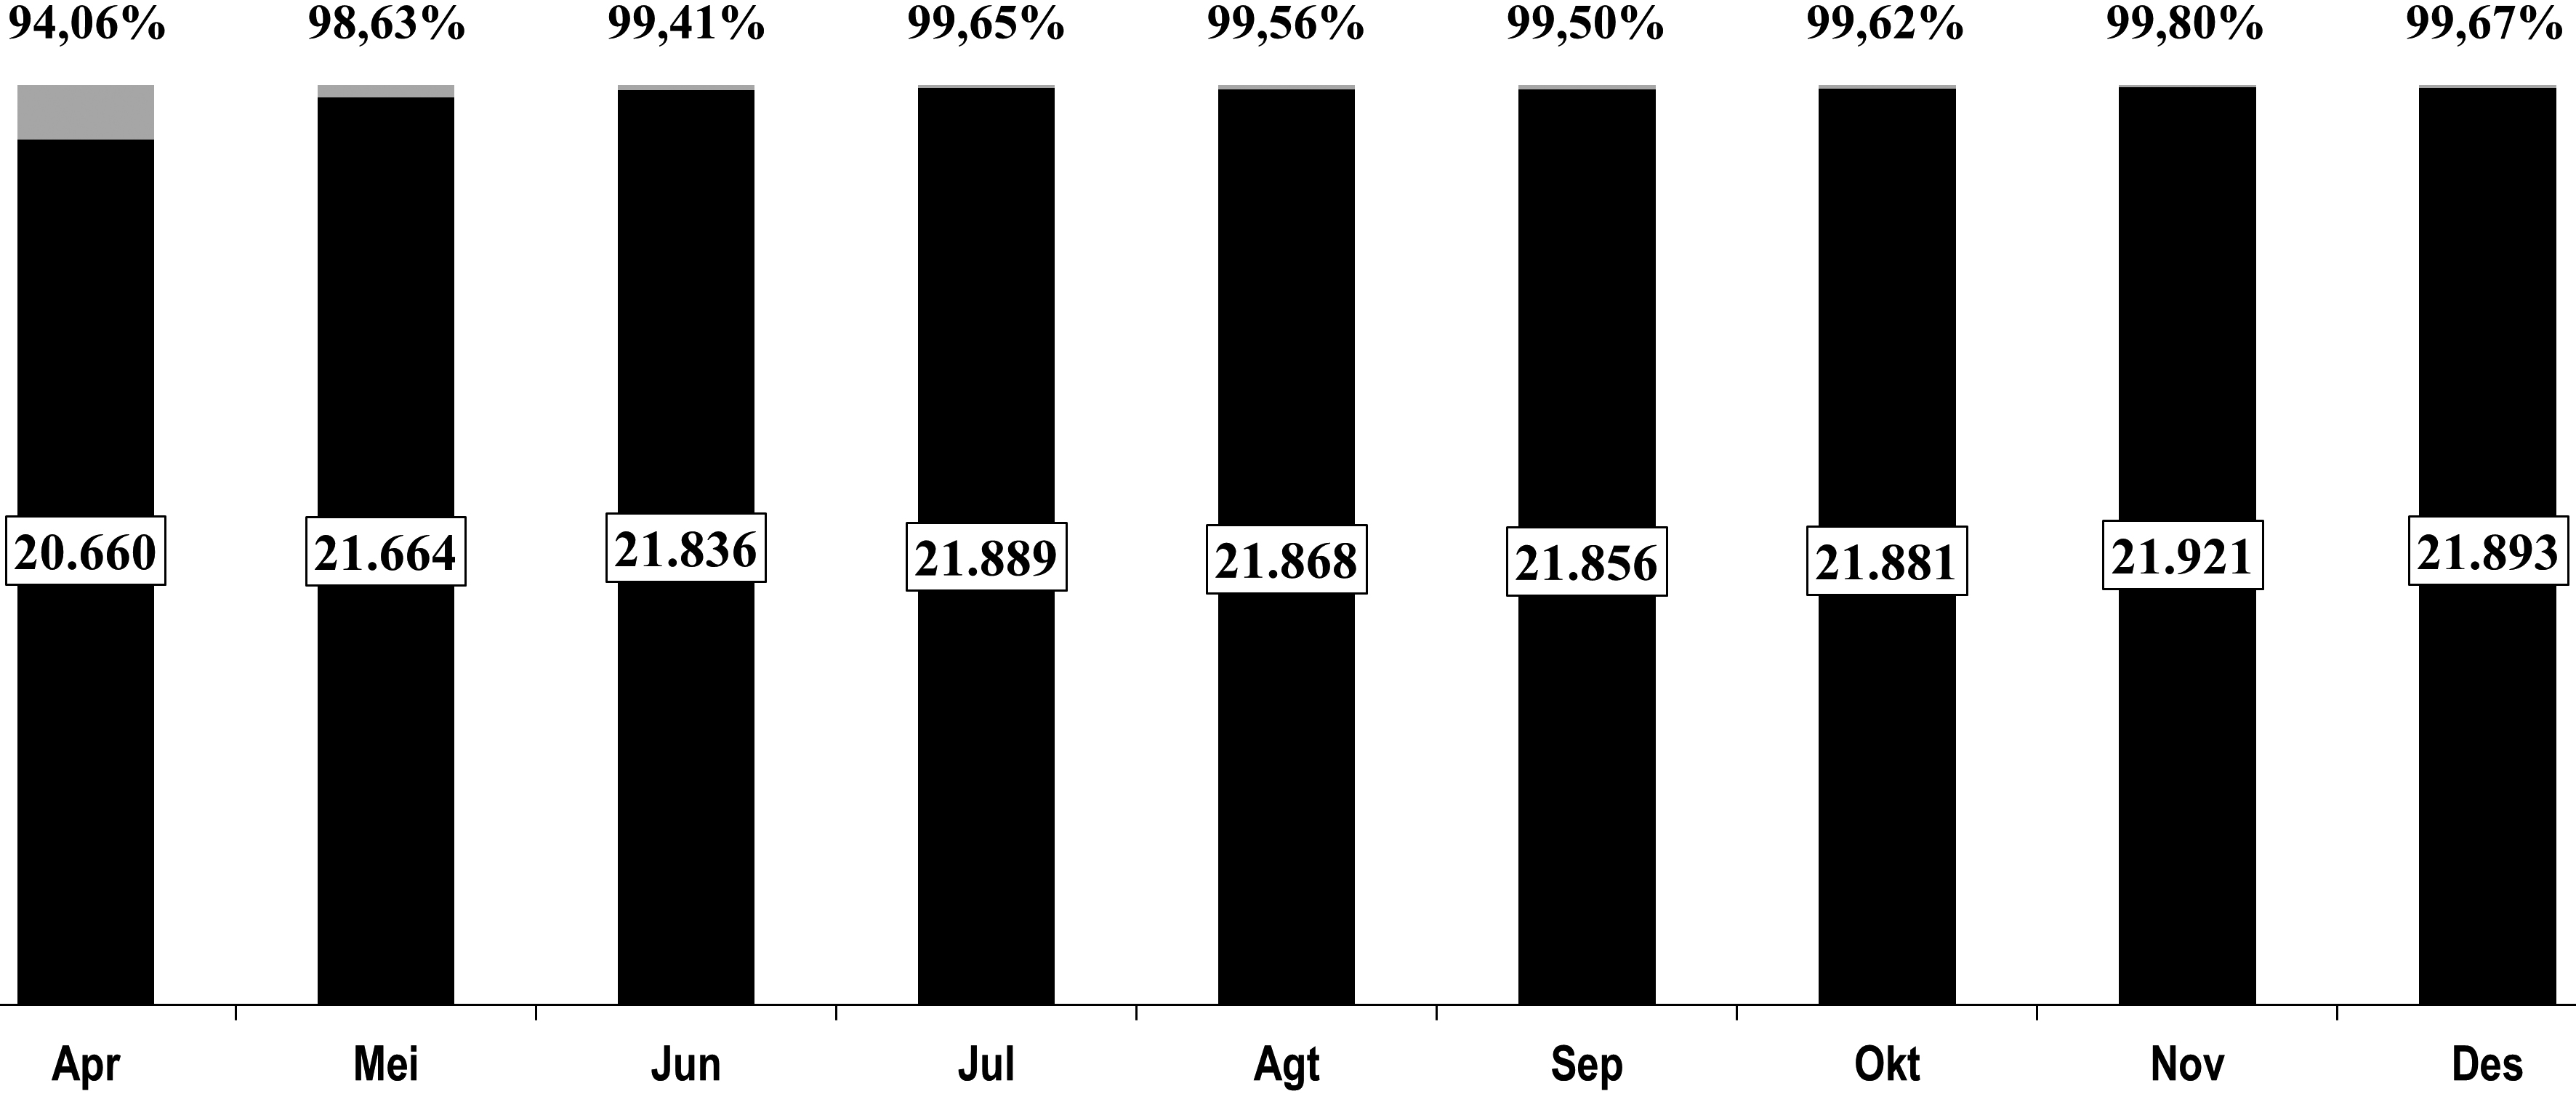
Figure 4.
The realisation of segment samples in 2019.
The survey can be considered as a panel study since the same segment samples are observed every month. The final target output is the estimation of the maize crops area according to the growth phases, which is computed by estimating the average proportion of each growth phase in each sample segment. It is also expected that the observation results for a certain month could provide predictions of the maize harvested area for the next four months.
One of the main advantages of using the ASF for maize data collection is the exploitation of so-called cost-effective technology as tools for data collection, as recommended by the Food and Agriculture Organization (FAO) in the Global Strategy to improve Agricultural and Rural Statistics (GSARS). The ASF method could be considered as a so-called use of a Bring Your Own Device (BYOD) system in data collection, since the enumerators only use their Android-based mobile phones to collect and send data to the server. This innovation allows for more efficient data collection. Moreover, the data are available much faster than before, making the data more meaningful and actionable. The previously used approach took as much as one month to generate and provide useful information due to reliance on the paper-based data collection process. Furthermore, the use of the GIS technology provides spatial information related to the maize cultivation area so that policymaking can be better targeted to specific locations.
4.Current progress and discussions
4.1Preliminary results
Since April 2019, this project has been carried out in all provinces in Indonesia, except the DKI Jakarta Province (capital region). In 2019, the total target of samples was 21,965 segments observed every month at the fixed locations. Thus far, the realisation of the project has been encouraging. As shown in Fig. 4, over 99% of the total samples have been observed every month since June 2019.
The preliminary estimation of maize harvested area has been produced with a certain degree of accuracy that is statistically acceptable. On average, the estimated RSE is less than 25 percent at the provincial level. However, the estimation for some provinces is yet not considered reliable as the estimated RSE is more than 25 percent. Therefore, further exercise is still needed to improve the accuracy of the estimation.
As already noted, the implementation of ASF for maize data collection can provide spatial information on maize cultivation all over Indonesia. Figure 5 shows an example of the spatial information produced based on the observation results in February 2020 in West Nusa Tenggara Province. The map provides us with some useful information regarding the spatial distribution of maize cultivation in the province.
Figure 5.
Example of spatial information provided for West Nusa Tenggara Province, February 2020.
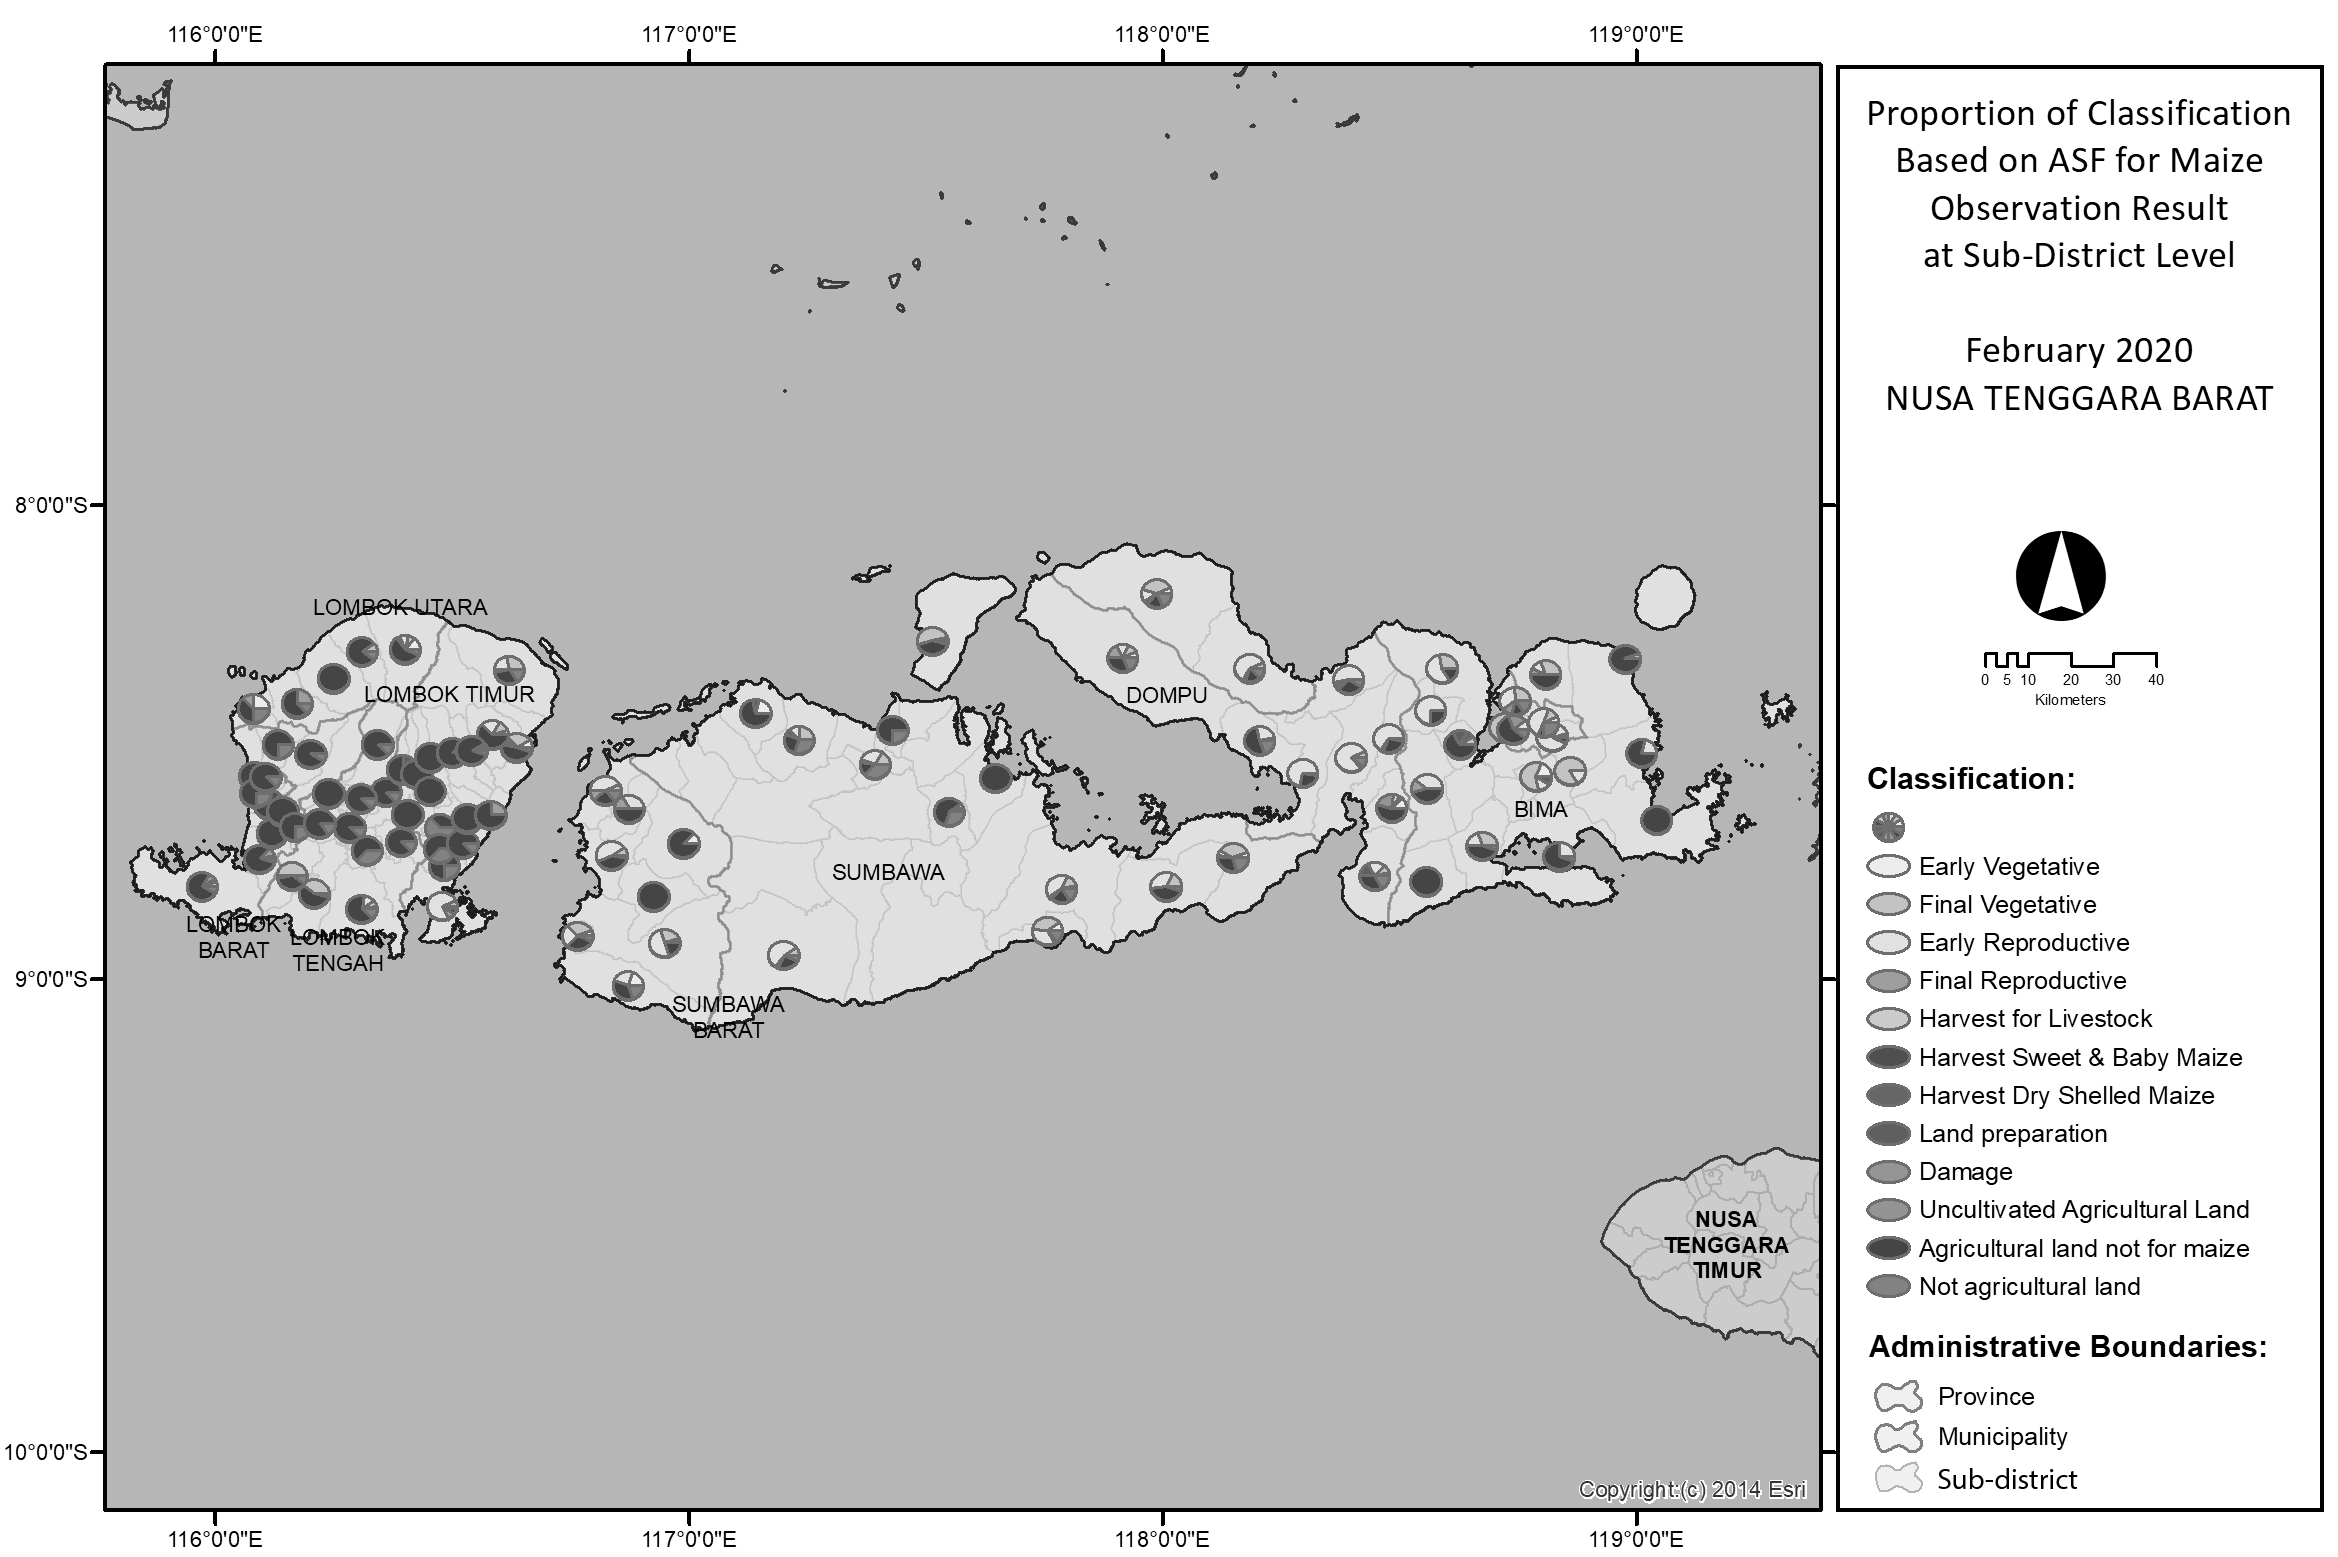
It can be seen from the map that most of the eastern region of the province was cultivating maize in the observation month period. For the sake of simplification of the presentation, the map provides only the spatial distribution of maize cultivation. More detailed information consisting of the growing phase of maize can also be generated from the data.
4.2Discussions
In the Indonesian context, the ASF method is designed to meet the need for harvested area and production data on a monthly basis to support policy making. In this regard, it offers accuracy, speed of data provision and ease of operation in the field. The use of android applications installed on enumerators’ smartphones (Bring Your Own Device) eliminates device procurement costs. Based on our experience, a traditional agricultural survey using a list frame to estimate the area requires a reasonably large number of enumerators resulting in high operational cost for data collection. In terms of area estimation, speed is the main advantage of the ASF method over a list frame based survey that requires a long process, starting from updating frames, sampling, collecting field data, processing data, and tabulating. This limitation can be addressed by the ASF, which can provide the estimation results a week after the field observation.
In implementing an area-based frame, the vast territory of Indonesia and variations in the characteristics of food crop cultivation are the main challenges. However, in the future, the integration of one ASF survey to serving multiple crops will be considered. The main challenges is the characteristics of food crops cultivation in Indonesia that vary from place to place and depend on the type of commodity. Paddy for example, is mostly cultivated in wetland while maize is dominantly in drylands. This circumstances pose a significant challenge for frame development.
Another possible development in the future is the integration of the area sampling frame method with the crop-cutting survey for maize commodity. The use of the crop-cutting survey with an area frame approach in Indonesia has been implemented since late 2018 for paddy crops. Basically, the use of a list-frame in a crop-cutting survey requires a long process as enumerators need to update the frame by visiting each household in the selected census block. The updating process is required to collect information about the existence of sample households and the prediction of crops harvested date. In practice, the business process is not only timely but also costly. Therefore, the development of a crop-cutting survey for maize integrated with area sampling frame should also be considered in the way forward.
5.Conclusion and recommendations
The critical factor for the successful implementation of the ASF method for maize is a well-built collaboration between BPS and other Indonesian government institutions, especially those with expertise in the field of geospatial technology, namely the Geospatial Information Agency (BIG), the Space Agency (Lapan), the BPPT, and those with additional expertise in land mapping, namely the Ministry of Agrarian Affairs and Spatial Planning/National Land Agency (ATR/BPN). A strong collaboration between many parties, particularly line ministries and the National Statistical Office (NSO) is needed to ensure that a significant initiative with massive coverage such as this project can be implemented successfully. In this regard, NSOs must build a strong collaboration with other agencies if there are limited personnel trained in GIS and remote sensing techniques.
The implementation of ASF for maize has changed the business process of data collection dramatically, due to the use of both an objective approach to measurement and cost-effective technology, particularly the BYOD system and GIS technology. More abundant information on maize cultivation, specifically in the form of spatial information, could also be provided to policymakers regularly and faster than before, even on a monthly basis. It allows them to be more well-informed in formulating effective policies on maize commodities in Indonesia.
The development of ASF for maize implemented by BPS could provide lessons for other countries on how to improve their method for measuring maize area, particularly their NSO or Ministry of Agriculture, and/or for whoever is in charge of producing crop statistics. As highlighted by FAO, some countries still use a traditional method such as farmer declarations or a recalling approach in measuring their crop area [7]. However, the implementation of these kinds of methods could suffer from low accuracy, such as due to faults with the measurement unit reported and the capability of farmers and enumerators in estimating the area of land parcels. Besides, the use of the list frame is practically costly and time-consuming in a large scale survey. In practice, an enumerator has to do multiple visits (door-to-door) to each household in the selected census block to update the frame and collect information on the existence of the households and the state of rice crops cultivated by the households. To overcome those issues, the use of ASF could be a favourable choice. Furthermore, there are still several challenges in the development of ASF for maize that would be the subject of innovation and improvement in the future. Some of them can be summarized as follows:
1. The availability of spatial information on maize cultivation land area due to the characteristic of maize cultivation in Indonesia, which has been a significant challenge since the beginning. For the time being, BPS is still conducting studies related to the computation of potential maize area, which is the area of land that is dedicated explicitly to maize cultivation at least once a year. One of the measures of progress is the use of remote sensing technology for maize cultivation land mapping. Information on maize land area is necessary to produce an accurate estimation of the maize harvested area.
2. The second challenge is the possibility of misidentification of the maize growth phase by the enumerator during the field observation. To address the issue, BPS is continuing to improve the business process by upgrading the web-based monitoring system as well as creating an Android-based monitoring system. BPS plans to develop a machine learning model to identify the maize growth phase automatically in the near future.
3. Another potential challenge are the geographical difficulties presented in some parts of each region. Enumerators sometimes require more effort in reaching observation points in some areas, especially in mountainous areas. Moreover, the coverage of the implementation is quite massive since Indonesia is a vast archipelago. As a result, a massive number of enumerators is deployed for field observation. Even though it involves quite a massive number of enumerators, the number of enumerators is smaller than if the data collection is carried out through a list frame-based agricultural survey regardless of whether the area information is collected through measurements or farmers declaration. Currently, BPS-Statistics Indonesia is also developing a combination of the ASF and remote sensing for paddy to reduce the burden of conducting field observations. In practice, the growth phase of paddy in some ASF samples will be determined through satellite imagery interpretation and classification using machine learning models.
Acknowledgments
We gratefully thank James J. Cochran for his kind mentorship and insightful suggestions of the manuscript. We also would like to thank BPS-Statistics Indonesia and ESCAP for supporting this work.
References
[1] | 50x2030 Initiative. A Guide to the 50x2030 Data Collection Approach: Questionnaire Design. Technical Paper Series #2. (2020) . Rome. Available from: 50x2030.org. |
[2] | Ambrosio L. MULTIPLE-FRAME SAMPLING. Available from: http://gsars.org/wp-content/uploads/2016/10/Ambrosio_L_Multiple-frame-sampling.pdf. |
[3] | BPS. Laporan Akhir Survei Luas Panen dan Luas Lahan Tanaman Pangan. (2015) . Jakarta: BPS. |
[4] | BPS. Pedoman Teknis Pendataan Statistik Pertanian Tanaman Pangan Terintegrasi dengan Metode Kerangka Sampel Area untuk Komoditas Jagung. (2019) . Jakarta: BPS. |
[5] | Cotter J, Davies C, Nealon J, Roberts R. Area frame design for agricultural surveys. Agricultural survey methods. (2010) Apr 16: 169–92. doi: 10.1002/9780470665480.ch11. |
[6] | Durante AC, Lapitan P, Megill D, Rao LN. Improving Paddy Rice Statistics Using Area Sampling Frame Technique. Asian Development Bank Economics Working Paper Series. (2018) Nov 28: 565. doi: 10.22617/WPS189643-2. |
[7] | FAO. Handbook on crop statistics: improving methods for measuring crop area, production and yield. (2018) . Available from: fao.org. |
[8] | FAO. Handbook on Master Sampling Frames for Agricultural Statistics. (2015) . Available from: fao.org. |
[9] | FAO, World Bank, and UNSC. Action Plan of The Global Strategy to Improve Agricultural and Rural Statistics. (2012) . Available from: fao.org. |
[10] | Gallego FJ. Sampling frames of square segments. Luxembourg: European Commission; (1995) . |
[11] | Gallego FJ. Area Sampling Frames for Agricultural and Environmental Statistics. (2015) . EUR 27595 EN. doi: 10.2788/88253. |
[12] | Mubekti M, Sumargana L. Pendekatan kerangka sampel area untuk estimasi dan peramalan produksi padi. Jurnal Pangan. (2016) Sep 5; 25: (2): 71–146. doi: 10.33964/jp.v25i2.323. |
[13] | Muhlis. Area Sampling Frame: A New Approach to Reform Agricultural Data Collection. Asia-Pacific Economic Statistics Week. (2018) . Available from: https://communities.unescap.org/asia-pacific-economic-statistics/apes-2018-featured-papers. |
[14] | Pan Y, Wang M, Wei G, Wei F, Shi K, Li L, Sun G. Application of Area-frame sampling for agricultural statistics in China. In Proceedings of the Fifth International Conference on Agricultural Statistics (ICAS-V). (2010) . Rome: FAO. Available from: fao.org. |
[15] | Peter Rosner L, McCulloch N. A note on rice production, consumption and import data in Indonesia. Bulletin of Indonesian Economic Studies. (2008) Apr 1; 44: (1): 81–92. doi: 10.1080/00074910802001595. |
[16] | Ruslan K. Some issues around maize production data. The Jakarta Post [newspaper on the internet]. (2019) March 26 [cited 2020 Sep 9]. Available from: https://www.thejakartapost.com/academia/2019/03/26/some-issues-around-maize-production-data.html. |
[17] | Wigton WH, Bormann P. A guide to area sampling frame construction utilizing satellite imagery. (1978) Mar. Available from: http://handle.nal.usda.gov/10113/31906. |

