
Governance, peace, and security perception index: Methodological aspects and application in the WAEMU member states
Abstract
By developing a methodology to measure citizens’ perceptions of governance, peace, and security, AFRISTAT has provided authorities at various levels with a policymaking tool. The governance, peace, and security perceptions index and its components are measured at the sub-regional level and are based on population groups. The methodology is based on the method that has been adopted to calculate the Global Governance Index and was applied to data from a household survey by using the governance, peace, and security module. Applying the data from the Integrated Regional Survey on Employment and the Informal Sector of the eight WAEMU member states made it possible to present perceptions of citizens, aged 18 and above, on “human rights and participation,” “rule of law,” and “peace and security.” The results indicate that individuals aged 18 and above in the WAEMU member states have good perceptions of governance, peace, and security with a perception index of 0.701. The perception of the rule of law is low (0.524), which is reflected in the low perception of the judicial system and the absence of corruption.
1.Introduction
Based on data analysis of the Integrated Regional Survey on Employment and the Informal Sector (French acronym ERI-ESI) of the West African Economic and Monetary Union (WAEMU) member states, AFRISTAT proposed a methodology to calculate the citizens’ governance, peace, and security perception index (
This article describes the methodological approach used to calculate the governance, peace, and security perception index and its indicators. It also presents the indices and profiles of the administrative regions of the WAEMU member states.
2.Context
For a long time, demand for data in Africa has been on traditional areas of macroeconomic management and sectoral programs and so National Statistics Offices (NSOs) and government ministries, departments and agencies (MDAs) have been producing data to meet the needs of:
• Macroeconomic frameworks including National Development Plans, Poverty Reduction Strategies, MDAs themselves, Human Development Reports and Medium Term Expenditure Frameworks, and
• Sectoral policies and programs on agriculture, education, health, housing, infrastructure, water, etc.
However, there is now increasing demands in the world, particularly in Africa for data on new policy and development areas that include human rights and freedom, democracy and governance (what Statistics South Africa has termed ‘holy cows’ as these were outside the scope of statistical work in most countries). In fact, since the end of the 1990s, the promotion of good governance has become a priority for large international organizations such as the World Bank and the IMF, in the process of implementing their programs of support for development and poverty reduction. This interest was the basis for the development of indicators and data collection tools on governance in sub-Saharan African countries.
Governance, peace and security (GPS) are a major concern and a strategic issue for the African Union as a prerequisite for socio-economic and political development of Africa. In fact, these are part of the strategic pillars of the African Union Commission that include (i) Peace and Security, (ii) Integration, Development and Cooperation (iii) Shared Values, and (iv) Institutional Strengthening and Capacity Building. At global level, the Sustainable Development Goal (SDG) number 16 aims to “Promote peaceful and inclusive societies for sustainable development, provide access to justice for all and build effective, accountable and inclusive institutions at all levels”.
It was mentioned earlier that the African statistical community together with pan-African organizations developed the Strategy for the Harmonization of Statistics in Africa (SHaSA) to support the African integration agenda and development processes. Realizing the importance of supporting Governance, Peace and Security to the said agenda and processes, SHaSA provided for the establishment of Technical Working Groups on Governance, Peace and Security (TWG-GPS). A total of 13 working groups on various areas were established. In November 2012, the Committee of Directors General of African NSOs approved the methodology, an action plan and 5 year budget to take the work forward. Twenty (20) countries officially confirmed their interest in piloting SHaSA-GPS. In addition, a Praia City Group11 on GPS statistics was established at continental level to take this work forward. At global level, the 45th Session of the UN Statistical Commission considered the proposal for the establishment of a City Group on Governance, Peace and Security which demonstrates a willingness to provide GPS statistics.
3.Importance of the citizens’ governance, peace, and security perceptions index
Over the past decade, governance, human rights, peace, and security within sub-Saharan Africa have become topical subjects that are of interest to everyone, and they have experienced a resurgence of interest with the adoption of the Sustainable Development Goals (SDGs) for 2030 and Africa’s Agenda 2063. However, it is difficult to have a comprehensive idea of citizens’ perceptions by analyzing the responses of all citizens through questionnaires.
Although some of the existing international measures of governance use data on citizens’ perceptions for some of the dimensions of these indices, they are based on aggregates measured at the country level and then ranked between countries based on a reference country. Therefore, it is difficult to use them at the country level to analyze differences in perceptions among regions and groups.
The indicators, which have three functions22 (to inform, alert, and enable action and steering), seem to be the most suitable tools to understand citizens’ perceptions of governance in sub-Saharan Africa. The implementation of a citizens’ governance, peace, and security perception index provides information on the measurement of governance from the citizens’ point of view and alert policymakers. It is also used to set up strategies and strengthen the actions of policymakers to ensure good governance for development and sustainability of the citizens.
The governance, peace, and security perception index is based on citizens’ experience and perceptions of the efforts of authorities at various levels in public management, justice, and security. It is an intra-country measure, which gives perception of several dimensions of governance, unlike some internationally developed indices that rank countries with the country assumed to be in the best position.
It is designed to:
• Assess/appraise citizens’ perceptions of GPS at national, regional, and local levels.
• Monitor changes in public perceptions over time.
• Have a barometer to anticipate tensions and threats to security (crises and conflicts).
The
The
• To encourage policymakers and development stakeholders to act and respond to the current state of governance, democracy, human rights, peace, and security.
• To provide a comprehensive vision of governance and its indicators.
• To propose an intra-country comparison and an analysis of the citizens’ profile.
4.Data and methodology
4.1Data
The data used to calculate the
The ERI-ESI, conducted in 2017 and 2018 in WAEMU member states, is representative of each of the regions of the eight WAEMU member states. In Mali, the survey was not conducted in the Kidal region due to security reason.
The survey used household, informal sector, and employment questionnaires for individuals aged 10 and above, and it included a GPS module that was administered to individuals aged 18 and above in selected households.
Table 1
Sample surveyed for the ERI-ESI GPS / SHaSA module by country
| Benin | Burkina Faso | Côte d’Ivoire | Guinea-Bissau | Mali | Niger | Senegal | Togo | Total | |
|---|---|---|---|---|---|---|---|---|---|
| Number of regions or departments | 12 | 13 | 14 | 9 | 8 | 8 | 14 | 6 | 84 |
| Sample surveyed for the GPS module | 19355 | 12723 | 30272 | 20 182 | 20 613 | 14522 | 54 951 | 15074 | 187 692 |
In creating the
• The observation unit: Individuals aged 18 and above.
• The unit of analysis: Households.
The information collected on individuals aged 18 or above through the GPS module was brought back to their households to calculate the elementary indices and the various dimensions of the indices. The transition from the observation unit to the unit of analysis (households) was done by averaging and normalizing the householders’ responses.
Some variables, such as dichotomous and ordinal variables, were recoded to make them compatible with the objective. This technique ensures harmonization in the variable coding system. Indeed, for certain dichotomous variables which express a good appreciation of a topic, the code given is “0” and for others “1”. Thus, the code “1
• Dichotomous variables were coded 1
• The ordinal variables “1
Otherwise, the importance of the disaggregation of data on governance is no longer to be demonstrated and allows for a better analysis of the concept of “leaving no one behind”. Indeed, the development of individual profiles according to their assessment of the governance situation in the country makes it possible to take into account the concerns of different layers of the population. In addition, meeting the demands of decentralization has become a priority for the national statistical system, hence the need to produce sub-national data.
4.2Methodological aspects of constructing the perception index on GPS
4.2.1Different dimensions and their indicators
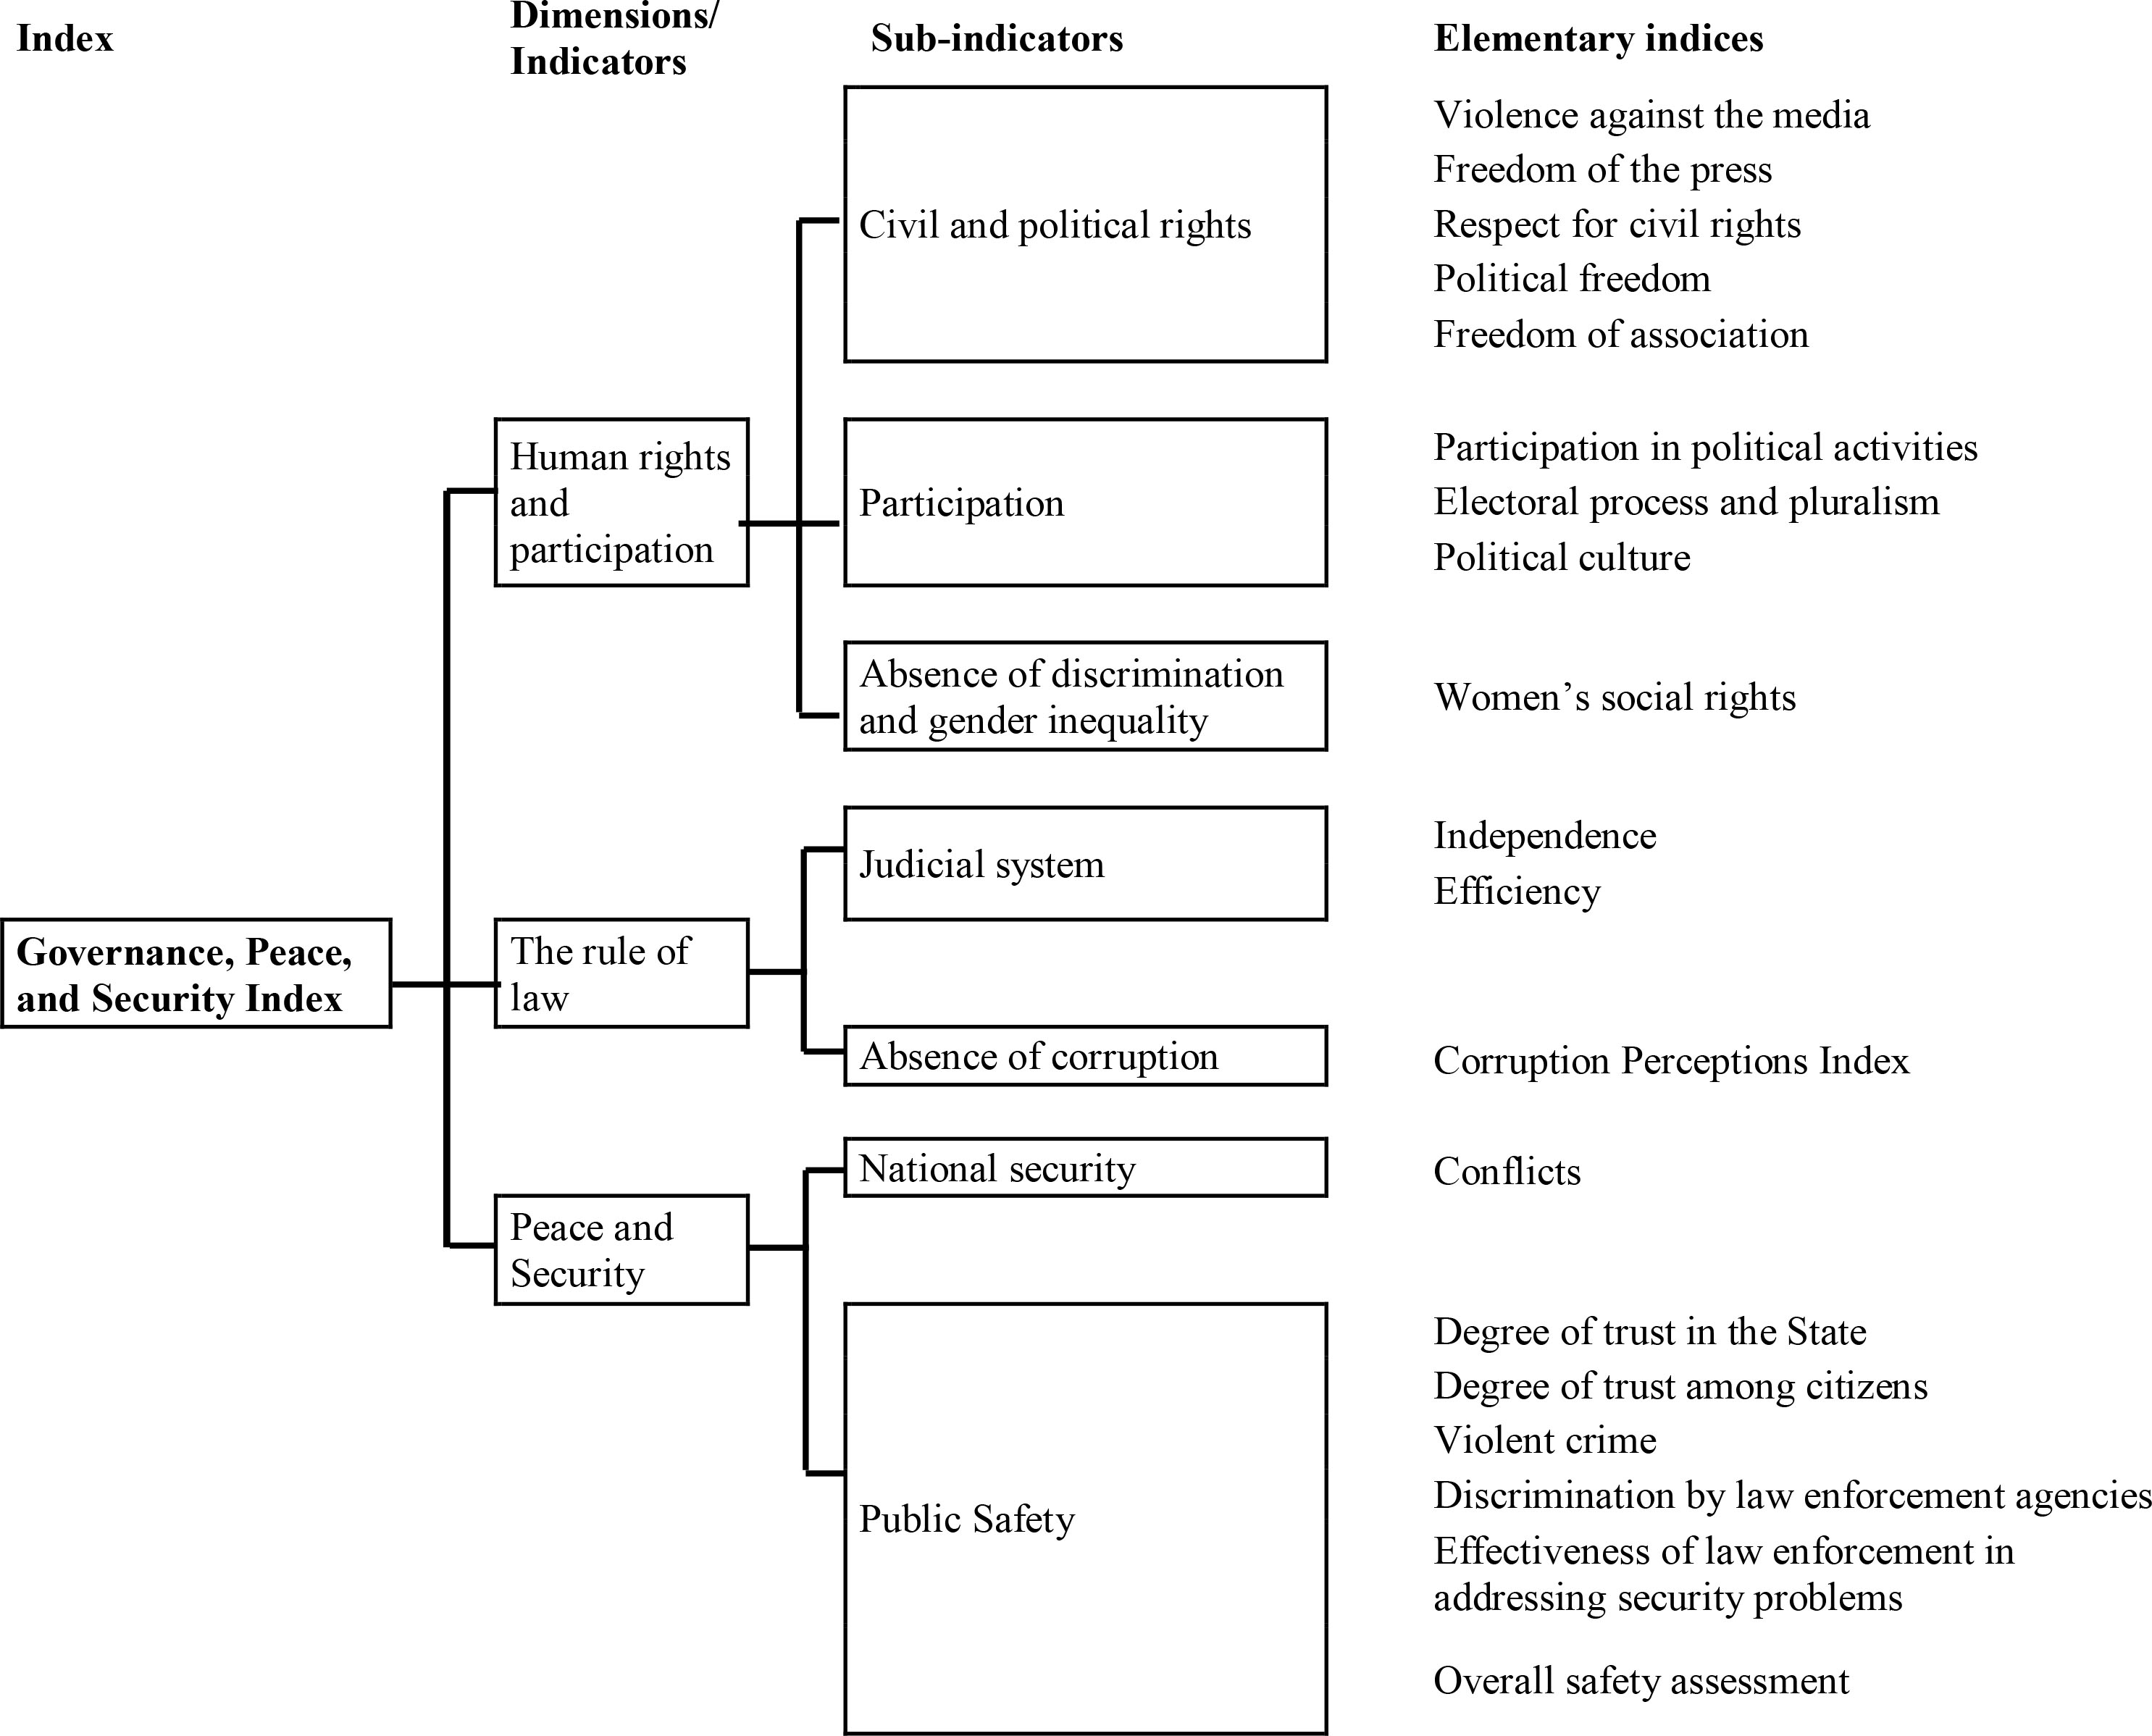
The index of citizens’ perceptions of GPS is based on three dimensions: (i) human rights and participation, (ii) the rule of law and, (iii) peace and security. Each of the dimensions is made up of sub-indicators under which the various elementary indices calculated were grouped. The dimensions used to calculate the
The following figure shows the conceptual framework of the index.
Figure 1.
Conceptual diagram of the
4.2.2Development of the IGPS
The methodological approach used to calculate the
Data aggregation approach, calculation, and standardization of elementary indices
Let
•
or
•
Calculation of sub-indicators and indicators
The sub-indicators are calculated based on the elementary indices, which are the normalization of variables at the household level. When an elementary index is composed of several variables, it is calculated as a simple arithmetic average of the normalized
For each of the elementary indices and sub-indicators, the values range from 0 to 1, where 0 and 1 represent the worst and best possible scores, respectively.
Let us adopt the following notations:
• Variables (
•
•
•
The elementary index
Each sub-indicator is the arithmetic average weighted by the number of variables in the elementary indices that it is composed of.
The sub-indicator
Each indicator is the arithmetic average weighted by the number of variables in the sub-indicators that it is composed of.
Calculation of the IGPS
The
Therefore, the
4.3Method of analysis
The results of the application of the methodology for calculating the
4.3.1Average comparison test
The
Null hypothesis: There is no difference between the averages of the two independent groups. Therefore, the difference between the two averages in the population is 0, implying that the two groups are in the same population.
The alternative hypothesis is that there are differences in the two averages.
One of the reasons why the
4.3.2Ascending hierarchical classification and cluster’s characterization
We used the ascending hierarchical classification to gather the administrative regions of similar member states into various clusters. The indicators of the three dimensions or components of the
Thus, the higher the test value (in absolute value) and the smaller the probability, the more the variable describes the cluster. A negative test value indicates that the average of a variable in a cluster is lower than the average in the entire sample. By contrast, a positive test value indicates that the average of a variable in a cluster is higher than the average for the entire sample.
5.Results
5.1Different perceptions of GPS among citizens of WAEMU member states
Table A2 presents the
The analysis, which is based on the three dimensions, shows that the one with the least perception is “peace and security,” followed by “human rights and participation.” By contrast, people have a low perception of the “rule of law”.
Table 2
Country profiles of the
| Characteristics of the head of household | Civil and political rights | Participa-tion | Absence of discrimination and gender inequality | Human rights and participation | Judicial system | Absence of corruption | Rule of law | National security | Public Safety | Peace and security | Gover-nance. peace and security index |
| Countries | |||||||||||
| Benin | 0.666 | 0.636 | 0.564 | 0.636 | 0.459 | 0.403 | 0.412 | 0.515 | 0.723 | 0.708 | 0.640 |
| Burkina Faso | 0.736 | 0.615 | 0.720 | 0.654 | 0.534 | 0.495 | 0.489 | 0.472 | 0.785 | 0.761 | 0.688 |
| Côte d’Ivoire | 0.714 | 0.597 | 0.810 | 0.660 | 0.604 | 0.558 | 0.566 | 0.316 | 0.780 | 0.746 | 0.695 |
| Guinea-Bissau | 0.609 | 0.478 | 0.745 | 0.553 | 0.426 | 0.555 | 0.534 | 0.598 | 0.815 | 0.799 | 0.696 |
| Mali | 0.694 | 0.661 | 0.731 | 0.680 | 0.432 | 0.402 | 0.407 | 0.529 | 0.791 | 0.772 | 0.687 |
| Niger | 0.796 | 0.703 | 0.667 | 0.728 | 0.680 | 0.601 | 0.614 | 0.571 | 0.831 | 0.812 | 0.757 |
| Senegal | 0.800 | 0.692 | 0.801 | 0.740 | 0.700 | 0.616 | 0.630 | 0.689 | 0.806 | 0.797 | 0.755 |
| Togo | 0.730 | 0.598 | 0.813 | 0.665 | 0.429 | 0.498 | 0.486 | 0.558 | 0.707 | 0.697 | 0.653 |
| WAEMU | 0.732 | 0.639 | 0.738 | 0.679 | 0.561 | 0.519 | 0.524 | 0.500 | 0.783 | 0.762 | 0.701 |
| Residence | |||||||||||
| Capital/main | 0.656 | 0.574 | 0.763 | 0.622 | 0.484 | 0.472 | 0.474 | 0.504 | 0.754 | 0.735 | 0.663 |
| city | |||||||||||
| Other urban | 0.715 | 0.633 | 0.736 | 0.671 | 0.562 | 0.512 | 0.519 | 0.476 | 0.775 | 0.753 | 0.693 |
| All urban | 0.688 | 0.606 | 0.749 | 0.648 | 0.526 | 0.494 | 0.498 | 0.489 | 0.765 | 0.745 | 0.679 |
| Rural | 0.762 | 0.662 | 0.730 | 0.699 | 0.585 | 0.536 | 0.541 | 0.507 | 0.794 | 0.773 | 0.715 |
Source: Integrated Regional Survey on Employment and the Informal Sector of the WAEMU member states, 2017–2018.
Table 3
Level of appreciation of the peace and security component elementary indices by individuals aged 18 and above (WAEMU, 2017–2018)
| Peace and security elementary indices | WAEMU member states | ||||||||
|---|---|---|---|---|---|---|---|---|---|
| Benin | Burkina Faso | Côte d’Ivoire | Guinea-Bissau | Mali | Niger | Senegal | Togo | WAEMU | |
| Conflicts | 0.515 | 0.472 | 0.316 | 0.598 | 0.529 | 0.571 | 0.689 | 0.558 | 0.500 |
| Degree of trust in the State | 0.626 | 0.647 | 0.655 | 0.642 | 0.669 | 0.710 | 0.663 | 0.615 | 0.659 |
| Degree of trust among citizens | 0.550 | 0.620 | 0.613 | 0.700 | 0.627 | 0.678 | 0.637 | 0.509 | 0.616 |
| Violent crime | 0.972 | 0.974 | 0.975 | 0.984 | 0.982 | 0.986 | 0.978 | 0.985 | 0.978 |
| Discrimination by law enforcement agencies | 0.830 | 0.944 | 0.928 | 0.942 | 0.923 | 0.957 | 0.965 | 0.812 | 0.921 |
| Effectiveness of law enforcement in addressing security problems | 0.593 | 0.624 | 0.577 | 0.518 | 0.667 | 0.741 | 0.646 | 0.624 | 0.634 |
| Overall safety assessment | 0.617 | 0.637 | 0.691 | 0.780 | 0.675 | 0.774 | 0.671 | 0.630 | 0.678 |
Source: Integrated Regional Survey on Employment and the Informal Sector of the WAEMU member states, 2017–2018.
The overall
The violent crime elementary index refers to threats or incidents experienced by citizens. The elementary index is close to 1, which indicates a very positive perception. Regarding the effectiveness of law enforcement agencies in dealing with security problems, the average perceptions of citizens are very positive. On the other hand, perceptions of trust in the state and trust among citizens are average.
To assess the differences in perception based on households’ standard of living and the level of education of heads of households, we conducted two tests to compare the averages within a country and among WAEMU member states:
• Sub-group of individuals in poor households versus those in wealthy households.
• Sub-group of individuals in households where the head of the household is uneducated versus those in households where the head of the household is educated.
The
Table 4
Test of differences in the average of the IGPS and its components according to households’ wealth quintile and the level of education of the heads of households
| WAEMU | Wealth quintile (Lowest # Highest) | Level of education of the HH | ||||||
|---|---|---|---|---|---|---|---|---|
| countries | Human rights and participation | Rule of law | Peace and security | Governance. peace and security index | Human rights and participation | Rule of law | Peace and security | Governance. peace and security index |
| Benin | 0.028 | 0.009 | 0.015 | 0.017 | ||||
| Burkina Faso | 0.011 | 0.007 | 0.004 | 0.049 | 0.008 | 0.008 | ||
| Côte d’Ivoire | 0.056 | 0.048 | 0.023 | 0.035 | 0.070 | 0.055 | 0.030 | 0.044 |
| Guinea-Bissau | 0.000 | 0.020 | 0.053 | 0.010 | 0.011 | |||
| Mali | 0.015 | 0.017 | 0.068 | 0.002 | 0.017 | |||
| Niger | 0.064 | 0.117 | 0.030 | 0.047 | 0.063 | 0.009 | 0.027 | |
| Senegal | 0.039 | 0.040 | 0.003 | |||||
| Togo | 0.011 | 0.028 | 0.061 | 0.013 | 0.025 | |||
| WAEMU | 0.019 | 0.002 | 0.034 | 0.049 | 0.027 | 0.032 | ||
Source: Integrated Regional Survey on Employment and the Informal Sector of the WAEMU member states, 2017–2018. Significance level:
Figure 2.
Classification of the regions of the WAEMU countries according to the components of the GPS perception index.
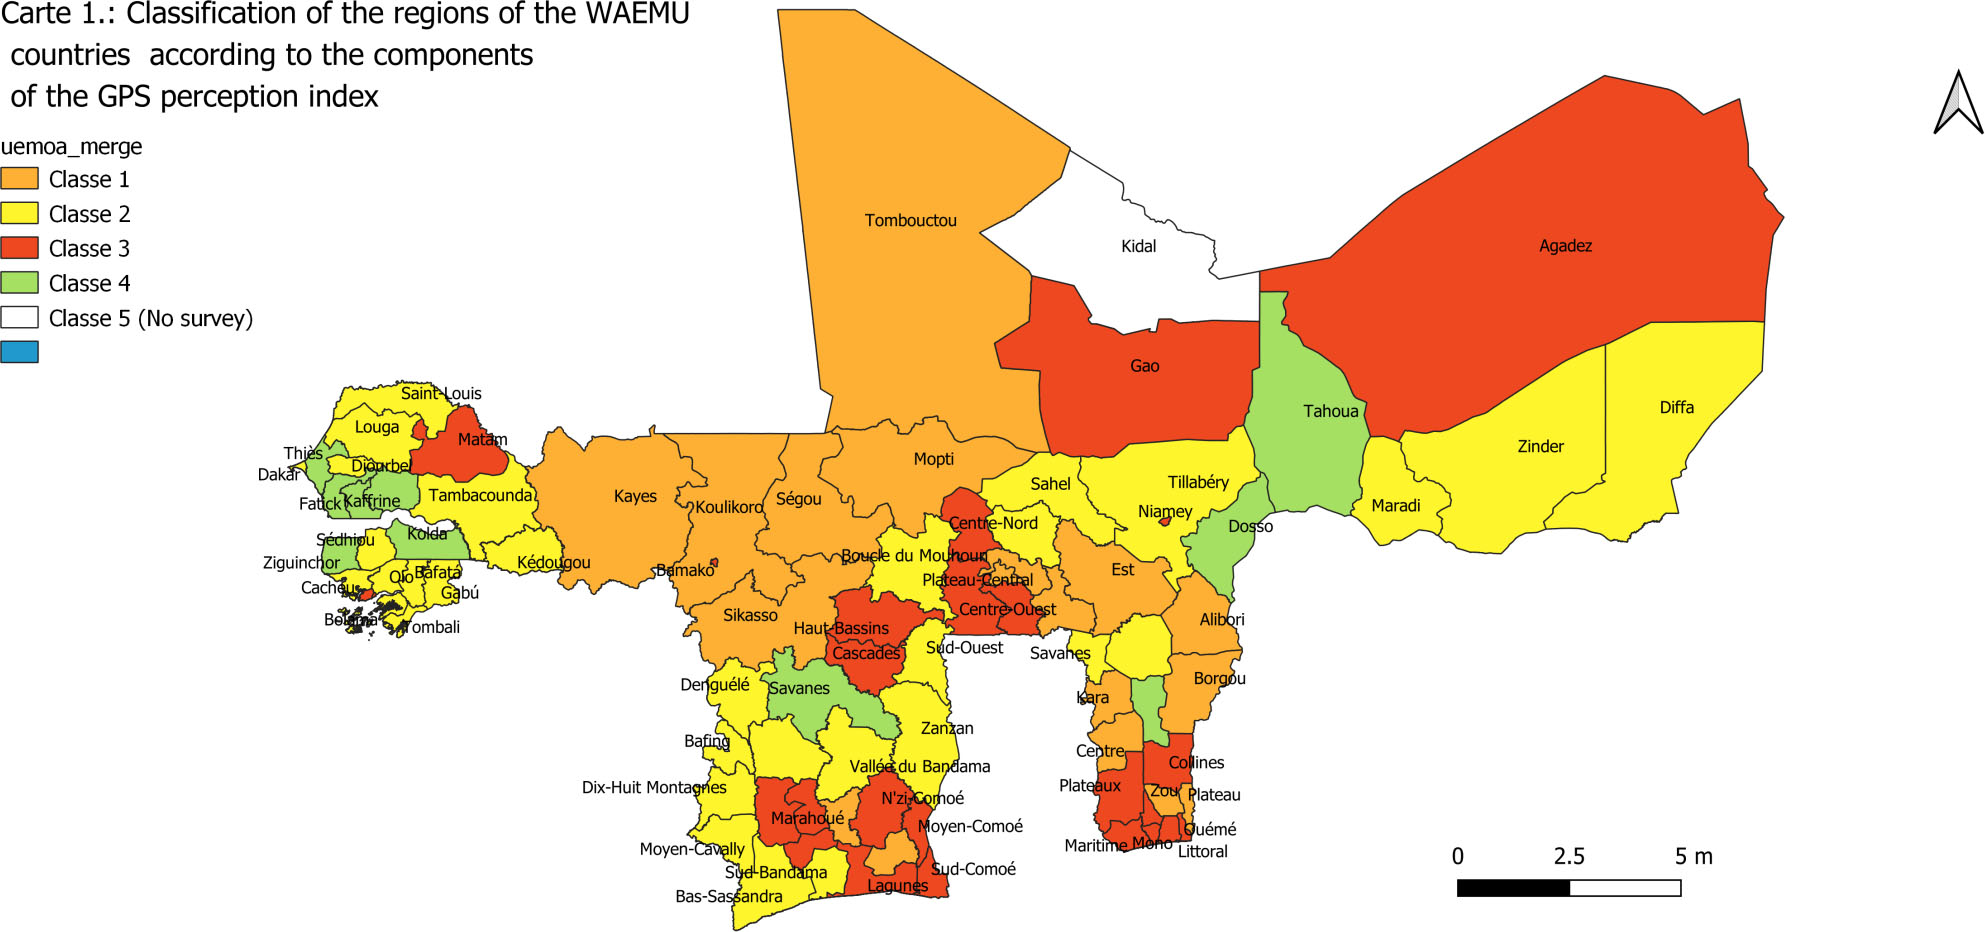
Table A4 presents the differences in indices of the sub-groups and the likelihood of observing differences in perceptions of GPS.
At the WAEMU member states level, differences in perceptions of GPS is not significant among individuals in poor households and those in wealthy households. However, differences in perceptions of GPS is significant among households where the head of the household is uneducated and those in households where the head of the household is educated.
In Burkina Faso, there is no difference in the perception of GPS and its three components between individuals in poor households and those in wealthy households (Table A4). On the other hand, individuals in households with an educated head have a higher perception of human rights, and those in households with an uneducated head have a higher perception of the principles of the rule of law.
From the analysis of Table A4, the indicators of perceptions of the rule of law are significant. Apart from Benin and Burkina Faso, individuals in the WAEMU member states who are in poor households have a higher perception of the rule of law. The difference in perceptions of peace and security is significant between the two groups of standards of living, except Burkina Faso, Guinea-Bissau, and Mali.
Based on the level of education of the heads of households, it can be observed in all the countries of the WAEMU member states that the indices of human rights and participation and the rule of law are significantly different between the two subgroups. In all the member states, the index for the appreciation of the rule of law of individuals aged 18 and above in households where the head is uneducated is higher than that of individuals aged 18 and above in households where the head is educated.
5.2Profile of WAEMU member states according to citizens’ perception of GPS
In this section, we carried out an ascending hierarchical classification (AHC) to highlight groups of administrative regions (1st administrative subdivision) of WAEMU member states that are similar in terms of the perception of human rights, the rule of law, and peace and security. Four clusters were selected after the AHC.
5.2.1Description of the clusters
After the AHC, the 84 administrative regions of the WAEMU member states66 were grouped into four distinct clusters. Table A4 in the Appendix lists the regions in each cluster.
Map 1 shows a diagram of the resulting clusters with the following descriptions:
Cluster 1: It consists of regions where the population has good perceptions of peace and security and human rights and participation and very low perceptions of the rule of law. This cluster is made up of 17 regions from 5 countries (Benin, Burkina Faso, Mali, Côte d’Ivoire, and Togo), including the headquarters of WAEMU, Ouagadougou, the capital of Burkina Faso. It can be described as a middle cluster in terms of GPS perceptions with a
Cluster 2: It consists of regions where people have good perceptions of human rights and participation, the rule of law, and peace and security. It is made up of 31 administrative regions, including Dakar (the capital of Senegal), of all the member states of WAEMU, except Mali. It can be described as a cluster with good perceptions of GPS with a
Cluster 3: It consists of regions where people have good perceptions of peace and security and low perceptions of human rights and participation and the rule of law. This cluster is made up of 26 regions from the 8 member states of WAEMU, including the capitals of Côte d’Ivoire, Guinea-Bissau, Mali, Niger, and Togo and Cotonou, the main city of Benin. It can be described as a cluster with low perceptions of GPS with a
Cluster 4: It consists of regions where the people have very good perceptions of human rights and participation, the rule of law, and peace and security. This cluster is composed of 10 regions from 4 countries (Benin, Côte d’Ivoire, Niger, and Senegal). It can be described as a cluster with very good perceptions of GPS with a
5.2.2Cluster profile analysis
The regions of the WAEMU member states in a cluster are similar in terms of their GPS perceptions. This section draws the profile of each cluster based on the sub-indicators linked to each component of the
a) Cluster 1
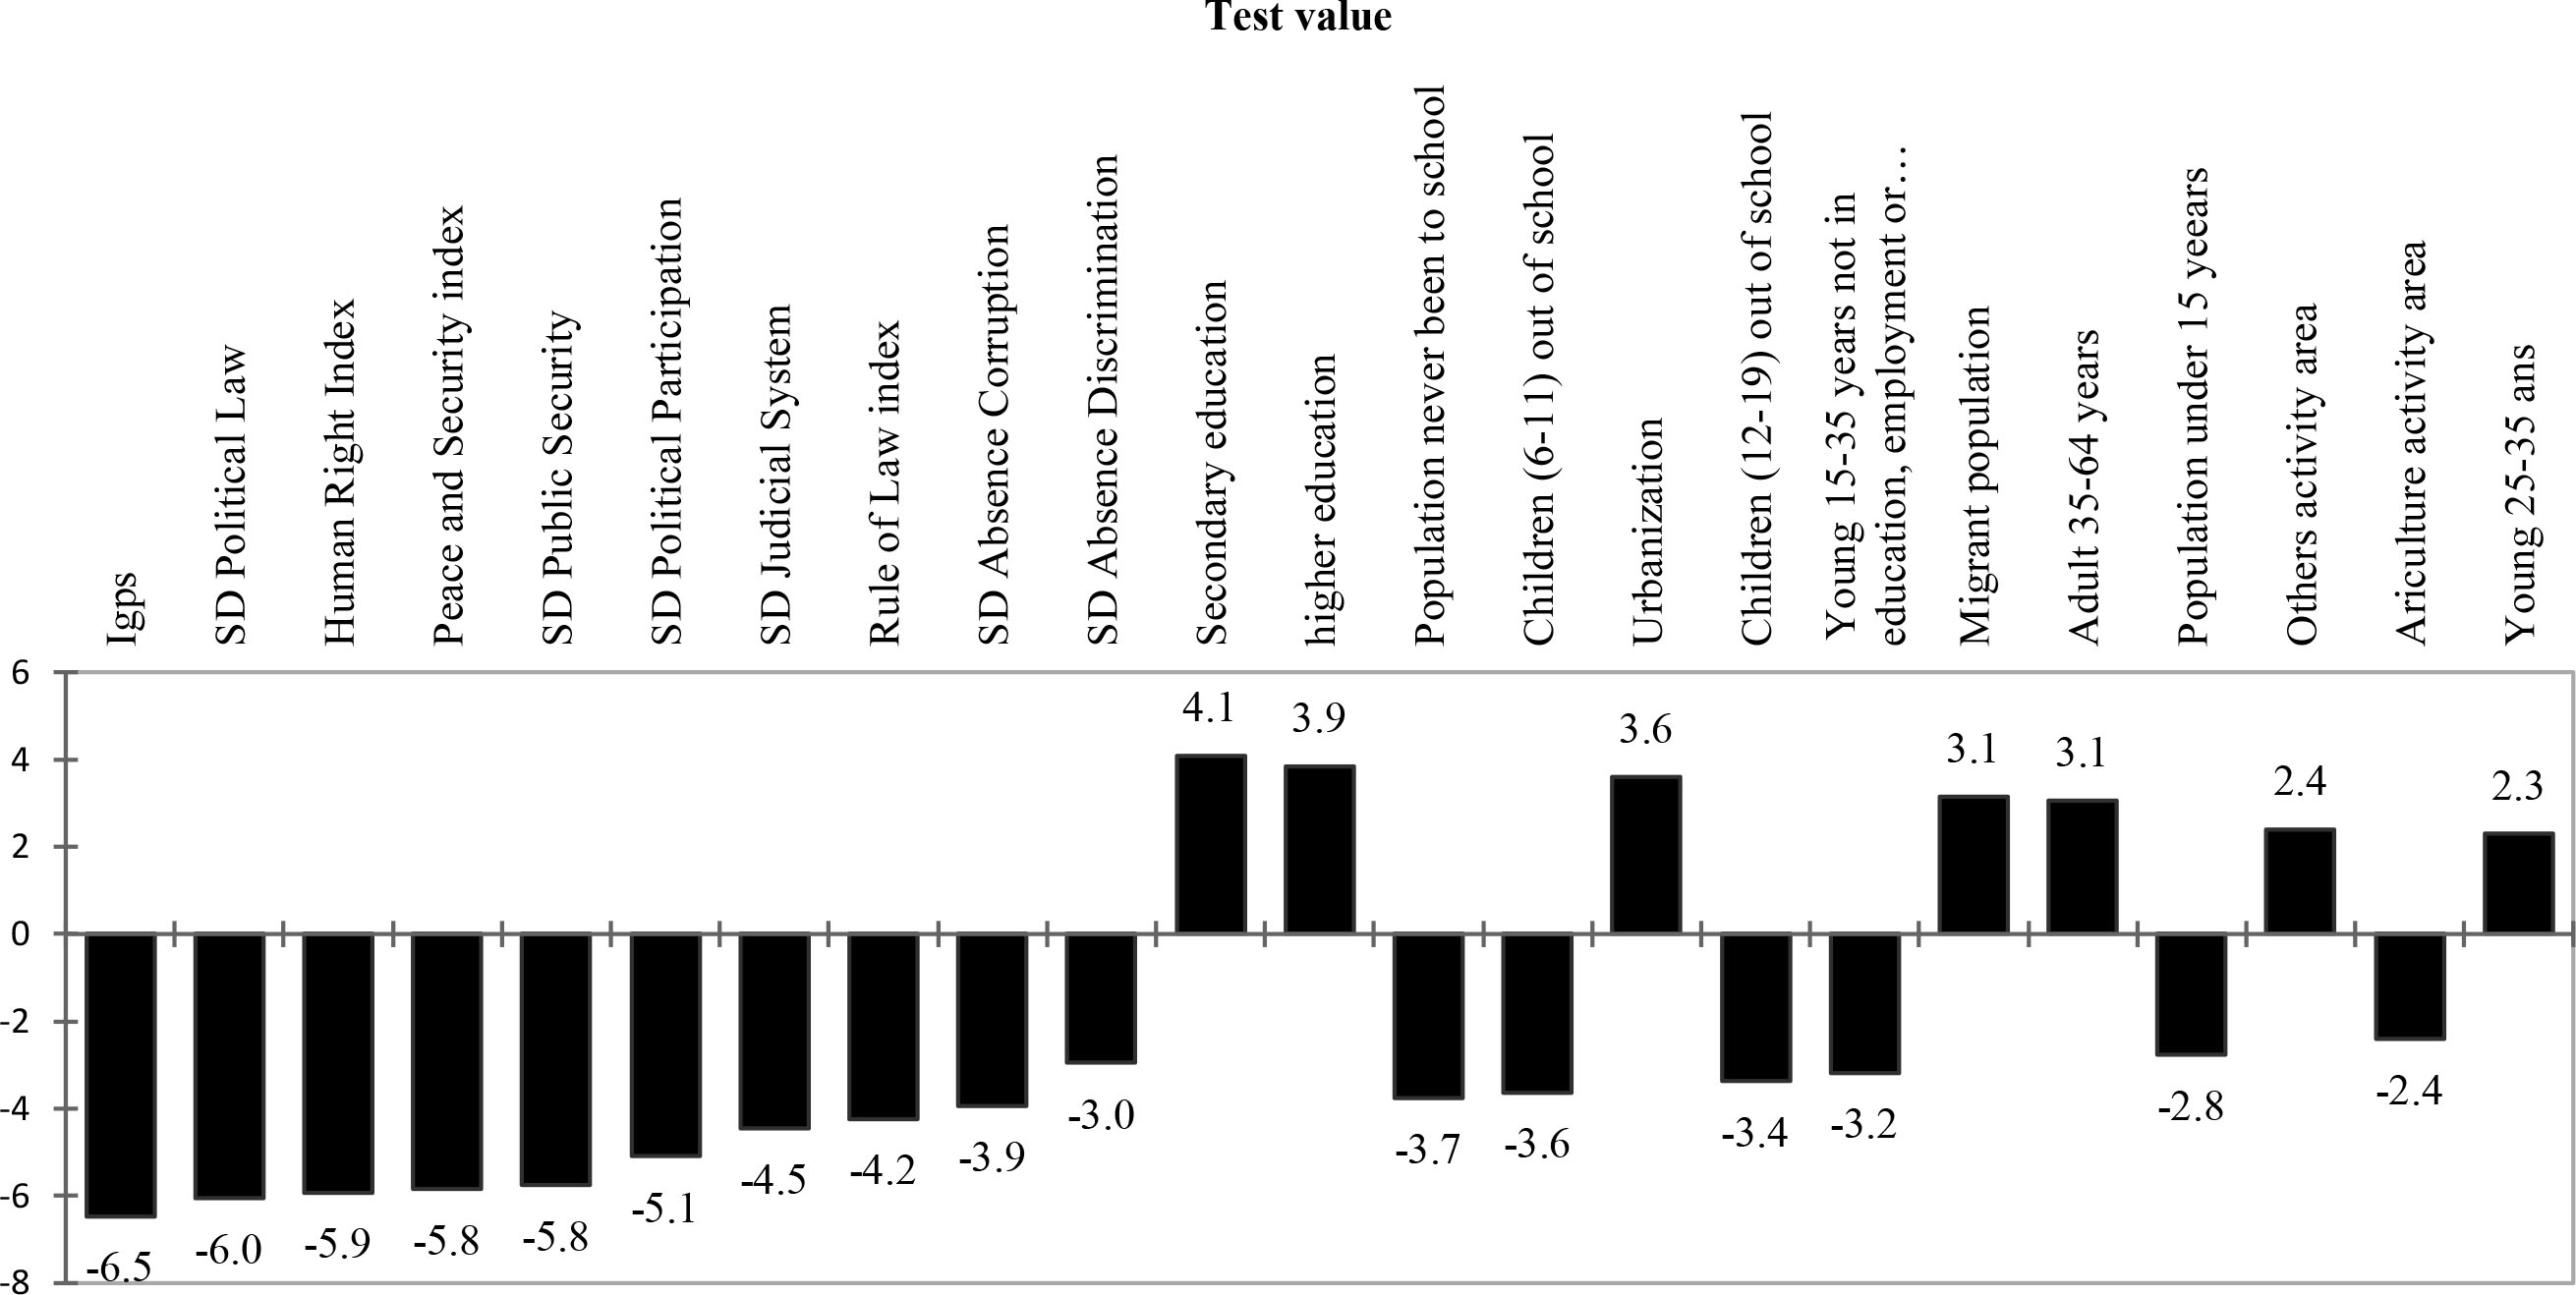
Cluster 1 is made up of 17 regions from 5 countries (Benin, Burkina Faso, Mali, Côte d’Ivoire, and Togo), including the headquarters of WAEMU, Ouagadougou, the capital of Burkina Faso. Its adult literacy rate (34.7%) and the proportion of the population with primary education (23.3%) are below the overall average, 47.6% and 25.2%, respectively. Young people aged 15-24 as a proportion of the cluster population are poorly represented in relation to their proportion in the population of the WAEMU member states. In Cluster 1, perceptions index for the sub-indicators “absence of corruption” (0.438) and “efficiency of the judicial system” (0.481) are lower than the values obtained at the overall level, 0.519 and 0.561, respectively.
Precarious employment (33.7%) is a characteristic of this cluster, which has a significantly high value compared to the overall value (25.5%). The perceptions index for the sub-indicator “political participation” (0.670) is higher than that of the overall index (0.639).
Figure 3.
Test values of the characteristic variables of cluster 1.
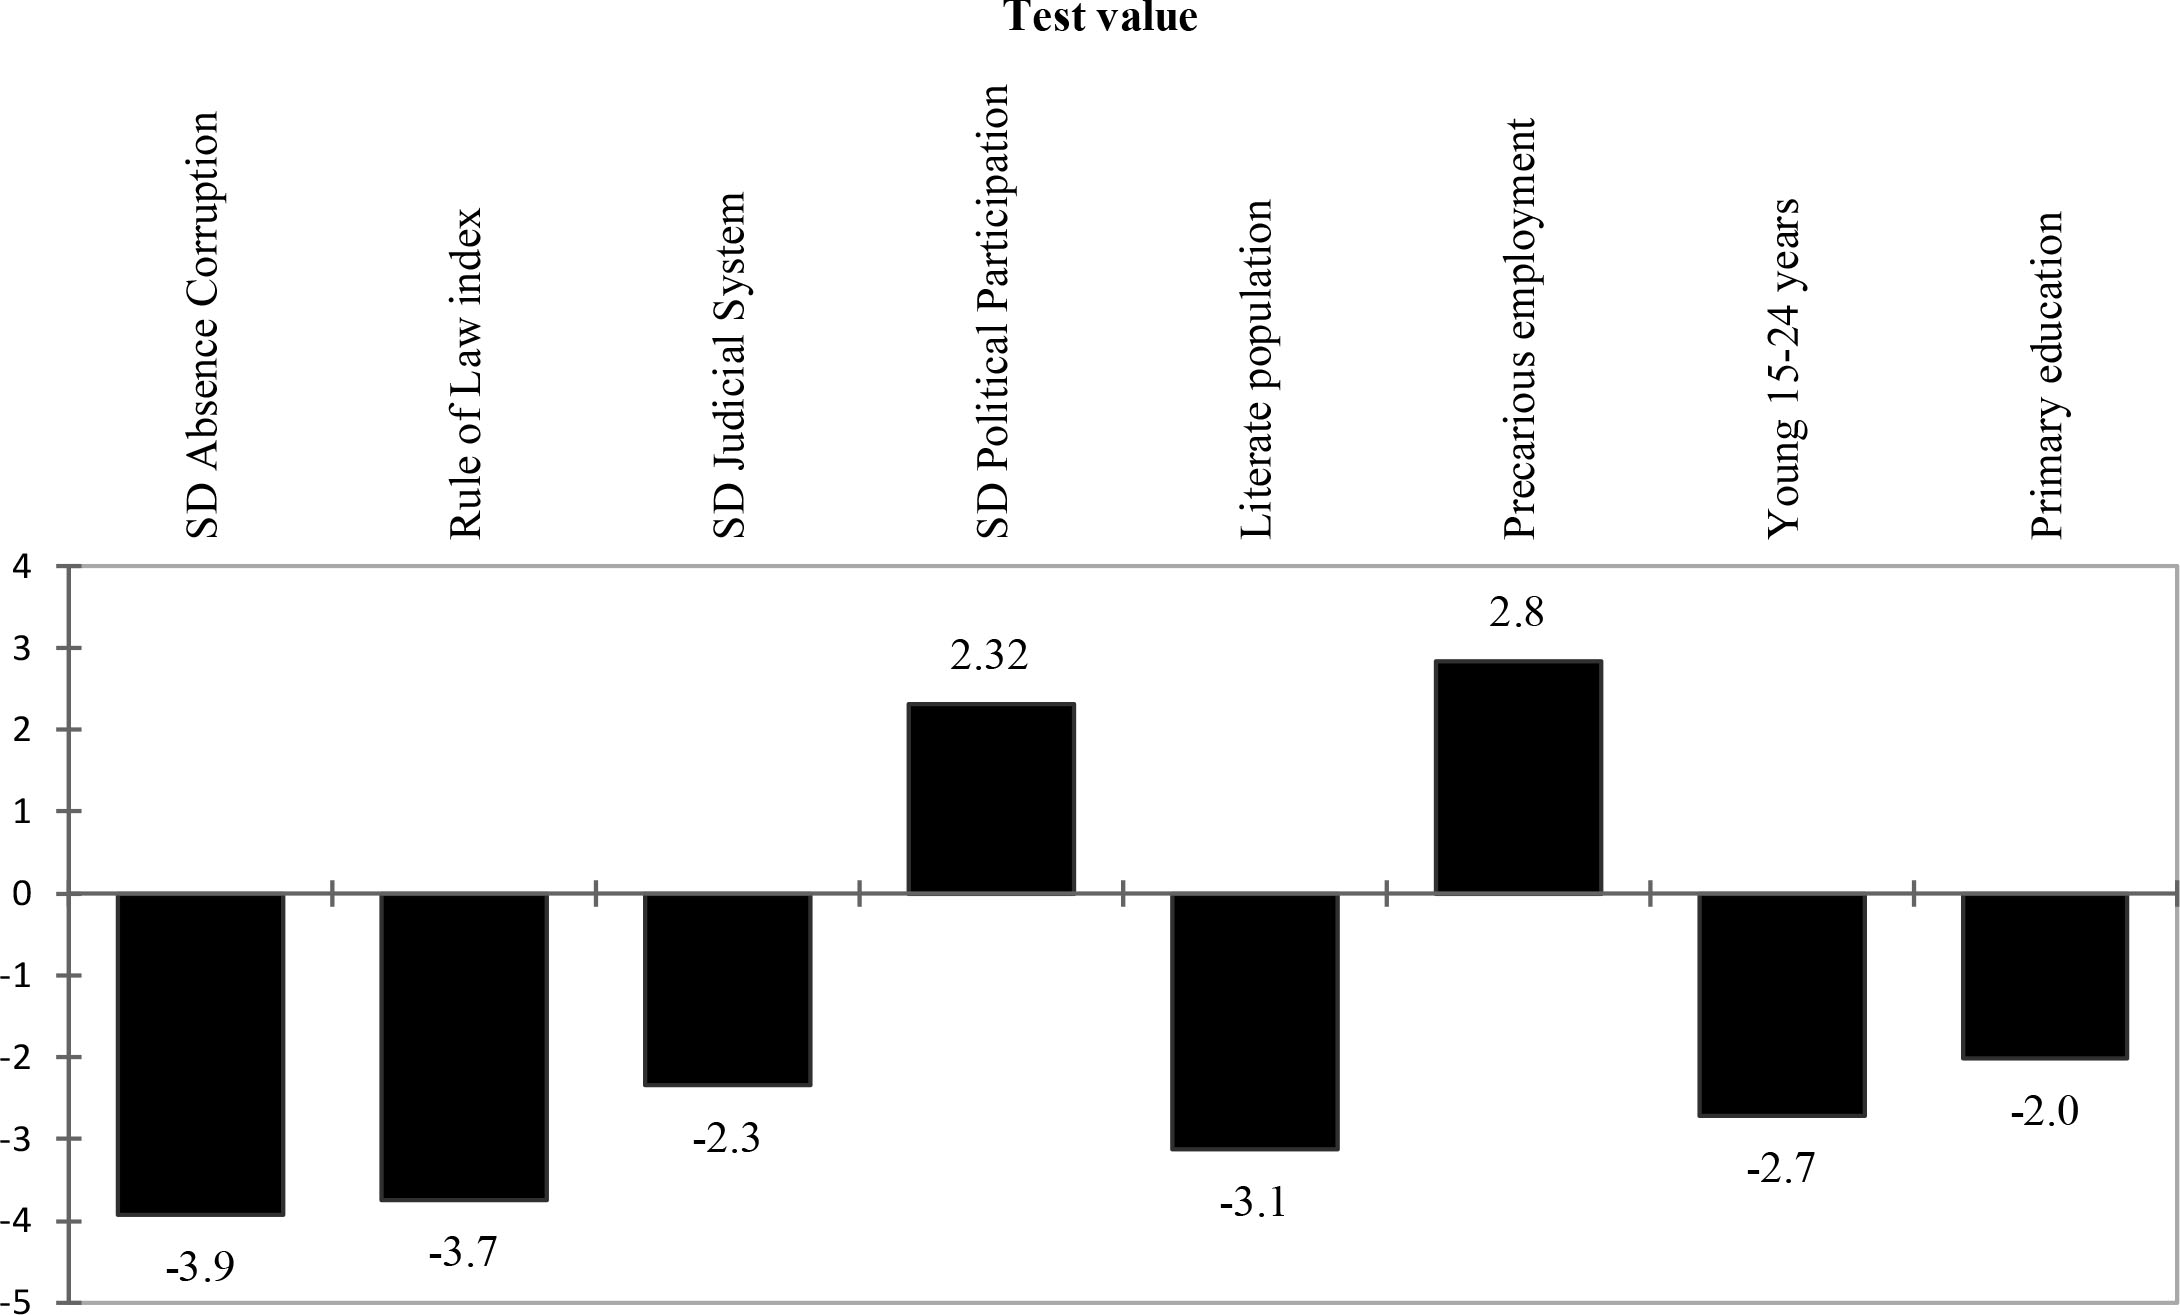
Figure 4.
Test values of the characteristic variables of cluster 2.
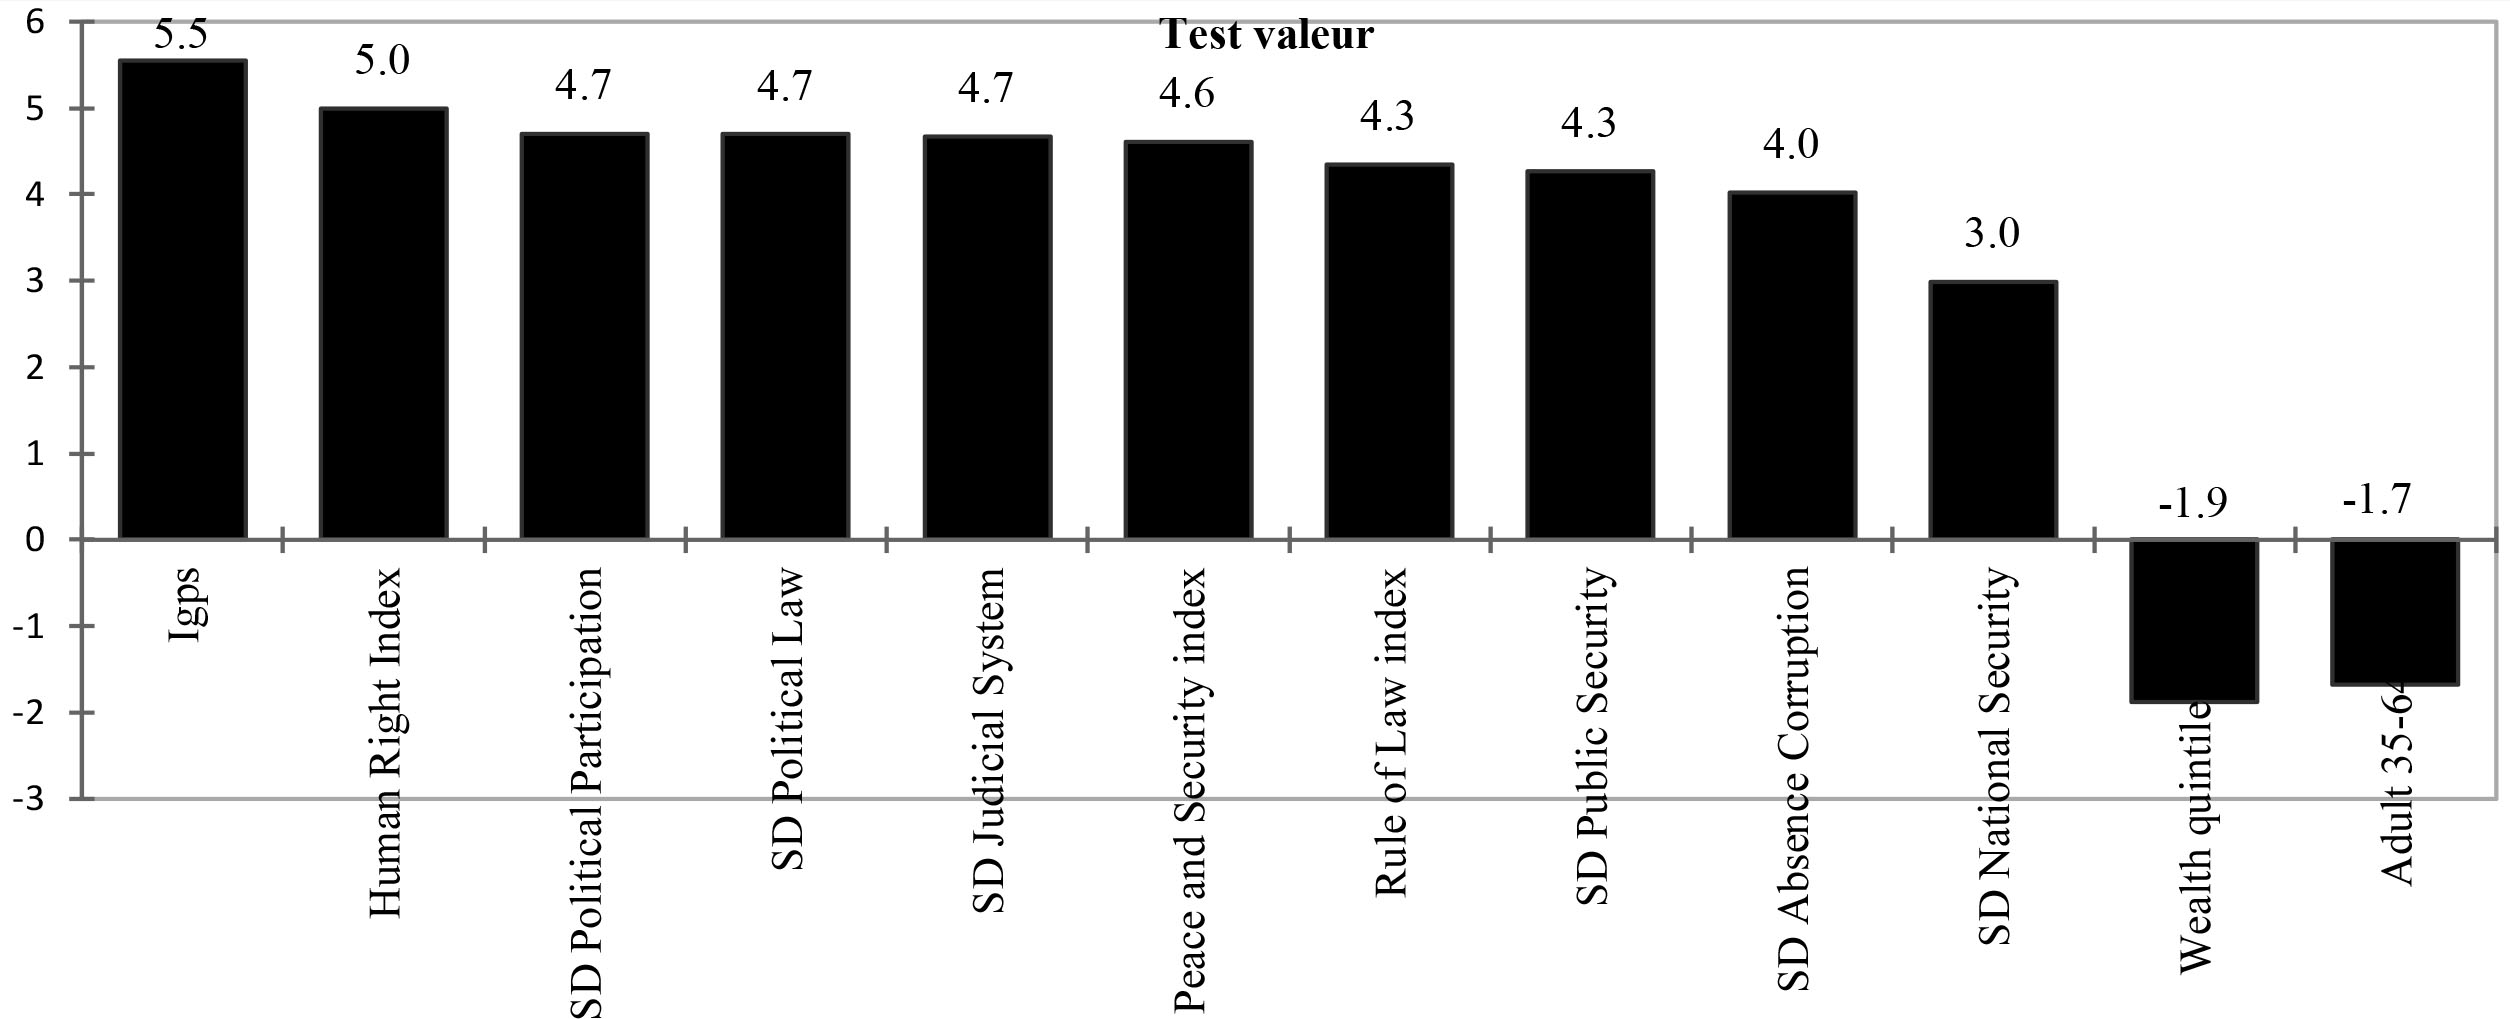
b) Cluster 2
This cluster is made up of 31 administrative regions, including Dakar (the capital of Senegal), of all the member states of WAEMU, except Mali. Its perception index of the sub-indicators “absence of corruption” (0.586), “public security” (0.802), and “efficiency of the judicial system” (0.653) are above the overall average of the WAEMU member states, which are 0.519, 0.783 and 0.561, respectively.
Figure 5.
Test values of the characteristic variables of cluster 3.
Some variables have significantly low values in relation to the overall averages of the WAEMU member states:
• The percentage of the cluster who have attained secondary education and the percentage of the population aged 35–64 is 9.4% and 18.5%, respectively, as against 12.8% and 19.8% for the WAEMU member states.
• This cluster has fewer precarious jobs (22.8%) compared to that of the overall average of the WAEMU member states (25.5%).
• A small proportion of the population lives in urban centers (26.5%) compared to 34.5% for the WAEMU member states.
c) Cluster 3
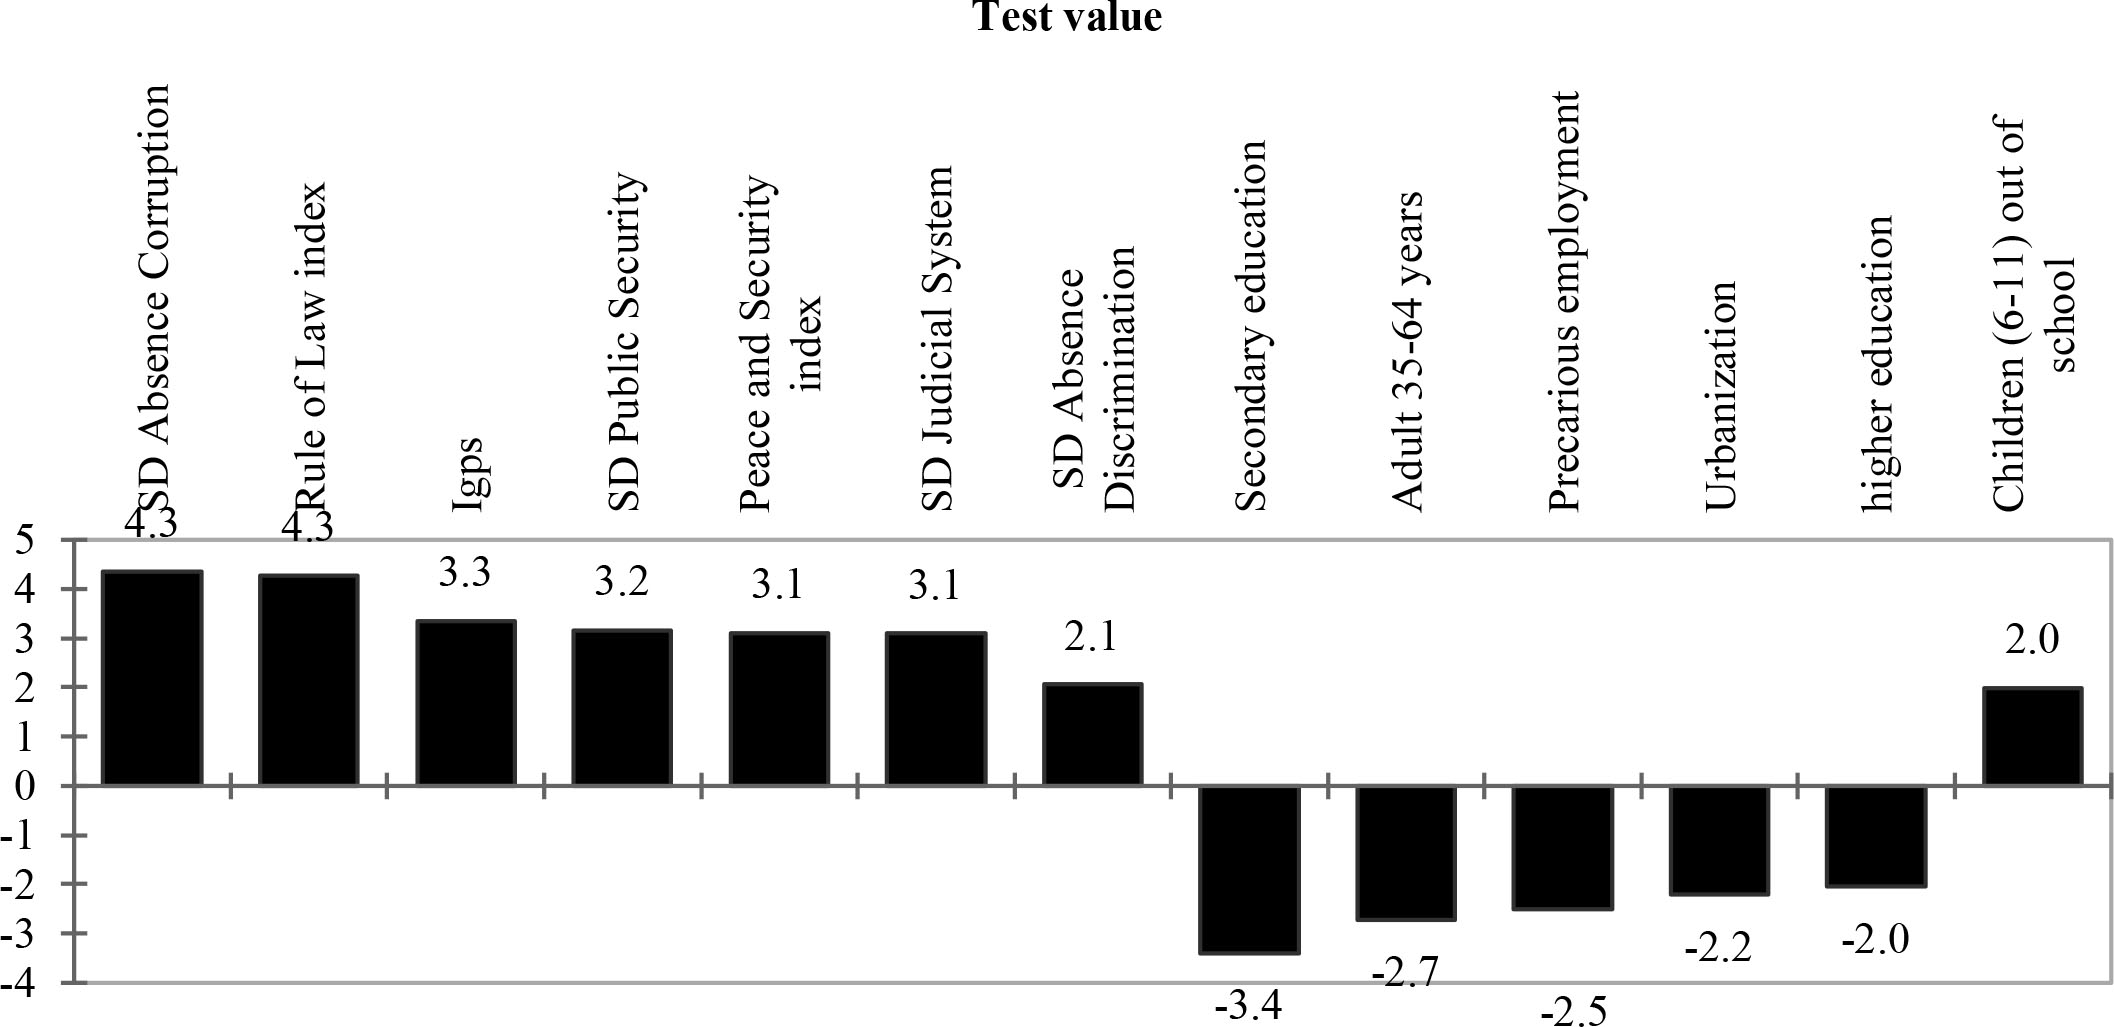
This cluster is composed of 26 regions from the eight-member states of WAEMU, including the capitals of Côte d’Ivoire, Guinea-Bissau, Mali, Niger, and Togo and Cotonou, the main city of Benin.
Figure 6.
Test values of the characteristic variables of cluster 4.
Its sub-indicator indices for “civil and political rights” (0.635), “public security” (0.740), and “political participation” (0.556) are lower than the overall average of the WAEMU member states. The proportion of the population that is educated (38.5%) and the proportion of children aged 6–11 who have never been to school (21.8%) are below that of the WAEMU member states, 50.7% and 38.9%, respectively.
Compared to the overall average of the WAEMU member states, some variables have significantly high values. The percentage of the cluster that has attained secondary education (19.5%) and tertiary education (4.7%) is higher than that of the WAEMU member states, 12.8% and 2.3%, respectively. This cluster has a high rate of urbanization (54.6% as against 34.5% of the WAEMU member states), a high proportion of individuals who have migrated (19.8% as against 12.5% of the WAEMU member states), and a predominance of activities in industry, trade, and services sectors.
Table A1
Individual assessment of governance, peace and security and its components by the wealth quintile of the household
| Countries | Lowest | Highest | ||||||
|---|---|---|---|---|---|---|---|---|
| of WAEMU | Human rights and participation | Rule of law | Peace and security | Governance, peace and security index | Human rights and participation | Rule of law | Peace and security | Governance, peace and security index |
| Benin | 0.617 | 0.401 | 0.696 | 0.627 | 0.644 | 0.426 | 0.710 | 0.645 |
| Burkina Faso | 0.650 | 0.486 | 0.759 | 0.685 | 0.639 | 0.495 | 0.752 | 0.681 |
| Côte d’Ivoire | 0.695 | 0.592 | 0.763 | 0.717 | 0.639 | 0.544 | 0.740 | 0.682 |
| Guinea-Bissau | 0.547 | 0.531 | 0.790 | 0.689 | 0.547 | 0.511 | 0.798 | 0.690 |
| Mali | 0.665 | 0.419 | 0.770 | 0.684 | 0.693 | 0.404 | 0.776 | 0.692 |
| Niger | 0.702 | 0.602 | 0.807 | 0.747 | 0.638 | 0.485 | 0.815 | 0.716 |
| Senegal | 0.719 | 0.653 | 0.784 | 0.746 | 0.758 | 0.615 | 0.802 | 0.759 |
| Togo | 0.636 | 0.486 | 0.671 | 0.631 | 0.694 | 0.475 | 0.704 | 0.662 |
| WAEMU | 0.669 | 0.521 | 0.753 | 0.693 | 0.671 | 0.502 | 0.755 | 0.692 |
Source: Integrated regional survey on employment and the informal sector in WAEMU member states, 2017–2018.
Table A2
Individual assessment of governance, peace and security and its components by the level of education of the head of household
| Countries | Education | Non education | ||||||
|---|---|---|---|---|---|---|---|---|
| of WAEMU | Human rights and participation | Rule of law | Peace and security | Governance, peace and security index | Human rights and participation | Rule of law | Peace and security | Governance, peace and security index |
| Benin | 0.620 | 0.407 | 0.699 | 0.630 | 0.648 | 0.416 | 0.714 | 0.647 |
| Burkina Faso | 0.665 | 0.456 | 0.756 | 0.682 | 0.649 | 0.504 | 0.763 | 0.691 |
| Côte d’Ivoire | 0.627 | 0.540 | 0.731 | 0.674 | 0.697 | 0.595 | 0.762 | 0.718 |
| Guinea-Bissau | 0.561 | 0.511 | 0.795 | 0.691 | 0.542 | 0.564 | 0.805 | 0.702 |
| Mali | 0.669 | 0.360 | 0.771 | 0.676 | 0.686 | 0.428 | 0.773 | 0.693 |
| Niger | 0.689 | 0.563 | 0.805 | 0.736 | 0.736 | 0.626 | 0.814 | 0.762 |
| Senegal | 0.747 | 0.604 | 0.799 | 0.753 | 0.735 | 0.644 | 0.796 | 0.756 |
| Togo | 0.657 | 0.468 | 0.692 | 0.645 | 0.684 | 0.528 | 0.705 | 0.670 |
| WAEMU | 0.658 | 0.494 | 0.746 | 0.681 | 0.692 | 0.543 | 0.772 | 0.713 |
Source: Integrated regional survey on employment and the informal sector in WAEMU member states, 2017–2018.
d) Cluster 4
This cluster is composed of 10 regions from 4 countries (Benin, Côte d’Ivoire, Niger, and Senegal). Its values for the sub-indicators “political participation” (0.752), “civil and political rights” (0.863), and “efficiency of the judicial system” (0.754) are higher than that of the overall average of the WAEMU member states.
At the 10% threshold, only the variables “‘average standard of living”’ and the percentage of individuals aged 35–64 of this cluster are below that of the overall average of the WAEMU member states.
6.Conclusion and outlook
The
The different dimensions and sub-dimensions of the index can be tracked over time and provide information on the state of human rights and the rule of law at national and subnational. Better use of the results of this index requires the organization of regular household surveys on governance and the establishment of a database on the index and these components at the national and sub-national level according to the different characteristics.
Table A3
Assessment of the perception index of GPS and its components in clusters
| Class | Human rights and participation | Rule of law | Peace and security | Governance, peace and security index |
|---|---|---|---|---|
| Cluster 1: Regions of average appreciation of GPS | 0.696 | 0.442 | 0.763 | 0.691 |
| Cluster 2: Regions of good appreciation of GPS | 0.710 | 0.595 | 0.781 | 0.732 |
| Cluster 3: Regions of low appreciation of GPS | 0.598 | 0.467 | 0.718 | 0.646 |
| Cluster 4: Regions of very good appreciation of GPS | 0.790 | 0.675 | 0.837 | 0.798 |
Source: Integrated regional survey on employment and the informal sector in WAEMU member states, 2017–2018.
The Observatory is already considering the following issues:
• Improving the conceptual framework used to calculate the
• Improving the methodology for calculating the index and its components.
• Improving the data collection process to capture or better account for certain dimensions.
• Finalizing and taking more practical measures to calculate the
Table A4
Composition of the clusters resulting from the classification
| Cluster | 1 | 2 | 3 | 4 |
|---|---|---|---|---|
| Number of regions | 17 | 31 | 26 | 10 |
| BJ-Alibori | BJ-Atacora | BJ-Atlantique | BJ-Donga | |
| BJ-Borgou | BF-Boucle d u mouhoun | BJ-Collines | CI-Savanes | |
| BJ-Plateau | BF-Centre-Nord | BJ-Couffo | NE-Dosso | |
| BJ-Zou | BF-Sahel | BJ-Littoral | NE-Tahoua | |
| BF-Centre | BF-Sud-Ouest | BJ-Mono | SN-Fatick | |
| BF-Centre-Est | CI-Autonome de Yamoussoukro | BJ-Ou“m” | SN-Kaffrine | |
| BF-Est | CI-Bas-sassandra | BF-Cascades | SN-Kaolack | |
| BF-Plateau central | CI-Denguelé | BF-Centre-Ouest | SN-Kolda | |
| CI-Lacs | CI-Montagnes | BF-Centre-Sud | SN-Thiés | |
| ML-Kayes | CI-Vallée du Bandama | BF-Hauts-bassins | SN-Ziguinchor | |
| ML-Koulikoro | CI-Woroba | BF-Nord | ||
| ML-Sikasso | CI-Zanzan | CI-Autonome d’Abidjan | ||
| ML-Ségou | GW-Tombali | CI-Comoé | ||
| ML-Mopti | GW-Quinara | CI-Gôh-Djiboua | ||
| ML-Tombouctou | GW-Oio | CI-Lagunes | ||
| TG-Centrale | GW-Bolama Bijagos | CI-Sassandra-Marahoue | ||
| TG-Kara | GW-Bafata | GW-Biombo | ||
| GW-Gabu | GW-SAB | |||
| GW-Cacheu | ML-Gao | |||
| NE-Diffa | ML-Bamako | |||
| NE-MaradiI | NE-Agadez | |||
| NE-Tillaberi | NE-Niamey | |||
| NE-Zinder | SN-Matam | |||
| SN-Dakar | TG-Maritime | |||
| SN-Diourbel | TG-Plateaux | |||
| SN-Kedougou | TG-Grand Lomé | |||
| SN-Louga | ||||
| SN-Saint-louis | ||||
| SN-Sedhiou | ||||
| SN-Tambacounda | ||||
| TG-Savanes |
NB: The regions are preceded by the country code: Benin (BJ); Burkina Faso (BF); Côte d’Ivoire (CI); Guinea-Bissau (GW); Mali (ML); Niger (NE); Sene gal (SN) et Togo (TG).
Notes
1 Praia is the capital city of Cabo Verde in West Africa.
2 Renaud FRANCOIS (2008).
3
4 HH: Head of household.
5
6 Without the Kidal region of Mali which was not surveyed.
Appendix
References
[1] | Forum pour une nouvelle gouvernance mondiale. L’indice de gouvernance mondiale, IGM. Pourquoi évaluer la gouvernance mondiale et pour quoi faire? version 2.0 Rapport 2011. Série Cahiers de propositions (2011) . |
[2] | Renaud FRANCOIS. L’indice de gouvernance mondiale, IGM. Pourquoi évaluer la gouvernance mondiale et pour quoi faire? Forum pour une Nouvelle Gouvernance Mondiale. Série Cahiers de propositions (2008) . |
[3] | Scott S, Amy W, Tamar E. Social progress index 2017. Methodology report. Social progress imperative (2017) . |
[4] | Sabina A, James F. Understandings and misunderstandings of multidimensional poverty measurement. Ophi Working Paper NO. 43. University of Oxford 3 Mansfield Road, Oxford OX1 3TB, UK (2011) . |
[5] | UA, BAD, CEA. Méthodologie de calcul de l’indice d’intégration régionale en Afrique (IIRA). (2016) . |


