
Labour accounts in Iran, Australia and Denmark
Abstract
Labour accounts provide an orderly manner to compare, reconcile and built-on data from different sources. The procedures may in principle be applied to topics other than labour. As part of a research project at the Statistical Research and Training Center of Iran, an attempt was made for the first time to develop labour accounts for Iran for the reference year 1390 (March 2011–February 2012). The procedure is described in the first part of the paper. In the second part, comparative tables for Australia, Denmark and Iran are constructed on each of the three main elements (employment, hours of work and employment-related income). In the process of comparing the data, the differences in the underlying methodologies are reviewed and an assessment is made on the way forward. To date, very few countries have attempted to construct labour accounts. The three countries discussed in this paper represent a diverse set of statistical systems, but have in common, particularly, Iran and Australia, the same concepts and definitions in line with the ILO international standards.
1.Introduction
Labour accounts were first discussed at the international level as part of the agenda of the Fifteenth International Conference of Labour Statisticians [1], following a seminal paper laying out the basic principles of labour accounting by Hoffman [2]. Labour accounting system was meant to provide a framework “for study of relationships between the cost and demand for labour, and its remuneration and supply.” The model suggested “jobs” as the concept that linked the different elements. Details in national contexts were subsequently developed by Denmark, the Netherlands and Switzerland [3]. Despite these efforts, labour accounting remains relatively undeveloped and only a very limited number of countries are compiling labour accounts on a regular basis.
Recently, Iran has attempted for the first time to develop labour accounts as part of a research project at the Statistical Research and Training Center [4]. The process of confronting labour data from different sources in a systematic manner within a conceptual framework has proven to be extremely instructive in understanding the strengths and weakness of the underlying data sources. The process is described below and compared with two of the most developed labour accounts concerning Australia and Denmark. In Iran, three sets of labour accounts were developed, on employment, hours of work and employment-related income for the reference year 1390 (March 2011–February 2012), described in Section 2. This year was used as the base year because a number of relevant statistical sources were implemented in that year, in particular, the population and housing census, and establishment surveys for the preparation of the input-output tables. The main structures of the labour accounts of Australia and Denmark are described in Section 3 and comparative tables are constructed on each of the three main elements (employment, hours of work and employment-related income). In the process of comparing the data, the differences in the underlying methodologies are reviewed and an assessment is made on the way forward in this Section. Section 4 forms the Concluding remarks.
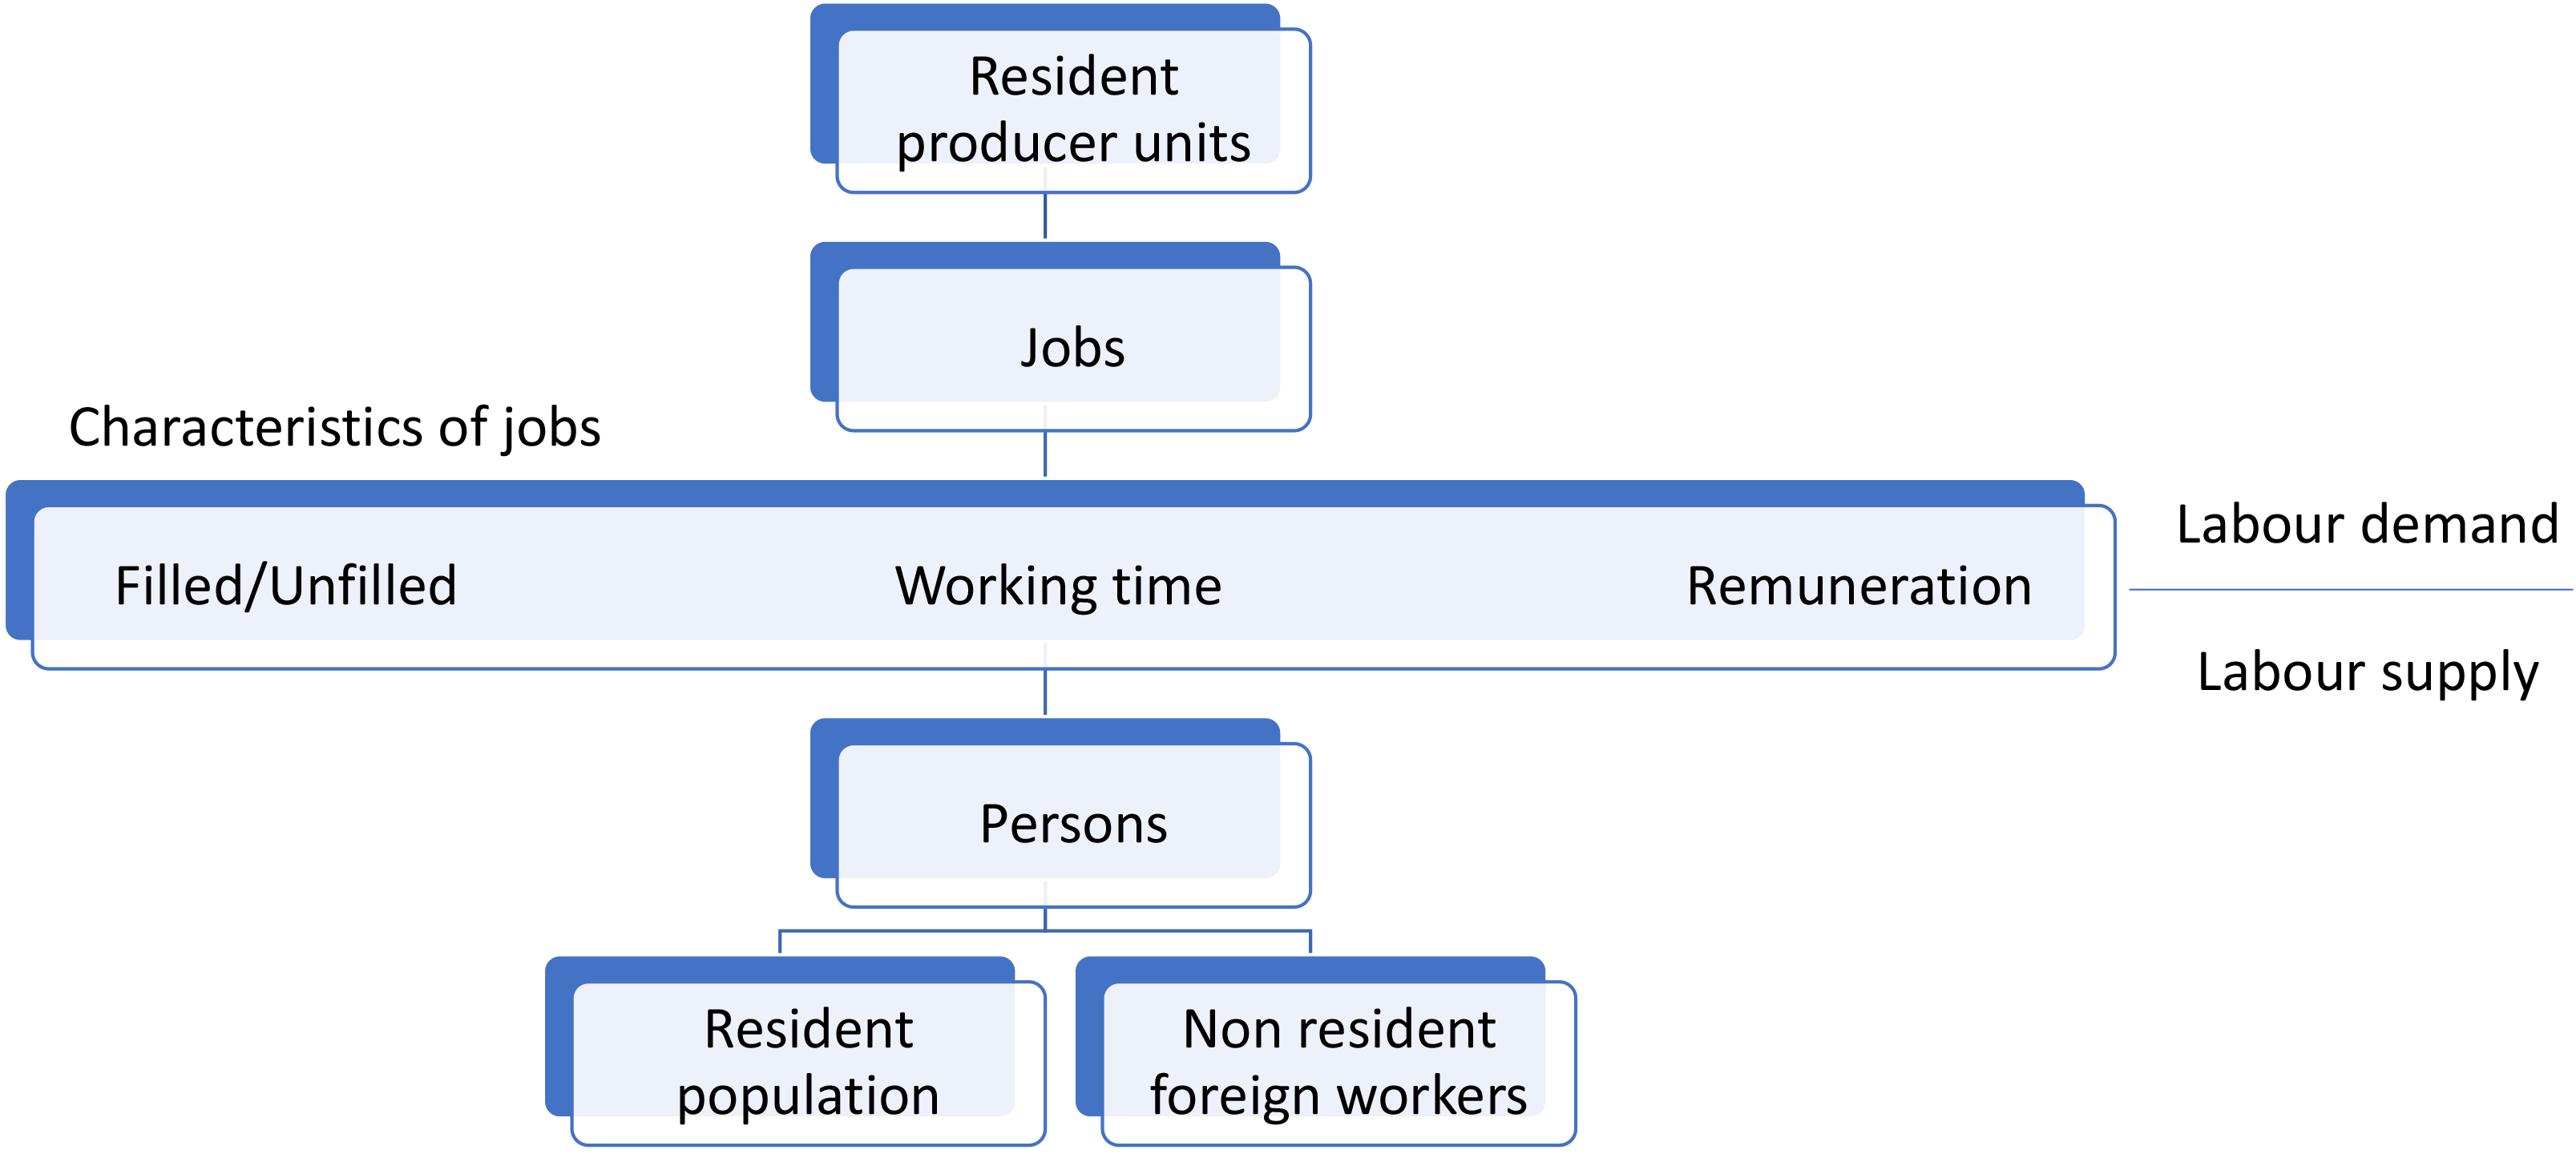
Figure 1.
Development of labour accounts in Iran: Conceptual framework.
2.Development of labour accounts in Iran
The initial aim of developing labour accounts in Iran was to learn about the process, and to understand the gaps and shortfalls of the various sources of employment statistics in the country. Many applications were then identified by national accounts specialists and other users of the data, in particular, the estimation of the labour share of gross domestic product (GDP), the assessment of the impact of one unit of investment on employment, the measurement of the impact of a job or one hour of work on production in different branches of economic activity, and so on.
With these objectives in mind, a conceptual framework for labour accounts was developed as schematically presented in Fig. 1 above. In line with the 15th ICLS, the central concept of the framework is “jobs”. A job or work activity refers to a set of tasks and duties performed by one person for a single economic unit. The term “job” is used in reference to employment. When relating to forms of work other than employment such as own-use production work, unpaid trainee work and volunteer work, the term “work activity” is used. Jobs are created by resident production units [5]. The residence of an institutional unit and in particular a production unit is the economic territory with which it has the strongest connection, in other words, its center of predominant economic interest [6].
Jobs have characteristics, the three of main interest are filled or unfilled, working time and remuneration. From the point of view of employers and labour demand, filled jobs represent persons engaged and unfilled jobs represent vacancies. From the point of view of workers and labour supply, filled jobs represent employment and unfilled jobs represent job opportunities for the unemployed and other persons whose labour is underutilized [7]. A person may have more than one job, or may have zero jobs as in the case of the unemployed or persons outside the labour force. The labour supply may be provided by usual residents of the country or by non-resident foreign workers.
Working time from labour demand’s point of view is contractual hours, normal hours of work, or hours paid for. From the labour supply’s point of view, working time is hours usually worked or hours actually worked during the reference period [8]. Finally, remuneration is regarded as labour cost from the point of view of employers and labour demand, and income from employment from the point of view of workers and labour supply [9, 10].
Ideally, each of the concepts in Fig. 1 should be consistently measured and linked together within the framework to form the labour accounts of the country.
Labour demand at a given point of time is the sum of all occupied and vacant jobs that resident producer units require to conduct their economic activity. Establishment surveys generally form a suitable source of data on labour demand where employers are asked about their currently filled jobs and vacancies. Labour supply, by contrast, comprises all currently employed and unemployed persons present in the country whether as residents of the country or as non-resident foreign workers. Labour force surveys are generally recognized as a comprehensive means of data collection on the supply of labour, although they do not, generally, cover non-resident foreign workers. In such a system, the distinction between jobs and persons is important. A person may hold more than one job and vice versa there may be jobs held by no one or held by more than one person.
Figure 2.
Development of labour accounts in Iran: Practice.
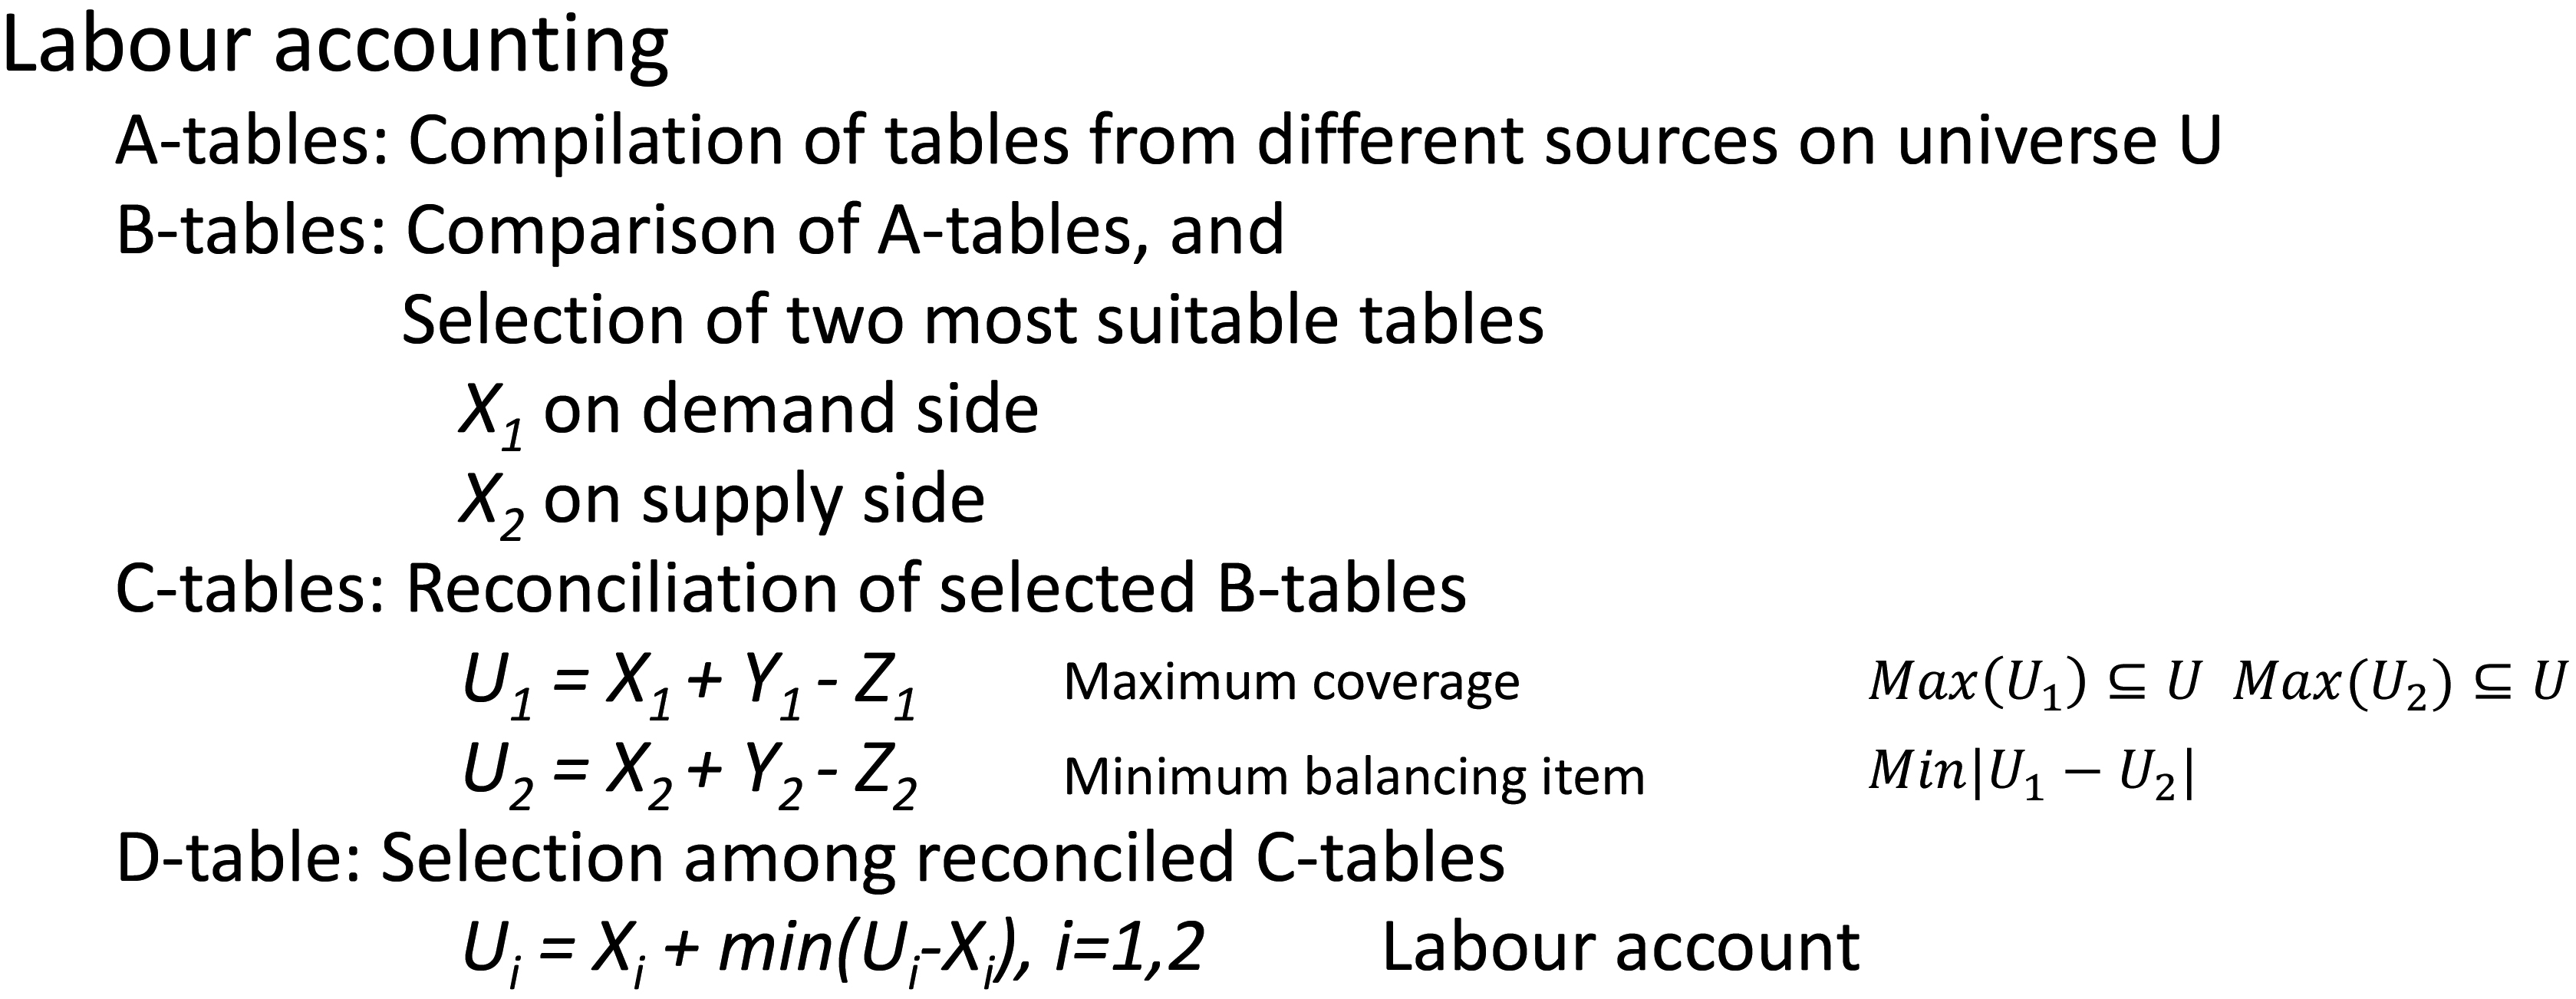
To implement labour accounting along these lines, it is convenient to define a “universe” and compile statistics to target that universe. The universe for labour accounts is set to cover the production of all goods and services according to the SNA production boundary. The aim then is to construct labour accounts to provide statistics on employment and other forms of work to produce goods and services, and the corresponding statistics on working time and remuneration to cover the specified universe as close as possible. Let U be the universe in question. The practical steps of labour accounting in Iran involved the construction of four-types of tables in an orderly manner as shown in Fig. 2 above. First, tables on the universe in question were compiled on each of three broad branches of economic activity from all available sources for the reference year 1390 (20 March 2011 to 19 March 2012). These were called A-tables. The three broad branches of economic activity were: Agriculture, Industry (including mining and quarrying, manufacturing, electricity, gas, steam and air conditioning supply, water supply, sewerage, waste management, and remediation activities and construction), and Services.
Then, on each topic, two tables, generally those with broadest coverage, were selected, one reflecting the labour demand and the other, the labour supply. The selected tables, called B-tables, were then juxtaposed in T-form lay-out and their values compared against each other. In the third step of labour accounting, the selected B-tables were reconciled by adding and subtracting different elements from each side to get as close as possible to the universe while minimizing the unexplained part of the differences between the two sources. The resulting reconciled tables were called C-tables.
Let X
2.1Employment account
The construction of the employment account is shown in Table 1. First, some ten tables on employment from a variety of sources were compiled and reviewed (A-tables). Two among them were retained (B-tables): table, X
Table 1
Construction of the employment account: Iran, 1390 (20 March 2011–19 March 2012)
| Input-output tables | Labour force survey | ||||
|---|---|---|---|---|---|
| Broad branch of economic activity | Before reconciliation (X | After reconciliation (U | Before reconciliation (X | After reconciliation (U | Employment account (U) |
| Total (‘000) | 25’372 | 22’285 | 20’510 | 21’919 | 21’919 |
| Agriculture | 12’506 | 5’131 | 3’810 | 4’798 | 4’798 |
| Industry | 3’745 | 6’733 | 6’847 | 6’905 | 6’905 |
| Services | 9’121 | 10’421 | 9’853 | 10’216 | 10’216 |
| Total (%) | 100% | 100% | 100% | 100% | 100% |
| Agriculture | 49% | 23% | 19% | 22% | 22% |
| Industry | 15% | 30% | 33% | 31% | 31% |
| Services | 36% | 47% | 48% | 47% | 47% |
Table 2
Reconciled C-table for agricultural sector statistics
| Input-output tables | Labour force survey | ||
|---|---|---|---|
| Employed persons in main and secondary jobs | 12’506’108 | Employed persons in main job in stock | 3’809’934 |
| Adjusted for simultaneous agricultural activities (0.52) | 6’730’715 | 674’866 | |
| Adjusted for main job in agriculture (0.8) | 5’384’572 | 1’959 | |
| Adjusted for reference period: year versus week (0.952) | 5’126’113 | 403’753 | |
| agricultural sector | |||
| Employment in main job | 5’126’113 | Employment in main job | 4’798’468 |
|
Employment in secondary job(s) (0.2) | 336’536 | Employment in secondary job(s) | 310’310 |
The differences were reconciled to the extent possible in the next step of labour accounting to produce the reconciled tables (C-tables): U
Coverage adjustments
• Workers in institutional households
• Non-resident foreign workers
• Undocumented migrant workers
• Hidden or undeclared employment
• Working children below working age
• Workers in unsettled households
Adjustments for differences in definitions
• Own-use production work
• Unpaid trainee work
• Conscripts
• Domestic workers
• Contributing family workers
Adjustment for reference periods
• Reference week in the quarter versus last day of the month
• Any time during reference year versus annual average
Adjustments for duplications
• Relationship between jobs and persons: persons with multiple jobs
• Persons engaged in simultaneous activities in agriculture
For example, to account for the difference of about 8 million between agriculture employment according to the input-output tables (12’506’000) and according to the labour force survey (3’810’000), it is necessary to quantify the various sources of discrepancies. One source of discrepancy is the statistical treatment of simultaneous agriculture activities. According to the results of the 2014 agricultural census, each agricultural holder is, on average, engaged in about 1.91 agriculture activities. In the input-output tables, these activities are treated separately and therefore the total employment figure is inflated by a factor of 1.91. For comparison with the labour force survey data, the figure should therefore be adjusted by an inverse factor, 1/1.91
Another source of discrepancy is multiple job-holding. In Iran, about 20 percent of agriculture workers are engaged in non-agriculture jobs during the off-season. Therefore, coefficients of 0.8 and 0.2 are applied for employment in main and second jobs, respectively.
Still another source of discrepancy concerns the differences in the measurement of employment based on a reference week in the labour force survey and based on the calendar year in the input-output tables. According to the results of the labour force survey, the average duration of employment in main job in the agricultural sector is about 11.4 months per year. Dividing this number by 12, the adjustment factor of 0.952 is obtained for converting the year-long employment figure of the input-output tables to the week-long employment figure of the labour force survey. For the second and subsequent jobs, it is assumed that they occur on average about one season per year, and therefore the adjustment factor of 0.25 is used for conversion. The various adjustments are shown in the left panel of Table 2. The slight differences with the corresponding numbers in Table 1 are due to rounding to ‘000 persons.
The adjustments made on the labour force survey data shown in the right panel of the table were as follows:
• The starting point is the number of employed persons at their main job in the agriculture sector according to the labour force survey (3’809’934). As the target population of the labour force survey is members of private settled and collective households, members of non-settled households and institutional households are not covered by this survey. According to the results of the 2008 nomadic census, there were 674’866 ten-year-old employed persons among the nomadic population (non-settled households). Virtually all these persons were engaged in agriculture (mostly animal husbandry). Therefore, the number was added to the total employed in agriculture.
• Next, the number of employed persons in agricultural living in institutional households, 1’959, were added based on the results of the 2011 population and housing census.
• Next, adjustment was made for working children 5 to 9 years old below the working age, 10, used in the labour force survey. The Multiple Indicator Demographic and Health Survey conducted in Iran in 2015 gives an estimate of the total number of working children 5 to 9 years old. A separate ILO estimation for 2017 indicates that 82.7 percent of working children 5 to 11 years old were employed in agriculture, 4.7 percent in industry and 12.5 percent in services. Assuming that these proportion were the same for children 5 to 9 years old, it was obtained that about 403,753 employed children 5 to 9 years old in Iran were employed in agriculture.
• Finally, the number of employed persons with second job in agriculture, 310’310, was obtained from the labour force survey, as recorded in the last line of Table 2.
Similar adjustments were made on the demand side and supply side of employment in the other broad branches of economic activity (Industry and Services). The results, as shown in Table 1, indicate that total employment based on the reconciled input-output tables has been reduced from 25’372’00 to 22’285’000 and total employment based on the labour force survey has been increased from 20’510’000 to 21’919’000. The difference between the two sources, i.e., the balancing item, has thus been narrowed from 4’862’000 to 366’000, or in percentage terms from about 21.2 percent to less than 1.7 percent. The last column shows the data for the final employment account (D-tables). It corresponds to reconciled data from the labour force survey (U
2.2Working time account
The working time account of Iran has been calculated on the basis of the reconciliation of estimates of the total volume of employment derived from data on weekly hours actually worked of the labour force survey on the supply side and data on normal weekly hours of work obtained from the commerce and services survey on the demand side. This survey covers establishments in the five specific branches of economic activity: (1) wholesale and retail trade, repair of motor vehicles and motorcycles; (2) accommodation and food services activities; (3) professional, scientific and technical activities; (4) arts, entertainment and recreation; and (5) other service activities (excluding transportation and storage; information and communication; financial and insurance activities; real estate activities; administrative and support service activities; public administration and defence; education; and human health and social work activities). The data from the two sources were first reconciled for the commerce and services sector and then the reconciled data were generalized to total employment.
The main elements of reconciliation included the following type of adjustments:
Adjustments for reconciliation of coverage and definitions
• Hours worked by employed persons in unsettled households
• Hours worked by employed persons living in institutional households
• Hours worked by working children below 10 years of age
• Hours worked by non-resident employed persons working in resident economic units
• Hours worked by resident employed persons working in non-resident economic units
Adjustments for reference periods
• Converting average weekly hours to annual total
Adjustment for multiple job-holding
• Hours worked in main job
• Hours worked in secondary jobs
Table 3
Construction of the working time account: Iran, 1390 (20 March 2011–19 March 2012)
| Establishment survey | Labour force survey | ||||
|---|---|---|---|---|---|
| Before reconciliation (X | After reconciliation (U | Before reconciliation (X | After reconciliation (U | Working time account (U) | |
| Annual volume of work (1000 hours) | 12’726’459 | 10’971’085 | 11’563’822 | 9’968’812 | 10’971’085 |
| in commerce, services | |||||
| Annual volume of work (1000 hours) | 63’632’295 | 54’855’425 | 57’819’110 | 49’844’060 | 54’855’425 |
| in total economy | |||||
| Total employment | 25’372’000 | 22’285’000 | 20’510’000 | 21’919’000 | 21’919’000 |
| Average weekly working time of | 48.2 | 47.3 | 54.2 | 43.7 | 48.1 |
| employed persons | |||||
These adjustments for the working time account were made in line with those made for the employment account where corresponding data on hours of work were available. Below a description is given of the generalization to total employment.
The generalization to total employment involved two steps. The first step concerned coverage. The number of workers covered by the commerce and services survey was 4’584’258, about one-fifth of total employment according to employment account (22’285’000). The corresponding number according to the labour force survey was 4’125’305, also close to one-fifth of total LFS employment (21’919’000). The ratio of 1/5 was therefore used to expand the total number of hours worked obtained from the reconciled working time account of the five branches of economic activity to that of all branches of economic activity.
The second step concerned adjustment for the reference year. The working time information on the five branches of economic activity are obtained from the commerce and services survey in 2014, while the reference year of the working time account is 2011. The adjustment was made by applying the growth rate of employment from 2011 to 2014 according to the labour force survey estimates for the corresponding five branches of economic activity, calculated to be r
The principal results are shown in Table 3. The last two lines of the table show the conversion of the working time accounts into average weekly hours worked per employed person using the relationship,
According to these results, the average number of hours worked per employed person in the year 1390 (20 March 2011–19 March 2012) was 48.1 hours per week. Due to the fragmented nature of the underlying data sources, it was not possible to break down the working time account into the broad branches of economic activity (Agriculture, Industry and Services).
2.3Income from employment account
The income from employment account of Iran is obtained from the sum of two income components: income from paid employment and income from self-employment. The accounts are calculated by reconciliation of data from two major sources: compensation of employees obtained from the input-output tables of the national accounts on the demand side and the household income and expenditure survey data on the supply side [12]. The data from the two sources were reconciled taking into account of a series of elements including:
Adjustment for coverage differences
• Income from employment of employed persons in unsettled households
• Income from employment of employed persons living in institutional households
• Income from employment of working children below 10 years of age
• Income from employment of non-resident employed persons working in resident economic units
• Income from employment of resident employed persons working in non-resident economic units
Adjustments for negative values of income from self-employment
Adjustment for under reporting of income from employment
Adjustment for under coverage in certain branches of economic activity, in particular in construction.
The adjustments for coverage differences in the income from employment account was made in line with those made for the employment account where corresponding data on income from employment were available. Below descriptions are given of the other adjustment.
Table 4
Construction of the income from employment account: Iran, 1390 (20 March 2011–19 March 2012)
| Broad branch of economic activity | Input-output tables (10 | Household income and expenditure survey (10 | Income from employment account (U) | Monthly income from employment ‘000 Rials | ||
| Before reconciliation (X | After reconciliation (U | Before reconciliation (X | After reconciliation (U | |||
| Total | 1’737’970 | 2’010’138 | 1’263’916 | 1’955’568 | 2’010’138 | 7’642 |
| Agriculture | 350’126 | 350’125 | 140’166 | 301’078 | 350’125 | 6’081 |
| Industry | 406’218 | 520’814 | 395’401 | 475’191 | 520’814 | 6’285 |
| Services | 981’626 | 1’139’199 | 728’349 | 1’179’299 | 1’139’199 | 9’293 |
| Total (%) | 100% | 100% | 100% | 100% | 100% | – |
| Agriculture | 20% | 17% | 11% | 15% | 17% | – |
| Industry | 23% | 26% | 31% | 25% | 26% | – |
| Services | 57% | 57% | 58% | 60% | 57% | – |
The survey data were adjusted for negative values of income from self-employment. In the household income and expenditure survey, for certain persons the reported income from self-employment in agriculture or non-agriculture jobs may be negative. This may happen, for example, because a farmer may have purchased a number of livestock in one year, but had little or no income from animal husbandry in that year. Or a self-employed person may have purchased a building for workplace and had little or no income from his or her activity that year. In the household income and expenditure survey, the incomes of these persons are reported as negative (annual income minus cost of purchase of livestock or building). While in the input-output tables, the purchase of livestock or the purchase of a building is considered as investment and no negative incomes are included in that database. In order to adjust this difference, the negative incomes in the household income and expenditure survey were simply set to zero for comparison with the input-output totals.
The other adjustment concerned the under-reporting of income. The adjustment was made on the basis of the results of a special study on under-reporting of income in the household income and expenditure survey of the Statistical Centre of Iran [13]. This study found the income of households were under-reported, on average, by about 27 percent among rural households and about 25 percent among urban households. These values were used for inflating the survey estimates of income from employment as part of the reconciliation with the corresponding data from the input-output tables.
Finally, income from employment in the construction underwent a special treatment. The Statistics Centre of Iran does not conduct separate establishment surveys on the construction sector, and there are no accurate administrative data in this sector. Thus, the value-added data in the construction sector from the input-output tables are generally not regarded as sufficiently accurate. For this reason, the income from employment in construction obtained from the household income and expenditure survey was directly inserted in the income from employment account.
Table 4 shows the main elements of the construction of the income from employment account. According to the input-output table of the national accounts, total income from employment generated 1’737’970’000 million Rials during the reference year. The corresponding estimate from the household income and expenditure survey was 1’263’916’000 million Rials. The breakdown by broad branch of economic activity shows still larger discrepancies, particularly, in agriculture and services. After adjustments for the differences in coverage and other elements of underreporting, total income from employment based on the reconciled input-output tables is now increased to 2’010’138’000 million Rials and total income from employment based on household income and expenditure survey is increased to 1’955’568’000 million Rials. The unaccounted balance between the two sources has thus been reduced from 474’054’000 million Rials to 54’570’000 million Rials, or in percentage terms from about 23.6% to less than 2.7%. The income account (U) column of the table shows the final account value of income from employment which corresponds the reconciled estimate from the input-output tables (U
The results show that the total annual income from employment generated by the economy was 2’010’138 billion Rials in 1390 (20 March 2011–19 March 2012), representing 132 billion Euros, or 149 billion USD, at the currency exchange rates (1000 Rials
3.Comparison with labour accounts in Australia and Denmark
The labour accounts of Australia and Denmark are briefly described in this section, before comparing the results with those described earlier on the labour accounts of Iran.
3.1Australia
The Australian Labour Account is based on an extensive framework, incorporating four distinct quadrants: Jobs, Persons, Labour Volume and Labour Payments [14]. Household surveys are the primary source of data on the supply of labour, supplemented by data from related government administrative records. Surveys of businesses, government and not-for-profit institutions and relevant administrative data sets are the main sources of information on labour demand. The resulting labour account consists of 11 sets of tables sub-divided into 19 industry divisions, with quarterly data covering the period from September 2010 to September 2018.
One of the features of the Australian labour account is the series of identity relationships built within and between the four quadrants of the account. In the “jobs” quadrant, there are two basic identity relationships:
1. Total jobs
2. Filled jobs
In the “persons” quadrant, three identity relationships are specified:
1. Labour force
2. Employed persons
3. Unemployed persons
The term “underemployed” refers to time-related underemployment defined by the 19
The “volume” quadrant specifies four identity relationships:
1. Hours actually worked
2. Hours actually worked/Filled jobs
3. Hours sought but not worked
4. Hours paid for
Hours paid for may be regarded as labour hours from the point of view of the employer or the demand side of the labour market. By contrast, hours actually worked may be regarded as labour hours from the point of view of the worker or the supply side of the labour market. In principle, hours paid for applies both to a paid-employment job and to a self-employment job paid on the basis of time units. For a self-employment job (formal or informal) paid on the basis of time units, hours paid for is equivalent to hours actually worked. The calculation of identity relationship 3 requires data not only on number of unemployed and time-related underemployed persons but also on the number of hours sought. While international guidelines exist on the measurement of volume of time-related underemployment [9, para.10], corresponding guidelines on the measurement of volume of unemployment or composite measure of volume of unemployment and time-related underemployment do not exist.
Finally, the “payments” quadrant specifies four other identity relationships concerning labour cost and employment-related income:
• Total labour cost
• Total labour income
• Total labour income/employed persons
• Total labour cost/hours worked (hours paid for)
Labour cost may be regarded as wages from the point of view of the employer or the demand side of the labour market. By contrast, labour income or employment-related income may be regarded as earnings from the point of view of the worker or the supply side of the labour market. Labour income refers to employment-related income [10]. The data on weekly hours actually worked for Australia are obtained directly from the labour accounts and compared with the corresponding data from the labour force survey. In the case of labour income, the average income per labour account employed person during the quarter is divided by three to obtain the monthly income from employment. The corresponding survey data are obtained from the Survey of Average Weekly Earnings (AWE) for employees at main job, May 2018, adjusted to monthly figure by the factor 52/12 [15].
3.2Denmark
The Denmark Labour Market Account [16] is a remarkable system of account providing data on the population’s labour market status in terms of full-time persons, covering a given period of time or a given point-in-time (2008–2016), broken down by sex, age group, region, ancestry and 24 socio-economic statuses such as persons in ordinary employment, persons in subsidized employment, unemployed and other persons receiving public benefits, persons enrolled in education, children and youth not enrolled in education and other people outside the labour force [16]. The data are published annually but collected continuously. The primary data are register-based obtained from a range of sources, including the e-income register, central business register, income statistics, statistics on persons receiving social benefits and the central population register. Under the Danish Labour Market Accounts (LMA) system, data are processed in four major stages:
• The first stage involves compilation of data from different sources, entered into a coherent and homogenous source database.
• Then, the various data sources are controlled for “illegal” overlaps, for example, a person receiving unemployment benefits and, at the same time, registered as being in employment.
• The next stage is the application of the hourly standard of 37 hours per week: a full-time person corresponds to 37 hours and a person can at maximum contribute with 37 hours in the LMA. This means, for example, that if a person, who is receiving early retirement pay and who is at the same time holding a job, the person will be included as a fraction of full-time person in relation to the recipient of early retirement pay (say 0.9) with complement fraction (0.1) in relation to being in employment. A range of such special conditions are applied for the statistical treatment of different types of temporary absence from employment, persons in subsidized employment and persons receiving various types of public benefits at the same time.
• The final stage of data processing is the linkage of the labour market status with various demographic and work-place related information from other data sources.
The labour market accounts of Denmark do not provide data on working time and income from employment. Statistics Denmark however maintains an annual and quarterly Working Time Accounts [17], in which the statistics include data on employment, number of jobs, hours worked and compensation of employees by sex, industry, sector, socioeconomic status (self-employed, assisting spouse or employee). The accounts are constructed on the basis of existing statistical data adapted and adjusted to achieve coherence with the Working Time Accounts (WTA) concepts and definitions. The primary data source is the Labour Market Accounts and the results deliver labour market data to the business short-term statistics (STS) and the system of national accounts (SNA/ESA) [18].
Employment refers to the average number of persons who every day during the reference period have been paid either as self-employed, assisting spouse or employee in primary job. Included in the count are:
• Assisting spouses who have transferred income from the self-employed company’s business.
• Working proprietors if it is estimated that there is sufficient activity to constitute a job, based on information from administrative records.
• Subsidized employment if the persons is paid.
• Persons who are temporarily absent for any reason but are attached to a workplace in the form of having a job to return to.
• Persons who have not received any wages for a period of 45 days, but have subsequently returned to the same employer.
• Persons on maternity leave or sick leave.
Generally excluded from the count are unpaid family workers.
Jobs refers to the average number of jobs both in primary employment of persons employed and any sideline jobs by the person. Included in the count are:
• Persons who have not received any wages for a period of 45 days, but have subsequently returned to the same employer.
Excluded from the count are:
• Persons temporarily absent from work due to leave, childbirth or illness. For sick leave, the duration must be beyond the employer period (where the entire period of absence is subtracted). If no pay is received during the absence, the leave period has a maximum duration of 3 months.
• Employment of less than 1 hour of paid work per week.
Hours worked or hours actually worked is measured in essentially four steps:
• Hours paid for to employees by employers, including hours in jobs that are not part of the person’s primary job, paid overtime but excluding paid hours of absence. Paid meal breaks are regarded as hours of availability and are included in hours paid. Paid hours of overtime are defined as the number of paid hours worked in excess of normal paid hours (i.e. contractual hours) and include extra hours of work of part-time employed without additional overtime pay.
• Calculation of ‘paid’ hours of work for self-employed and assisting spouses in their main job and in their sideline job, separately. For main job, it is calculated as the average paid hours of work by employees in primary jobs in the same group (defined in terms of industry, gender, age group and reference month) and adjusted with an aggregated factor for how much more self-employed and assisting spouses say they work more than employees say work in primary jobs according to the corresponding results of the labour force survey. For sideline jobs, the calculation is based on the ‘paid’ hours in main job, but adjusted for how many fewer paid hours of work employees work in sideline jobs compared to paid hours of work by employees in main jobs.
• Conversion of hours paid to hours actually worked. The conversion is carried out on the basis of the structural statistics on earnings taking into account that not all paid hours are necessarily performed, as the employed person may be entitled to paid absences.
• Redistribution of hours worked throughout the year to take into account of the fact that holidays, sickness, public holidays are not equally distributed throughout of the months of the year.
Due to lack of detailed information, unpaid overtime hours worked and criminal hours of work are excluded from the estimation of hours worked in the Working Time Accounts, although such estimates are contained in the National Accounts.
Compensation of employees in the Working Time Accounts includes compensation of employees in cash or in kind which the employer pays to an employee for work performed over a period. It includes;
• A-income, salaries, fees, etc.
• Holiday allowances, wages and salaries during sickness or leave.
• Wage subsidies of any kind, remuneration to board members, committees, etc.
• Pension-like payments to previous employees.
• Labour market contributions and contributions to the Danish Labour Market Supplementary Scheme.
• Taxable value of fringe benefits.
• Total actual contributions to pension schemes from the Central Pensions System operated by the Danish tax authorities.
• Earned pensions in private pension funds.
It excludes:
• Reimbursement of maternity and sickness benefits for the employer.
• Earned public service pension (for the time being).
3.3Comparisons
The labour account estimation of total employment in Iran is compared with those of Australia and Denmark in Table 5. The labour force survey is used as benchmark for comparing the labour account estimates. The first numeric column gives the Australian results. It indicates that there were 13’649’000 employed persons in Australia in June 2018, an estimate 8.0 percent higher than the corresponding labour force survey estimate. The difference is mainly due to additions of defence personnel, non-residents employed in Australia, and child workers, and adjustments for secondary employment and residents employed overseas [14, Appendix 4, cat. no. 6150.0].
Table 5
Labour account and labour force survey estimates of employment: Australia, Denmark, Iran
| Australia 2018 (June) | Denmark 2016 | Iran 2011 (1390) | |
|---|---|---|---|
| Population | 24’894 | 5’746 | 75’150 |
| Employment | Persons (‘000) | Full-time persons (‘000) | Persons (‘000) |
| Labour account | 13’649 | 2’164 | 21’919 |
| Labour force survey | 12’563 | 2’748 | 20’510 |
| Difference | 1’086 | 1’409 | |
| % | 8.0% | 6.4% |
Sources: [19] Australian Bureau of Statistics, 6150.0.55.003 – Labour Accounts Australia, Quarterly Experimental Estimates, Table 1. Total All Industries – Trend, Seasonally Adjusted and Original, Sep 2010 to Sep 2018; [20] Australian Bureau of Statistics, 6202.0 – Labour Force, Australia, Jun 2018. [Seasonally adjusted 12’573’800]; [21] Denmark, StatBank, Labour Accounts, Table AMR1, Ordinary employment total 2016; [22] Denmark, StatBank, Labour Force Survey, Table AKU101, 2016; [4] Iran, Statistical Research and Training Center, Construction of Labour Accounts in Iran: Concepts, Principles and Methods, in Farsi, Tehran, Spring 1397 (2018).
Table 6
Labour accounts and household-based survey estimates of working time and remuneration: Australia, Denmark, Iran
| Australia 2018 (June) | Denmark 2016 | Iran 2011 (1390) | |
|---|---|---|---|
| Population (‘000) | 24’894 | 5’746 | 75’150 |
| Weekly hours actually worked | Hours | Hours | Hours |
| Labour accounts, WTA (Denmark) | 29.7 | 26.0 | 48.1 |
| Labour force survey | 32.1 | 29.8 | 43.7 |
| Difference | 4.4 | ||
| % | 9.1% | ||
| Monthly income from employment | AUS $ | Krone | 1000 Rials |
| Labour accounts | 5’966 | – | 7’642 |
| AWE (Australia), HIES (Iran) | 5’232 | – | 7’435 |
| Difference | 734 | – | 207 |
| % | 12.3% | – | 2.7% |
The next column gives the results for Denmark. It shows that employment in terms of full-time persons was 2’164’000 in 2016, considerably lower than the LFS estimate of 2’748’000 employed persons. The difference is mainly due to the fact that the labour market account employment refers to full-time persons, defined as work of 37 hours per week, and that a person can at maximum contribute 37 hours in the labour market account. The documentation states that “the total number of full-time persons in the labour account corresponds to the average Danish population.”
The last line of the table gives the percentage difference between the labour force survey estimate and labour account estimate of employment for each country. It measures the gap between the two estimates and the extent of adjustment needed on the labour force estimate to reach the labour account estimate. One may thus interpret the figure as reflecting the degree of complexity of the employment account of the country. In this sense, Iran has the least complex employment account, followed by Australia and Denmark with the most complex employment account.
Similar results on working time and remuneration are shown in Table 6 above. As mentioned earlier, data on working time and compensation of employees in Denmark are obtained from a separate system of accounts called Working Time Accounts, linked to the national accounts. The results for 2016 extracted from table ATR118 of statistics Denmark are reproduced below:
| Total | 2016 |
|---|---|
| Hours worked (1000 hours) | 3 835 846 |
| Employment (number) | 2 834 048 |
| Jobs (number) | 3 064 869 |
| Compensation of employees | 1 064 330 |
| (DKK million) |
The annual figure on hours worked is converted to average weekly hours actually worked as in Table 6 above. For the labour force survey, the weekly hours actually worked are obtained from the Denmark Statistics series AKU410A. Data on income from employment for Denmark are not reported in Table 6 because the available data from the Working Time Accounts concern compensation of employees which excludes income from self-employment.
The last lines in top and bottom panels of Table 6 give the percentage difference between the labour accounts estimate and the survey estimate for each of the reported country. It can be observed that the percentage difference for the Iran data is smaller in absolute terms than the corresponding percentage difference for Australia except for the working time account. As suggested earlier, this means that a lower amount of adjustments was involved in the construction of the accounts of Iran relative to those of Denmark in the case of the working time account and of Australia in the case of the income from employment account. It is also instructive to note while in both Australia and Denmark, the weekly hours actually worked calculated from the accounting system is lower than the corresponding figure from the labour force survey, the reverse is true in the case of the Iran.
The main weaknesses of the Iran labour accounts as presently produced are the limited coverage of hours of data in establishment surveys on the demand side, and the absence of data on non-resident employed persons working in resident economic units in household surveys on the supply side. There are many other challenges which the very process of labour accounting have uncovered and must be confronted in the future. For this purpose, the production of labour accounts has been put in the agenda of the Statistical Center of Iran and a team has been formed to undertake the required tasks.
4.Concluding remarks
Labour accounts provide a framework for reconciling and linking data from different sources. In the process, labour accounting provides a base for identifying inconsistencies, gaps and other shortcomings of the labour statistics of the country. The statistics obtained from labour accounts should also provide improved and more consistent data for macro-economic analysis of the labour market, in particular, the analysis of productivity and the relationship between employment and economic growth. The review of the methodologies of labour accounts in Australia, Denmark and Iran shows that there are still major differences in conceptual framework. While part of the differences may be attributable to the underlying statistical infrastructure of the country, a major part may be due to the lack international standards on this topic. Given that labour accounts provide a powerful tool for organizing and analyzing labour statistics, it would be highly valuable if the development of international standards on this topic, started in the 1980’s by the International Labour Office, could be revived.
It is true that countries have developed labour accounts with different objectives in mind. For example, in Iran, labour accounts were initially constructed to learn about the process, and to understand the gaps and shortfalls of the diverse sources of employment data. In Australia, labour accounts were constructed mainly to provide information for productivity analysis at industry level that is more coherent with industry output of the national accounts than data available from the household labour force survey. By contrast, the labour accounts in Denmark were constructed with the primary purpose of providing a complete overview of the population’s labour market status compiled in terms of full-time persons and broken down by socio-economic groups, in particular, persons in employment, students, unemployed persons and other persons receiving public benefits, children and young people and other people outside the labour force.
While the statistical objectives have been diverse among countries, and are expected to remain so in the future, the underlying need to combine varied data sources in an organized manner is and will remain a common desideratum in all countries. Standard procedures, agreed among labour statisticians across the world, will no doubt play a crucial role to promote the art of “combining data sources to produce new information not contained in any single source.” [23]. This should become ever so important in the future, as the current trend of increasing use of register-based labour statistics and decreasing reliance on survey data in many countries will, in all likelihood, continue.
Acknowledgments
The authors would like to express their gratitude to the Statistical Research and Training Centre, Iran, for providing support and assistance in this project.
References
[1] | International Labour Office. General report. Fifteenth International Conference of Labour Statisticians, Geneva; (1993) . |
[2] | Hoffmann E. A Labour Accounting System – Reflections on Main Concepts and Principles. Statistical Journal of the United Nations Economic Commission for Europe (ECE), Geneva; (1990) . |
[3] | Buhmann B, Leunis W, Vuille A, Wismer K. Labour Accounts: A Step Forward to a Coherent and Timely Description of the Labour Market, International Labour Office Bulletin of Labour Statistics, Geneva; (2000) . |
[4] | Rezaei Ghahroodi Z, Mehran F, Salehi S, Hakimipour N. Construction of Labour Accounts in Iran: Concepts, Principles and Methods. Statistical Research and Training Center. Farsi, Tehran, Iran; (2018) . |
[5] | International Labour Office. Resolution concerning statistics of work relationships, 20th International Conference of Labour Statisticians. Geneva; (2018) . |
[6] | et al.System of National Accounts 2008, New York; 2009. para. 4.10. |
[7] | International Labour Office. Resolution concerning statistics of work, employment and labour underutilization. 19th International Conference of Labour Statisticians. Geneva; (2013) . |
[8] | International Labour Office. Resolution concerning the measurement of working time. 18th International Conference of Labour Statisticians, Geneva; (2008) . |
[9] | International Labour Office. Resolution concerning the measurement of underemployment and inadequate employment situations. 16 |
[10] | International Labour Office. Resolution concerning the measurement of employment-related income. 16th International Conference of Labour Statisticians, Geneva; (1998) . |
[11] | Statistical Center of Iran. Labour Force Survey; (2011) . |
[12] | Statistical Center of Iran. Iranian Urban and Rural Household Income and Expenditure Survey; (2011) . |
[13] | Zahedian A, Aliakbari Saba R. Measurement error estimation methods. Survey methodology. Applications and Applied Mathematics: An International Journal. (2016) ; 11: (1), 97–114. |
[14] | Australian Bureau of Statistics. Australian Labour Account. Concepts, Sources and Methods. ABS Catalogue No. 6150.0, Commonwealth of Australia; (2017) . |
[15] | Australian Bureau of Statistics. Survey of Average Weekly Earnings (AWE). |
[16] | Statistics Denmark. Documentation of statistics for Labour Market Account 2014. Copenhagen, (2014) . |
[17] | Statistics Denmark. The Annual and Quarterly Working Time Accounts (WTA). |
[18] | European Union. System of National Accounts, European System of Accounts (SNA/ESA). |
[19] | Australian Bureau of Statistics. Labour Accounts Australia, Quarterly Experimental Estimates, Catalogue No. 6150.0.55. 003 – Table 1 (Total All Industries – Trend, Seasonally Adjusted and Original, Sep 2010 to Sep 2018). |
[20] | Australian Bureau of Statistics. Labour Force, Australia. Catalogue No. 6202.0, Jun 2018 (Seasonally adjusted). |
[21] | Statistics Denmark. StatBank, Labour Accounts, Table AMR1, Ordinary employment total; (2016) . |
[22] | Statistics Denmark. StatBank, Labour Force Survey, Table AKU101; (2016) . |
[23] | Groves RM. The future of producing social and economic statistical information, Part Director’s Blog. US Census Bureau, Department of Commerce, Washington DC; September 8, (2011) . Available www.census.gov. |

