
Use of administrative records for non-response in the New Zealand 2018 Census
Abstract
Stats NZ is beginning to see the benefits of a programme of research into greater use of administrative data for the population census and the wider population statistics system. The research effort has been driven by a need to modernise and reduce costs of the current full-enumeration census model, and the opportunities afforded by a rich and growing set of integrated administrative data. While New Zealand does not have an administrative population register, or any mandatory requirement to register an address with authorities, we have developed a statistical admin resident population based on a ‘signs of life’ approach. This work has proved to be a significant advantage given an unanticipated level of non-response in the most recent full field enumeration census in 2018. The final 2018 Census dataset consists of 89 percent census responses and 11 percent admin enumerations. This paper focusses on the statistical methods used to determine high-quality administrative records to include in the final 2018 Census dataset.
1.Introduction
Administrative data have always been integral to the production of Stats NZ’s official population statistics, however, the ways in which administrative data are being used is changing. These changes are taking advantage of opportunities afforded by the integration of administrative sources which were formerly only available separately, and the use of statistical methodologies that are needed to take full advantage of the linked data. As well as these opportunities, the exploration of new ways of using administrative data has been driven by concerns about cost pressures and the sustainability of the current full field enumeration census. Most recently, the lower than expected response rate to the 2018 Census has highlighted the challenges of running a full enumeration census.
Population statistics in New Zealand are based on a five-yearly full field enumeration census. The census data are released in their own right and provide a rich array of social and economic information for small sub-groups and small geographies. The New Zealand census is a census of both population and dwellings. The census develops a list of all dwellings in New Zealand – the census dwelling frame – and then counts people within those dwellings. Census forms are completed during the collection phase of the census, and in the three most recent censuses, forms could be submitted through an online collection system or by completing and returning a paper form.
A separate official Estimated Resident Population (ERP) series is the best measure of the population living in New Zealand at a given time [1]. The ERP adjusts for net undercount in the census, as measured by a coverage survey [2]. The ERP also includes residents who are temporarily overseas on census night who are not counted by New Zealand’s de facto or ‘persons present’ census concept. Population change from census day applies a cohort component method using high quality Birth and Death registrations, and measures of external migration.
New Zealand is fortunate in having excellent information sources on external migration. We are an island country with a record of border crossings that includes almost all travel journeys into and out of the country. A new measure of external migration has been developed based on actual time spent in New Zealand, rather than the previous approach that used intentions stated on arrival and departure cards. The new measures construct a longitudinal register of travel histories for individuals from linked border crossing data [3].
Stats NZ committed to exploring the use of administrative data for the census in its Census Transformation Strategy [4]. The strategy consists of two parallel strands. The first is a short to medium term focus on modernising the current full field enumeration census, with the first implementation in the 2018 Census of Population and Dwellings. The second strand is investigating the feasibility of a census largely based on administrative data in the long-term. The two strands are inter-dependent and the 2018 Census included a goal to increase the use of administrative data. The value of this joint strategy has become clear in the light of lower than anticipated response rates in 2018, which has considerably extended the role that administrative data now plays in the 2018 Census.
1.1Longer-term census transformation based on administrative data
Stats NZ’s Census Transformation programme is exploring the feasibility of a census based largely on administrative data, and supported by sample surveys. Bycroft [5] describes the administrative data landscape in New Zealand, and progress producing an administrative resident population to that point.
Stats NZ reports to government periodically, outlining progress and seeking decisions on future direction. In a 2015 Cabinet paper government agreed that Stats NZ actively work towards a future census based primarily on government administrative data, supported by redevelopment of its household surveys. The linked administrative data sources available in Stats NZ’s Integrated Data Infrastructure (IDI) have been the basis for this research. The IDI provides safe access to anonymised linked microdata for research and statistics in the public interest. The basic structure of the IDI consists of a central population list or ‘spine’ to which a series of data collections are linked. The IDI continues to expand as more data sources are added, and the number and range of research projects is rapidly increasing.
For an administrative-based census, we aim to derive a list of people who are resident within New Zealand at a given point in time, without relying on the full field enumeration of the traditional census. The progressive development of a ‘signs of life’ approach is described in [6, 7, 8]. A wide range of events-based interactions with government agencies are available in the IDI including: tax payment, benefit receipt, school and tertiary education enrolment, health care (visit to the doctor, hospital admission, pharmaceutical prescription), accident insurance claims, and visa applications. Activity in New Zealand as reflected in at least one of these administrative data sources during a two-year window is used to indicate an individual’s presence in New Zealand. Anyone who had died or migrated overseas before the reference date is removed. We also need to determine where in New Zealand these individuals live. Geographic location is derived from address information sourced from multiple agencies. The resulting New Zealand admin resident population derived from the IDI is called the IDI-ERP, and is currently implemented in the IDI for use by researchers. This IDI-ERP population is also the source of administrative records for inclusion in the 2018 Census file.
In 2016, we released an experimental data series [7, 8] of national-level administrative population estimates, with further releases for a subnational geography time-series in 2017, and inclusion of ethnic groups in 2018. The experimental data series include estimates at 30 June from 2006 to 2016. Online tables compare the IDI-ERP with official population estimates over the same period. These comparisons are largely encouraging. Often there is close agreement with official figures, and consistency has increased steadily over time. However, there are still marked differences for some age groups and local areas.
While the IDI-ERP is a good approximation of the New Zealand resident population, it includes an unknown group of erroneous inclusions, and also misses some people. These coverage errors make it more challenging to derive an admin-based population estimate sufficiently accurate for official statistics, to low levels of geography. We are developing new population estimation models combined with a single coverage survey that will adjust for over-coverage in administrative sources as well as for under-coverage. We are also developing methods to adjust for the mis-classification of admin-based location information. However, neither of these methods were sufficiently developed for the 2018 Census application.
The Census Transformation programme has also undertaken a structured quality assessment of census variables derived from linked administrative data sources, which has shown where administrative data has most to offer the census. Stats NZ continues to publish results of investigations that compare 2013 Census variables with their counterparts derived from administrative sources. These include papers on ethnicity, country of birth, Māori population identifiers, income, educational qualifications, number of children born, households and families, and housing variables.
1.2The 2018 Census: Modernising the full field enumeration census
The 2018 Census strategy [9] set out an ambitious modernisation programme across all components of census taking. This followed several censuses of minimal content change, and limited innovation. In a reversal of previous censuses, the collection was designed to be predominantly on-line, with paper forms in a supporting role. Mail-out of census material, including online access codes, to 80 percent of dwellings was achieved through an address frame based on administrative sources.
The 2018 Census strategy also included use of alternative sources to improve data quality in the context of missing data for census questions, based on the findings of the longer-term administrative data research. Improvements to adjust for missing census characteristics data were signalled in the 2018 Census strategy. These included the use of alternative sources (the previous 2013 Census and good quality administrative sources), and more extensive use of statistical imputation.
While some aspects of the 2018 modernisation have been successful, major challenges were faced when implementing the new collection model. Some 4.2 million census forms were received through the census field collection. This level of response was lower than expected and was seen across all regions. However it was clear that non-response was more concentrated in some geographic areas, and that groups which are typically harder to count in the census (younger adults, Māori and Pacific ethnic groups) were disproportionately affected in 2018.
Previous censuses have included an adjustment for non-response, through inclusion of ‘substitute’ records, a form of unit imputation [10] and a similar approach had been planned for 2018. Once these collection issues became clear in mid-2018, Stats NZ embarked on development of new methods for including people in the 2018 Census dataset based on administrative data. The new methods have built on the research undertaken by the longer-term census transformation investigations and fast-forwarded their development for use in the context of a full field enumeration census. The final 2018 Census dataset consists of 89 percent census responses and 11 percent of people counted from administrative records. These admin enumerations completely replace unit imputation as a mitigation for unit non-response to the field collection. The use of alternative sources for census characteristics has taken on greater significance than originally anticipated given the contribution of administrative records to the final census dataset and an increased number of partial census responses.
The inclusion of administrative records in a traditional full field enumeration census is unusual internationally. In their 2011 Census, Northern Ireland added records obtained from administrative health data to count people who had been missed by the field collection [11]. Statistics Canada used administrative records in their 2016 Census when major wildfires led to the evacuation of the Fort McMurray area and the suspension of census collection activity very close to census day. Of most relevance here is the United States Census Bureau work investigating the use of high-quality administrative records in the United States 2020 Census as a means of improving efficiency in their field collection process [12].
While the New Zealand census in 2018 was planned as a full field enumeration census, with the inclusion of more than 10 percent of records from administrative data, we consider the final census dataset to fit within the United Nations ‘combined census’ definition [13].
As well as methodological issues (‘can we’ do this), we also needed to consider the use of administrative data in the census from a legal and ethical perspective (‘should we’). In New Zealand, the Statistics Act 1975 and Privacy Act 1993 together provide the legal basis for the use of administrative data in the 2018 Census. The primary reason for this is that the Statistics Act requires that the same level of confidentiality is applied to statistics or research as is required by the Privacy Act. Using data with inherent biases can raise significant ethical issues because it can cause disadvantage and harm to particular groups. The use of administrative data to improve the quality of the census is an ethical approach from this perspective. A privacy impact assessment of combining administrative data and data from census forms concluded that this use of administrative data is lawful, safe, and beneficial to New Zealanders [14].
The following sections describe the methods for determining which administrative records to include in the 2018 Census dataset, followed by key results. The focus is on the key census demographic counts by age, sex, and ethnicity, and for geographic areas. We conclude with a discussion.
2.Methods for admin enumerations in the 2018 Census
We first outline our overall approach, and then describe the methodologies used in the main steps in more detail.
The New Zealand admin resident population, the IDI-ERP described above, is the source for including administrative records in the 2018 Census dataset. The IDI-ERP is derived for census day (March 6
While previous research has shown the IDI-ERP to be a good approximation of the NZ usual resident population, we expect that some undercoverage and overcoverage errors remain in this IDI-ERP constructed for the 2018 Census. The impacts of undercoverage and overcoverage in the IDI-ERP differ. If a person has not responded to the census field collection, and has also not been selected in the IDI-ERP, then they will be missing from the final census dataset. Overcoverage in the IDI-ERP could lead to a person being wrongly included in the final 2018 Census dataset.
We were more concerned with avoiding potential overcoverage errors introduced through the use of administrative sources than eliminating all undercoverage in the 2018 Census dataset.
Much of the unique value of a census is derived from information about small geographic areas and local communities. The census is also very important for providing household and family information. This meant that the quality of administrative addresses was the other main concern in our development of statistical methods. We have multiple administrative address sources, each of varying quality, covering different groups in the population, and with varying incentives for people to update their address information. To assign an address for a person on census day, we selected the most recent address notification prior to census day from any of the available sources, as this was found to produce the best results compared with other rules-based strategies [8]. Comparing administrative data linked to the census we find that accuracy is high for larger geographic areas, but that accuracy decreases at smaller geographies. In a comparison of the administrative address in 2018 with 2018 Census responses, 95 percent of IDI-ERP records were in the same territorial authority and Auckland local board (TALB) as the census response, 89 percent were in the same meshblock (the smallest geographic area, up to about 100 people), and 87 percent had the same address. This was an improvement over results from the 2013 Census [8].
Individuals can also be grouped into households based on their administrative address to form admin households. However obtaining accurate address information for all members of a household is more demanding than for individuals. Using 2013 data, we found that 48 percent of admin households had exact agreement with the 2013 Census in terms of membership [15]. Smaller households and households with older adults (aged 65-plus) were more likely to agree.
Administrative records have been added to the census dataset when they improve the overall quality of the census data. We looked to find a suitable balance between including administrative records for people who are members of the census resident population, and the impact that might have on the quality of households, and of small area information. Statistical models provided probabilities of the admin information being correct, and thresholds were set based on considered judgement of the trade-offs involved. Admin households are formed when we have good evidence for improving census household information. Otherwise, administrative records are not placed in dwellings, but are placed within a meshblock when we can do so while improving the quality of census small area data. These administrative records, or admin enumerations, added to the final census dataset fully replaced the unit imputation used to adjust for non-response in previous censuses.
We note that admin enumerations are also linked to the 2013 Census and other administrative sources that were used to provide information for characteristics when they were missing from census questionaires. This ability to obtain information about the same person from alternative sources, although provided at a different time or different context, is another key advantage over unit imputation. The value of the census questionnaire component is evident for census variables where no alternative sources are available. These variables consequently have higher levels of missing data in 2018, and those sub-groups with lower response rates to the field collection are more adversely affected.
A related methodological innovation has been the development of a new population estimate for the 2018 census date by combining census responses and the admin population using dual system estimation (DSE). This population estimate has been used as benchmark population to guide the development of the new approaches and to assess the coverage of the final census dataset as shown in the results.
We now outline the statistical methodologies used to include high quality admin enumerations in the census file. More detailed description of the methods and results can be found in [16].
2.1Linking the census and administrative data
Received census forms always take priority. We link 2018 Census respondents to the same person in the IDI spine, so that we can remove them from the IDI-ERP, leaving only those who did not respond. This requires a high linkage rate and accurate linkages. Since New Zealand does not have a common identifier, probabilistic linkage methods were applied. Variables used to compare records were first and last names, date of birth, age, sex, country of birth, meshblock and address ID [17]. The overall linkage rate of 97.7 percent is high in the New Zealand context.
Census respondents who have not been linked to the IDI spine are a mix of those who:
• should have been matched to the IDI spine but were not (a missed or ‘false negative’ match)
• are not in the IDI spine (and therefore the non-match is correct)
The rate of missed matches for individual forms is estimated as 1.21 percent. If we have not linked a census record to the IDI spine when we should have, the same person could be included in the final census dataset twice. Below we describe an adjustment made to account for missed linkages.
False positive matches (when different people are incorrectly linked) are estimated as being less than 1 percent of the links made. An incorrect link removes the administrative record from the possibility of inclusion in the final census dataset.
2.2Admin enumerations in dwellings
The field enumeration census is designed to count people within dwellings, and previous censuses adjusted for non-response by adding imputed records within dwellings where responses were thought to have been missed. Following this traditional approach, the first and most demanding use of administrative data is the placement of groups of people within a dwelling to form households. The census dwelling frame provides a list of addresses for private dwellings where no census responses have been received. A combination of two statistical models were used to predict which households constructed from administrative records are likely to have reliable data.
The approach is based on methodology developed by the US Bureau of the Census who have a planned strategy to use admin enumerations in the non-response follow-up phase for their 2020 Census [12]. While the focus of the US approach is to reduce contacts in their field operations, similar approaches can be used after data collection is completed to use administrative records in lieu of imputation.
The ‘person-place’ model assesses the probability that the admin address reflects the true address for an individual; the ‘household composition’ model assesses the probability that the admin derived household members reflect the true household composition at a given address. A composite distance score for an address combines the probabilities from each of these models. This distance score represents how reliable the administrative data is for representing the entire household in a given dwelling, and a cut-off determines which of those households will be added to the census dataset.
The required probabilities are estimated through logistic regression. Most of the covariates used relate to information about the addresses, such as the number of admin sources that report the same address, or the amount of time living at the current address. Age was the only demographic variable determined to be an important predictor. Information about whether relationships were identified to other individuals at the same address was also used. 2018 Census responding households are assumed to represent the truth when training and assessing the models.
The distance cut-off has been set as a balance between strict criteria of obtaining exactly the same people in the household as we observe in the census, and including admin households that reflect similar adult-child patterns as the census, even if we cannot guarantee that all household members are the same. Making the trade-off in this way means we include relatively more large or complex households than if we had set a more conservative cut-off, and makes some allowance for errors in census responding households.
Of the 89,355 admin households that could be derived for non-responding census dwellings, 57,609 (64 percent) were above the cut-off and the 141,411 members of those households were added to the census dataset as admin enumerations. [18] provides a full description of the statistical models and further results.
While households where we have received some census responses may still be missing people, we have not developed a model to predict when administrative records ostensibly for the same address should be placed within those responding households. Some administrative records are included in responding private dwellings, but only within strict conditions. We require strong evidence from the received responses that a person who usually lives there has been missed, and the address and relationship characteristics must be mapped to an eligible administrative record. A small number of administrative records have also been included in two types of non-private dwelling – prisons and defence establishments.
2.3Admin enumerations in meshblocks
It became apparent that the traditional census approach of only placing people into dwellings where they had been missed would not be sufficient, given the scale of non-response. The next phase places administrative records into meshblocks, the smallest New Zealand geographic area. The administrative address ID provides an x, y location coordinate, but the person will be excluded from census households.
The remaining IDI-ERP population eligible for inclusion in meshblocks are those who have not been linked to a census respondent, and are not already included at a dwelling. We then explicitly adjust for potential coverage errors that could result from over-coverage in the IDI-ERP, and for duplication caused by missing linkages between the census and the IDI. We draw on new methods Stats NZ have developed to remove over-coverage and adjust for missed matches in the context of the new Dual System Estimation (DSE) population [19]. DSE is a well-established methodology used in population estimation, often applied in the context of a full enumeration census and a coverage survey. Over-coverage is typically avoided by design of the coverage sample, and extensive checks are made to meet the DSE assumption of no linkage error. Neither of these approaches were possible in this situation.
2.3.1Removing over-coverage in the IDI-ERP
Our approach is designed to remove over-coverage caused by people selected in the IDI-ERP who are not New Zealand residents at the time of the census. As we cannot directly find over-coverage, we will also remove valid records. The goal is to effectively remove as much over-coverage as possible, while also minimising the amount of under-coverage being introduced. We apply a more rigorous selection criteria for inclusion, whereby people must have activity over the previous two years in at least two data sources: tax or health, plus one other. Tax and health datasets have high coverage of the population, and requiring an additional activity provides stronger evidence that people are in fact residents. This approach targets all age-sex groups, combines factors found to predict over-coverage in previous research, and is easy to apply and explain. Further details are provided in [19].
Of the 602,889 IDI-ERP records not already included in the census dataset, 130,311 are excluded to account for overcoverage.
2.3.2Accounting for missed linkages
Before selecting administrative records to place in meshblocks, we first remove overcoverage as described above, and then adjust for matches that were missed when we linked the census forms and the IDI spine. If we have not linked a census record to the IDI spine when we should have, it will still be in the eligible IDI-ERP dataset, and would be counted again. We are matching around 4 million census records to an IDI spine consisting of nearly 10 million records, and did not have the time or resources for checking even a sample to estimate missed matches.
We estimate missed matches on the basis of responses to census questions that closely match the criteria for inclusion in the IDI spine. A subset of the census is created through applying strong requirements of membership in two or more of the datasets that make up the IDI spine [19]. Those in this census subset should all have been linked to the IDI spine, and those who have not been linked are missed matches. The overall rate of missed matches is estimated as 1.21 percent, with rates available by strata (age, sex, geographic areas, and ethnic groups). From this we calculate the number of missed matches to remove from those who have not been linked to the census. In total, 47,670 records were removed. The appropriate number of people are removed through random selection within strata. This adjustment does not remove exactly the people whose census record should have matched to the IDI. Rather it removes a random selection of the right kind of people to a fine demographic breakdown; [16] provides more detail.
2.3.3Accounting for the quality of administrative location data
After these adjustments we can be confident that the remaining eligible IDI-ERP people should have been counted by the census. However, we also consider the accuracy of administrative location data, which decreases as geographies get smaller. To limit the errors for small sub-national geographies, we exclude people who have a low probability of a correct admin meshblock. We apply a statistical model adapted from the one used to predict reliable admin addresses [18]. For all eligible individuals, we compute a model score for the likelihood that their admin meshblock reflects their true meshblock of usual residence. We include all individuals with a probability of greater than 0.5 as admin meshblock enumerations. This score indicates that their admin meshblock is more likely than not to represent their true usual residence on census night.
The trade-off here is between including more individuals in the census dataset and protecting the integrity of small area geographies. This meshblock cut-off is the main driver of which administrative records are included or excluded from the census file. In total, 357,294 people (85 percent of eligible records) are selected as admin meshblock enumerations. Almost all eligible administrative records aged 0–17 or 65-plus are included in the census dataset. Considerably more young adults are rejected for having low probabilities of being in the correct meshblock, although the majority are still included as admin meshblock enumerations.
Some 64,815 administrative records highly likely to be NZ residents remain and are not included in the census dataset because their admin meshblock has a low probability of being correct.
3.Results
We first show the characteristics of people added as admin enumerations compared with respondents to the census field collection. We then compare the final 2018 Census dataset with the DSE benchmark population, our best available estimate of the true population.
3.1Contribution of admin enumerations to the final 2018 Census dataset
Overall, census responses make up 89 percent of the census dataset, and admin enumeration 11 percent. Table 1 shows the number of administrative records included from each step. The admin meshblock enumerations make up 8 percent of the final 2018 Census usual resident population count, admin household enumerations make up 3 percent, with the other dwelling-based admin enumerations contributing 0.6 percent.
Table 1
2018 Census usual resident population count, by unit record source
| Unit record source | Count | Percent |
|---|---|---|
| Census responses | 4,174,902 | 88.8 |
| Admin household enumerations | 141,411 | 3.0 |
| Other dwelling-based admin enumeration | 26,148 | 0.6 |
| Admin meshblock enumerations | 357,294 | 7.6 |
| Total | 4,699,755 | 100 |
The age distributions of the admin enumerations are markedly different from received census responses (Fig. 1). Both the admin household and meshblock enumeration groups tend to include relatively more children and young adults, and fewer people in the older age groups. This trend is most observable for the meshblock enumerations, with 34 percent of these individuals aged 20–34, compared with 20 percent of respondents. This suggests young adults are less likely to have responded to the census than other age groups and are also less likely to have been part of high-quality admin households. In contrast, 16 percent of census respondents were aged 65 or older, compared with 7 percent for both the admin household and meshblock enumerations, indicating higher census participation for older age groups.
Figure 1.
Age distribution of census usually resident population count, by unit record source.
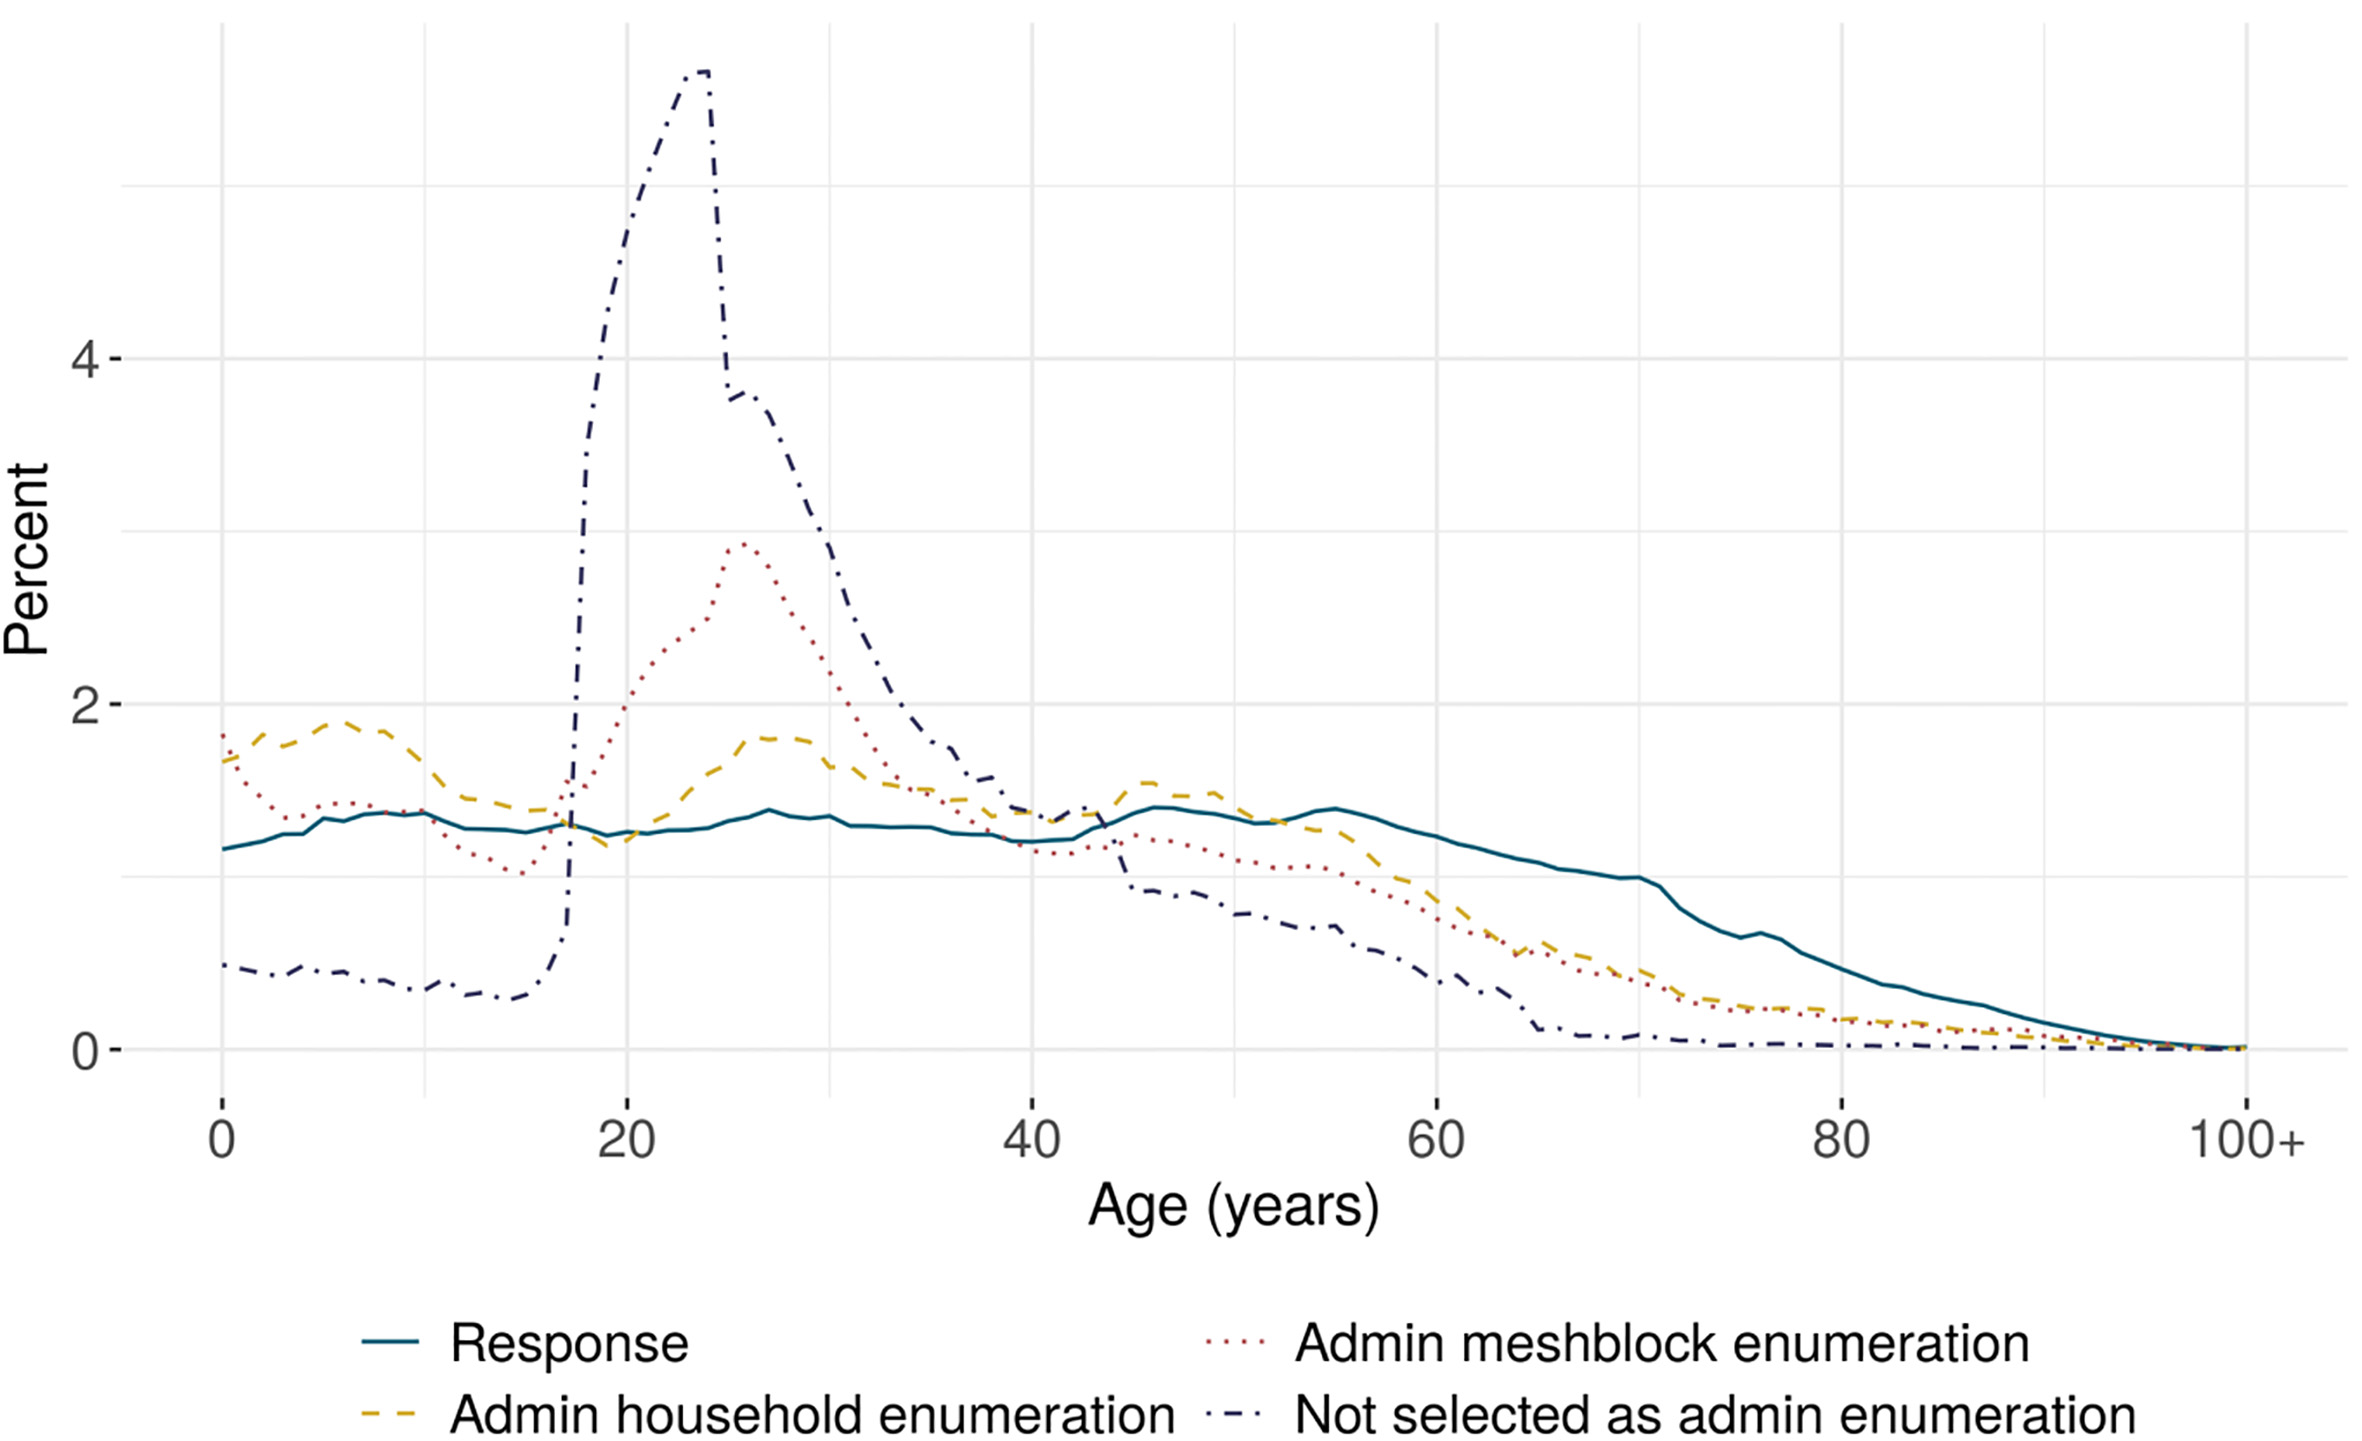
Figure 1 also shows the age distribution of administrative records that have been excluded because their admin meshblock was predicted to be low quality. These excluded records are overwhelmingly in the 18-to-24-year age group. This feature is driven by the meshblock prediction model, as this age group tends to have a lower probability of a correct admin meshblock due to poor-quality address information.
The admin enumerations also had considerably higher proportions of people identifying with Māori and Pacific ethnicities than for census respondents, and a lower proportion of people identifying with the European ethnic group. This indicates lower participation for people of Māori and Pacific ethnicity in the 2018 Census.
As would be expected from these results, admin enumerations make up a greater proportion of the final census dataset for young adults, and for Māori and Pacific ethnic groups. Almost a quarter of the Māori and Pacific populations are admin enumerations, compared with 8 percent for the European ethnic group (Table 2). These populations have been associated with higher levels of undercoverage in previous censuses [2]. The prevalence of these groups among the admin enumerations is an indication that administrative records do include those who are typically harder to count in a census field enumeration. A key advantage of the admin enumeration approach is that these populations are better represented than they would be based only on imputation. Administrative data is generally of high quality for key demographic variables and so we can be confident the different distribution of admin enumerations compared with census responses is likely to represent an improvement to census counts.
Table 2
Proportion of census responses and admin enumerations, by level 1 ethnic group
| Ethnic group | Census responses | Admin enumerations | ||
|---|---|---|---|---|
| Count | Percent | Count | Percent | |
| European | 3,029,625 | 91.9 | 268,236 | 8.1 |
| Māori | 600,078 | 77.3 | 175,761 | 22.7 |
| Pacific | 291,957 | 76.5 | 89,688 | 23.5 |
| Asian | 638,514 | 90.2 | 69,084 | 9.8 |
| MELAA | 61,626 | 87.6 | 8,706 | 12.4 |
| Other | 51,009 | 87.9 | 7,041 | 12.1 |
| Total | 4,174,902 | 88.8 | 524,853 | 11.2 |
3.2Comparison of final 2018 Census dataset and DSE benchmark populations
The DSE benchmark population is the most suitable estimate of the true census usual resident population available at this time. Comparison with the DSE provides an indication of the coverage patterns for the 2018 Census after admin enumerations have been included. DSE benchmarks are available by single year of age, for Māori, Pacific, and Asian ethnic groups, and for TALB geographies. Further breakdowns are not available due to constraints of the estimation method [19].
The DSE population total is 4,768,600, compared with the total census count of 4,699,755, 1.4 percent smaller than the DSE. Until the formal post-enumeration survey undercount measurement is available, this 1.4 percent net undercount compared with the DSE provides our best indication of census overall coverage. It compares with a 2.4
Table 3 shows the DSE population benchmarks compared with the census counts for several key groups. Despite admin enumerations having significantly boosted populations for Māori, Pacific people, and young adults, the undercount is still higher for these groups than the overall average.
Table 3
2018 Census and DSE benchmark counts, by age group and selected ethnic groups
| Population group | 2018 Census usual resident | DSE benchmark | Difference between 2018 Census |
| population count | and DSE benchmark (percent) | ||
| Ages 0–17 | 1,104,240 | 1,106,100 | |
| Ages 18–24 | 438,381 | 460,400 | |
| Ages 25–44 | 1,248,240 | 1,285,100 | |
| Ages 45–64 | 1,193,724 | 1,204,800 | |
| Ages 65 | 715,167 | 712,100 | 0.4 |
| Māori ethnic group | 775,836 | 807,900 | |
| Pacific ethnic group | 381,642 | 397,200 | |
| Asian ethnic group | 707,598 | 727,400 | |
| Total | 4,699,755 | 4,768,600 |
Source: Stats NZ.
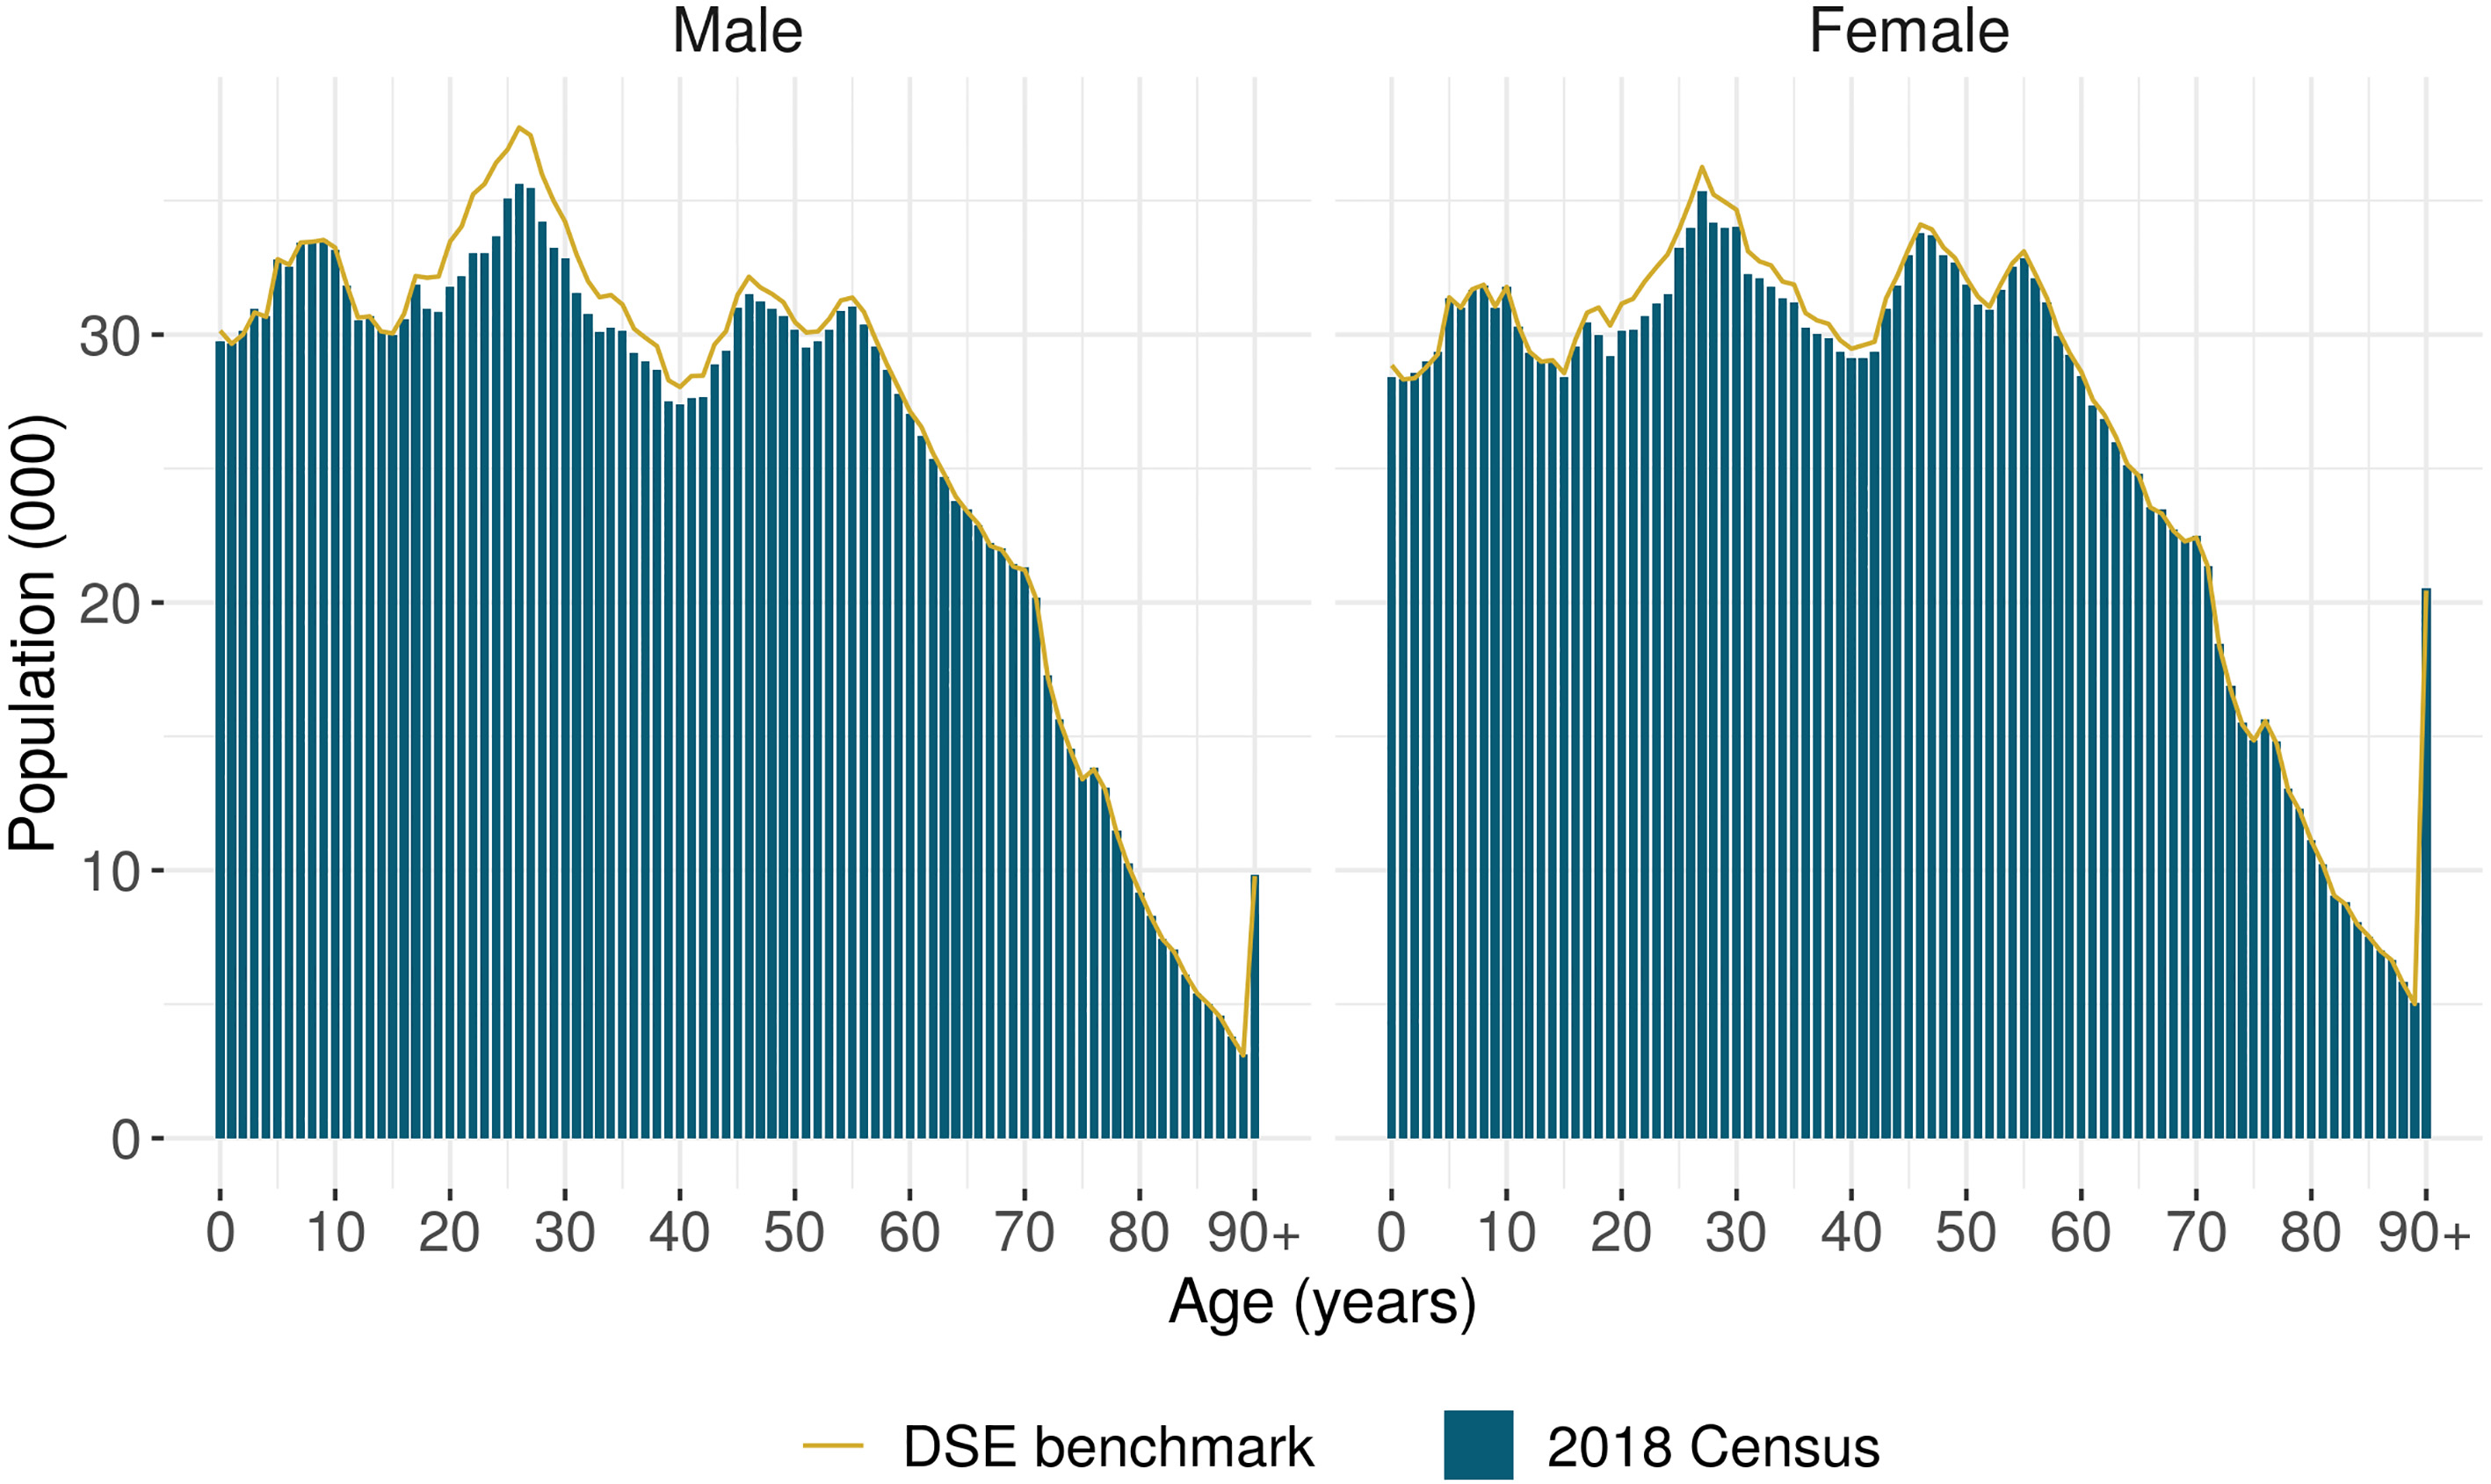
Figure 2 compares the census and DSE distributions by single year of age, for males and females. The census follows the DSE very closely for children and for older adults, while there is some undercount apparent for younger adults. The gap is more marked for younger males than for females. These patterns are consistent with younger adults being more likely to be excluded from the admin enumerations due to lower-quality administrative address information.
Figure 2.
2018 Census and DSE benchmark counts, by sex and single year of age.
4.Discussion
The 2018 Census dataset consists of people counted through responses to the census field collection plus those counted through administrative records. A coherent methodology has been developed for including administrative records in the census dataset, based on an understanding of the limitations of the administrative data. The inclusion of administrative records has been conservative to avoid introducing overcoverage at national, and sub-national geographies through incorrect administrative records, with the consequence that some undercoverage remains in the final 2018 Census dataset.
The administrative enumerations bring real data about real people into the census dataset for those from whom we do not have a census response. It is clear from our results that the admin resident population does include many people who are typically hard to count through census field collection. The admin enumerations replace the use of unit imputation and make a significant quality improvement over previous census methods for non-response adjustment.
The new DSE benchmark population estimates have proved to be a valuable innovation, giving a sound basis for testing different options for non-response mitigation, and an indication of the coverage patterns in the final 2018 Census dataset.
Based on these results, and other sensitivity analyses for key uses, Stats NZ is now confident that it has compiled a census dataset that will provide census usually resident population counts and electoral counts of acceptable quality.
This work was not planned as part of the build-up to the 2018 Census. New methods were needed and were developed under considerable time pressure to minimise delays in releasing census outputs. Consequently, it has not been possible to describe publicly the more extensive use of administrative data and the new methods developed to use this data, before the census field collection, as would have been desirable. However our experience with the 2018 Census where we faced unacceptably low response rates has highlighted the value of undertaking the longer-term research into an admin-based census. Being well-prepared to use administrative data to supplement responses, if necessary, provides a welcome risk management strategy.
Requirements for the effective use of administrative data for the 2018 Census included the ability to safely access linked data sources, and statistical models developed for various estimation processes. The 2018 Census example is an intermediate step that combines field enumeration and admin data. Essentially the methods have been developed by breaking our problem into its constituent parts and applying the best available solution to each of these problems. The combination of each of these methods are unique but the elements of the solution are all drawn from standard statistical practice. However, this approach does not estimate the remaining missing data, nor provide uncertainty measures, which are produced through a coverage survey.
The 2018 Census has provided us with greater insight into the properties of our administrative data, and has placed Stats NZ in a good position to further develop the role of administrative data in future censuses and population statistics.
References
[1] | Stats NZ. Estimated resident population 2013: Data sources and methods. Stats NZ [Internet]. (2014) . Available from http://archive.stats.govt.nz/browse_for_stats/population/estimates_and_projections/erp-2013-data-sources-methods.aspx. |
[2] | Stats NZ. Coverage in the 2013 Census based on the New Zealand 2013 Post-enumeration Survey. Stats NZ [Internet]. (2014) . Available from http://archive.stats.govt.nz/browse_for_stats/population/census_counts/report-on-2013-post-enumeration-survey.aspx. |
[3] | Stats NZ. Outcomes versus intentions: Measuring migration based on travel histories. Stats NZ [Internet]. (2017) . Available from https://www.stats.govt.nz/methods/outcomes-versus-intentions-measuring-migration-based-on-travel-histories. |
[4] | Stats NZ. Transforming the New Zealand Census of Population and Dwellings: Issues, options, and strategy. Stats NZ [Internet]. (2012) . Available from https://www.stats.govt.nz/research/transforming-the-new-zealand-census-of-population-and-dwellings-issues-options-and-strategy. |
[5] | Bycroft C. Census transformation in New Zealand: Using administrative data without a population register. Statistical Journal of the International Association for Official Statistics. (2015) ; 31: (3): 401-411. |
[6] | Gibb S, Bycroft C, Matheson-Dunning N. Identifying the New Zealand Resident Population in the Integrated Data Infrastructure (IDI). Stats NZ [Internet]. (2016) . Available from https://www.stats.govt.nz/research/identifying-the-new-zealand-resident-population-in-the-integrated-data-infrastructure. |
[7] | Stats NZ. Experimental population estimates from linked administrative data: methods and results. Stats NZ [Internet]. (2016) . Available from https://www.stats.govt.nz/experimental/experimental-population-estimates-from-linked-administrative-data. |
[8] | Stats NZ. Experimental population estimates from linked administrative data: 2017 release. Stats NZ [Internet]. (2017) . Available from https://www.stats.govt.nz/experimental/experimental-population-estimates-from-linked-administrative-data. |
[9] | Stats NZ. 2018 Census strategy. Stats NZ [Internet]. (2016) . Available from https://www.stats.govt.nz/methods/2018-census-strategy. |
[10] | Stats NZ. Understanding substitution and imputation in the 2013 Census. Stats NZ [Internet]. (2014) . Available from http://archive.stats.govt.nz/Census/2013-census/methodology/substitution-and-imputation.aspx. |
[11] | Green B, Jpelaar J, Marshal D, Beatty R. Using an administrative primary care health activity indicator to address under-enumeration in the 2011 Census in Northern Ireland. Journal of the Statistical and Social Inquiry Society of Ireland, XLIII. (2014) . |
[12] | Keller A, Mule V, Morris D, Konicki S. A distance metric for modeling the quality of administrative records for use in the 2020 U.S. Census. Journal of Official Statistics. (2018) ; 34: (3): 599-624. doi: 10.2478/JOS-2018-0029. |
[13] | United Nations Principles and Recommendations for Population and Housing Censuses Revision 3. United Nations Department of Economic and Social Affairs Statistics Division [Internet]. (2017) . |
[14] | Stats NZ. Creating the 2018 Census dataset by combining administrative data and census forms data: Our privacy considerations. Stats NZ [Internet]. (2019) . Available from https://www.stats.govt.nz/privacy-impact-assessments/creating-the-2018-census-dataset-by-combining-administrative-data-and-census-forms-data-our-privacy-considerations. |
[15] | Gath M, Bycroft C. The potential for linked admin data to provide household and family information. Stats NZ [Internet]. (2018) . Available from https://www.stats.govt.nz/research/the-potential-for-linked-administrative-data-to-provide-household-and-family-information. |
[16] | Stats NZ. Overview of statistical methods for adding administrative records to the 2018 Census dataset. Stats NZ [Internet]. (2019) . Available from https://www.stats.govt.nz/methods/overview-of-statistical-methods-for-adding-admin-records-to-the-2018-census-dataset. |
[17] | Stats NZ. Linking 2018 Census responses to the Integrated Data Infrastructure. Stats NZ [Internet]. (2019) . Available from https://www.stats.govt.nz/methods/linking-2018-census-respondents-to-the-integrated-data-infrastructure. |
[18] | Stats NZ. Predicting the quality of admin location information for use in the 2018 Census. Stats NZ [Internet]. (2019) . Available from https://www.stats.govt.nz/methods/predicting-the-quality-of-admin-location-information-for-use-in-the-2018-census-2. |
[19] | Stats NZ. Dual system estimation combining census responses and an admin population. Stats NZ [Internet]. (2019) . Available from https://www.stats.govt.nz/methods/dual-system-estimation-combining-census-responses-and-an-admin-population. |


