
The French rolling census: A census that allows a progressive modernization
Abstract
The census method in France has changed since 2004 from a traditional decennial census to a rolling census. For 15 years, the rolling census has been providing, each year, results at municipal and infra-municipal levels with a non-response rate remaining very low (under 4% of the households). During these years, many changes occurred: questionnaires, introduction of an internet response mode, changes in the protocol.
It turned out that the existence of an annual survey of 9 million people is a chance to implement large tests in real context before making a decision. Thus, Insee tested during four years the internet response mode, which guarenteed the success of the project by optimizing the response time and the robustness of the internet questionnaire. Today, four years after the generalization, 60% of people answer by internet. Moreover, the existence of an annual census survey is a chance to assess a collection mode effect: Insee measured that the introduction of internet did not affect most of the variables (except maybe the measure of employment). However, the last change of questionnaire in 2018 did have an effect on the counting of the population, which could be estimated thanks to the annual census surveys.
1.Introduction
The census method in France has changed since 2004 from a traditional census to a rolling census. For 15 years, the French National Institute of Statistics and Economic Sudies (Insee) has been successfully conducting an annual census survey of 9 million people. During this period, the census had to adapt and modernize.
The new methodology allowed various changes: modification of the questionnaire to take into account European or user requests, modernization with the introduction of the Internet response, evolution of collection protocols to improve efficiency. Almost every year, Insee introduces changes while continuing to produce annually populations and statistical results.
This article presents how these major changes were introduced and what were the effects by examining the advantages and disadvantages of an annual census compared to a traditional census.
2.Presentation of the rolling census in France
Since 2004, France has moved from a traditional census to a rolling census. The law n
The population census is also used to learn about France’s diverse and changing population. Since 2009, it provides each year statistics on the inhabitants and their characteristics at the municipal level but also at a lower level of around 2 000 inhabitants: composition by age and sex, occupation, housing conditions, means of transportation, commuting to work or to study, etc.
These results are used by the administrative and local authorities to improve public facilities such as schools, sport facilities, public transport etc. The companies and associations also use them to improve knowledge of the people living in a particular place.
Since 2004, an annual population census survey is, by law, conducted in cooperation with each municipality: the process is managed and controlled by the French statistical office (Insee) but the data collection is carried out by the municipalities which hire the enumerators and manage the field survey.
Each year, 8 000 municipalities are involved in the annual census survey:
• 1 000 municipalities of more than 10 000 inhabitants: in these municipalities, a survey of 8% of the dwellings occurs each year. It is achieved through a register of localized buildings, which is exhaustive and updated all along the year in cooperation with municipalities;
• 7 000 municipalities of less than 10 000 inhabitants where a full census enumeration of the population takes place. They represent one fifth of these municipalities because each municipality of less than 10 000 inhabitants is concerned one year out of five.
Each year, during 4 to 5 weeks (from mid-January to mid-February), 5 million dwellings and 9 million inhabitants are surveyed for the census. From 2004 to 2015, the census was conducted using the same method:
• 24 000 enumerators are hired all over the country to visit people at home and give them paper questionnaires: one for the household with 15 questions concerning the house or apartment and a table to list the permanent inhabitants according to the international definition; and a questionnaire for each person living in the housing unit with 25 questions concerning age, nationality, place of birth, education, occupation, etc.
• The enumerators come back a few days later to collect the completed questionnaires.
• These enumerators are supervised by 10 000 managers who are also employed by the municipalities.
It is compulsory to answer to the census and municipalities can impose a 38 euros fine to people who refuse to answer. However, penalties are not often applied as emphasis is put on the fact that answering to the census is a civil act, which is important for the municipalities to help them to take good decisions for public policies. In addition, it does not take much time (about 5 minutes for a questionnaire). Thanks to a strong communication campaign before and during the census period, the response rate stays at a high level: it was of 96.1% in 2019.
Then, each year, data collected during the last five years are compiled to produce updated population estimate of each municipality of France and detailed characteristics of population and housings for all geographic levels. The population calculated for the 1st January 2016 (the median year of the 5-year cycle) is based on the data collected from 2014 to 2018. It is released in January 2019. The method for producing these estimations varies with the size of the municipalities.
For municipalities over 10 000 inhabitants, the population is measured by multiplying the number of dwellings present in the register of localized buildings (which is exhaustive) on the 1
For municipalities under 10 000 inhabitants, the calculations use additional information as trends observed in administrative sources such as the housing tax file that keeps records of all residential dwellings occupied or not [1].
More precisely, for the small municipalities completely enumerated in 2016, the population is the direct result of the census survey. For those enumerated in 2014 and 2015, population estimates are updated to the common reference date 2016 thanks to the housing tax data. The number of dwellings is updated by applying the evolution rate measured in the housing tax file to the number of dwellings enumerated in the last census; the average number of inhabitants is updated applying the past trend to the new year(s).
Finally, for municipalities surveyed in 2017 or 2018, the population estimate is the result of an interpolation between the last official population number in 2015 and the result of the new complete enumeration, which is already available (since these calculations occurred in 2018).
As pointed out by Brown and Beaujean [2], this creates the database for all small municipalities with a reference date 2016: 20% is a direct enumeration; 40% is extrapolated forward from the previous two years of collections using the housing tax file; 40% is interpolated backwards from the subsequent two years of collection.
In 2011, Jean-Michel Durr and François Clanché pointed out that “the new French census reached most of its goals and publishes good quality results every year” [3].
3.A census method that allows the introduction of different modernizations
This annual census also allows a true control of the process, enabling the funding of improvements over successive years[4].
3.1Change in the questionnaires: Advantages and inconveniences of a rolling census
In 2019, France has achieved its 16
The first change of questionnaire was in 2011 with the question related to the previous place of residence. From 2004 to 2010, the period of observation was a period of 5 years. Thus, the question was related to the place of residence five years before. To be in line with the European regulation n
In 2015, there has been three more changes: one to adapt the diploma classification to the European recommendations. The other was to split one transport modality of commuting which used to mix together motorbikes and bikes into two different modalities. The third one modified the question on the relationship within the couple to move from a legal marital status to a “de facto conjugal status”.
Finally, in 2018, there was a big change in the questionnaire to meet our users’ needs, as expressed in a report of the National Council for Statistical Information (CNIS). The request was to describe in more detail the various family situations by asking the links between each pair of person living in the dwelling. This aimed at identifying composite families and children living only with one of their parents after a divorce. Before we used to ask only the relationships between the first person of the list and the other household members. The questionnaire has also been reviewed in order to facilitate the declaration of people who live in two different dwellings (for instance children who share their time between their two separated parents).
All these changes are possible with the rolling census method but, according to the methodology, we need to wait 5 years of annual census surveys with the new questions before being able to produce data at all geographical levels related to these new questions. Therefore, when we changed the question related to the mobility in 2011 we had to wait until June 2016 to have the proportion of people who had moved in a year for each municipality. Thus, between 2012 and 2016, we had no information at a municipal level on the movements within or between municipalities. Nevertheless, we can produce results faster on a national or regional level: we collect data each year on a sample of 5 million dwellings, which is representative at a national and regional level. Thus, we can produce estimations based on one-year data collection (or two years). That is what we did when we introduced the bicycle as a mean of commuting independent from motorbikes or when we change the question about marital status. We published results on a national and regional level with just one census survey.
The 2018 change is far more important because it has an effect on the number of inhabitants counted in France. With the previous questionnaire, we probably had double counts, in particular for children of divorced parents who share their time between their mother and their father’s dwelling. Thanks to the annual census collection, we are able to estimate the break in our series. The break in series being very low, it was difficult to measure it precisely from tests. The annual census thus allowed us to estimate this break quite precisely, based on the results of recent years. This would have been more difficult with a decennial census.
Figure 1.
A stronger decrease of the number of permanent residents with the new questionnaire implemented in 2018. Number of permanent residents – per 1,000 principal residences. Source: Insee – Annual census survey 2013–2018.
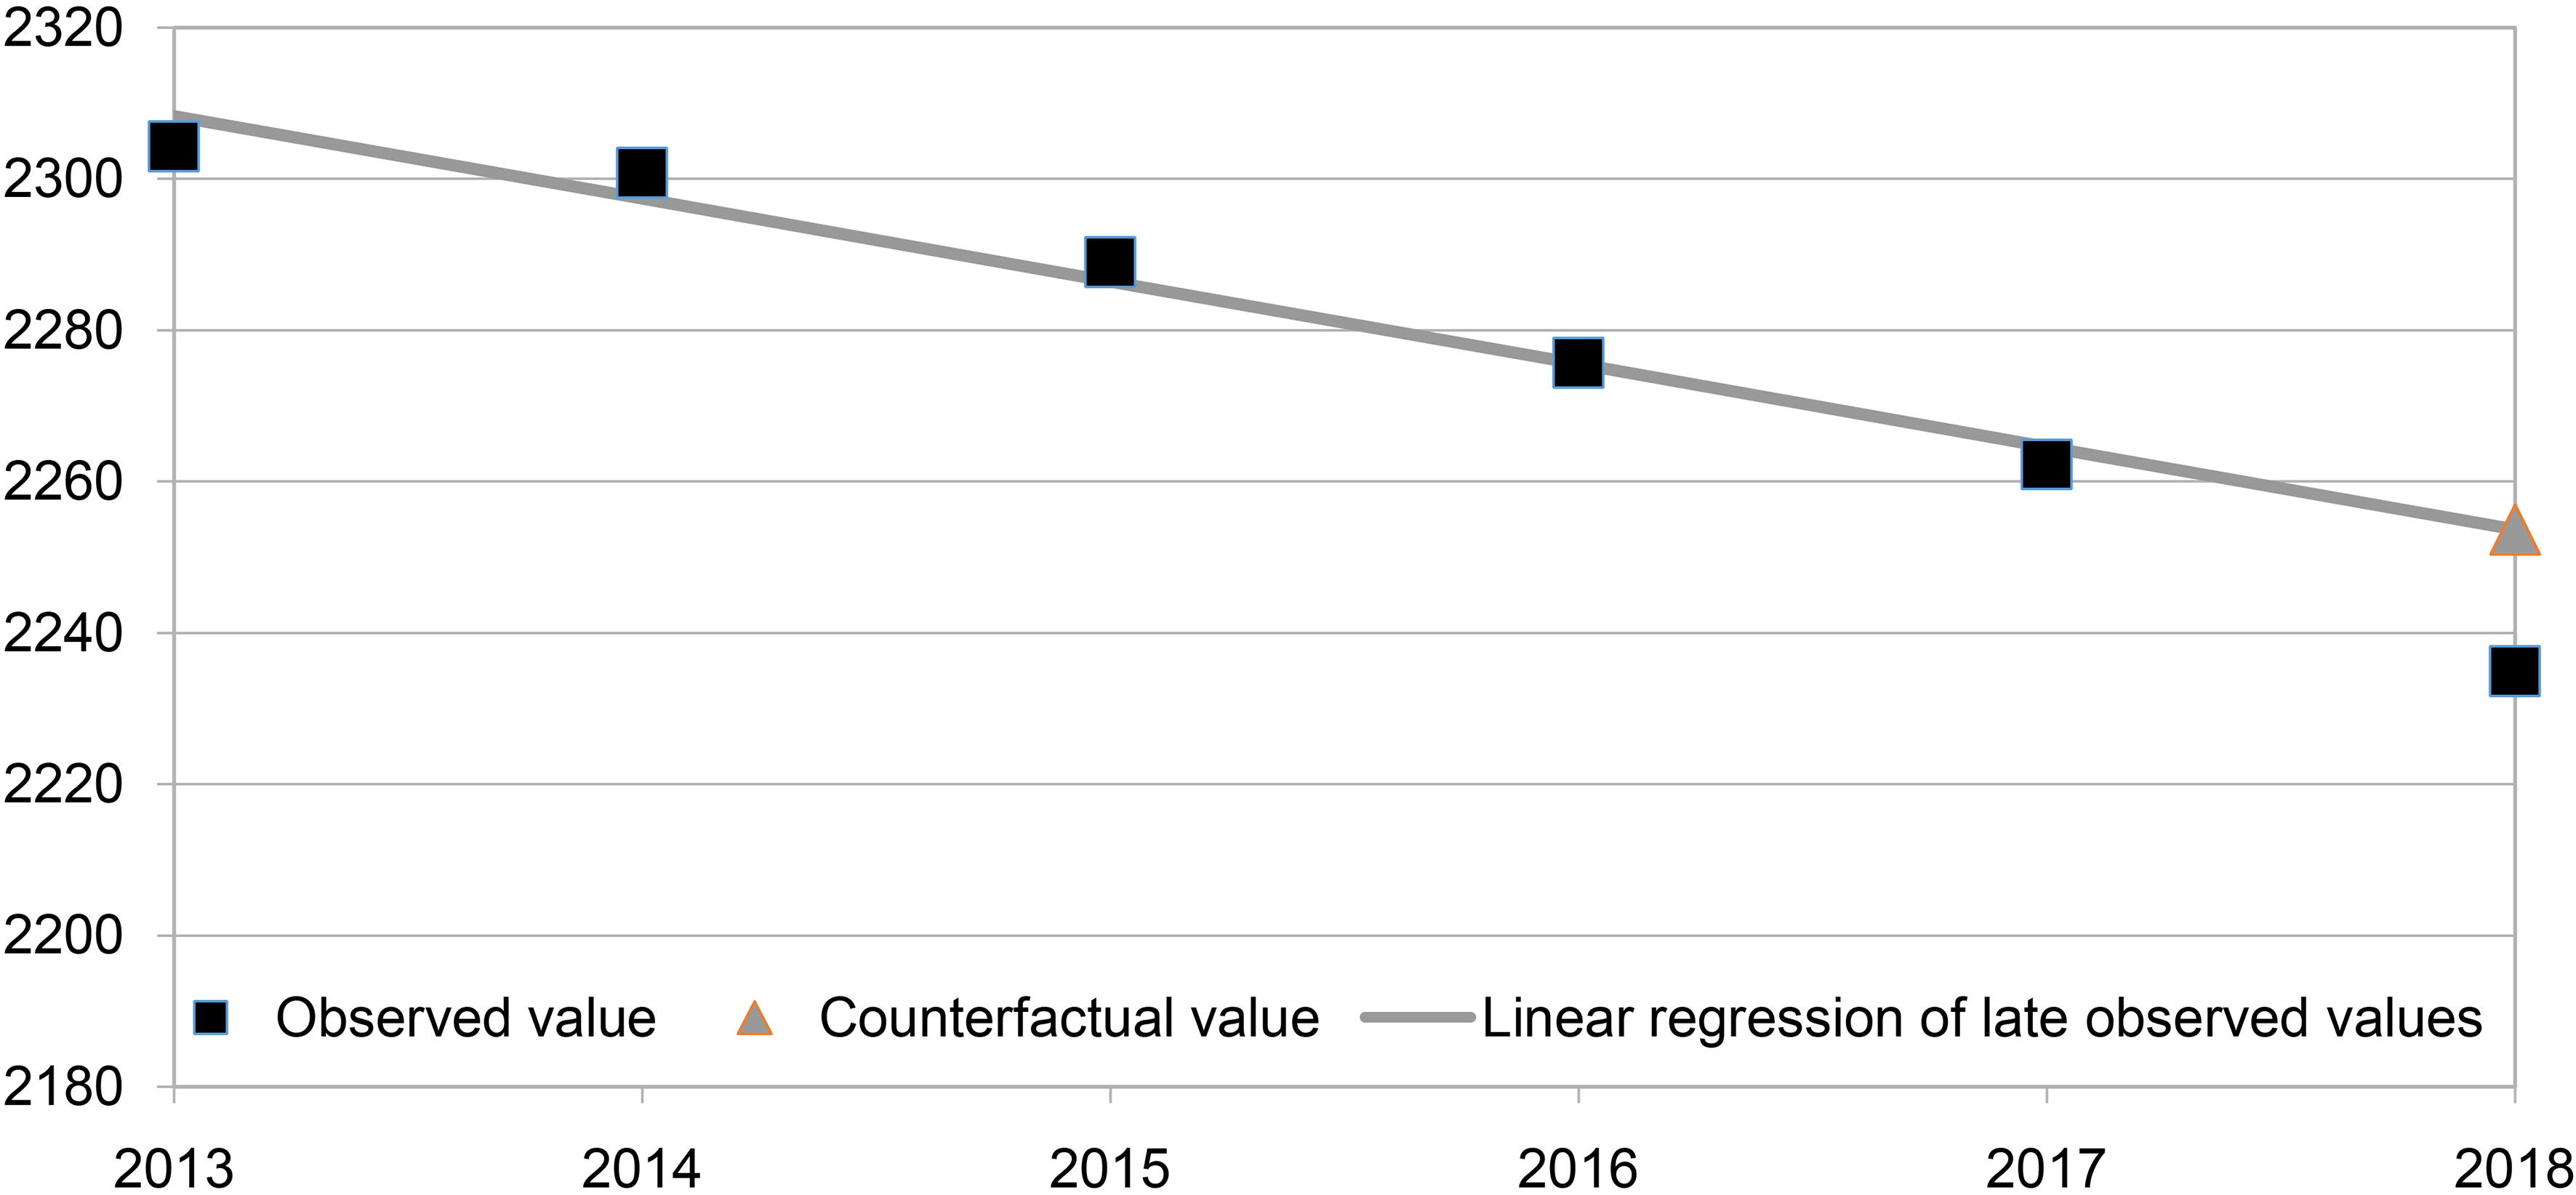
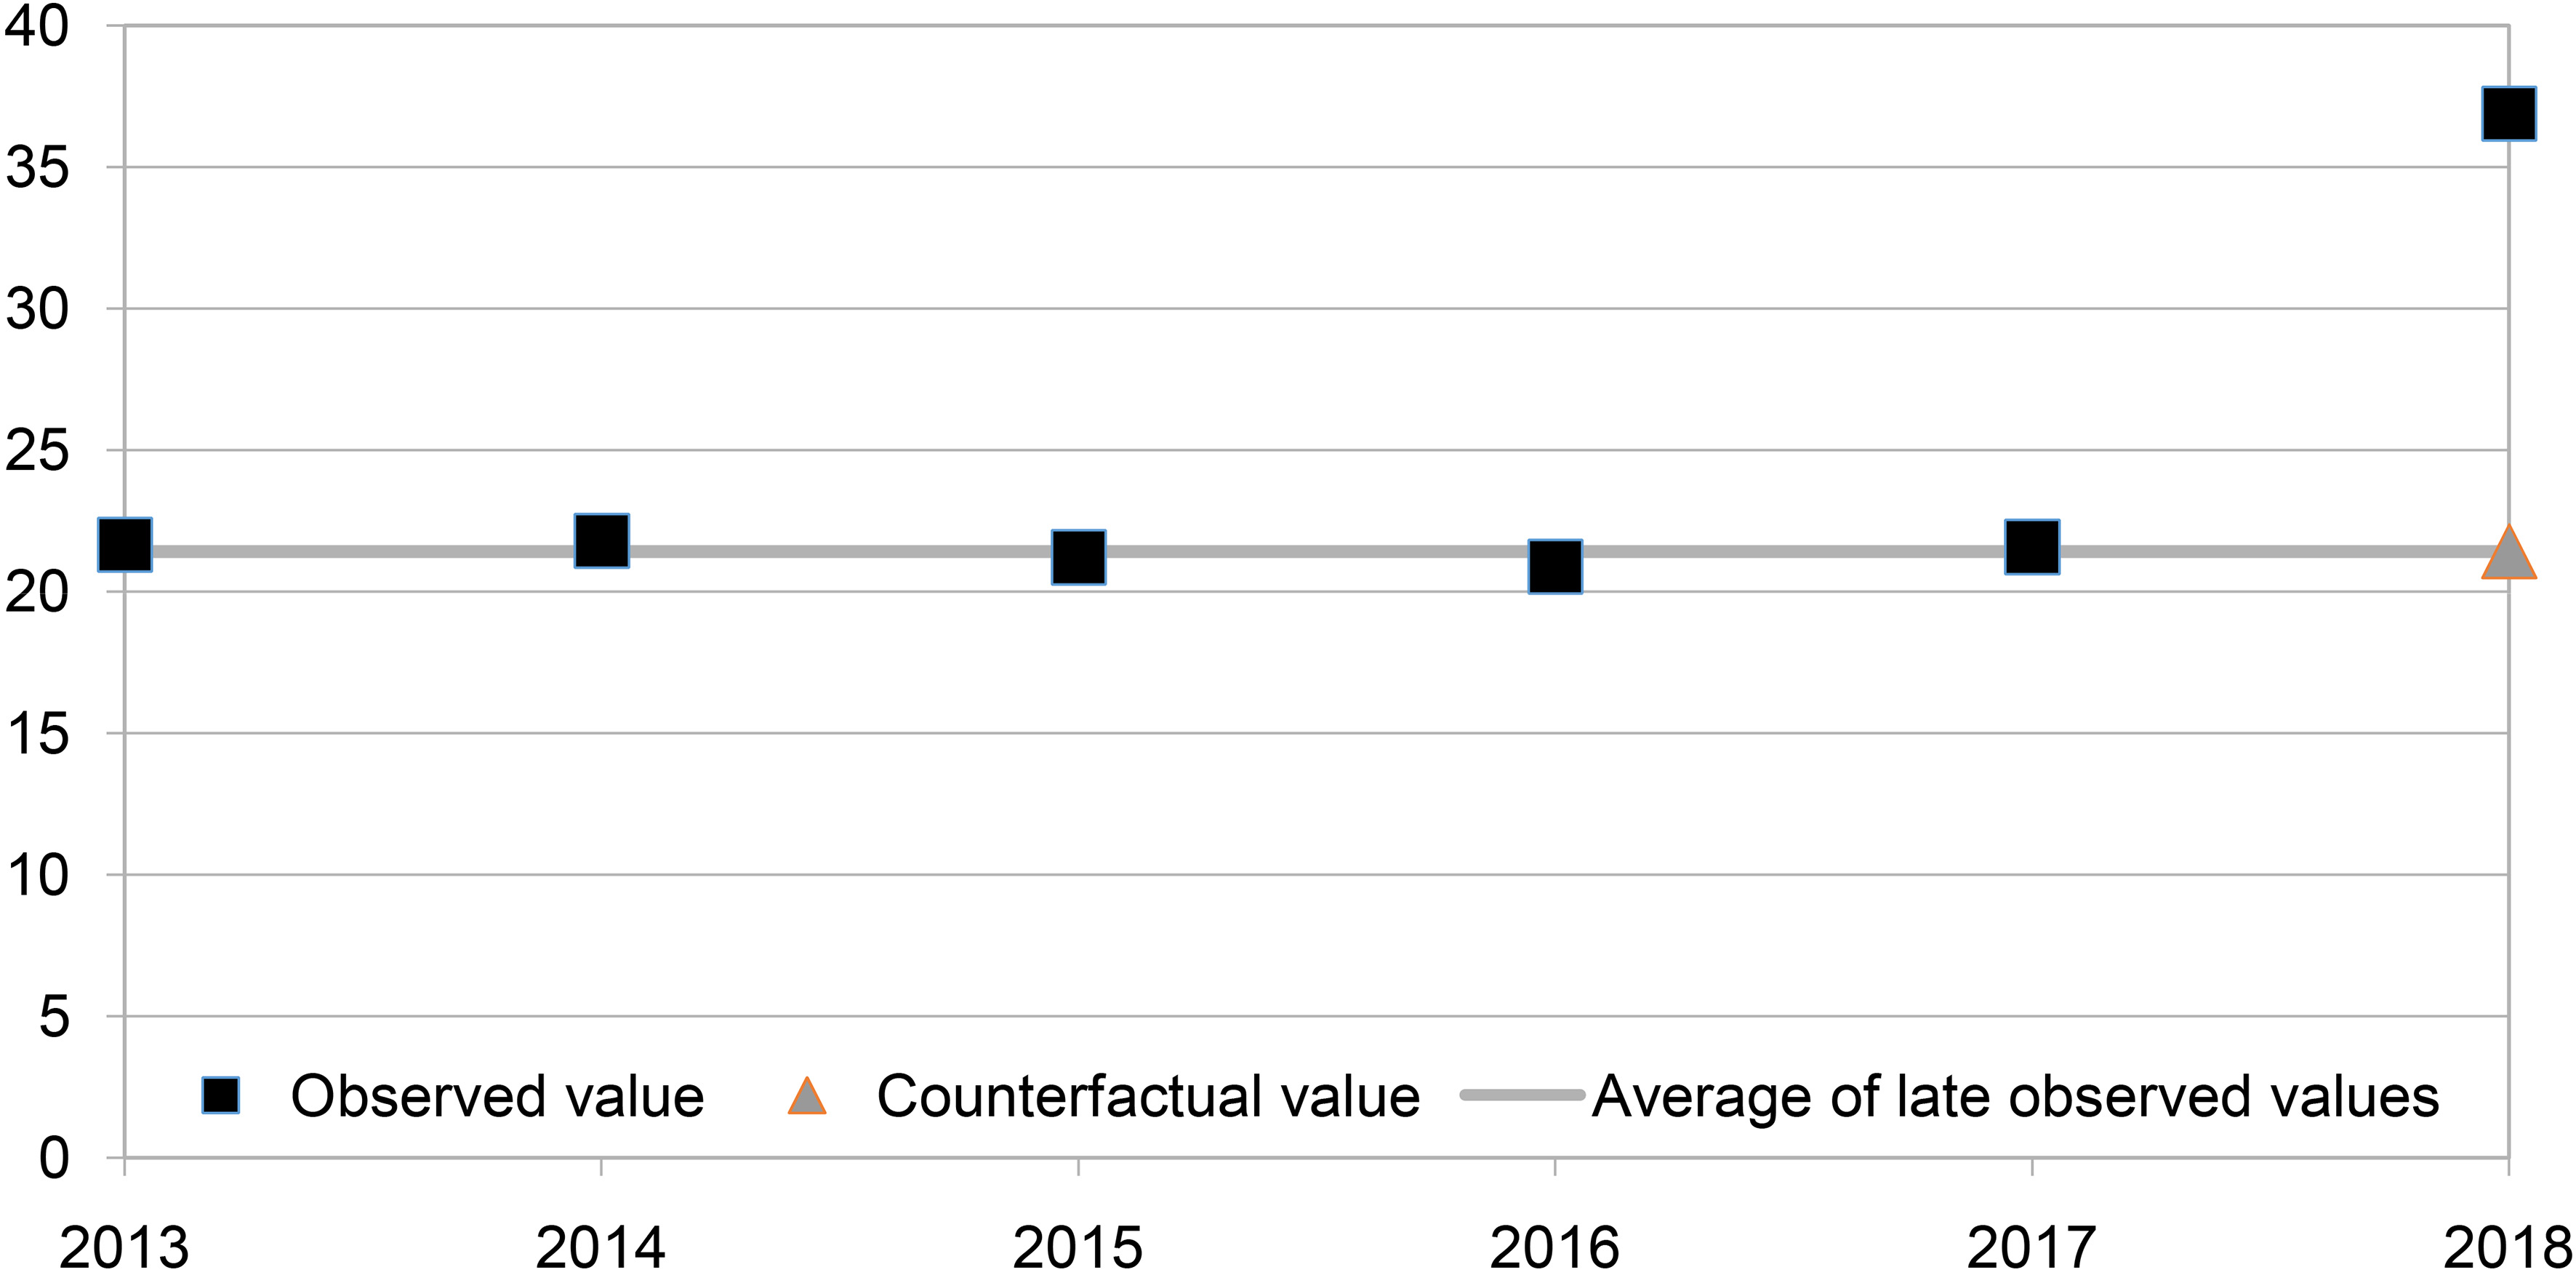
Figure 2.
Increase in the number of non-permanent inhabitants with the new questionnaire implemented in 2018. Number of people who declare themselves as multi-residents without being a permanent resident of the housing surveyed (excluding students) – per 1,000 principal residences. Source: Insee – Annual census survey 2013–2018.
Each year, France had an increase of its population measured by the census of around 310 000 persons; but, in 2018, we had a rise of only 171 000 persons because of the change in the questionnaire.
We measured that the number of permanent inhabitants declared was lower than expected with the new questionnaire (Fig. 1) whereas the number of non-permanent inhabitants was higher than usual. In addition, we noticed that the second curve was remarkably stable year after year before 2018 (Fig. 2).
We choose therefore to focus on the increase of the non-permanent inhabitants to estimate the effect of the change of questionnaire. This effect is estimated at 66 000 persons for the first year (and it represents 0.1% of the total population). With cumulative results over five years, the break in series will appear gradually. But after a complete cycle of five annual surveys, it will be around 500 000 persons (0.7% of the total population). The estimation based on the evolution of the number of permanent inhabitant is not far from this one but it is more dependent on the regression (and the period chosen for the regression) used to estimate the trend; so it appears less strong than the method we chose. This estimation was done with only one annual census survey with the new questionnaire (2018). It will be revised using two annual census surveys (2018 and 2019).
To conclude, it is possible with the rolling census to make changes in our census questionnaires. Nevertheless, since the method is based on a five years cycle, when a change is made, we have to wait 5 years of data collection before being able to produce results concerning the new questions at municipal level and lower. However, at national or regional level, we can produce results faster.
Nevertheless, this delay is an important feature of our rolling census to take into account.
On the other hand, annual census surveys allow to check the comparability of several data collections. It enables to assess more precisely the effects of a change in the methodology or in the questionnaire. With a decennial census, it would have been more difficult to assess the effect of the 2018 change, especially as in France, there is no other information on emigratory flows.
3.2Introduction of internet collection with preliminary relevant tests
At the beginning of the rolling census, from 2004 to 2010, there were only paper questionnaires given and picked up by the enumerators. In 2010, Insee launched a large project (called “Homere”) in order to introduce a bi-modal collection with the possibility to answer by internet. This project was achieved in 2015, with a new census protocol fully integrating the internet response.
3.2.1This ”Homere” project had three main goals
• The first one was to make the internet data collection possible. The aim was to propose the population the possibility to answer to the census either by internet or by paper. There were several objectives: to display an image of modernity for Insee; to improve census quality especially when the households are difficult to contact or by reducing the problems of legible handwriting; and to reduce the costs of the census.
• The second one was to upgrade the tools to monitor the progress of the collection by implementing a unique tool for Insee and municipalities (on internet) which takes into account both internet and paper responses.
• The third one was to review the control process at any stage of the process to make it more efficient.
3.2.2How?
The annual census is a real advantage for gradually introducing new methods while benefiting from preliminary tests. The complete move towards a bimodal data collection was done in 2015 but from 2011 to 2014, four consecutive tests were completed. The four annual census surveys from 2011 to 2014 were used for these tests.
The first test in 2011 concerned the particular census of the bargemen, which occurs every 5 years. The major aim was to test the internet questionnaire. For the first time, bargemen had the possibility to answer by internet using a login identifier and a password sent to them either by SMS or by email. There was also a communication campaign in the ports. The first results were quite encouraging: there was only 3% of the individual questionnaires without any answer and 2% with incomplete answers. Therefore, 95% of the internet questionnaires were complete which was better than the results observed on paper forms.
The pop-up containing an alert message when a question is missing was also tested for the first time with good results: answers did not seem to be less accurate.
The second test in 2012 concerned for the first time the households: the possibility to answer by internet was offered in 14 volunteer municipalities (out of 8 000 municipalities concerned by the census this year). The internet questionnaire was operational despite a few interruptions of service in particular on the first Sunday. In these municipalities, we reached an average rate of 18% of internet responses, which was quite high for a first test. This rate ranged from 9% to 36%.
Some ways for improvement were identified such as the response time, which had increased at the end of the census campaign or the need to give an acknowledgment of receipt. A satisfaction survey was conducted just after: 99% of the households responded that they would choose again the internet mode next time. However, some of them pointed out that they had some problems to access the questionnaire on the Internet. Enumerators were also quite satisfied with this new collection mode.
A post enumeration survey was conducted among 1000 households (500 who answered by internet and 500 who answered by paper) to check the errors related to the declaration of respondents. This survey concluded that the answers were as accurate on internet as on paper with the same number of omissions and double counts. The main omission concerned the persons who filled the forms and forgot to declare themselves.
The third test in 2013 was carried out with 43 volunteer municipalities. It was a real collection with internet and paper proposed to all inhabitants. The aim was also to test the tools used for the partnership between Insee and the municipalities, especially for the monitoring of data collection. The internet response reached 33% of the households with a record at 91% in a small municipality. This was again a successful test with some minor problems to solve. In 2014, 412 municipalities were involved this time, not all volunteers. And in 2015, the internet mode was implemented in every municipalities.
Figure 3.
A constant increase of the internet response rate of the households since the implementation of internet mode in 2015. Source: Insee – Annual census survey 2015–2019. Definition: The Internet response rate of the household refers the number of households that responded via the Internet to the total number of households surveyed.
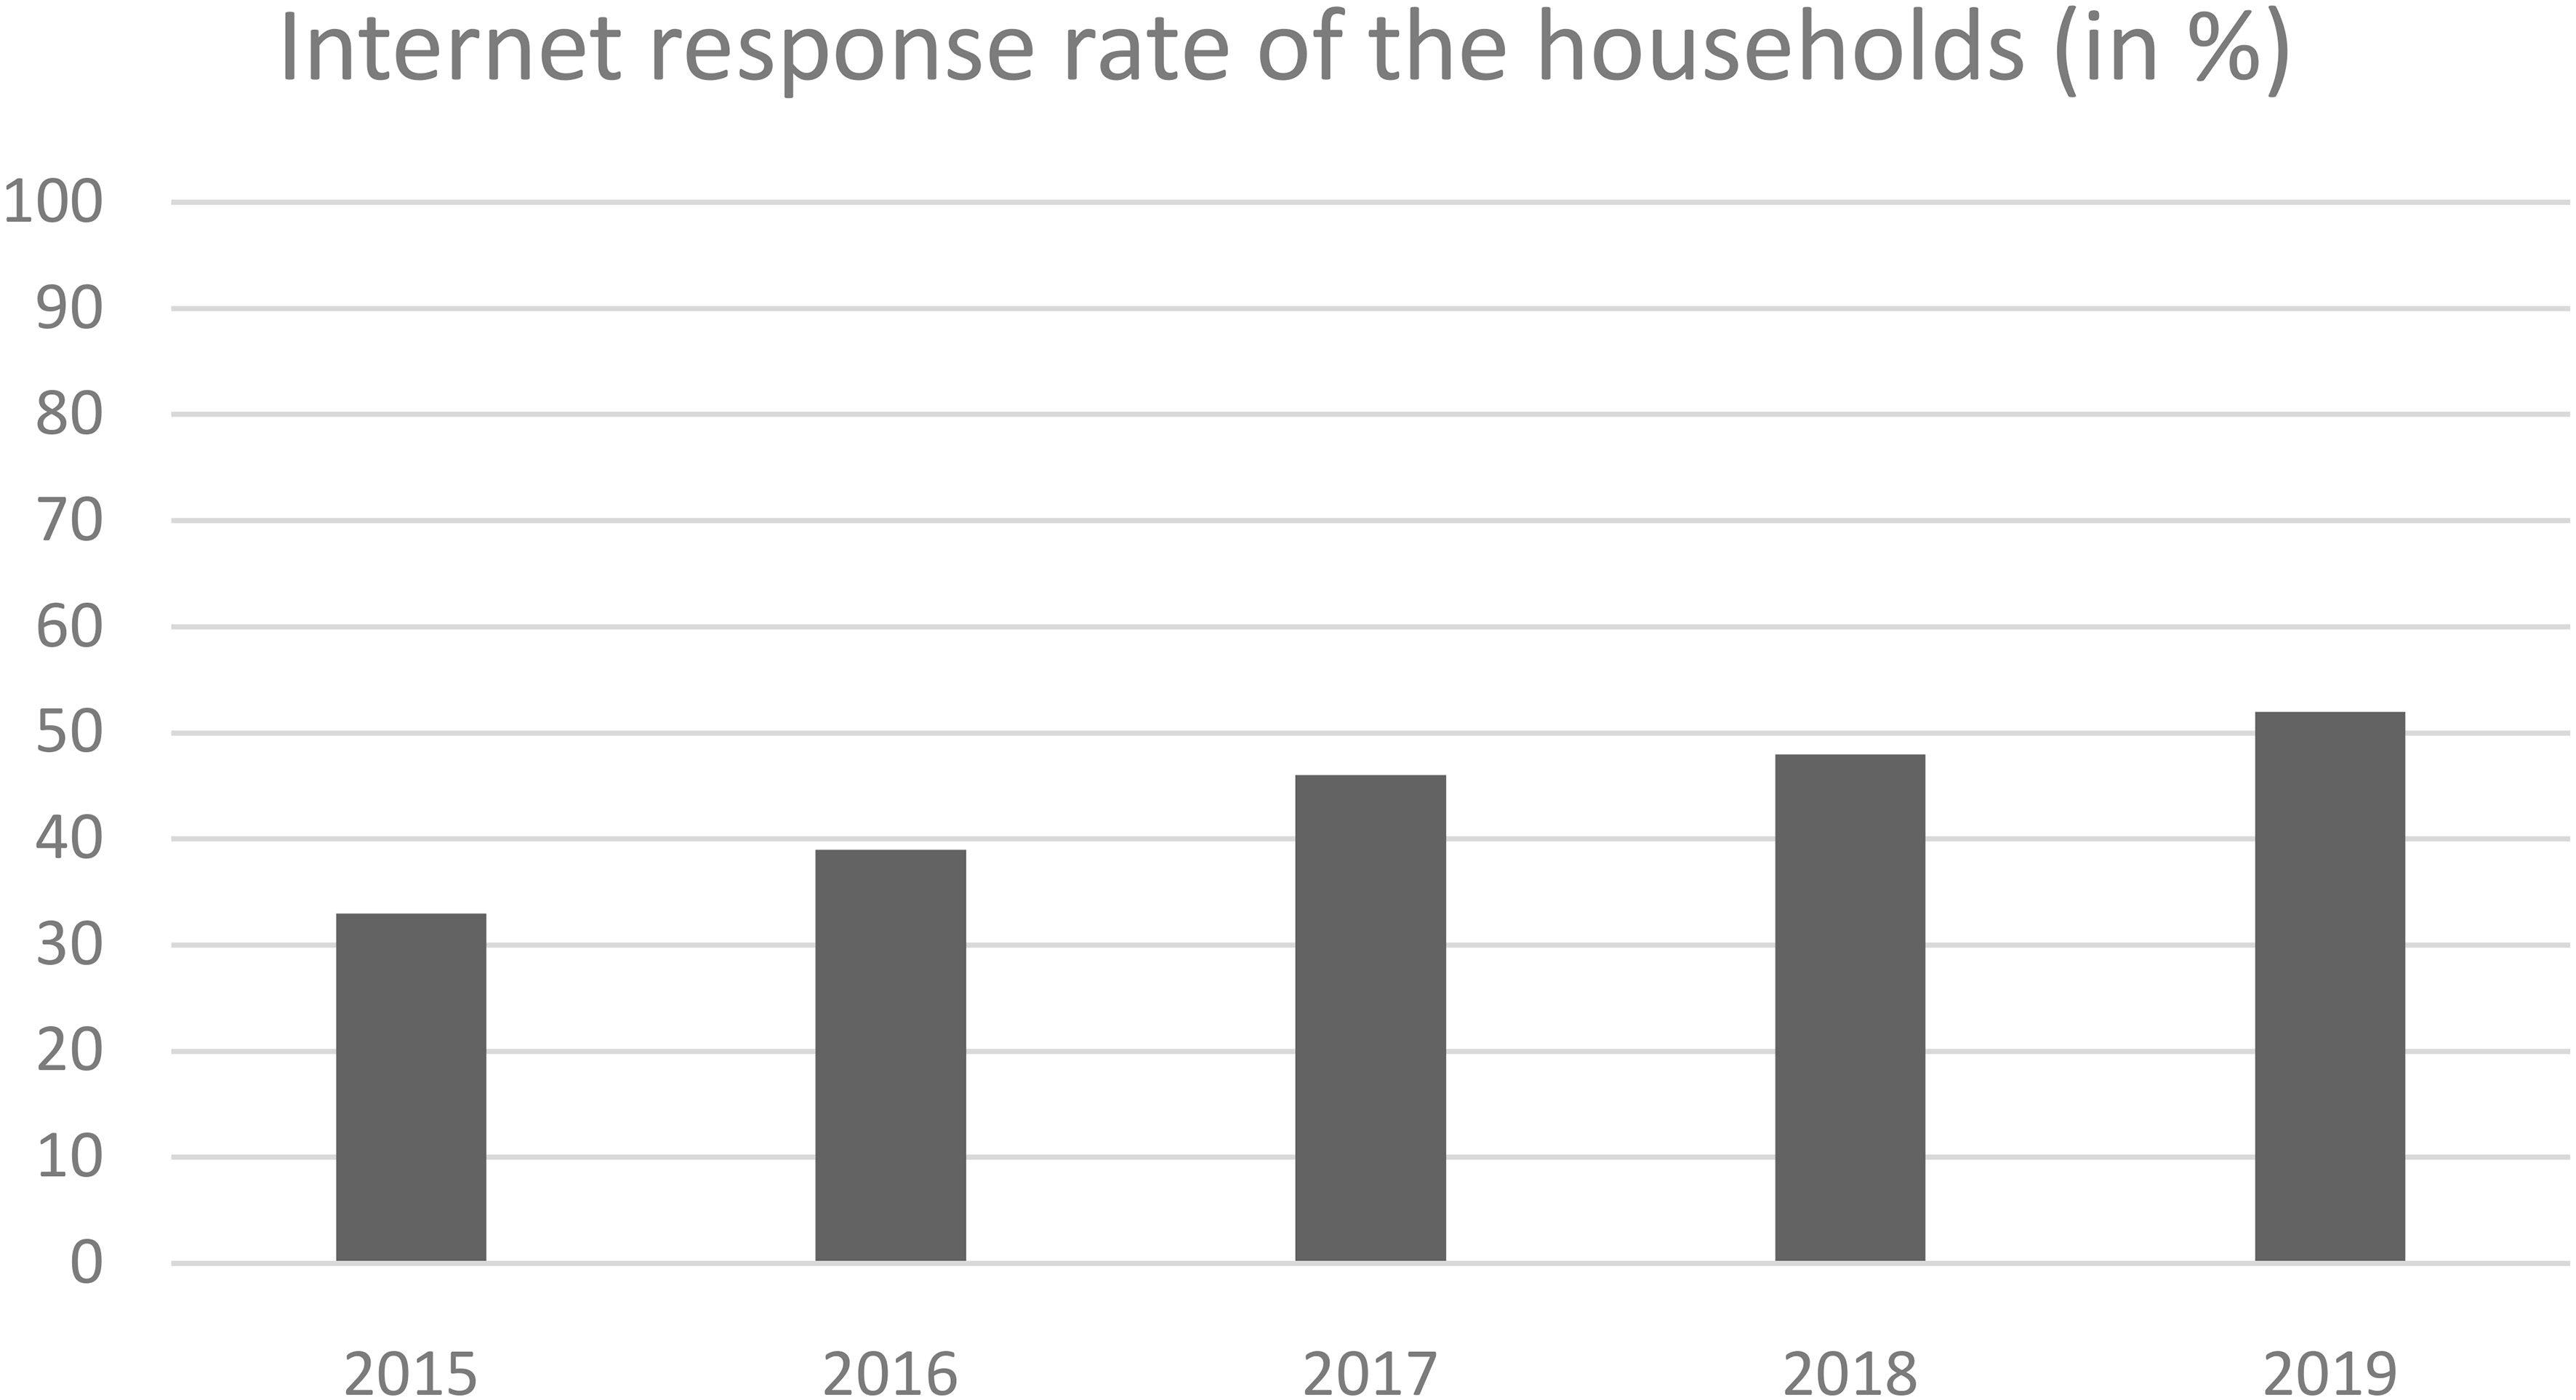
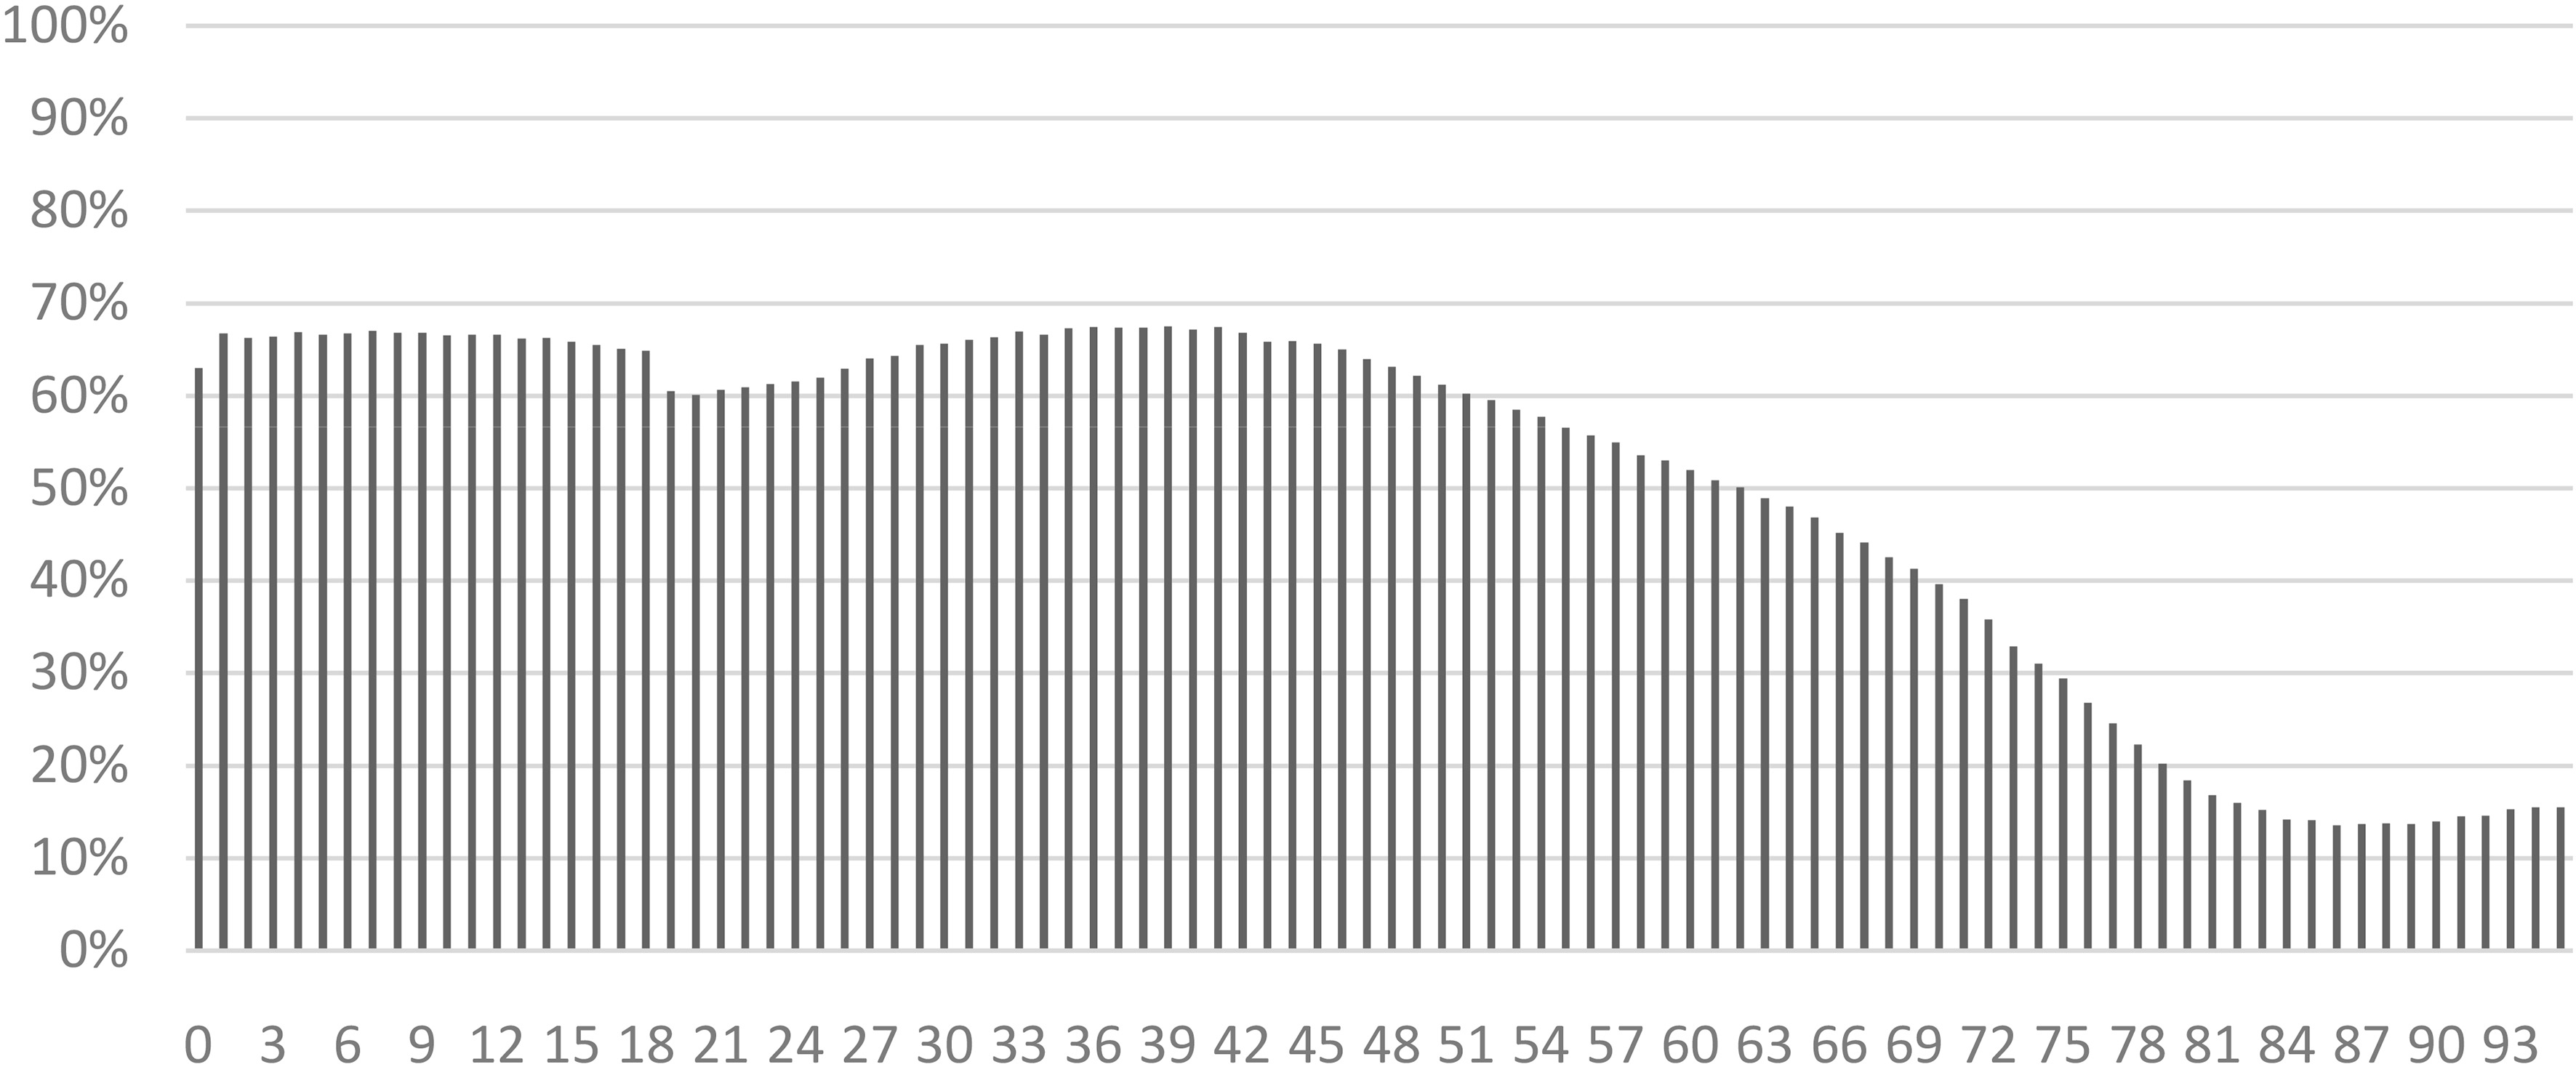
Figure 4.
Internet response rate in 2018 according to the age of the household reference person (%). Source: Insee – Annual census survey 2018. Definition: The Internet response rate of people with a particular characteristic refers the number of people of that characteristic who responded via Internet to the total number of people of that characteristic who answered to the census.
On the IT side, these tests made it possible to properly control load, performance and safety problems under real conditions and on much larger samples than in conventional tests. For example, it was possible to estimate the peak loads on the questionnaire.
As a result, Insee was able to optimize the response times of the Internet questionnaire by reworking developments (software) and the IT infrastructure (hardware).
Finally, the robustness of the questionnaire to very diverse situations and manipulations by thousands of users made it possible to detect and correct weak points or anomalies.
Finally, in such a project, having an annual rolling census provides real users. The project was able to rely on working groups involving these users (municipalities, supervisors, etc.), from design to deployment, including testing and training. Working with users is beneficial for any project because we benefit from the field experience, but it also facilitates the appropriation of the changes by the teams and thus facilitates the landing. This is far more difficult for decennial exhaustive censuses.
In 2019, we ran the 5
The response rate by internet is still increasing. In 2019, 52% of the households and 60% of the inhabitants responded by internet (Fig. 3). The quality of the census has remained with a stable non-response rate (around 3.9%).
The people who use the more internet are between 30 and 50 years old (Fig. 4). However, even between the ages of 60 and 70, there are still 40% of the households who choose the internet questionnaire. The more educated people answer more by internet than the less educated ones (Fig. 5). In addition, there is no difference according to the size of the municipalities. On the other hand, there are many differences between enumerators even in the same town: today, the major obstacle to the increase of internet answers is due to the reluctance of some enumerators who are not willing to change their habits.
Figure 5.
Internet response rate in 2018 according to the diploma of the household reference person (in%). Source: Insee – Annual census survey 2018.
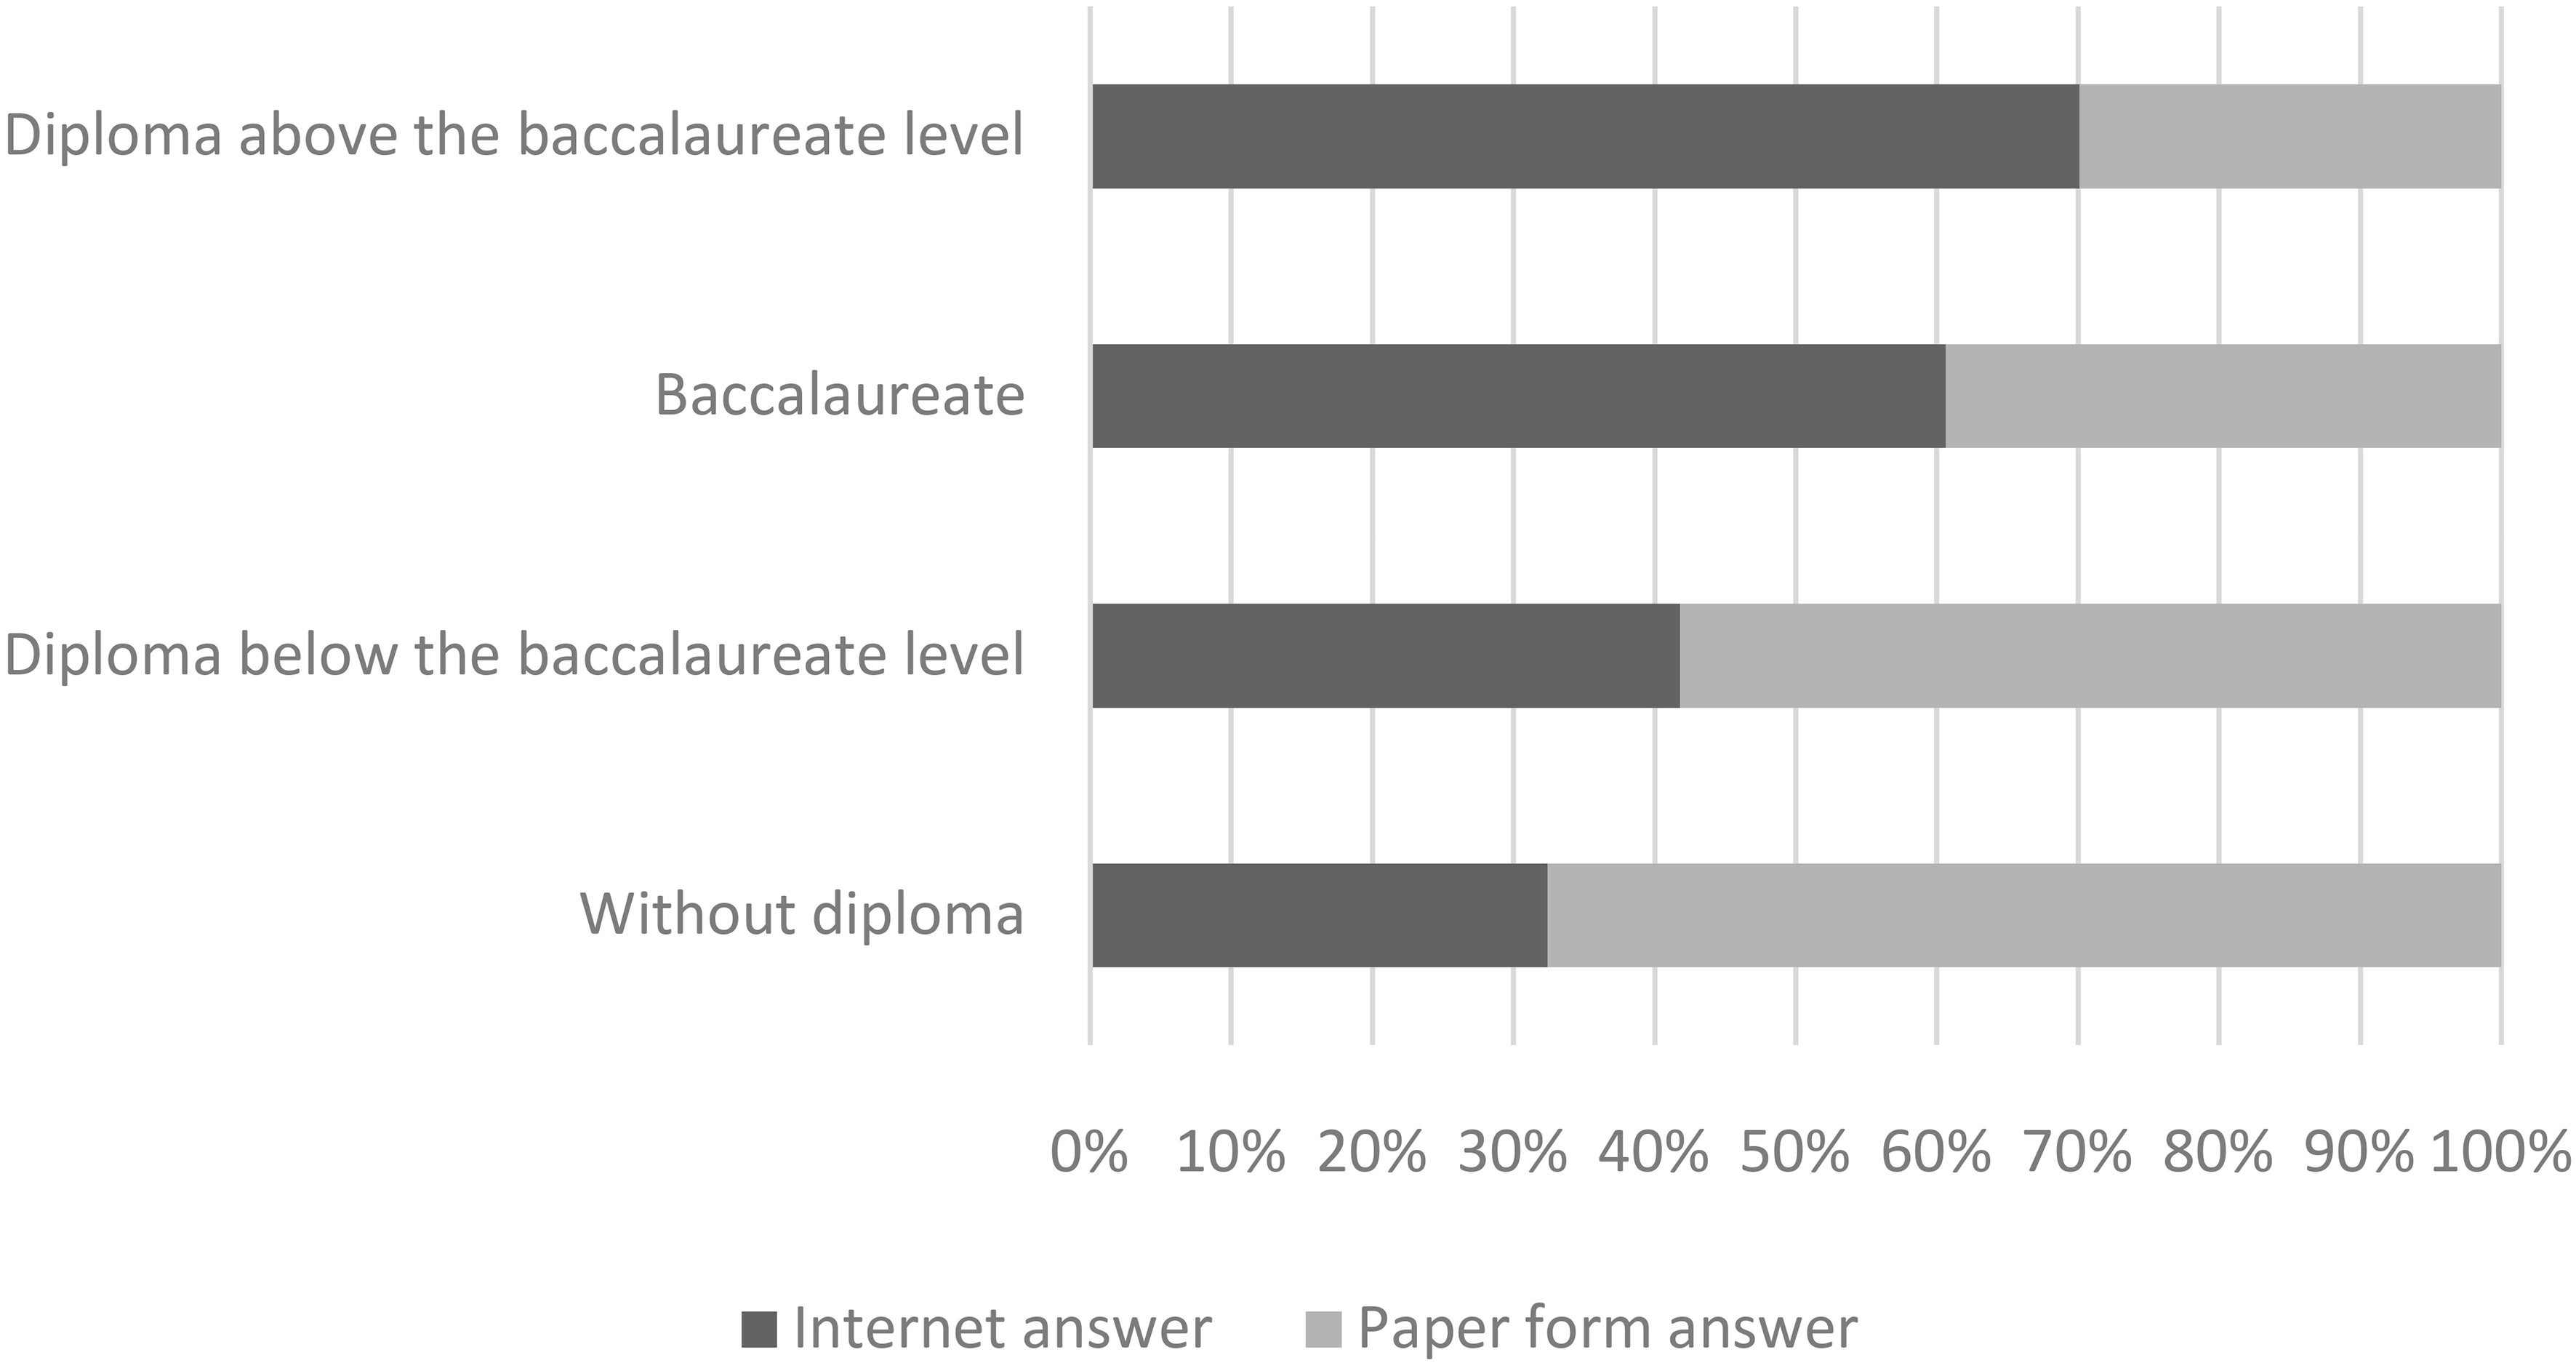
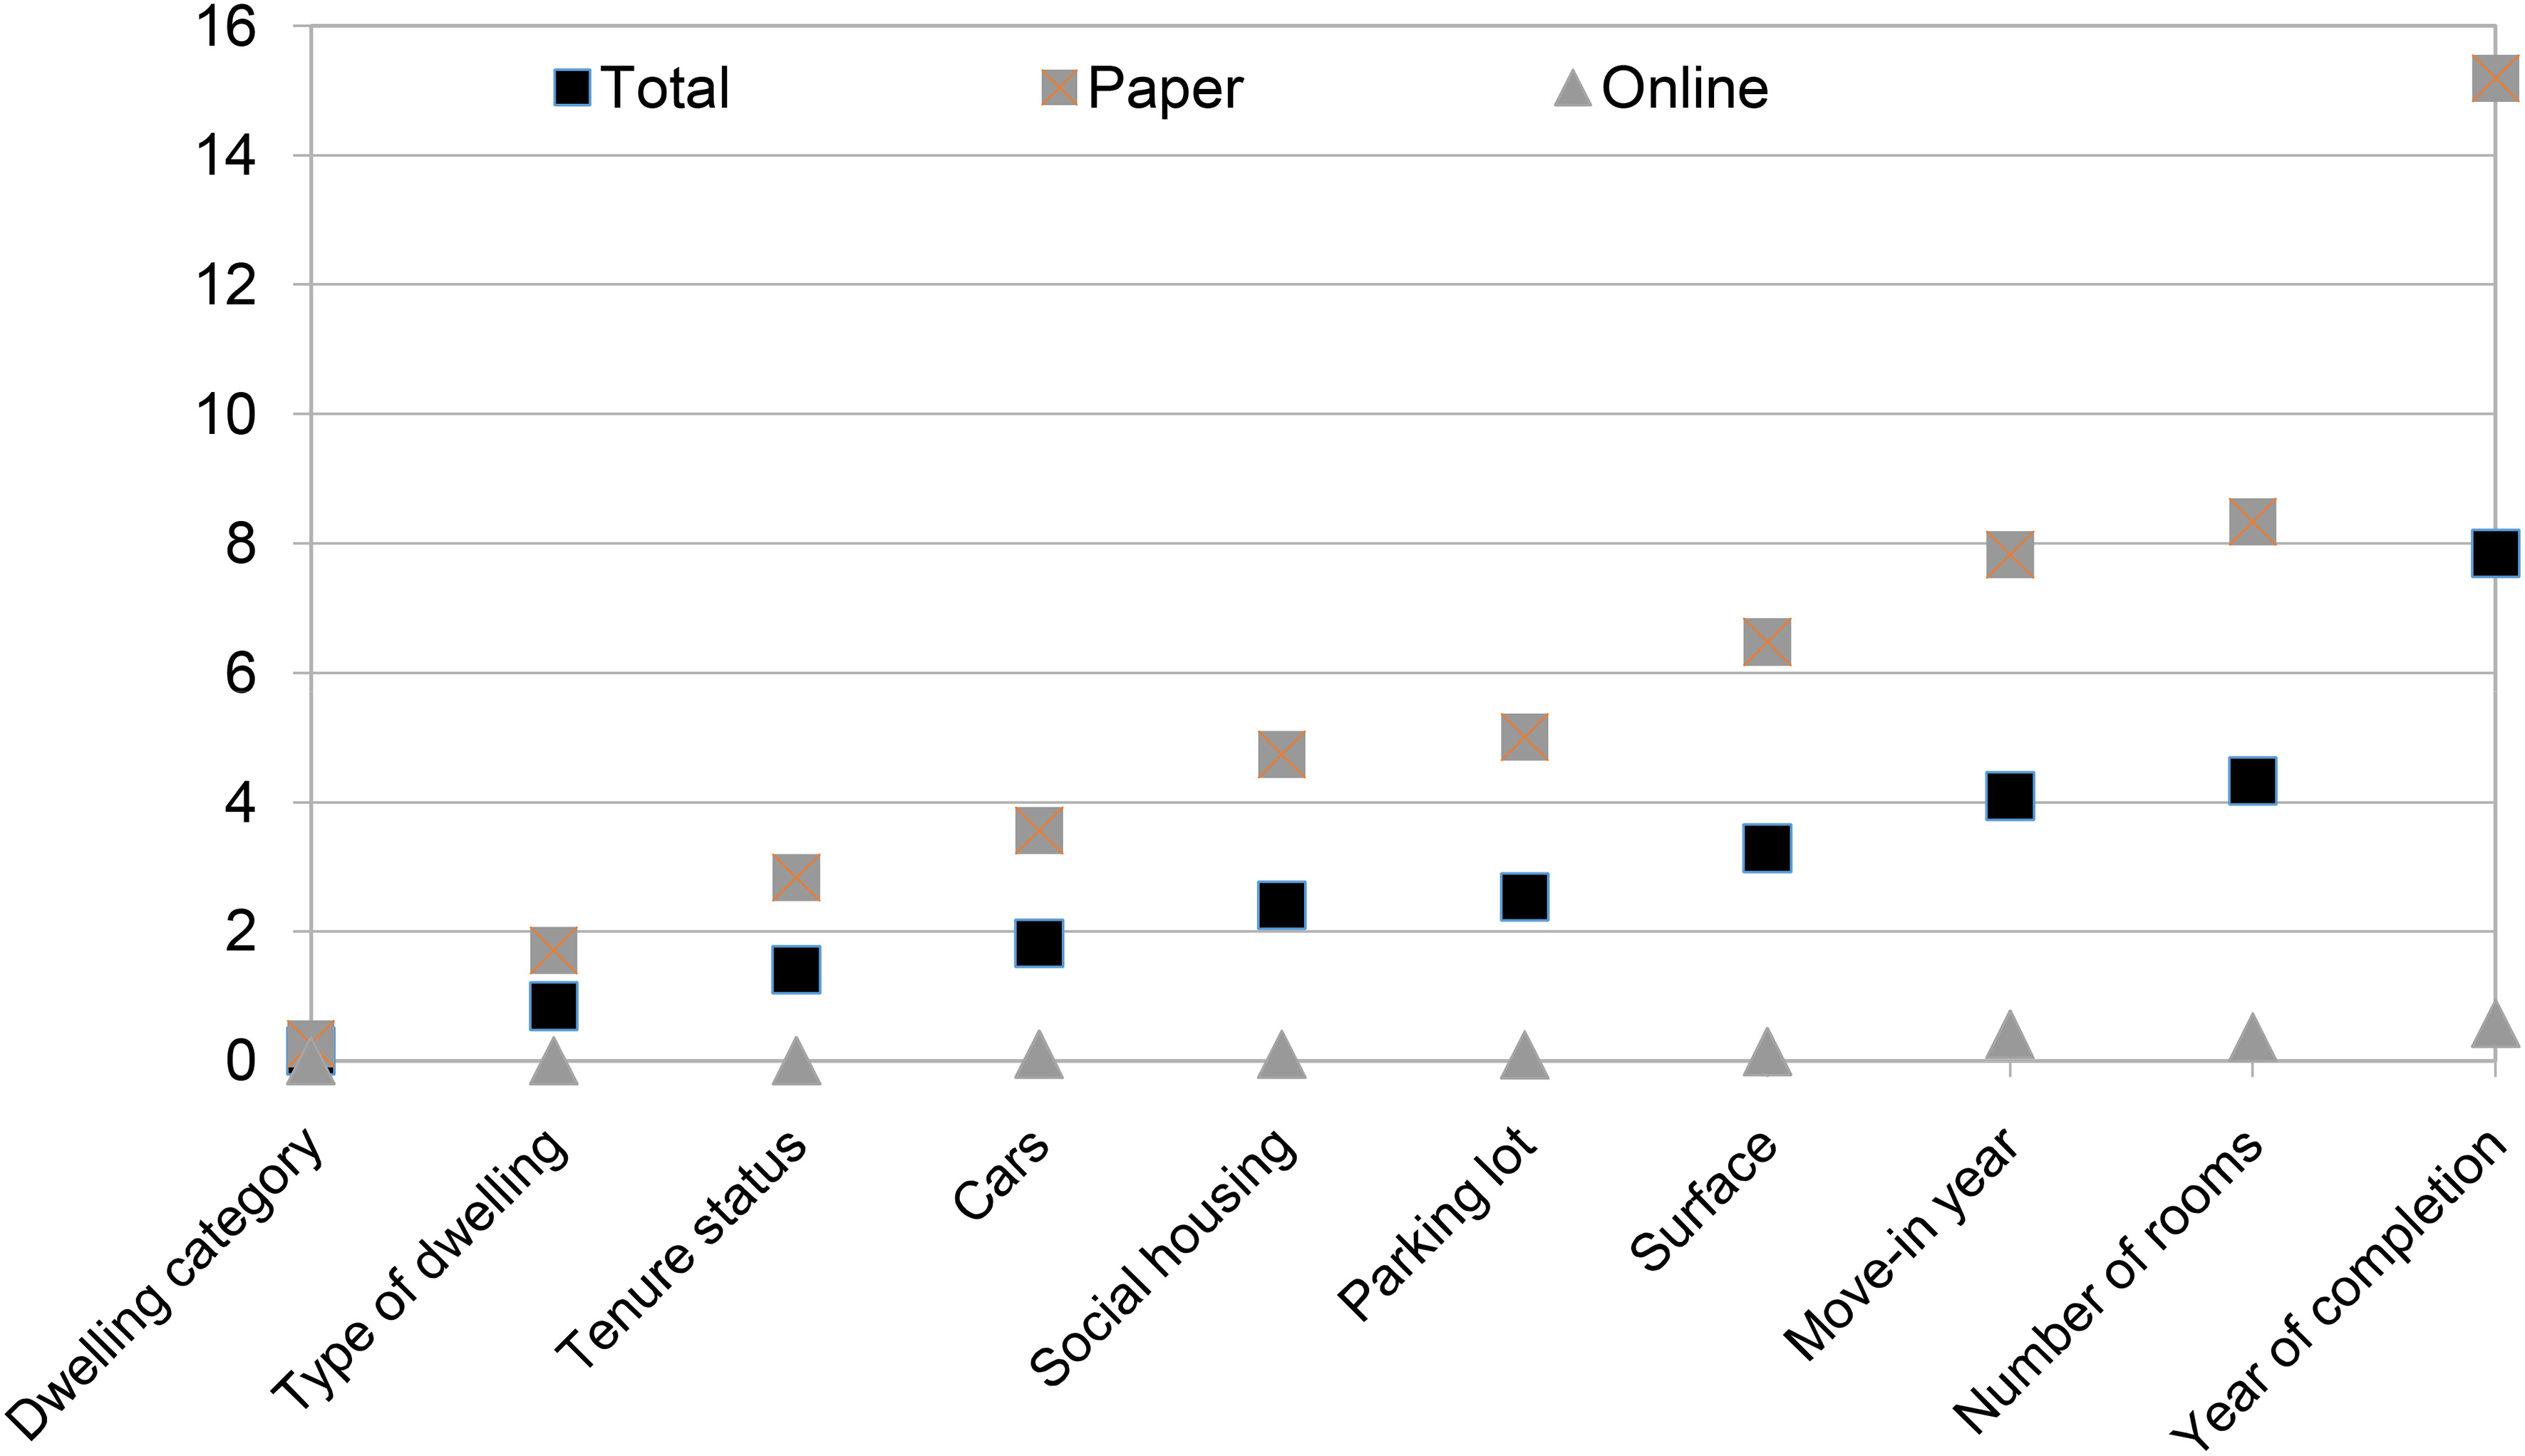
Figure 6.
Partial non-response rate by variables and response mode. Source: Insee – Annual census survey 2018
3.2.3Estimation of collection mode effects
The four years of tests allowed us to analyse the possible effects of the collection mode, between the internet response and the paper response.
The overall response rate remained stable before and after the introduction of the possibility to answer by internet. We found that there was no correlation between the response rate of the municipalities and the internet rate.
With regard to partial non-response, in 2015 a very sharp drop in rates was observed compared to previous years, and the levels reached were confirmed in 2016 and 2017. This gain is due to Internet respondents, for whom this rate is often less than 1% (Fig. 6). The first explanation is that on the Internet filters are more effective and people only see the questions that actually concern them. It is also linked to the pop-up warning messages for unanswered questions. Logically, this decrease in the partial non-response rate is accompanied by a reduced need for data imputation, and thus an improvement in quality.
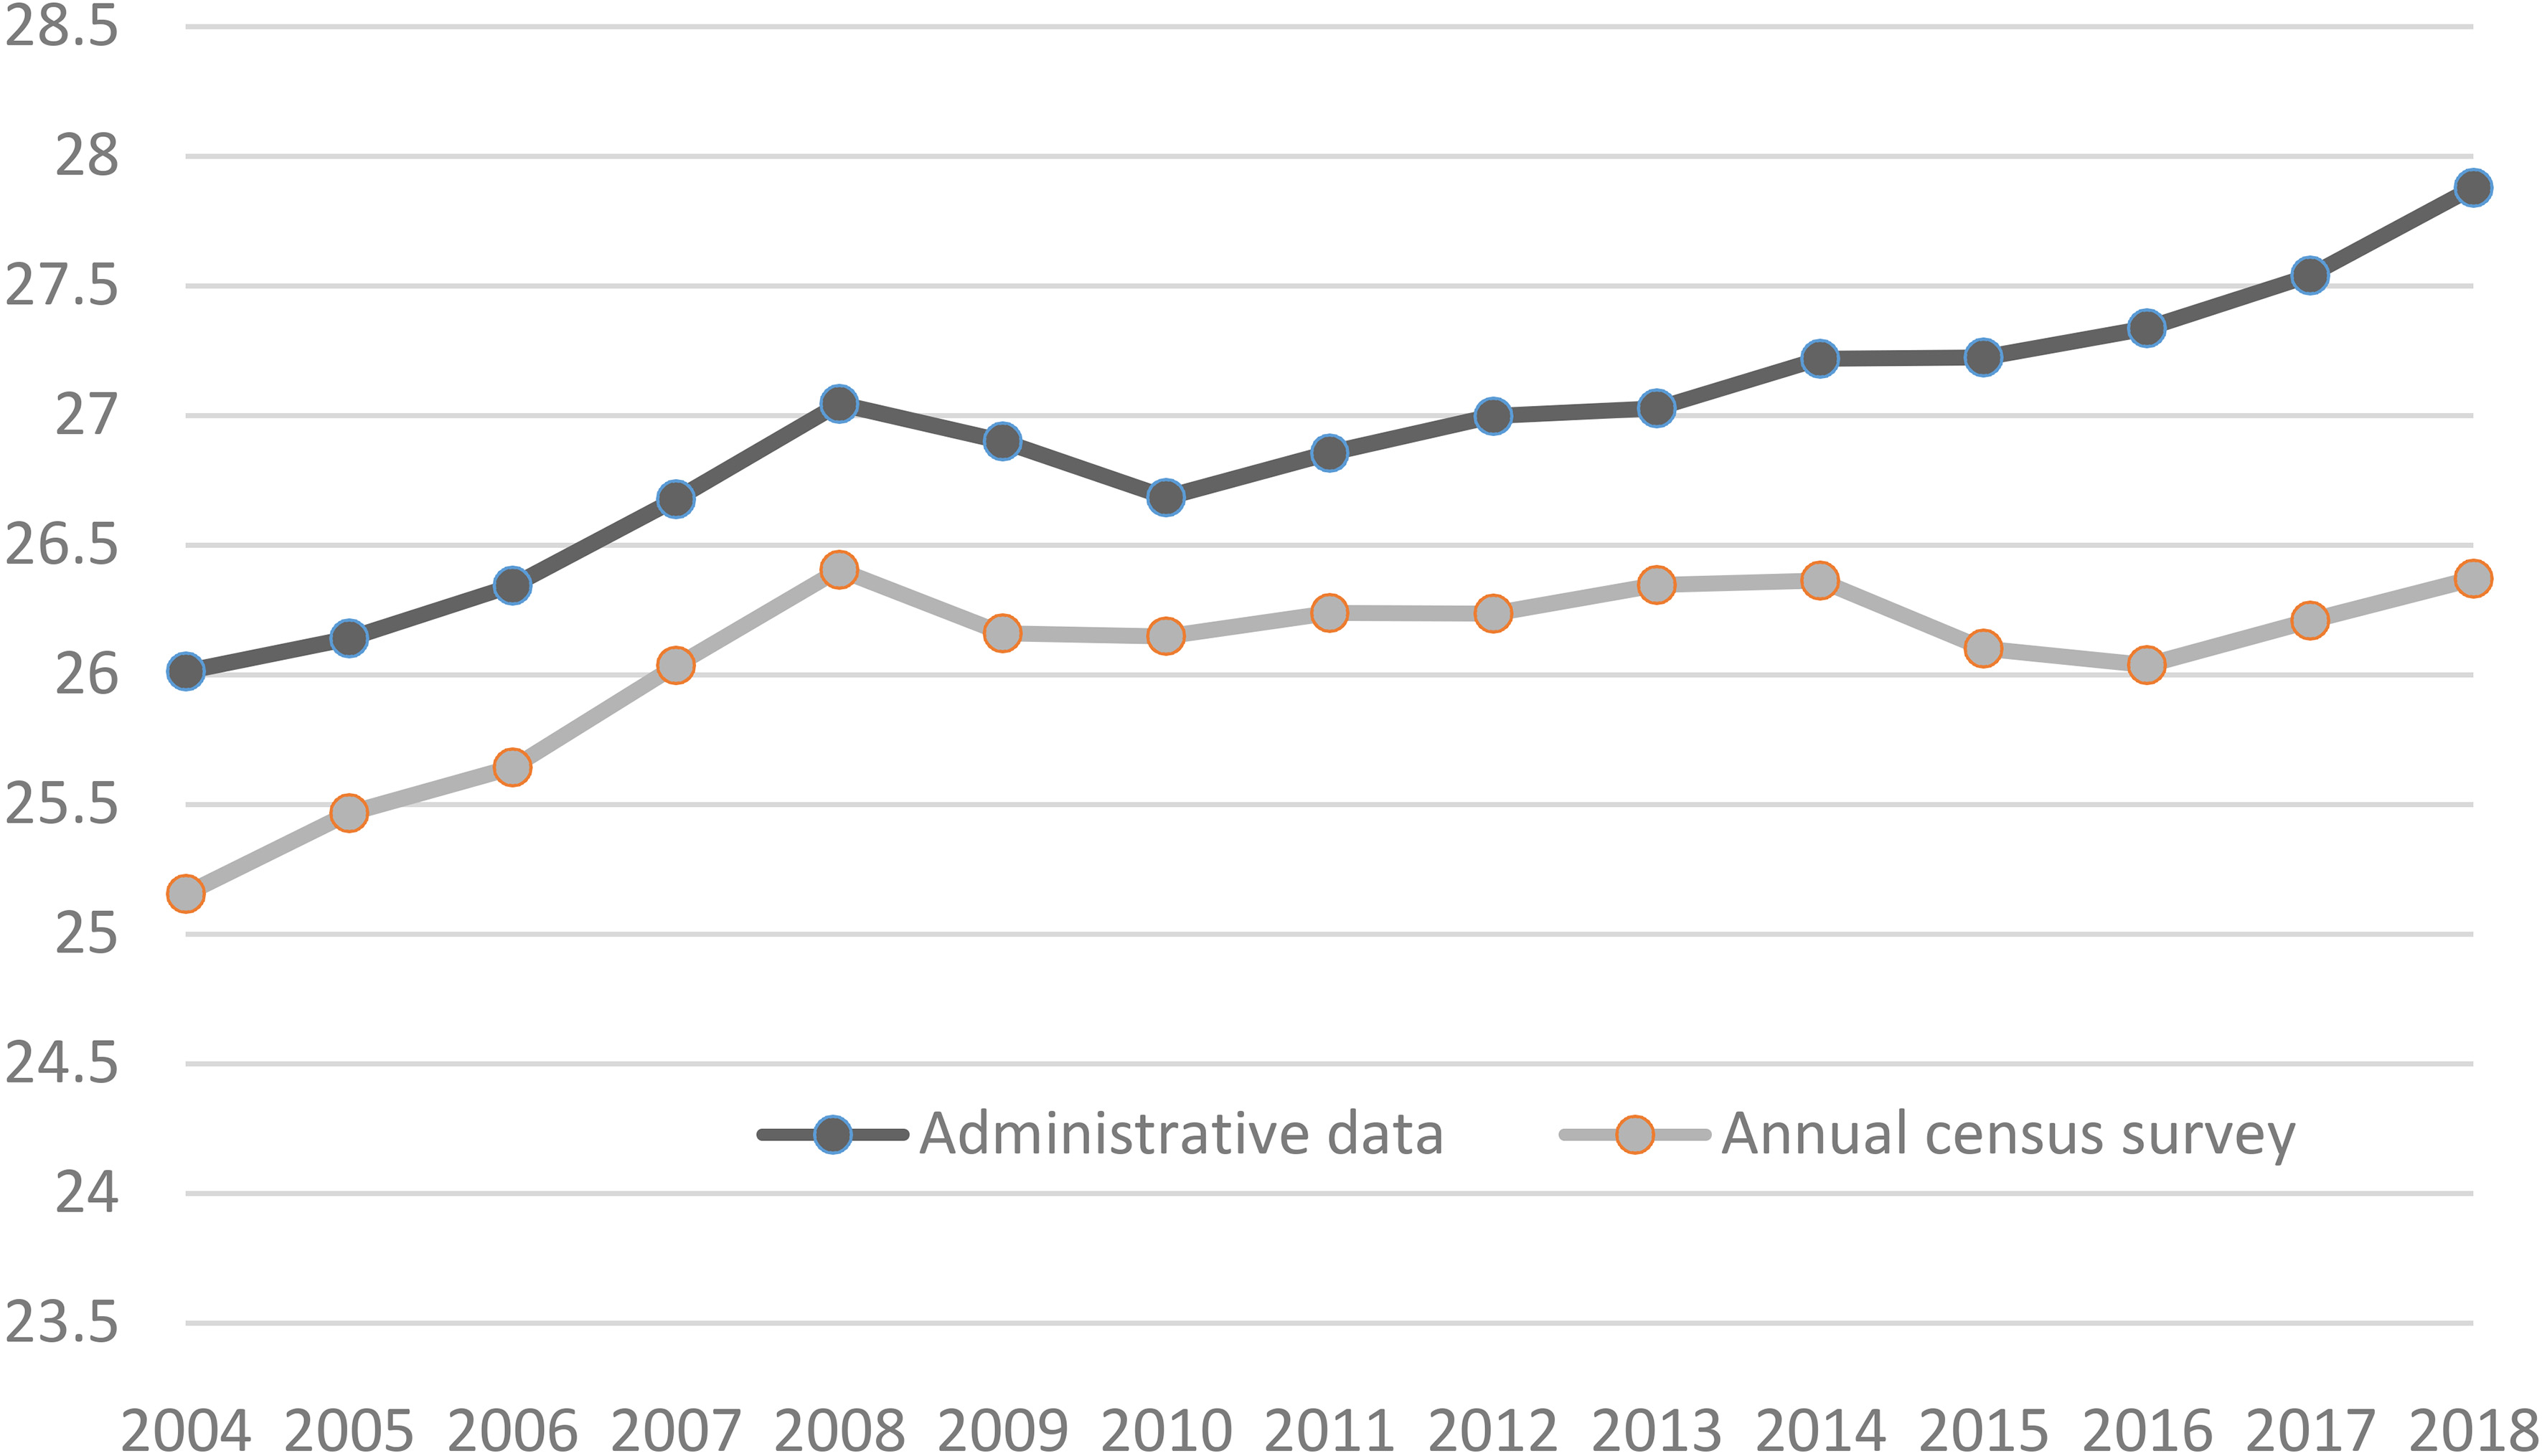
Figure 7.
Change in the number of people in employment according to the annual census survey and to administrative sources (in million).
However, a response does not guarantee the accuracy of the information. For example, the question about the period of completion of the dwelling has usually a high non-response rate (between 11% and 15% since 2004) which is explained by the fact that some households do not know this information. However, in 2015, if this is still true for paper respondents (15.2% non-response), it seems that Internet respondents are much better informed (only 0.6% non-response) or that they have ticked a plausible but not certain box or even that they have answered in a purely random way. This phenomenon corresponds to what survey methodologists call “satisficing”: respondents, rather than acknowledging their ignorance, are satisfied either with having answered the question knowing that their answer may be wrong, or with having given the answer they consider most likely [5]. Selection effects between respondents on paper and via the Internet can also play a role in this observation.
A large part of the variables on housing or individuals does not present any statistical break after the implementation of the internet mode. This is the case for the total population, the nationality, the enrollment in a school, the place of living one year before, the married life, the characteristics of the housing unit such as the number of living rooms, the surface, the occupancy status of the household, etc. Nevertheless, a few characteristics seem to be more or less affected by the implementation of internet.
Unlike the partial non-response rate, the identified effects of Internet collection on the age pyramid degrade the quality of the results. Indeed, it has appeared since 2015 that the number of super-centenarians (110 years and over) measured by the census is much higher than the reality (2,650 in the 2017 annual survey against about twenty according to an auxiliary source). More specifically, the Census has a significant number of individuals (about 2,200 in the 2017 annual census) older than the oldest person ever known in France. There were already a few cases each year before 2015, with optical reading errors leading to years of birth in the 19th century (for example, a poorly written “1998” that turns into “1898”).
Another development since 2015 is that many of these Internet centenarians were born on January 1st, 1900. A plausible explanation is that these people did not want to give their date of birth and declared a default value. For the day and month, chosen by the respondent from drop-down lists, the first values in the list are 01 and January respectively. Then 1900 is the year that immediately comes to mind of these recalcitrant respondents. Some corrections are then necessary for these declarations.
There is a gap between the measurement of employment with the annual census survey and employment estimates based on administrative data, due to differences in scope, concept and source. Over the period 2004–2014, the gap between these estimates averages 700 000 jobs at the expense of the former, with a variation of
However, the structure of internet respondents (more educated) means that their employment rates are much higher than those of paper respondents are. Nevertheless, if we look at the age, sex and diploma classes, the results still show a higher employment rate for Internet respondents of about 7% on average. This positive bias is quite general, observed on 201 of the 288 classes used, and seems to be contradictory to the increase presented above.
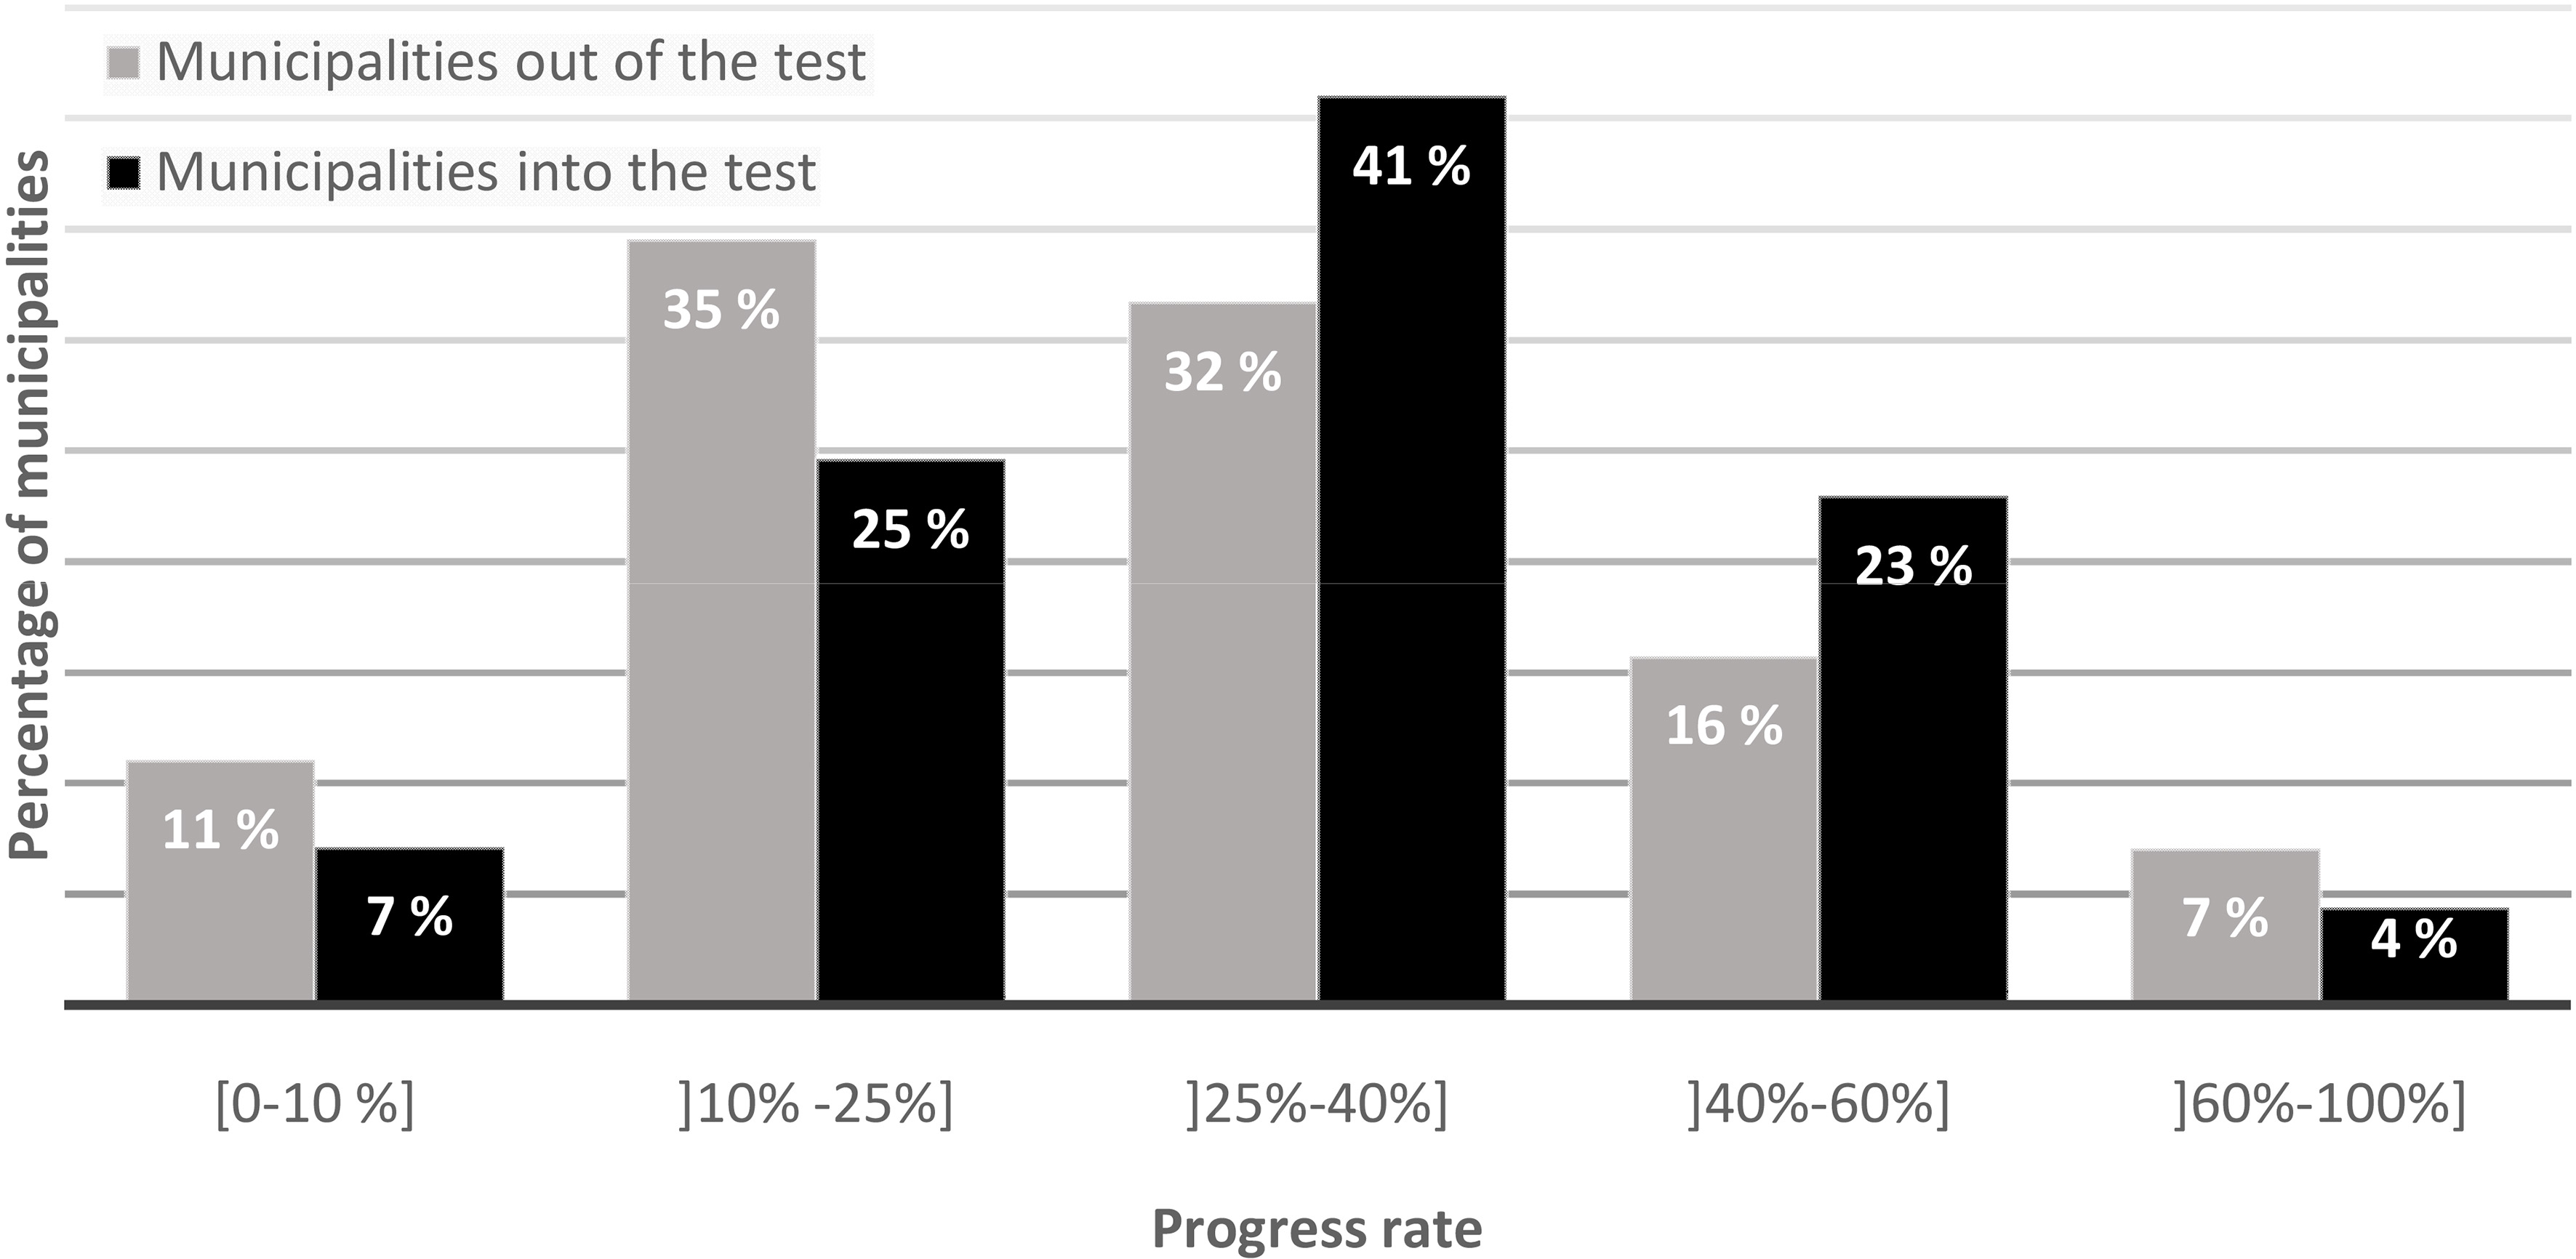
Figure 8.
Testing of leaving internet codes in mailboxes: progress rate after 8 days of collection. Source: Insee – Annual census survey 2004–2018. Reading note: After 8 days of collection, 41% of the municipalities into the test had achieved between 25 and 40% of their census data collection; this is the case for 32% of the municipalities out of the test.
A simple modeling, all other things being equal, was performed and several models tested. These regressions seem to highlight a significant effect of the collection method on spontaneous reporting in employment: once the main individual characteristics have been checked, an Internet respondent is more often in employment than a paper respondent. However, this effect is in the opposite direction to that observed in the graph (the gag between employment measured by annual census surveys and the one measured by administrative sources is rising). Beyond the limitations of the method mentioned above, it is also possible that the explanatory variables integrated in the model only partially explain the fact of being employed, which does not allow the pure effect of the collection method to be correctly estimated. At this stage, we have not found the explanation of the tendency observed on employment and we cannot be sure that it is a mode effect.
In conclusion, one can say that the rolling census was a chance to implement the internet response gradually conducting many tests to adapt the IT tools to the behavior of respondents. Thanks to these tests, this implementation was a real success and it has not destabilized the census itself since the non-response rate remains stable at a very low level, the quality of the answers are equivalent to the paper ones, and a new partnership with municipalities has been built with new tools and better efficiency. Thanks to the rolling census, we could confirm that the introduction of a new mode of response did not create a major break in series especially in the population count.
With the internet response 30 tons of paper are spared annually and the enumerators do not have to visit twice a dwelling. For nearly 50% of the dwellings, one contact is enough. Therefore, the internet mode spares some time and enables the enumerator to concentrate on the more reluctant people.
3.3Changes in procedures with previous tests
Following the current census procedure, enumerators must visit each household to give them a notice with the internet codes and individual password or, when they do not want to answer by internet, paper questionnaires. These notices or questionnaires are not sent by mail because, in France, there is not an exhaustive address register with the name of the inhabitants.
It is therefore difficult at the moment to change our census procedure. Nevertheless, we are currently testing an evolution of our process. The principle is that the enumerator puts the notice with the internet codes directly in the household mailbox without any physical contact. The main test concerns houses with only one dwelling. In buildings with several dwellings, it is difficult to match exactly the flats and the mailboxes, which are on the ground floor of the buildings. Therefore, if we put the notices in mailbox, afterwards, we will not be able to know precisely which household has answered and which one needs to be visited. The aim is to reduce the costs of the census and to increase again the internet answers by bypassing the reluctance shown by some enumerators to propose internet.
Once again, using the our annual census survey, we made a small test in 2018 with 16 volunteer municipalities.
Five days after the beginning of the census, between 30% and 50% of the inhabitants had already answered by internet (with an average of 37%). In the other municipalities, this rate was 14% at the same date. Thus, this protocol seems to be very efficient to boost the collection. The new procedure also seems to boost the internet response but this result needs to be confirmed by a broader test. The internet rate increased by 4 points in a year in the municipalities in the test of more than 10 000 inhabitants (those which are concerned each year by the census), that is twice more than the national increase of 2 points between 2017 and 2018).
In 2019, we extended the test to 180 municipalities randomly selected. The first results seem encouraging with 68% of the municipalities having received more than 25% of the answers one week after the beginning of the census campaign against 54% of the municipalities with the traditional process (Fig. 8). In addition, the Internet response rate was 54% of principal residences in 2019 in the test municipalities compared to 51.7% in the others. This internet rate increased by 6 points in one year for the municipalities included in the test compared to
Despite these good results, we decided to implement next year a new, larger test to check if this new methodology for data collection does not create a break in the census series: indeed, we suspect an effect on the determination of the housing category (main residence or not) due to the declaration of residents. It may be that the first contact with an enumerator helps households to decide whether their residence is their main residence. By removing this first contact with the enumerator, we may modify the answers. Therefore, we want to have a large test to provide an estimate of this possible effect before changing the protocol.
4.Conclusion
In France, the population census has been carried out every year since 2004 on a sample of the population. It thus makes it possible to produce new legal populations every year for each commune, department and region, as well as new statistical results. The method is based on five years of data collection to produce the results of a census.
Since 2004, several new features were introduced: introduction of new or modified questions, introduction of Internet collection, changes in the collection protocol, etc.
Such changes are possible with the rolling census with advantages and disadvantages compared to a decennial census. Among the advantages are the ability to perform iterative tests over several years before deciding on the generalization of a new protocol with the possibility to associate easily users to these tests. In addition, it offers the ability to accurately observing and measuring series breaks on variables.
Disadvantages arise from the five-year cycle. Firstly, there is a necessary delay of 5 years between the introduction of a new question and the dissemination of results on these new question at all geographical levels. A new question introduced during the 2018 collection will only produce detailed results at the municipal level in mid-2023, once the 2018–2022 collections have been completed (and these results will have 2020 as a reference date). In the meantime, however, estimates will be available at regional and national level.
In addition, any changes that affect the results will gradually be integrated into the collection process and smoothed due to the method, which can be both an advantage and a disadvantage.
Internet collection has been introduced since 2015. It had no effect on the overall response rate of the census, which remained very high at 96%. It has led to a reduction in partial non-response. The analysis of the results also showed that the introduction of this collection method did not generate an effect of collection mode for the vast majority of variables. However, there is a break in the employment series that has not yet been resolved.
References
[1] | Insee, Le recensement rénové: avancées méthodologiques et apports à la connaissance. Economie et Statistiques, (2016) . |
[2] | Brown J, Beaujouan E, Review of the rolling census approach: and other survey-based options, ESCR Centre fo Population Change Working Paper n |
[3] | Durr JM, Clanché F, The French Rolling Census: a decade of experience. 59th ISI World Statistics Congress, (2013) . |
[4] | Clanché F, France’s redesigned census: lessons and prospects. Conference of the Italian statistical society Statistics in the 150 years from the Unit of Italy, (2011) . |
[5] | Razafindranovona T, La collecte multimode et le paradigm de l’erreur d’enquête totale. Document de travail, Insee; (2015) . |
[6] | Godinot A, Pour comprendre le recensement de la population. Insee méthodes hors série, (2005) . |


