
Delays in the release of India’s census data
Abstract
The timeliness dimension of data quality has not received sufficient scholarly attention even though the publication of official statistics of various countries are often delayed. This paper examines the growing delays in the release of census data in India amidst the technocratisation of policy-making, public professions of faith in evidence based policy-making and growing fascination with big data. We show that the growing delay in the release of census data of India is a fact, rather than a mere allegation, and contextualise the problem by comparing seven decennial censuses conducted between 1951 and 2011. We suggest that delays can be measured vis-à-vis usual, desirable, declared and feasible schedules of publication. Further, delays can be understood from the perspectives of the unwillingness of the government statistical system to face public scrutiny, decline in the quality of public goods, political interference and, in case of data on identity, communalisation of politics.
One of the hallmarks of an independent statistical agency is its predetermined release dates for important statistical data [7, p. 53]. Users who were not satisfied with timeliness were less satisfied with the overall quality of statistics [80, p. 12]. politicians facing electoral pressures, releasing data may be extremely inconvenient, undermining the credibility of campaign promises or even providing ammunition to the opposition [81, p. 13].
1.Introduction
The quality of government data is particularly important for developing countries, where alternative sources of data are either unavailable or unreliable. In most developing countries, non-governmental actors have limited expertise to question government data, let alone build alternative databases. Restrictions on freedom of expression and media, weak judiciaries and lower rates of (statistical) literacy further impede the scrutiny of official statistics. Even countries such as India, which have relatively robust official statistical systems11 as well as tremendous non-governmental expertise in the field of statistics, are struggling to maintain the quality of their official statistics [9, 56, 71, 75, 76, 95, 96].
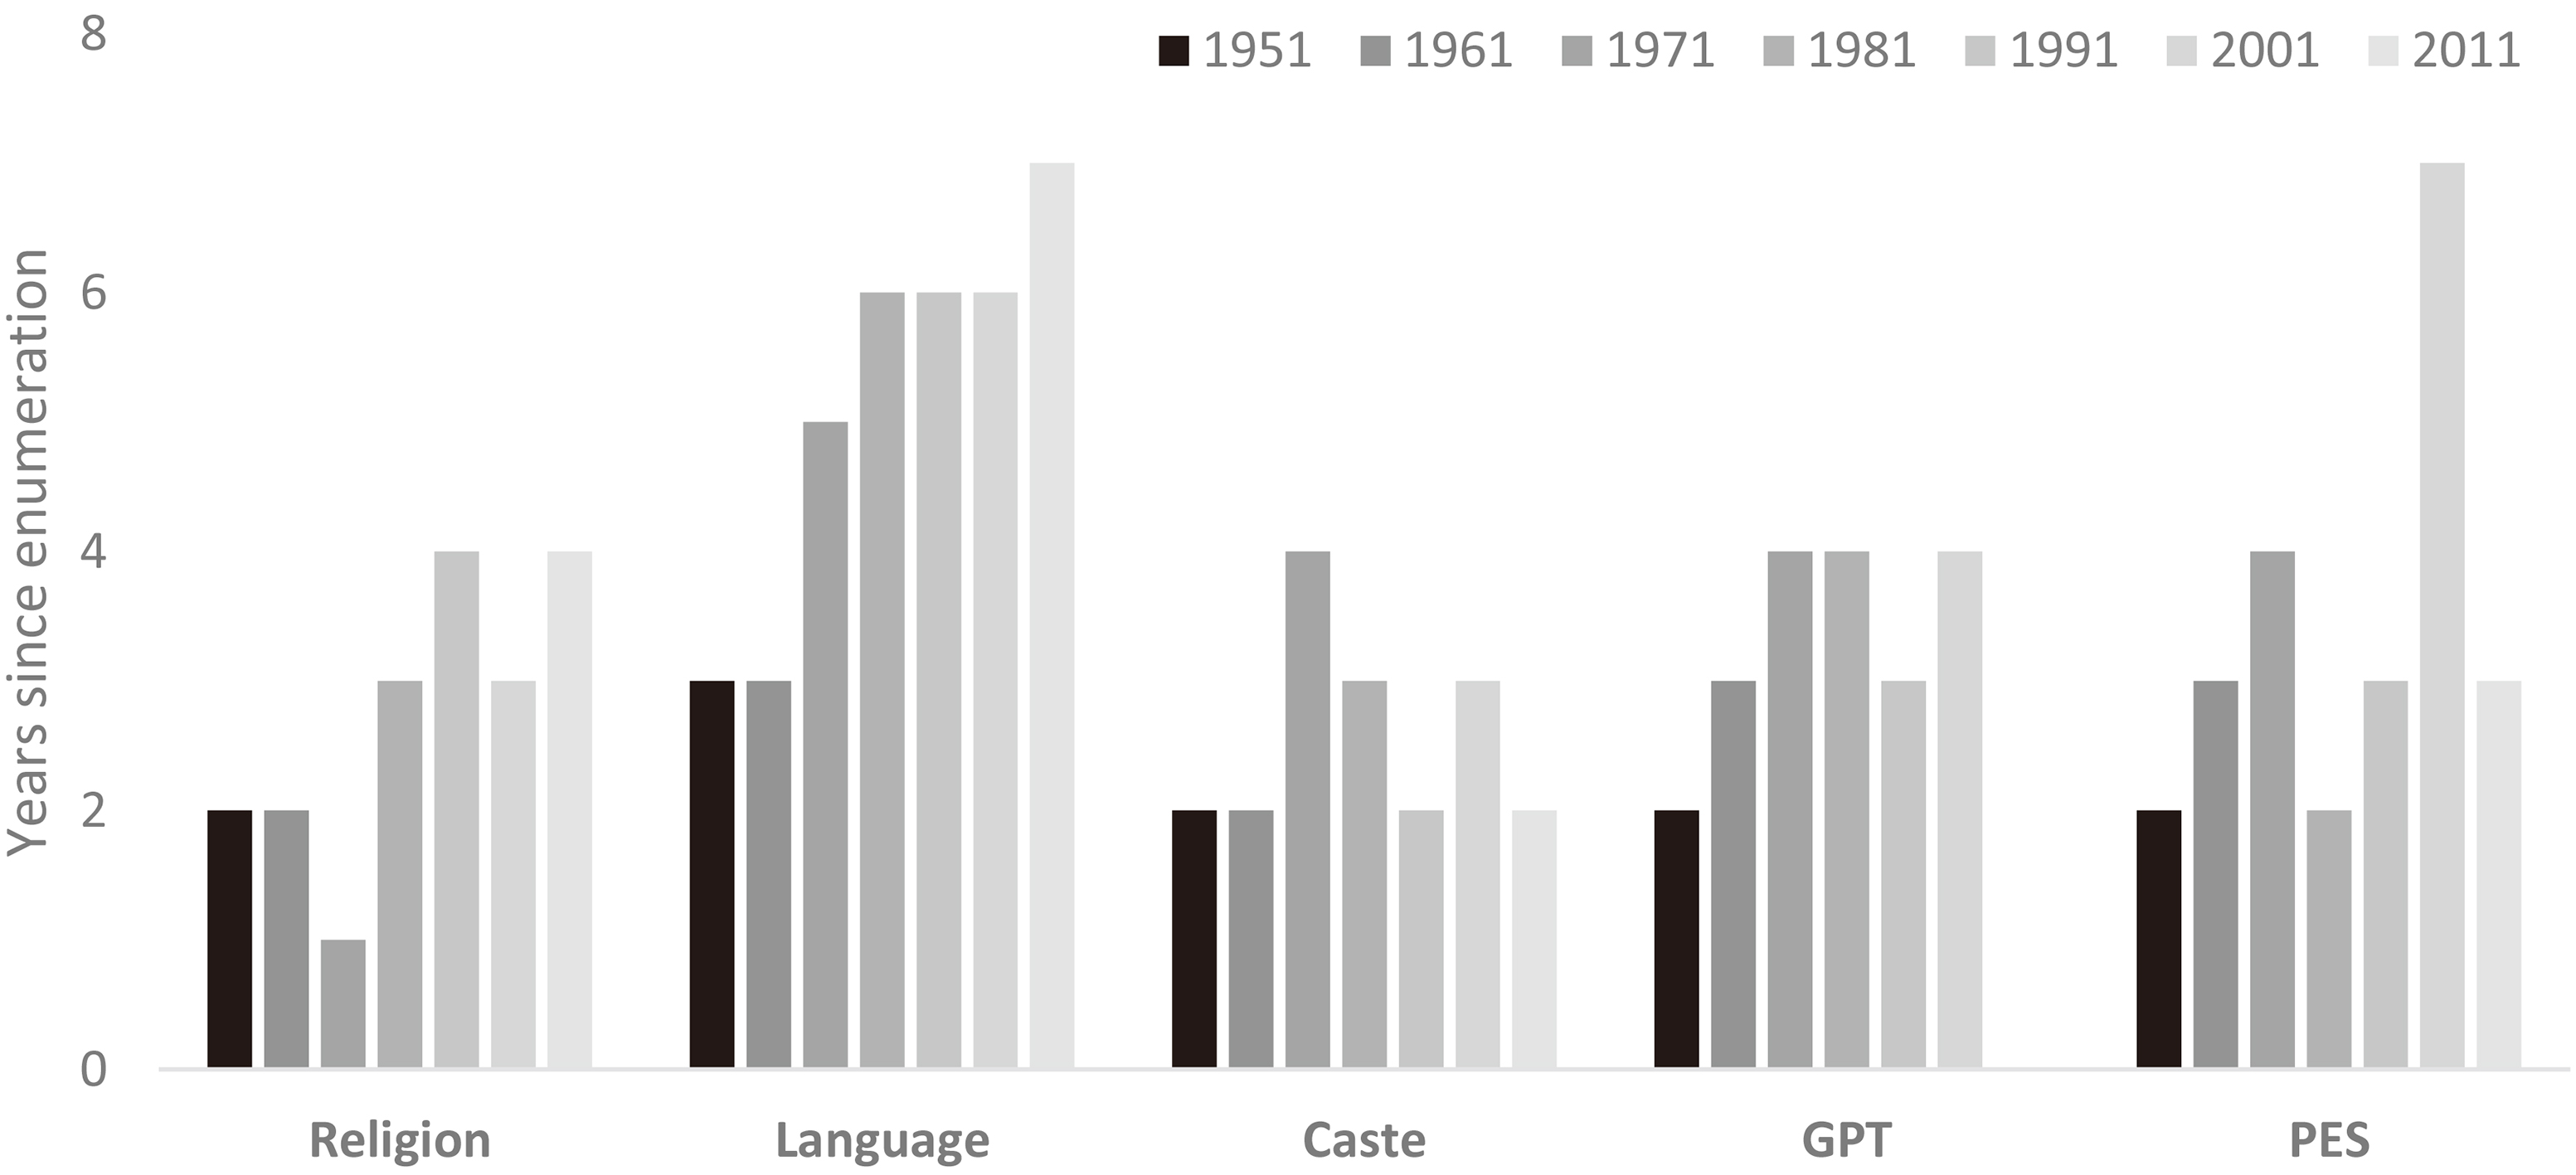
Figure 1.
Time gap between enumeration and release of India’s census data (1951–2011). Notes: (i) Each vertical bar represents the time elapsed between enumeration and the publication of the data. (ii) The gap is measured in years as we do not have information on the month of release of all publications. (iii) GPT: General Population Tables, PES: Post-Enumeration Surveys. Source: Table 1.
Survey data quality has several dimensions, including, accuracy, credibility, comparability, usability/interpretability, timeliness, relevance, accessibility, completeness and coherence [17, p. 819]. Only a few of these dimensions have been examined in the literature on India’s official statistics. For instance, the quality of Indian census data has been evaluated mostly in terms of accuracy with focus on content errors (errors in the sub-classification of headcount) and, to a lesser extent, coverage errors (errors in the overall headcount).22
In this paper, we examine the quality of Indian census data from the perspective of timeliness, i.e., whether ‘data deliveries adhere to schedules’ [17, p. 819], that has received insufficient scholarly and administrative attention [5],[20, p. 3596],[21],[37, p. 244],[68]. The growing delays in the publication of census data over the past few decades is our point of departure (Fig. 1, Table 1).33 The language tables of the 2011 Census were, for instance, released in 2018, i.e., seven years after enumeration. The migration tables of the 2011 Census were released after the commencement of preparations for the 2021 Census.44
We evaluate the quality of the post-independence Indian censuses along the timeliness dimension. We show that the growing delays are a fact, rather than a mere allegation and situate the problem in its proper context. Section 2 discusses what counts as delay. In Section 3, we discuss how to measure a delay vis-à-vis usual, desirable and feasible schedules of publication. We conclude in Section 4 with a discussion of delays from the perspectives of the unwillingness of the statistical system to face public scrutiny, general decline in the quality of public goods, growing political interference and, in case of data on identity, growing communalisation of politics. While Indian censuses are the primary focus of this paper, we also discuss examples from other countries. The latter examples are neither exhaustive nor systematic, but they help to highlight the problem of delay across developing and, even, developed countries.
Table 1
Timeline of the release of census data and elections
| Census | Date of release§ | General | The ruling | |||||
|---|---|---|---|---|---|---|---|---|
| year | Religion | Language | Caste | PPT | GPT | PEC/PES | election | party§§ |
| 1951 | 1953 | 1954 | 1953 | Mar–Apr 1951¶ | 1953† | 1953 | Mar 1951 | INC |
| 1961 | 1963 | 1964 | 1963 | 27 Mar 1961 | 1964 | 1964†† | Feb 1962 | INC |
| 1971 | 1972 | 1976$ | 1975 | 12 Apr 1971 | 1975 | 1975†† | Mar 1971 | INC |
| 1981 | July 1984 | 1987/1990* | 1984 | 18 Mar 1981 | 1985 | 1983 | Jan 1980, Dec 1984, Sep/ Dec 1985 | INC |
| 1991 | 1995 | 1997 | 1993 | 25 Mar 1991 | 1994 | 1994 | May–Jun 1991, Feb 1992, Apr–Jun 1996 | SJP (INC‡) |
| 2001 | September 2004 | 2007 | 2004 | 26 Mar 2001 | 2005 | 2008 | Apr–May 2004 | NDA |
| 2011 | 2015 | 2018 | 2013 | 31 Mar 2011 | Not yet released | 2014 | Apr–May 2014 | UPA |
Notes: (1) §Months have been mentioned in case of the Provisional Population Totals (PPT). In case of other reports, months are mentioned only if a report was released in an election year. (2) †We have not been able to identify the date of release of the All-India GPT, but GPTs for several states were released in 1953. (3) $ A few state level tables were released earlier, but they were superseded by a later report issued in 1976. (4) * Two different tables on language were released for the 1981 Census. Tables on the language mainly spoken in the household (canvassed in Household Schedule) were published in 1987, whereas tables on the population by language/mother tongue (canvassed in Individual Slip) were published three years later in 1990. (5) ¶Some states released the report in March. (6) ‡INC came to power immediately after enumeration. (6) ††These correspond to the publication year of the respective GPTs, which contained a note on PEC. The 1961 GPT also added that “A brochure containing the details of the organization of the Post-Enumeration check and results will [also] be issued separately” [40, p. 44]. (7) §§Indicates the ruling party at the union level during census. BJP: Bharatiya Janata Party; INC: Indian National Congress; SJP: Samajwadi Janata Party; NDA: National Democratic Alliance led by the BJP; UPA: United Progressive Alliance led by the INC. Sources: Various census and election reports, Bose [20, p. 3595],[21, pp. 14–15], Visaria [97, p. 206], Natarajan [100].
2.Delays
The problem of delayed publication of government statistics in India goes back all the way to the 19th Century, when the colonial government began publishing its official data. In “Twenty Years’ Review of Census Statistics” judge and social reformer M.G. Ranade commented that “[t]he Decennial Census Report for 1891, for the Bombay Presidency, loses much of its interest by reason of the great delay that has taken place in its publication” ([74, pp. 209–230] originally published in 1893). The problem persisted in the post-colonial period. Commenting upon the delays in the release of 1961 Census publications, Visaria [97, p. 206] pointed out that contrary to expectations there were delays in the release of the publications of the next census as well: “It was hoped that the 1971 census would eliminate the delays, partly because most of the tables were to be prepared from a 10 percent sample of the rural population and a 20 percent sample of the urban population, with the help of electronic computers, mainly IBM-1401s.” The government itself admitted that the release of the 1981 Census data was delayed due to the “absence of in-house computer” [45, p. 4] and hoped that the problem would be rectified in the 1991 Census. After the 2001 Census, Bose [20, p. 3596] lamented that “the entire data (on a 100 per cent basis) was transferred to the computers for tabulation and this has, instead of speeding up tabulation has resulted in considerable delay.” The National Statistical Commission too noted the problem of delay [52, 56, 82].
Indeed, delays have grown rather than reduced over time despite technological innovation and growing field experience (Table 1).55 Several crucial tables from the 2011 Census, the latest decennial census conducted in India, have been released belatedly in instalments (migration and religion data) or released with considerable delays (language data) even though data are increasingly being released in the form of barebones Microsoft Excel tables.66
Figure 2.
Understanding delays. Note: Delays in conducting census are shown along the horizontal axis, while the delays in releasing data are shown on the vertical axis. Sources: Bosnia and Herzegovina [73], Canada [25], Ethiopia [24], India (see Table 1), PEPSU and Himachal Pradesh [37], New Zealand [77, 78], Pakistan [90], Sri Lanka [61, 8], Turkmenistan [38].
![Understanding delays. Note: Delays in conducting census are shown along the horizontal axis, while the delays in releasing data are shown on the vertical axis. Sources: Bosnia and Herzegovina [73], Canada [25], Ethiopia [24], India (see Table 1), PEPSU and Himachal Pradesh [37], New Zealand [77, 78], Pakistan [90], Sri Lanka [61, 8], Turkmenistan [38].](https://content.iospress.com:443/media/sji/2020/36-1/sji-36-1-sji180488/sji-36-sji180488-g002.jpg)
Two basic questions need to be answered for there to be an informed discussion on delays: what counts as a delay and how to measure a delay. The first question is addressed below, while the second is examined in the next section.
A nuanced discussion on delay will have to go beyond a binary treatment of the problem. Delay has to be seen as a kind of continuum. Figure 2 maps the various possibilities of delay. Belated release of census data is commonplace in developing countries. The 2007 Census of Nigeria [24], 2012 Census of Sri Lanka [8], 2013 Census of Bosnia and Herzegovina [73], 2014 Census of Myanmar [89] and 2017 Census of Pakistan [90] proved to be controversial due to delays in the publication of results. Occasionally, developed countries too witness delays in the publication of results. The 2018 Census in New Zealand took place in March and the results were expected in the same year. The Statistics New Zealand admitted that the release is unlikely any time before April 2019 because of “the complex nature of the task” [77]. In Canada, the release of 2006 Census results was delayed because of budgetary constraints, among other things [25].
In several cases, governments do not release results to avoid embarrassing/inconvenient findings. Saudi Arabia probably feared that “publishing an exact count (showing their own population to be smaller than many supposed) might encourage enemies to invade the country or promote subversion [in the Shia-dominated eastern region]” [6, p. 96]. Other countries such as Turkmenistan [38], Bhutan [28] and even early post-colonial United States [72, p. 6] have faced similar dilemmas in the past.
Elsewhere census operations were suspended to avoid ethnic conflict. Nigeria delayed censuses for a long time fearing unrest and eventually conducted censuses that nearly reproduced earlier federal population shares [34]. Pakistan postponed the 1991 Census five times between 1991 and 1998 fearing ethnic conflict in case the existing demographic shares of ethnically demarcated provinces were altered and eventually managed to produce figures that matched the expectations based on earlier censuses [98, p. 687, p. 691].
So, on the one hand, we have timely census and release of data in the ideal case. On the other, there is delayed enumeration and release of data. In extreme cases, data collection exercises are either indefinitely suspended or results are indefinitely withheld. Lebanon is the best exemplar of the former. Its government has not conducted a census after 1932 “for fear that taking one would reveal such changes in the religious composition of the population as to make the marvelously intricate political arrangements designed to balance sectarian interests unviable” [36, 6, 65]. A recent census held in Turkmenistan exemplifies the latter. Turkmenistan’s government did not release the results of the 2012 Census that seems to have revealed that the actual population was far lesser than official claims and the ethnic composition too differed from the government propaganda [38].
In 1951, the government of newly independent India dropped presumably divisive questions related to identity that were part of the colonial censuses. It decided to collect information on scheduled castes and tribes that was just sufficient to fulfil constitutional obligations: “the only relevant question on caste or tribe incorporated in the Census Schedule was to enquire if the person enumerated was a member of any ‘Scheduled Caste’, or any ‘Scheduled Tribe’ or any other ‘Backward class’
Censuses have always been conducted as per schedule in independent India. There are a few exceptions though. Firstly, the reference date of the census was shifted once. Since 1941 the reference date for census has been 1st March except for 1971, when it was 1st April. The reference period for enumeration was changed in that year “to avoid clash with mid-term Parliamentary Election [in March]” [53, p. 5]. It can be argued that enumeration was delayed by a month in 1971. This is the only instance of a nationwide “delay.” However, there was no delay if we consider the fact that the government declared the revised reference date in advance and stated a justifiable administrative reason for the rescheduling insofar as the same staff has to be mobilised for conducting both enumeration as part of decennial census and enrolment of voters in electoral rolls. There have been a few instances of extension of the timeline of enumeration too. The revisional round of the 1961 Census was extended by two days, from March 1 to March 5 instead of March 3 on account of a festival that is celebrated across large parts of the country [100, p. 142]. In the 1961 Census, household enumeration had to be extended by a few months in parts of Nagaland due to political unrest [42].
Secondly, in some cases census had to be delayed in a few districts due to natural disasters [54]. In 1981, census was delayed in the non-snow bound areas of Jammu and Kashmir due to unfavorable weather. In 2001, enumeration could not be conducted in the whole of Kachchh district and a few taluks of Jamnagar and Rajkot districts of Gujarat due to a massive earthquake and had to be postponed until February 2002. Similarly, in 2001, enumeration had to be postponed in the entire Kinnaur district of Himachal Pradesh due to natural calamities. The natural disaster induced delays are few and far between, though. Otherwise the standard practice in India is to conduct census ahead of schedule in snow-bound hilly areas of states such as Jammu and Kashmir, but the schedule and the areas covered are declared in advance.77
Thirdly, census was not conducted in 1981 in Assam and in 1951 and 1991 in Jammu and Kashmir due to political unrest. In, at least, one case (West Bengal in 1971) census was conducted ahead of schedule due to political disturbance [43], while in another the timelines were relaxed under similar circumstances (Nagaland in 1961) [42].88
Fourthly, the North Eastern Frontier Agency (NEFA), which included the present Arunachal Pradesh and Tuensang, Mon, Kiphire, Longleng and Noklak districts (and small parts of Mokokchung and Zunheboto districts) of Nagaland, was barely covered until 1951 due to the remoteness of the region and the sparse presence of the government. Also, until 1971, the Census excluded the Jarawas and Sentinelese tribes of Andaman and Nicobar Islands that were unapproachable [57].99
In most of the above cases there was either no unplanned delay, or the delay was due to objectively verifiable factors such as natural calamities, inclement weather and clash with elections. In other words, India has not seen unplanned delays in enumeration driven by non-verifiable factors. The remainder of the discussion in this paper will, therefore, focus on the delays in the publication of census data.1010 Publication can be delayed because of one or more of the following: political interference, delay in the processing of raw data and delay in the printing of reports. The last seems to have been a bottleneck earlier when “the slow progress of printing” was attributed to “the large amount of work involved and the need to assign it to already overburdened government presses which handle other priority jobs as well” [97, p. 209]. This bottleneck has been largely eliminated by computerised typesetting and internet publishing.1111 Moreover, the Census no longer needs to print a large number of copies as it publishes reports online as well and at times it releases only Microsoft Excel tables that are not supplied in the printed form.
3.Identifying delays in publication
If the government misses a declared, desirable, usual and/or feasible timetable of publication, we can say that there is a delay. The Census of India pre-commits to a timetable for conducting enumeration, which is declared as many as two years in advance. The timetable for publication is not explicitly declared in advance though.1212 In this section, we will, therefore, try to identify delay vis-a-vis desirable, usual and feasible timetables of publication of data.1313 Any assessment of delays has to contend with the diversity of data published by the census. The Indian census data is organised across stages of enumeration (houselisting, household and post-enumeration surveys) and spatial (enumeration block, village/urban settlement, district, state, region1414 and country) as well as socio-cultural (Scheduled Castes, Scheduled Tribes and Others; Religion; Language; Sex; Age groups) levels of aggregation. The data are further organised into general, economic, socio-cultural (caste, tribe, religion and language), migration, fertility and housing tables. The census also publishes several cross-tabulations, atlases and thematic reports. In the following discussion, we will focus on tables generated from household enumeration and post-enumeration surveys, but we will not cover the publication of data for all the levels of aggregation. Moreover, we will mostly restrict our discussion to the first publications in each case.
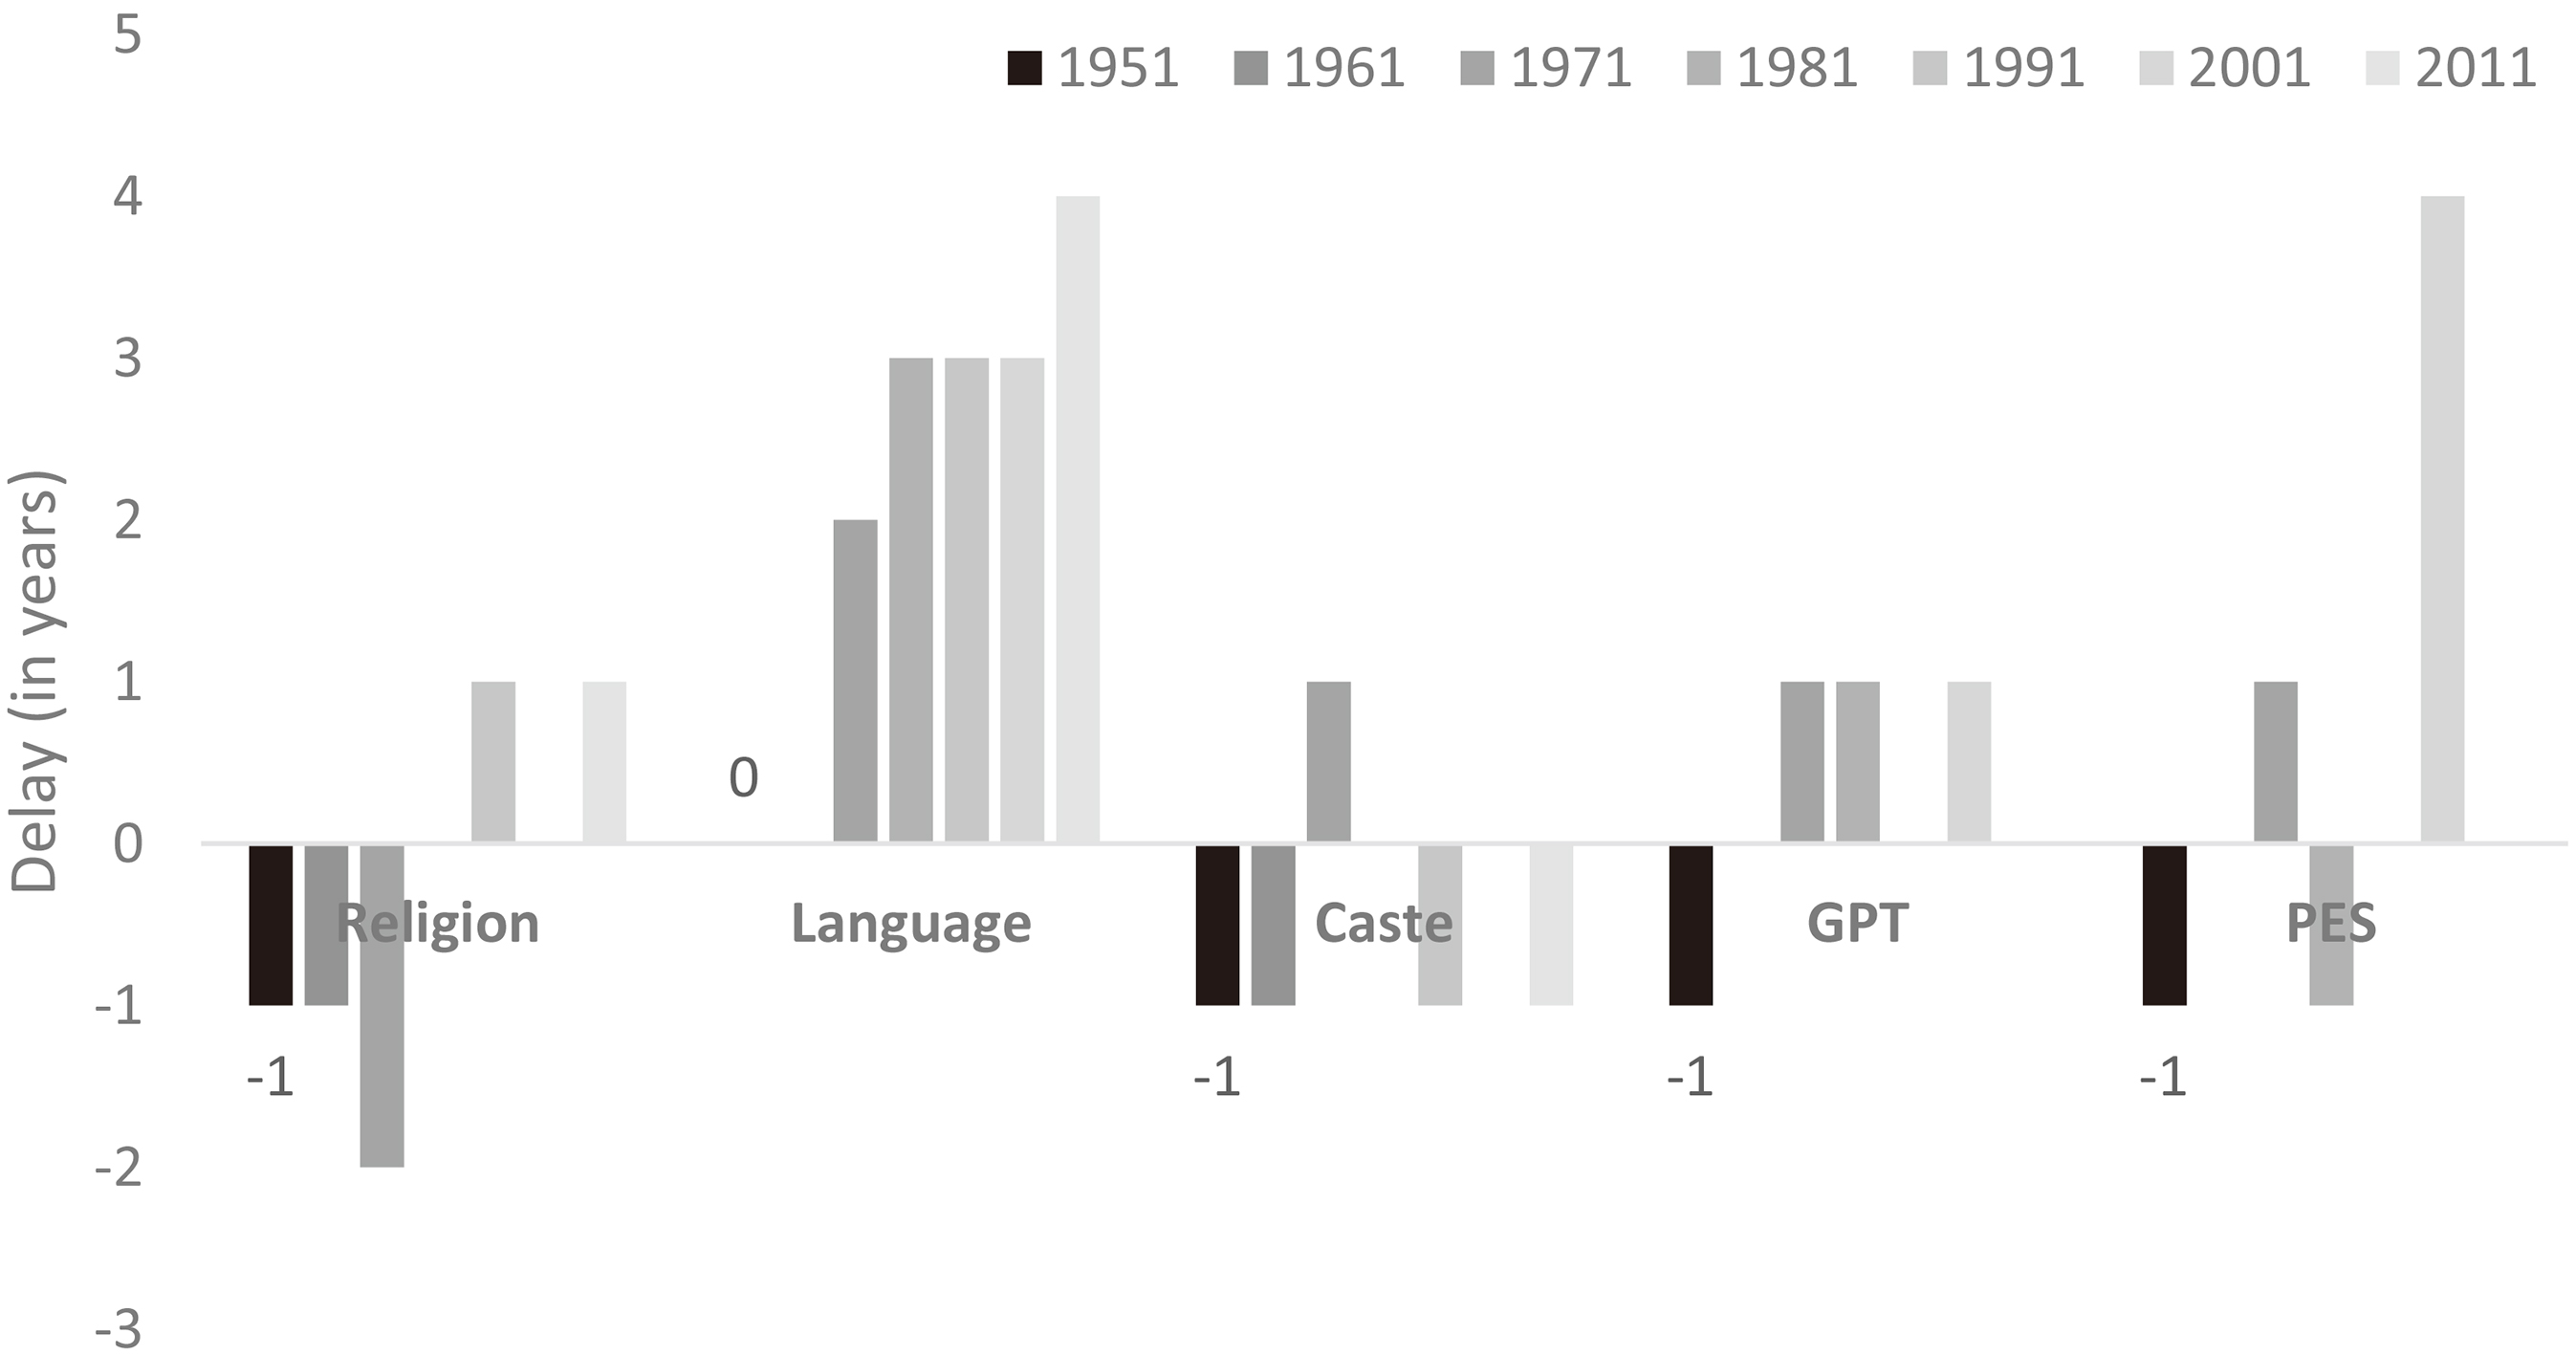
Figure 3.
Delay vis-à-vis desirable schedule. Note: Release after three years is treated as a delay vis-à-vis the desirable schedule (see text for further details).
Before we identify and compare the extent of delays over the decades, three points are in order. Firstly, the content and scope of the same report published after different censuses could be different. This might explain the variations in the date of release due to differences in the background work needed to prepare the reports. However, we focus on the first round of publications that are mostly restricted to broad categorical and geographical aggregates.
Figure 4.
Delay vis-à-vis usual schedule. Note: Usual schedule is defined as two years for caste and religion data and three for language. There was no delay in 1951 and 1961 vis-à-vis the usual schedule.
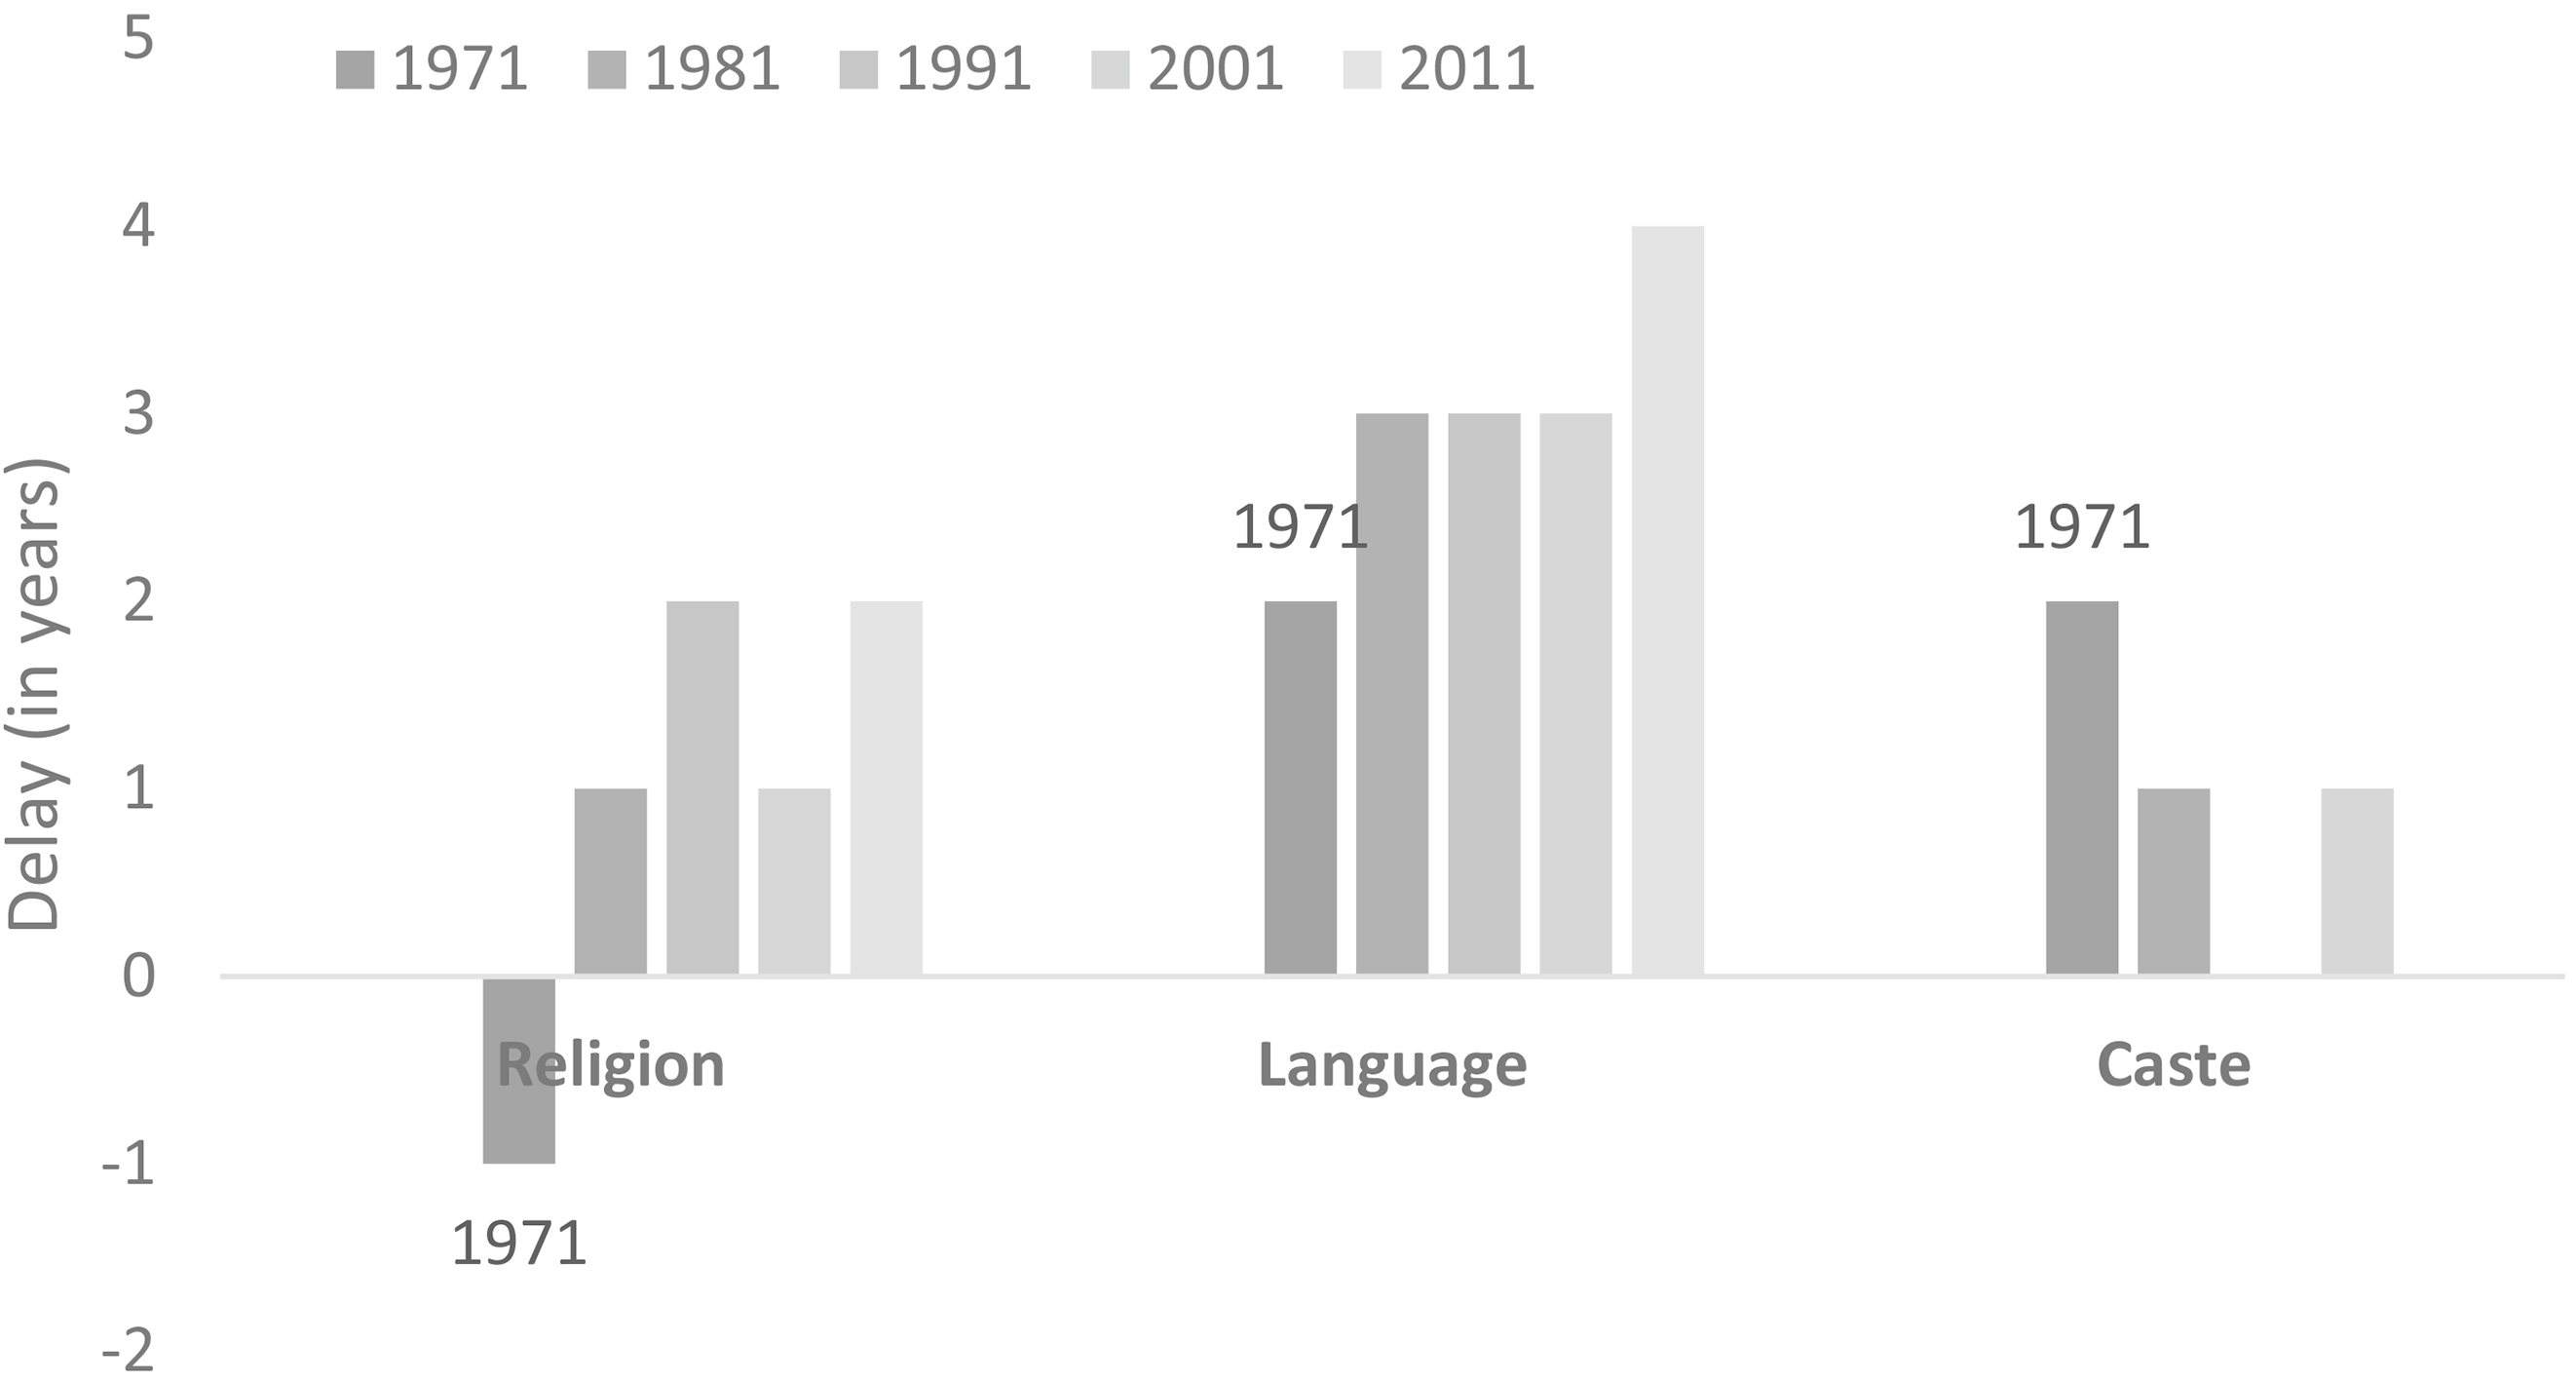
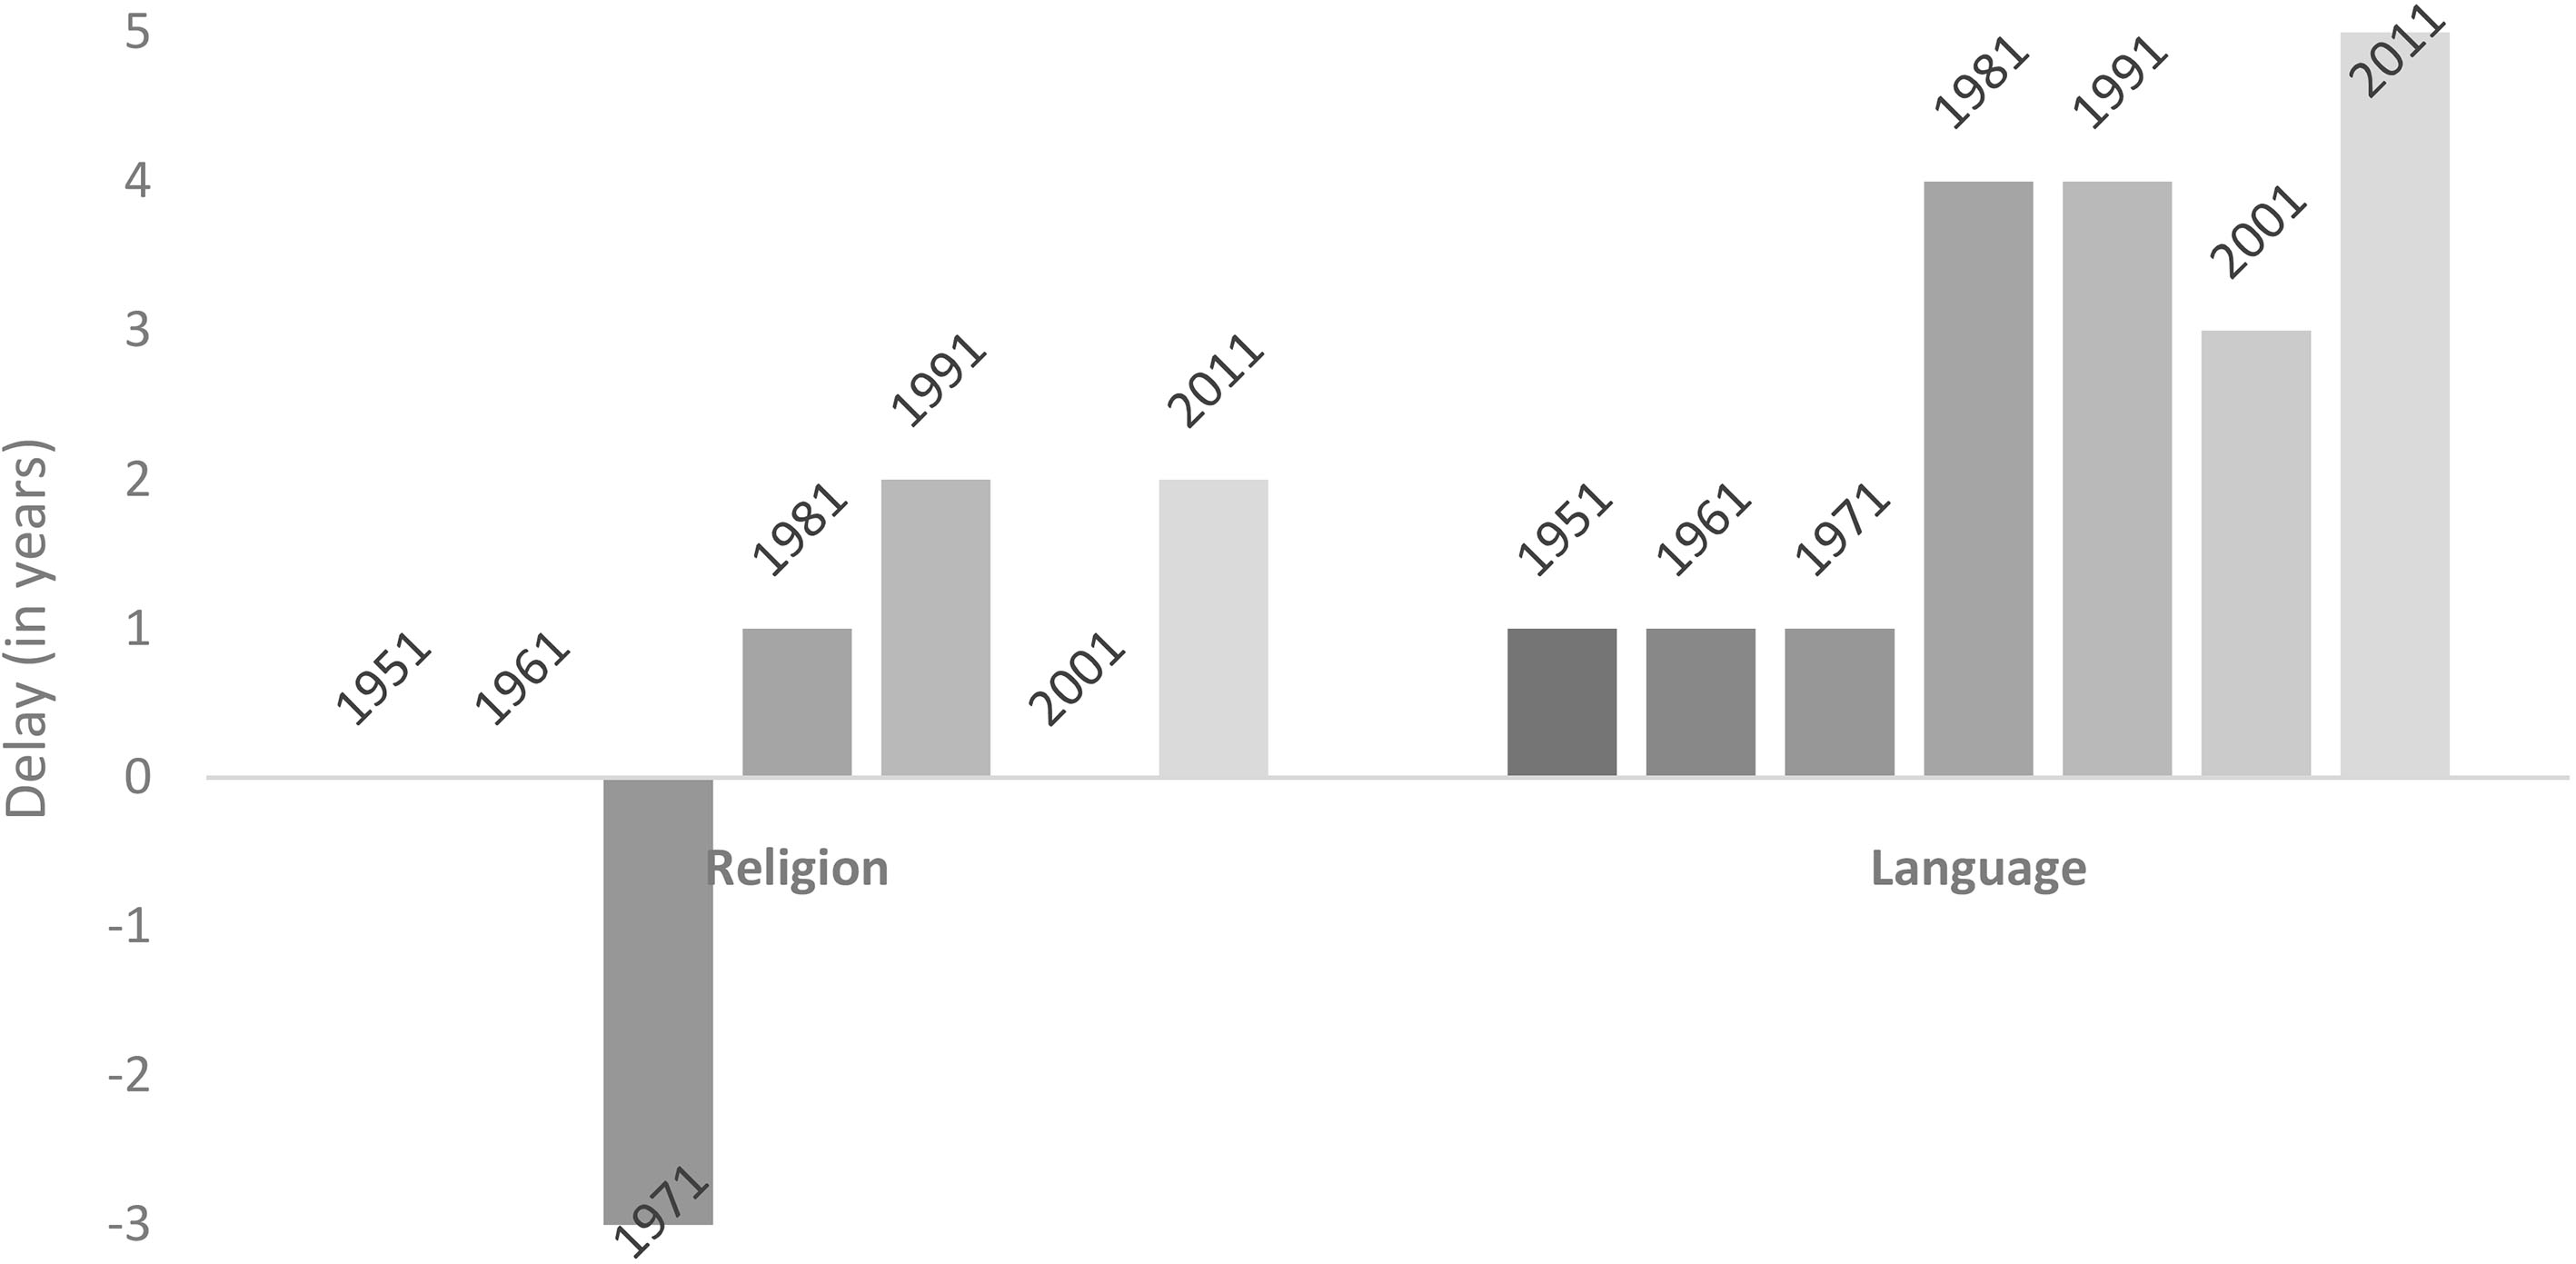
Figure 5.
Delays vis-à-vis feasible schedule. Note: The feasible schedule for religion is linked to the release of caste and tribe data, while three years is treated as the feasible schedule for language.
Secondly, there is a need to balance the speed of publication and accuracy of reports [32, p. 7]. In the 1971 Census, “very great importance was attached to the early publication of the provisional totals…Unfortunately some of the Directors were over anxious in transmitting the totals. Revised totals had to be published later” [100, p. 376].
Thirdly, the Provisional Population Totals (PPT) – the first publication of every census that provides provisional figures on headcount, gender and educational attainment–have been released generally within a month of the completion of enumeration and revisional rounds (Table 1).1515 After the 1971 Census, Visaria [97, p. 206] contrasted the “commendable speed” of the release of the PPT with overall publications program that was “behind schedule.” Three decades later Bose [20, p. 3595] too contrasted the early release of PPT and the subsequent delays:
The provisional figures for the total population in India and the states, were released with lightning speed on March 26, 2001. Considering that the revisional round of the [2001] census enumeration was over only on March 5 it was a remarkable achievement indeed. But alas, not even the key tables have been brought out so far and it is unlikely that the main tables will be published before the end of this year [2004]. From jet speed we have descended to auto-rickshaw speed.
PPT are not covered in Figs 3–5 that compare the delays in the release of different reports as the former are released within weeks after enumeration, whereas the rest of the reports appear at least a year later. In the remainder of this section, we will examine the delays in the release of General Population Tables (GPT),1616 Post-Enumeration Survey (PES)1717 report and data on identity – religion, caste and language.
3.1Desirable schedule
The Census aspires, and is exhorted by others, to make results available “as early as possible so that their usefulness and the extent of their interest may not be diminished” and also accepts the need to “fix the target dates for publication well in advance” [55]. The National Statistical Commission, which submitted its report a few months after the 2001 Census, recommended that “the census organisation must give the highest priority to speedy data entry and processing of the Census 2001 to bring out all the final tables within a period of three years. Similar timetable should be prepared for all future decennial population censuses” [56, Section 9.2.16, emphasis added].1818 Most recently, the proposed National Policy on Official Statistics called for the production and publication of core statistics “as per pre-announced calendar, free from Government influence…along with critical analysis regarding the quality of data and implication of the use of data in policy making and administration” [58, Sections 5.1.7 (1), (7)].
The political leadership too believes that speedy release of data is desirable. In 2008, in the run-up to the 2011 Census, the then Union Minister of Home Affairs called for cutting down “the gap between completion of [2011] census and release of data from 4–5 years to 2–3 years” [82]. A decade later, while reviewing the preparations for the 2021 Census, the Union Minister “emphasised that improvements in design and technological interventions be made so as to ensure that the Census data is finalized within 3 years after conducting of Census. At present it takes around 7 to 8 years to release the complete data” [52].
We will treat three years as the desirable deadline for publication following political and bureaucratic sources. Figure 3 reports (rounded off) delays vis-à-vis the desirable schedule in select census publications. Census publications for 2011 should have been released by March 2014, i.e., three years after enumeration that was completed on 5 March 2011. A few key tables on religion were released in August 2015, i.e., there was a delay of at least 17 months. The language data were released in 2018 with more than four years of delay vis-à-vis the desirable deadline. Both in case of religion and language, the delay increased vis-à-vis the last census. The caste data were, however, released about two years after enumeration in 2013. So, there was no delay vis-à-vis the desirable schedule. More generally, while caste data have been released without much delay, the delays have grown over the years in case of religion and language.
GPT reports were initially released within three years of enumeration. Since 1971 the reports have been released at least four years after enumeration except in 1991 when the reports were released within three years. The complete GPT report for the 2011 Census has not yet been published even eight years after enumeration, but select tables of the report have been released on the census website in the form of Microsoft Excel files.
The 2011 PES report was released on time. PES reports have generally been released within three years except in 2001, when there was a delay of seven years. Commenting on the delay Bose [21, pp. 14–15] pointed out that:
while the preliminary headcount figures of the 2001 Census were made available to the public within a few weeks of the census enumeration (and the final population figures within a few months), the report on the PES was ready in June 2006 but was not released till mid-April 2008.
He added that the delay is explained by political considerations:
the deliberations of the Delimitation Commission’s work adjusting seats for Parliament and state assemblies, it was thought prudent not to release the PES figures to avoid needless political controversies. So the delay was in spite of the hard work put in by the census commissioner and his colleagues [21, p. 16].
3.2Usual schedule
The government needs census tables on Scheduled Castes and Scheduled Tribes (SC&ST) to fulfil certain constitutionally mandated responsibilities toward the weaker sections of the society. Since 1951 these tables have been released within two (three) years of enumeration in four (six) out of seven censuses. Thus, two years can be considered as the usual schedule of release of the SC&ST tables. These tables have been released without (much) delay after most censuses (Fig. 4).
The religion data were released within a year or two of enumeration until the 1970s. If we consider two years as the usual schedule of release for religion data, the data were released with a delay of at least one (1981 and 2001) or two (1991 and 2011) years in later years (Fig. 4). Only one table from the 2011 Census was released in 2015, with the rest being released in instalments over the next two years.
The 1951 and 1961 language data were released within three years of enumeration, but the delay in the release has been growing since 1971, when Bangl-adesh seceded from Pakistan on linguistic grounds, among others. The 1971 language data ought to have been released by 1974 as per the precedent, but were released after a delay of two years in 1976 even though the Census had already published a few reports on language by 1972. As pointed out below, the delay was necessitated by a drastic reorganisation of the language data in the aftermath of the formation of Bangladesh.
There has been a change this time in the grouping of languages/mother-tongues. Table C-V (A & B) gives figures for languages/mother-tongues each of which has returned 10,000 or more speakers at the all-India level in 1971. The figures now presented supersede all previous figures published earlier on a provisional basis in the Pocket Book of population statistics [published in 1972] and Census centenary monograph no. 10 [published in 1972] or in the District census handbooks of Gujarat State (part X-C). [44, p. i, pp. 6–7, emphasis added]
The language tables of the next three censuses were released six years after enumeration, which amounts to a delay of three years vis-à-vis the usual schedule. The 2011 language data were released seven years after enumeration, i.e., a delay of four years (Fig. 4).
3.3Feasible schedule
The gap between enumeration and release of religion data was about two years in case of the 1951 and 1961 Census, which reduced to one year in the 1971 Census. However, this improvement could not be sustained and we have seen varying delays since then. It is difficult to judge feasibility of the speedy publication from the outside as it depends on organisational capacities about which information is not available in public.1919 We can, however, infer the feasible timetable in case of religion tables because of the inter-linkage between caste and religion of individuals. This inter-linkage allows the identification of the date by which the data had already been processed and, therefore, the estimation of the extent of delay [68].
The explanatory note to the eighth question of the Household Schedule of the 2011 Census links the identification of the Scheduled Castes to their religious affiliation that is canvassed in the preceding question. This means that the caste and religion data have to be sorted simultaneously [48, p. 73][68]. Not coincidentally, until 1981, the data on Scheduled Castes and Scheduled Tribes and the data on religion were mostly released in the same year or within a year of each other.
The data on caste and tribe from the 2011 Census were available on 30 April 2013, when the Primary Census Abstract (PCA) was released. It was hoped that other tables would be released sooner than expected because the PCA was released “a year ahead of [the publication] schedule” [51]. There is another reason why it was hoped that the 2011 Census will see faster processing of data. The delay after the 2001 Census was attributed to a rare conjunction of “new” tasks related to the delimitation of electoral constituencies after a gap of 25 years and a major revision of the lists of Scheduled Castes and Scheduled Tribes and the National Industrial Classification [11, p. 3596][20]. So, the 2011 Census, which was a normal census year, should have seen a reduction in delays.
However, just as happened after the 2001 Census [33, p. 4304], the union government did not release the 2011 religion data and left the matter to its successor’s discretion.2020 Observers, both within and outside India, alleged that the 2011 Census data on religion were not released due to electoral considerations [84]. The Bharatiya Janata Party (BJP), the main opposition party, claimed that the release of 2011 Census data for religion was being delayed to save the ruling party embarrassment arising out of the poor condition of Muslims [83] and promised to overhaul of the statistical system by making real time data and big data part of policy-making [18].2121
The PCA containing data on Scheduled Castes and Scheduled Tribes had been released in April 2013, while the religion data were released with a delay of 27 months in August 2015 (Fig. 5). One could still argue that the religion data were not fully processed by April 2013. However, that is unlikely as there has been no innovation in religion tables of the 2011 Census. In fact, only Microsoft Excel tables on six major religions were released on 3 August 2015. So, the delay cannot even be justified by arguing that additional time was needed to prepare a detailed report on religion or process the data for non-major religions.
In fact, some of the religion tables seem to have been leaked/released in January 2015 and were carried by a few national dailies [see, for instance [86]]. The data released in August 2015 matched the data leaked in January. In fact, the Registrar General and Census Commissioner of India admitted that his department had “been ready [with the 2011 data] for quite some time but there were a series of elections so we were not releasing it for some time” [79].2222 The Registrar General suggested that this was an administrative rather than a political decision. Eventually, the data were eventually released ahead of crucial state assembly elections in Bihar, Assam and West Bengal, all of which have significant Muslim populations, and it was alleged that the timing of the release was politically motivated.2323 Indeed, “Once there is a delay in releasing data it is impossible to find a politically non-controversial opportunity for release” [68].
Further, it can be argued that it should be feasible to release data on language quickly. Before 1971 the Census used to publish detailed data on all languages reported by respondents. Thereafter it has been publishing data on only languages spoken by more than 10,000 persons, clubbing the rest as ‘others.’ The language data from the 1951 and 1961 Census were released within three years of enumeration. So, we can say that three years is a conservative estimate of the feasible schedule. The delays should have reduced with the reduction in the volume of language data being released and introduction of computers for data processing technologies in 1971. Delays have, however, grown since 1971 (Fig. 5).
4.Concluding remarks
Delays between enumeration and publication of results limit the utility of census data for administration, policy-making and research [20]. If the delay is long, the data might become obsolete for certain purposes and even suspect in the eyes of users [80, p. 12]. Such obsolescence may affect government and business decision-making. For instance, census data are used by governments for urban planning and deciding federal redistribution, while businesses use the data for information on consumer characteristics and for demand forecasting. India has seen growing delays in the release of major databases amidst technocratisation of policy-making, public professions of faith in evidence based policy-making and fascination with big data. While governments promise more data, they fail to release data collected at a considerable expense. So, there is a mismatch between the practice and policy commitments of the government, including the political class and bureaucracy.
The Census of India takes pride in its pioneering use of latest technologies in data processing, analysis and dissemination, but delays have, in fact, grown after the introduction of advanced technologies. Political apathy and/or interference and, possibly, the time required to learn to handle new technologies2424 seem to have more than neutralised the potential reduction in delays due to technological improvements. Delays in the publication of the 2001 PES report, 2001 and 2011 religion data and post-1971 language data are cases in point.
The delays can be understood in different ways. Firstly, delays might reflect an unwillingness of the statistical system to face public scrutiny. The quality of statistics is affected in the absence of cross-examination [69, p. 43]. The absence of scrutiny pushes the system into a vicious cycle leading to further deterioration of the quality of statistics.
Secondly, insofar as government statistics can be treated as ‘public goods,’2525 the growing delays could be treated as an indicator of the general decline in the provision of public goods in the country. The poor quality of government statistics affects both policy-making and public debate in addition to affecting the quality of data that use government statistics as inputs, e.g., the census serves as the sampling frame for sample surveys.
Thirdly, the increase in delays in the release of government statistics can also be treated as an indicator of the growing political interference with government’s statistical machinery.2626 Recall that the criteria for classifying languages were abruptly revised after the creation of Bangladesh on linguistic grounds and a fresh report was issued that superseded the reports for the 1971 Census based on the earlier criteria. This led to the delayed publication of the 1971 language tables. Engineer [33, p. 4304] argued that the religion wise population figures from the 2001 Census were delayed ‘by the BJP [Bharatiya Janata Party]-led government on account of the Lok Sabha [parliament] elections.’2727 A similar case can be made with regard to the non-release of the 2011 Census data on religion first by the Congress government before the 2014 elections and later by the BJP [68]. Srinivasan [76, p. 304] argues that “publication delays, unless politically or otherwise motivated, do not raise questions of credibility” of data. However, the political aspect cannot be overlooked as the 2001 and 2011 Census data on religion were released only after crucial elections even though in both instances the statistical bureaucracy suggested that the data were ready for release [79, 11, 21].2828
Census is not alone in attracting political interference though. The release of UNICEF-aided Rapid Survey on Children was allegedly suppressed for some states as it showed child immunisation in certain politically and economically important states lagged behind some of the poorer states [85]. In the run-up to the 2014 parliamentary elections, it was argued that the quinquennial round of the 2009–10 survey conducted by the National Sample Survey Office (NSSO) was repeated in 2011–12 due to political interference [27].2929 When National Family Health Survey (NFHS) was allegedly “called off”, the Congress-led UPA government was accused of cancelling data collection to “suppress
Fourthly, the release of census data can be seen as a part of a continuum with prompt release and no release being the two ends of the continuum. Several conflict ridden countries have seen significant and sustained delays, reductions in the scope of census, etc. Unless India’s official statistical system is insulated from government and political interference it might slip toward the wrong end of the continuum. Focusing specifically on religion and language data from census, the growing delays can be read as symptoms of the deepening communal crisis. The delays in the release of religion data have been growing since 1981, which not coincidentally was also the period of the growing communalisation of Indian politics.
Notes
1 As per the World Bank’s Statistical Capacity Indicator (SCI), a composite score assessing the capacity of a country’s statistical system, India scored 91.1 (out of 100) in 2017 compared to the mean SCI of 75 for 140 developing countries [99].
2 Discussions on content errors in India’s census data include contributions on tribe [70, pp. 24–25],[35, p. 37],[67, 94], language [23, 37] and religion [14, 37]. Contributions on coverage errors include Agrawal and Kumar [1, 4] and Guilmoto and Rajan [62]. Also, see Barrier [12] and Bose et al. [22].
3 Other official data and reports have also been released after considerable delays, partially released or not released. There have been delays in the release of the results from livestock census [71, p. 277], surveys on health and nutrition [29], administrative data on agriculture [49, 71] and survey data on caste [87] and employment [92]. Reports on the condition of tribes [88] and a study on unaccounted incomes [16] were not released.
4 Initially, only one migration table was released a few years after the 2011 Census. After that several other tables were released in July 2019. Key tables such as D1 (Population classified by place of birth and Sex – 2011) and D2 (Migrants classified by place of last residence, sex and duration of residence in place of enumeration – 2011) were released only in September 2019.
5 India’s population grew by about 120 per cent between 1971 and 2011, while the number of questions in the household schedule of the Census increased from 17 to 29. This amounts to a 277 per cent growth in the number of potential entries between 1971 [17 entries per person] and 2011 [29 entries per person]. During this period digital storage, data transmission and computing capacities grew at a much faster rate than the overall size of the Indian census database. Computers have been used to process census data, at least, since the 1971 Census [95, p. 3823]. India was one of the first countries to use image based Automatic Form Processing technology in the 2001 Census [10] and adopted the Intelligent Character Recognition technology in 2011 [26]. Elsewhere we have shown that until recently errors in maps [2], censuses [1, 4] and household sample surveys [3] of the state of Nagaland in India grew despite improvements in data processing technologies.
6 The release of unannotated tables restricts the availability of meta-data. Even elementary facts such as the dates of release/publication are not available for most tables of the 2011 Census.
7 Pakistan postponed census on several occasions during the last two decades due to natural calamities, among other things [98]. In Maldives, the 2005 quinquennial census was postponed to 2006 due to the December 2004 Tsunami [59]. The 2011 Census in New Zealand had to be cancelled because of a major earthquake in Christchurch in February and was conducted in 2013. This was the first time since 1951 that the island country missed the quinquennial national census [78].
8 After the late 1970s/early 1980s, other countries in India’s neighbourhood such as Afghanistan, Myanmar and Sri Lanka failed to conduct countrywide censuses due to disturbed conditions. In war torn Bosnia and Herzegovina, the 2013 Census was conducted more than two decades after the last census [73].
9 The Sentinelese have not been enumerated after 1971 either. The figures published by the Census are estimates based on observation from a distance.
10 Elvers and Rosen [32, p. 7] suggest that timeliness can be assessed from the perspectives of frequency (“repeated surveys are usually produced according to a regular scheme”), production time (“the lag between the reference time point (or end of the reference period) and the time for publication of a statistic”) and punctuality (“the agreement between promised and factual dissemination time”). Our discussion is confined to the last two.
11 Incidentally, even in recent decades the delay in the release of district census handbooks of a few states was attributed to the non-allotment of government printing presses [46, p. 44].
12 The Office of the Registrar General of India seems to have declared a timetable of publications for early censuses of independent India [for instance, 41]. Visaria [97, p. 206] refers to a provisional target for the publication of main reports of the 1971 Census. We have not come across declared timelines for publication for subsequent censuses.
13 The time interval between the release of Provisional Population Totals and the last publication can also be used as a measure of the overall delay.
14 This level is relevant only for a few publications such as the Post-Enumeration Survey reports.
15 As per the Census Rules 1990 (Art 5(g)), Charge Officers have to provide provisional population totals for sub-districts under their supervision within a week of completion of census.
16 GPT reports contain, inter alia, a ‘General Note’ note on census operations, area estimates and information on the number of villages and towns and inter-censal changes in borders of administrative divisions.
17 PES reports present the results of surveys conducted after census to quantify the omission and duplication in enumeration and response errors.
18 The National Data Sharing and Accessibility Policy, 2012 reminds data collection agencies that “Access to data generated from public funding should be easy, timely, user friendly and web-based without any process of registration/authorization” (emphasis added). The policy does not apply to census though.
19 Workload of the statistical agencies has been pointed out to be an important reason for delays. In the case of NSSO, bottlenecks in data processing have been cited as one of reasons for the delay in the release of survey reports [93]. Bhalla [15] draws attention to problems related to workforce, while Vidwans [96, p. 3945] highlights the “massive tabulation plans arising out [of] users’ anxiety to include in them as many tables as possible” (also see [76, p. 304, p. 306]). The census possibly faces similar problems [56, Section 9.2.8].
20 Commenting on the Africa’s statistical tragedy Devarajan [31, p. S14] points out that “If the estimate takes place during an election year, there is a strong tendency to keep the results under wraps. Worse still, there is a tendency to drag one’s feet in completing the survey” (also see [3, p. 13][32, p. 7]).
21 It was suggested that the census was going to reveal a higher population share of Muslims and that would have allowed the Bharatiya Janata Party (BJP), which was in the opposition at that time, to whip up Hindu nationalist sentiments. For the stand of the party on religious demography see [19]. For the colonial origins and post-colonial catalysts of communalisation of the census in India see Bhagat [14] and Datta [30] (also see [13, pp. 9–11],[6, pp. 88–91]).
22 Even after the 2001 Census, the then Registrar General said that “due to preponement of the general elections we could not publish several data set which were ready” [11, p. 3862].
23 Kumar [68] questions the empirical basis of the claim that the release was deliberately timed to influence the Bihar assembly elections.
24 Visaria [97, p. 206, 209] attributes the delay in the release of 1971 reports to “the absence of any previous experience of a large-scale use of electronic data processing in tabulation.” Also, see Bose [20, pp. 3595–3596] for a related observation on the 2001 Census.
25 Heine and Oltmanns [63, p. 207] argue that ‘data from the statistical infrastructure can be ascribed the characteristics of public goods, because statistical data can be consumed on a non-competing basis? The marginal costs of production are zero and therefore the price-mechanism does not work.’
26 Taylor [81, p. 13] suggests another way of understanding delays. He argues that “Policymakers and politicians
27 Writing in response to Bose [20], who highlighted the delays in the publication of results of the 2001 Census and suggested administrative reforms, the then Registrar General and Census Commissioner admitted that the release of some of the reports was interrupted due to earlier than expected elections, but he also situated the delay in the larger context. He added that “without any additional increase in the staff” his “organization had to put in tremendous amount of effort in reorganizing the data for the delimitation of the parliamentary and assembly constituencies [after a gap of three decades], first based on the 1991 Census and then following the constitutional amendment
28 Gill [37] has drawn attention to the possible connivance of the government in the manipulation of religion statistics for the state of Punjab.
29 Nigeria’s 1962 Census had to be repeated in 1963 due to concerns about the quality of data. The next census was conducted in 1973, but it too proved to be controversial and the results were not published [60].
30 Others argued that the “negative media coverage of malnutrition numbers from NFHS-3 meant that government decided to not hold the fourth one” [64].
Acknowledgments
The authors are grateful to two anonymous referees for helpful comments. The usual disclaimer applies.
References
[1] | Agrawal A, Kumar V. Nagaland’s Demographic Somersault. Economic and Political Weekly. (2013) ; 48: (39): 69-74. |
[2] | Agrawal A, Kumar V. Cartographic conflicts within a union: Finding land for Nagaland in India. Political Geography. (2017) ; 61: : 123-147. |
[3] | Agrawal A, Kumar V. NSSO Surveys along India’s Periphery: Data Quality and Implications. Azim Premji University Working Paper Series. (2017) ; No. 9. |
[4] | Agrawal A, Kumar V. Community, Numbers and Politics in Nagaland. In: WoutersJJP, TunyiZ, editors. Democracy in Nagaland: Tribes, Traditions, Tensions. Kohima: Highlander Press; (2018) . pp. 57–84. |
[5] | Agrawal A, Kumar V. Data delays are denying India access to good policy. East Asia Forum. (2018) February 10. |
[6] | Alonso W, Starr P. A Nation of Numbers Watchers. The Wilson Quarterly. (1985) ; 9: (3): 92–96. |
[7] | Bailar BA. Who controls the release of statistical data? Statistical Journal of the IAOS. (2011) ; 27: s: 53-56. |
[8] | Bandara H. Delay in publishing population and census results. The Sunday Times. 2012; November 4. [cited 2019 October 3] Available from http://www.sundaytimes.lk/121104/news/delay-in-publishing-population-and-census-results-19382.html. |
[9] | Banerjee A, Bardhan P, Somanathan R, Srinivasan TN. From being world leader in surveys, India is now facing a serious data problem. The Economic Times. (2018) April 4. |
[10] | Banthia JK. Mobilising Support for India’s Census: Constraints and Challenges. In: Population and Housing Censuses: Strategies for Reducing Costs, Population and Development Series, UNFPA. (2002) . |
[11] | Banthia JK. Census Goldmine. Economic and Political Weekly. (2004) ; 39: (35): 3862. |
[12] | Barrier NG, editor. The Census in British India: New Perspectives. New Delhi: Manohar Publications; (1981) . |
[13] | Basu AM. The “Politicization” of Fertility to Achieve Non-Demographic Objectives. Population Studies. (1997) ; 51: (1): 5-18. |
[14] | Bhagat RB. Census and the Construction of Communalism in India. Economic and Political Weekly. (2001) ; 36: (46/47): 4352-4356. |
[15] | Bhalla S. Behind the Post-1991 ‘Challenge’ to the Functional Efficiency of Established Statistical Institutions. Economic and Political Weekly. (2014) ; 49: (7): 43-50. |
[16] | Bhattacharya AK. A 1,000-page Study on Unaccounted Incomes in India Which Has Not Been Made Public, Economic and Political Weekly. (2017) ; 52: (17). |
[17] | Biemer PP. Total Survey Error Design, Implementation, and Evaluation. Public Opinion Quarterly. (2010) ; 74: (5): 817-848. |
[18] | BJP. Election Manifesto 2014. Bharatiya Janata Party. 2014. [cited 2019 October 3] Available from https://www.thehindu.com/multimedia/archive/01830/BJP_election_manif_1830927a.pdf. |
[19] | BJP. ’Ideological prejudice manifests in the public life.’ No date. [cited 2019 October 3] Available from http://www.bjp.org/images/publications/ce.pdf. |
[20] | Bose A. Census Goldmine: Dissemination of 2001 Data. Economic and Political Weekly. (2004) ; 39: (32): 3595-3597. |
[21] | Bose A. Accuracy of the 2001 Census: Highlights of Post-Enumeration Survey. Economic and Political Weekly. (2008) ; 43: (22): 14-16. |
[22] | Bose A, Gupta DB, Raychaudhuri G, editors. Population Statistics in India (Database in Indian Economy Volume III). New Delhi: Vikas, (1977) . |
[23] | Brass PR. Language, Religion and Politics in North India. New York: Cambridge University Press, (1974) . |
[24] | Bremner J. Demand for Demographic Data in Ethiopia – Behind the Numbers. Population Reference Bureau, (2008) . |
[25] | CBC. 2006 census results delayed amid problems. Canadian Broadcasting Corporation. 2007 February 13 [cited 2019 October 03]. Available from https://www.cbc.ca/news/canada/2006-census-results-delayed-amid-problems-1.676358. |
[26] | Chandramouli C. Census of India 2011–A Story of Innovations. Press Information Bureau, (2011) August 16. |
[27] | Chandrasekhar CP, Ghosh J. The employment bottleneck. Business Line. (2013) July 8. |
[28] | Chandrasekharan S. Bhutan: Discrepancy in Population figures: Need for Caution? South Asia Analysis Group. (2013) ; Update No. 102. |
[29] | Dandona R, Pandey A, Dandona L. A review of national health surveys in India. Bulletin of World Health Organisation. (2016) ; 94: : 286-296A. |
[30] | Datta PK. Carving blocs: communal ideology in early twentieth-century Bengal. New Delhi: Oxford University Press, (1999) . |
[31] | Devarajan S. ‘Africa’s Statistical Tragedy’. Review of Income and Wealth. (2013) ; 59: : S9-S15. |
[32] | Elvers E, Rosen B. Quality Concept for Official Statistics. Statistics Sweden, R&D Report Research – Methods – Development. (1997) ; No. 2. |
[33] | Engineer AA. ‘A Handy Tool for Anti-Minorityism’. Economic and Political Weekly. (2004) ; 39: (39): 4304-4305. |
[34] | Fawehinmi F. How Many are You? The story of how Nigeria’s census figures became weaponized. Quartz Africa. (2018) ; March 6. |
[35] | Fuchs S. Central tribes. Seminar. (1960) ; 14: : 35-38. |
[36] | Geertz C. The Interpretation of Cultures: Selected Essays. New York: Basic Books; (1973) . |
[37] | Gill MS. Politics of Population Census Data in India. Economic and Political Weekly. (2007) ; 42: (3): 241-249. |
[38] | Goble P. Unpublished Census Provides Rare and Unvarnished Look at Turkmenistan. Eurasia Daily Monitor. (2015) ; 12: (26). |
[39] | GoI/Government of India. Census of India Paper No. 6, Estimation of Birth and Death Rates in India during 1941-50–1951 Census. New Delhi: Government of India; (1954) . |
[40] | GoI. Census of India 1961, Series 1, India, Part II-A(i), General Population Tables. New Delhi: Registrar General and Census Commissioner; (1964) . |
[41] | GoI. Census of India 1961, A Guide to the 1961 Census Publication Programme. New Delhi: Registrar General and Census Commissioner; (1964) . |
[42] | GoI. Census of India. 1961, Nagaland, Part II-A, General Population Tables. Kohima: Superintendent of Census Operations; (1966) . |
[43] | GoI. Census of India 1971, Series 1, India, Part II-A (i) General Population Tables. New Delhi: Registrar General and Census Commissioner, India; (1975) . |
[44] | GoI. Census of India 1971, Series 1, India, Part II-C(i), Social and Cultural Tables. New Delhi: Registrar General and Census Commissioner; (1976) . |
[45] | GoI. Census of India 1991, Tabulation Plan. New Delhi: Registrar General and Census Commissioner; (1991) . |
[46] | GoI. Census of India 1991, First Conference of the Directors of Census Operations. New Delhi: Registrar General and Census Commissioner; (1999) . |
[47] | GoI. Census of India 1991, Second Conference of the Directors of Census Operations. New Delhi: Registrar General and Census Commissioner; (2000) . |
[48] | GoI. Manual on Vital Statistics. New Delhi: Central Statistical Organisation; (2009) . |
[49] | GoI. Report of the Expert Committee on Agricultural Statistics. New Delhi: Department of Agriculture and Cooperation, Ministry of Agriculture; (2011) . |
[50] | GoI. Census of India 2011, Provisional Population Totals, Paper 1 of 2011, Series 1 India. New Delhi: Office of the Registrar General of India and Census Commissioner; (2011) . |
[51] | GoI. Census 2011: Abstract-Primary Data Released. Press Information Bureau. (2013) April 30. |
[52] | GoI. Union Home Minister reviews the Preparation for Census 2021. Press Information Bureau. (2018) August 31. |
[53] | GoI. History of Census in India. Drop-in-Article on Census – No.5. [cited 2019 October 03] Available from http://censusindia.gov.in/Ad_Campaign/drop_in_articles/05-History_of_Census_in_India.pdf. |
[54] | GoI. Census Data 2001/Metadata. [cited 2019 October 3] Available from http://censusindia.gov.in/Metadata/Metada.htm. |
[55] | GoI. Census operations. [cited 2019 October 3] Available from http://censusindia.gov.in/Data_Products/Library/Indian_perceptive_link/Census_Operation_link/censusoperation.htm#dissemination. |
[56] | GoI. Report of the National Statistical Commission. [cited 2019 October 3] Available from http://mospi.nic.in/report-dr-rangarajan-commission. |
[57] | GoI. Decadal Variation in Population since 1901 (Notes to Table A-2). New Delhi: Office of the Registrar General of India. |
[58] | GoI. National Policy on Official Statistics. [cited 2019 October 03] Available from http://mospi.gov.in/sites/default/files/announcements/draft_policy_17may18.pdf. |
[59] | Government of Maldives. Analytical Report 2006. Population and Housing Census 2006. 2006. [cited 2019 October 03] Available from http://statisticsmaldives.gov.mv/nbs/wp-content/uploads/2006/12/analysiscd/. |
[60] | Government of Nigeria. History of Population Censuses in Nigeria. [cited 2018 October 02] Available from http://population.gov.ng/about-us/history-of-population-censuses-in-nigeria/. |
[61] | Government of Sri Lanka. Census of Population and Housing 2011 – Population of Sri Lanka by District (Preliminary Report (Provisional) – 1). Colombo: Department of Census and Statistics; (2012) . |
[62] | Guilmoto CZ, Rajan SI. Fertility at the District Level in India: Lessons from the 2011 Census. Economic and Political Weekly. (2013) ; 48: (23): 59-70. |
[63] | Heine K, Erich O. Towards a political economy of statistics. Statistical Journal of the IAOS. (2016) ; 32: : 201-209. |
[64] | Himanshu. When data becomes political. Livemint. (2018) Februray 27. |
[65] | Horowitz DL. Ethnic Groups in Conflict. Second Edition. Berkeley: University of California Press; (2000) . |
[66] | Jones KW. Religious Identity and the Indian Census. in Barrier, NG, editor. The Census in British India: New Perspectives. New Delhi: Manohar Publications. (1981) . pp. 73-101. |
[67] | Kulkarni S. Distortion of Census Data on Scheduled Tribes. Economic and Political Weekly. (1991) ; 26: (5): 205-208. |
[68] | Kumar V. The dumbing down of data. The Hoot. (2015) ; September 16. |
[69] | Mahalanobis PC. Statistics as a Key Technology. The American Statistician. (1965) ; 19: (2): 43-46. |
[70] | Mamoria CB. Tribal Demography in India. Allahabad: Kitab Mahal; (1957) . |
[71] | Mishra SN. The Status of Livestock Statistics in India. Journal of lndian Society of Agricultural Statistics. (1999) ; 52: (3): 273-289. |
[72] | Prewitt K. Politics and Science in Census Taking. New York: Russell Sage Foundation and Washington, DC: Population Reference Bureau. (2003) . |
[73] | RFE/RL. Bosnia Braces for Release of Much-Delayed Census Data. Radio Free Europe/Radio Liberty. 2016 June 30. [cited 2019 October 3] Available from https://www.rferl.org/a/bosnia-2013-census-results-ethnic-politics/27829222.html. |
[74] | Ranade MG. Essays on Indian Economics: A Collection of Essays and Speeches, Madras: GA Natesana & Co; (1906) . |
[75] | Shetty SL. Dealing with a Deteriorating Statistical Base. Economic and Political Weekly. (2012) ; 44: (18): 41-44. |
[76] | Srinivasan TN. India’s Statistical System: Critiquing the Report of the National Statistical Commission. Economic and Political Weekly. (2003) ; 38: (4): 303-306. |
[77] | Stats NZ. 2018 Census data release delayed. 2018 November 27. [cited 2019 October 3] Available from https://www.stats.govt.nz/news/2018-census-data-release-delayed. |
[78] | Stats NZ. Dates of New Zealand censuses since 1851. [cited 2019 October 3] Available from http://archive.stats.govt.nz/Census/2013-census/info-about-the-census/intro-to-nz-census/history/historic-census-dates.aspx. |
[79] | Sugden J, Seervai S. Where Are India’s 2011 Census Figures on Religion? The Wall Street Journal. (2015) January 9. |
[80] | Task Force on the Value of Official Statistics. Value of official statistics: Recommendations on promoting, measuring and communicating the value of official statistics. Conference of European Statisticians, Economic Commission for Europe. (2017) . |
[81] | Taylor M. The Political Economy of Statistical Capacity: A Theoretical Approach. Washington, D.C.: IDB; (2016) . |
[82] | The Economic Times. Census 2011: Emphasis on migrants’ Residence. (2008) April 25. |
[83] | The Economic Times. Congress is deliberately holding back Census figures: Harsh Vardhan. (2014) April 18. |
[84] | The Economist. India’s Muslims Growing, and neglected. (2013) March 2. |
[85] | The Economist. Nutrition in India: Of Secrecy and Stunting. (2015) July 4. |
[86] | The Financial Express. Narendra Modi govt releases religious census, Muslim population rises 24 pct in India. (2015) January 22. |
[87] | The Hindu. With SECC delayed, states lag behind on Food Act implementation. (2014) September 12. |
[88] | The Indian Express. UPA panel set tough norms for tribal land, NDA sits on report. (2014) October 9. |
[89] | Aung SY. Still No Date for Release of Census Findings on Ethnic Populations. The Irrawaddy. (2018) February 21. [cited 2019 June 20] Available from https://www.irrawaddy.com/news/burma/still-no-date-release-census-findings-ethnic-populations.html. |
[90] | The Nation. Delaying Census Results. (2017) July 31. |
[91] | The Times of India. National health survey not nixed. (2012) July 30. |
[92] | The Times of India. Jobs data likely by month-end: Officials. (2019) March 16. |
[93] | Vaidyanathan A. Quality, reliability of NSS data at stake. The Hindu. (2001) April 19. |
[94] | Verma AK. Tribal ‘Annihilation’ and ‘Upsurge’ in Uttar Pradesh. Economic and Political Weekly. (2013) ; 48: (51): 52-59. |
[95] | Vidwans SM. Indian Statistical System at the Crossroads (I: Ominous Clouds of Centralisation). Economic and Political Weekly. (2002) ; 37: (37): 3819-3829. |
[96] | Vidwans SM. Indian Statistical System at the Crossroads (Part II: Expansion of National Sample Survey). Economic and Political Weekly. (2002) ; 37: (38): 3943-3955. |
[97] | Visaria P. Publications of the 1971 Census of India. Population Index. (1977) ; 43: (2): 206-212. |
[98] | Weiss AM. Much Ado about Counting: The Conflict over Holding a Census in Pakistan. Asian Survey. (1999) ; 39: (4): 679-693. |
[99] | World Bank. Statistical Capacity Indicator Dashboard. [cited 2019 October 3] Available from http://datatopics.worldbank.org/statisticalcapacity/SCIdashboard.aspx. |
[100] | Natarajan D. Census of India 1971, Intercensal Growth of Population (Analysis of Extracts from All India Census Reports), Census Centenary Monograph No 3. New Delhi: Office of the Registrar General of India. (1972) . |


