
An index-based approach to determine partnership in a register-based census
Abstract
In the preparation of its first register-based census in 2021, Estonia faces a challenge of forming dwelling-based households with inaccurate place of residence data. A pilot census in 2016 overestimated the number of lone parents by 67%. To increase accuracy, an index to measure probability of partnership is being developed. Data on signs of partnership have been collected (marriages, divorces, mutual children, co-ownership of property etc.). In this paper, the partnership index is based on a logistic regression model. Model parameters are estimated and its accuracy is tested on partnership data from the Estonian Labour Force Survey and the Estonian Social Survey. To avoid assigning one person to multiple households, the partnership data is considered as a bipartite graph and stable marriage matching is calculated with Gale-Shapley algorithm. The model accuracy is currently 86%. The work on improving the index continues.
1.Introduction
Estonia has announced that the next census in 2021 will be based on register data. We are in a good position to perform the next census relying on administrative sources: our registers cover a variety of census characteristics. People, addresses and businesses can be identified by unique codes across the registers, and linking different sources is straightforward. The preparation for the register-based census began before the last census (a combined one), in 2010 [1, 2].
The first pilot census was conducted in 2016 (PC2016), with census date on December 31st, 2015. It showed that most of the census characteristics were at least of satisfactory quality. One of the most problematic variables was the place of usual residence [3]. The proportion of people who have not registered to their actual place of residence has been estimated to vary around 20–25%. This is despite the fact that Population Register Act obliges a person to ensure the correctness of his or her residential address in the Population Register [4].
In the register-based census, a household is defined by a household-dwelling concept, as opposed to housekeeping concept [5]. The inaccuracy of place of residence also obscures the composition of households and families, as was seen in PC2016 [3]. The number of lone parents was 67% greater in the PC2016 compared to the Population and Housing Census 2011 (PHC2011). Also, the number of registered or cohabiting partners decreased by 26%. Although this gap can partially be attributed to changes in the family structure over five years as well as to the transition to a dwelling-based definition, the main cause of discrepancy is inadequate place of residence data [6].
In 2015, questions about registering place of residence were added to the Estonian Labour Force Survey. The actual living place coincided with the registered place of residence in 88% of 15–74-year-olds. The main reasons for not registering actual place of residence were because (a) it was not considered necessary, (b) the place of residence was temporary or (c) some local benefits were involved (e.g. free public transport, place in kindergarten or school) [7].
Table 1
Signs of partnership from registers and their prevalence among all quasi-couples and quasi-couples with lone parents
| Sign of partnership | Data source | All quasi-couples | Quasi-couples with lone parents | ||
|---|---|---|---|---|---|
|
| % |
| % | ||
| Marriage | Population Register | 200,382 | 37.4 | 22,143 | 23.0 |
| Half-marriage | Population Register | 1,908 | 0.4 | 99 | 0.1 |
| Declaration of income | Register of Taxable Persons | 78,784 | 14.7 | 11,035 | 11.5 |
| Housing loan | Register of Taxable Persons | 44,456 | 8.3 | 10,135 | 10.5 |
| Real estate, up to 6 co-owners | Land Register | 90,308 | 16.8 | 15,151 | 15.7 |
| Real estate, 2 co-owners | Land Register | 72,820 | 13.6 | 12,712 | 13.2 |
| Place of residence | Population Register | 275,092 | 51.3 | 9,847 | 10.2 |
| Place of residence in other quasi-partner’s property | Population Register, Land Register | 256,085 | 47.8 | 23,679 | 24.6 |
| Subsistence benefit | Social Services and Benefits Registry 2015 | 2,101 | 0.4 | 359 | 0.4 |
| Children, incl. stillbirths | Estonian Medical Birth Registry 2012–2015, Population Register | 166,967 | 31.1 | 70,354 | 73.1 |
| Divorce | Population Register | 86,999 | 16.2 | 15,378 | 16.0 |
| Half-divorce | Population Register | 955 | 0.2 | 44 | 0.0 |
| Maintenance | e-File | 2,096 | 0.4 | 1,292 | 1.3 |
| Partners in survey data | Estonian Labor Force Survey 2015–2017, Estonian Social Survey 2016 | 8,668 | 45.0 | 1,242 | 36.6 |
Inaccurate place of residence data also complicates determining the true population of Estonia. The Population Register is over-covered, because people moving abroad do not always register their leaving (and returning). In a register-based census, residents cannot directly be asked about their status, so the over-coverage has to be addressed indirectly. Statistics Estonia developed a methodology to estimate the probability that a person is residing in Estonia based on his or her activity in a wide range of registers. The residency index on a current year is a function of last year’s residency status and weighted sum of signs of life (SOLs) – binary variables showing activities in registers. In 2017, 29 SOLs from 16 registers were used. The weights depend on individual SOL’s capability of discriminating between residents and non-residents and are allowed to be negative, if they tend to be more prevalent in non-residents. The residency index has been used to estimate the population size in Estonia since 01.01.2016 and for migration flows since 2015 [8, 9].
This paper introduces a potential solution to improve the accuracy of household data by using signs of partnership (SOP) from various registers. Our special interest is to reunite partners who appear as lone parents in a Population Register but in reality live together.
2.Signs of partnership in registers
The index-based method for matching partners in Estonia was proposed by Tiit and Vähi in 2017. The idea is to collect data on SOPs – indicators of presence or absence of partnership between potential partners, typically men and women. Each piece of data, e.g. marriage, co-ownership of property or a mutual child, defines a quasi-couple. In principle, each person may appear in several quasi-couples. It is reasonable to assume that real partners have more in common and share more SOPs [10].
In the current version, we have excluded same-sex couples and people under age of 18 on the pilot census day. We have not set an upper bound for age. Although the vast majority of parents were younger than 50 years, there is no theoretical upper limit for a partner of a lone parent. Using parental data from the Population Register [11] and PHC2011, we also excluded quasi-couples formed by close relatives: parents and children, siblings, grandparents and grandchildren, cousins, uncles, aunts, nephews, nieces.
Table 2
Characteristics of partners in quasi-couple data
| Male | Female | |||
| Total | 387,367 (100) | 412,022 (100) | ||
| Age | –29 | 35,169 (9.2) | 49,282 (12) | |
| 30–49 | 158,557 (41.6) | 164,004 (39.9) | ||
| 50–74 | 158,382 (41.6) | 162,886 (39.7) | ||
| 75+ | 29,038 (7.6) | 34,423 (8.4) | ||
| Not available | 6,221 (1.6) | 1,427 (0.3) | ||
| Mean (SD) | 50 (15.7) | 50 (16.6) | ||
| Number of | 1 | 276,061 (71.3) | 316,198 (76.7) | |
| quasi-partners | 2 | 83,419 (21.5) | 74,839 (18.2) | |
| 3 or more | 6,935 (1.8) | 5,013 (1.2) | ||
| Mean (SD) | 1.4 (0.7) | 1.3 (0.6) | ||
| Maximum | 14 | 37 | ||
| Residents in PC2016 | 354,356 (91.5) | 386,766 (93.9) | ||
| Lone parent in PC2016 | 9,933 (2.6) | 59,962 (14.6) | ||
Table 1 lists the signs of partnership obtained from various administrative data sources, along with their prevalence.
The most obvious sign of partnership is marriage. In principle, married couples should be easily extracted from the Population Register. However, some records are conflicting, e.g. record for person
In Estonia, married couples can optimize taxes by submitting declaration of income together. Also, it is possible to receive tax benefits on housing loan interests. Housing loans are often taken jointly by partners, making it an excellent SOP for detecting cohabiting partners.
Co-ownership of real estate property (apartment, house, land etc.) can be obtained from the Land Register. Most people in Estonia are owners of their homes [12]. We assume that co-ownership is informative SOP only if the number of co-owners of a property is sufficiently small. In this paper, we consider properties of up to six co-owners or exactly two co-owners (i.e. the SOP is defined as an indicator that a quasi-couple has a property that belongs solely to them).
The place of residence also serves as an important SOP. Unique codes for addresses allow to link data in Land Register and Population Register, making it possible to detect couples where one quasi-partner’s place of residence is in other quasi-partner’s property.
When applying for monthly subsistence benefits, the applicant is required to list members of his or her household. Quasi-couples are formed by men and women who received subsistence benefit within the same household on at least one month in 2015.
Parents of underage children (as of pilot census day) formed quasi-couples. This SOP also includes stillbirths from 2012–2015 because stillbirths are too rare – only 170 quasi-couples have a history of stillbirth – to form a separate SOP.
The listed SOPs are all positive i.e. we expect that their presence makes real partnership more likely. We have also defined some SOPs that influence the probability of a partnership in negative direction: divorce (and half-divorce for inconsistent records) and maintenance for children. The data on alimonies is not complete, as we did not have data for maintenance with legal action involved for 2015.
To optimize the parameters for partnership index, we also need to know the true partnership status for a representative sample. For that purpose, we used data from the Estonian Labor Force Survey and Estonian Social Survey – both collect data about household members of an individual.
Altogether, 536,127 quasi-couples with 387,367 men and 412,022 women were formed. For comparison, the Estonian population was 1,315,944 in the PHC2016, with 498,464 adult men and 603,133 women [13].
About half of the quasi-couples share place of residence or have one partner living in the other’s property (Table 1). Ten percent of quasi-couples with at least one quasi-partner classified as a lone parent in PC2016 have common place of residence. That seems to be in conflict with the definition of a lone parent under the dwelling-based household concept. The contradiction is explained by the fact that the criteria for being a couple in PC2016 also required a reasonably small age difference (up to 16 years) and no other potential partners in dwelling, whereas none of those restrictions are applied here.
Table 3
Additional covariates for modelling (percentage of quasi-couples)
| Partners in survey data | ||
| Yes ( | No ( | |
| Unlikely age difference | ||
| Man at least 20 years older | 0.3 | 12.3 |
| Woman at least 15 years older | 0.1 | 16.0 |
| Years since last positive event | ||
| | 6.2 | 0.9 |
| 1–5 | 15.1 | 2.2 |
| More | 58.3 | 18.0 |
| Years since last negative event | ||
| | 0.2 | 0.9 |
| 1–5 | 0.4 | 4.1 |
| More | 0.9 | 24.0 |
More than a third of quasi-couples are married spouses. Also, 23% of quasi-couples with lone parents are married, which is evidence that in some cases, family members are registered to different dwellings. All quasi-couples with lone parents do not have a mutual child (73% have) as lone parents can also form quasi-couples with others rather than their children’s parents.
Other SOPs are less frequent; half-marriage, half-divorce, subsistence benefits and child maintenance can be considered rare (less than 0.5% of quasi-couples).
Table 2 describes men and women who form quasi-couples. The majority of people are 30–74 years old. In Tiit et al. [6], the comparison of the age distribution between quasi-couples data and the whole population showed that young men have few SOPs, but the probability of having at least one SOP increases with age, exceeding 50% in their thirties. Most people appear in one or two quasi-couples, 1.8% of men and 1.2% of women have three or more possible partners. Over 90% of people were considered Estonian residents at the moment of the pilot census. Three percent of men and 15% of women were classified as lone parents based on place of residence.
When collecting SOPs from registers, we also looked for meaningful dates confirming the existence or non-existence of partnership on that moment. We found dates for both positive events – marriage, most of half-marriages, children’s birthdays, submitting application for subsistence benefit, and negative events – divorce and child maintenance. For the analysis, we use the time between the last event and the pilot census moment. Eighty percent of survey partners and 21% of non-partners had at least one date for a positive event (Table 3), whereas dated negative events were scarcer: 1.5% partners and 29% non-partners had any.
We also calculated the age difference between quasi-partners. Mostly, quasi-partners were of similar age, while large differences were distinctive to non-partners.
3.Model for partnership status
Various models for the partnership index on an earlier version of the dataset are presented in Tiit et al. [6]. The tested models include logistic regression, linear discriminant analysis, weighted sum with frequency ratios or logarithms of frequency ratios as weights, and a combination of all of them. The models give correct answers on 84–86% of quasi-couples.
In this article, we add subsistence benefit and stillbirth data and also propose a general solution for partner selection. As we add more SOPs to the data, it becomes more likely that a person has multiple partners to choose from. Any person can potentially appear in several quasi-couples. Less likely but not impossible is the event that a person has a strong relationship with several quasi-partners. It is natural to select the quasi-partner with the highest index. However, the matter becomes more complicated if the potential partners also have multiple options to choose from. Also, situations may arise where the best potential partner of an individual does not prefer him or her.
Men and women can be viewed as vertices in a graph
A stable marriage problem in mathematics looks for a stable matching between the sets of
In our case, the order of preference is created by the partnership index values. The Gale-Shapley algorithm is implemented in different software packages, for the purpose of this paper we used the matchingR package (v1.2.1) in R 3.3.3.
Table 4
Coefficients of logistical regression for partnership
| Covariate | Regression | (95% confidence | |
| coefficient | interval) | ||
| Intercept | 01 | ( | |
| Marriage | 2. | 16 | (2.04; 2.29) |
| Half-marriage | 2. | 00 | (1.08; 3.11) |
| Declaration of income | 1. | 08 | (0.85; 1.33) |
| Housing loan | 0. | 66 | (0.4; 0.92) |
| Subsistence benefit | 20 | ( | |
| Real estate, | 78 | ( | |
| Real estate, 2 co-owners | 2. | 21 | (1.79; 2.65) |
| Place of residence | 0. | 62 | (0.51; 0.73) |
| Place of residence in other quasi-partner’s property | 0. | 23 | (0.12; 0.34) |
| Number of children, incl. stillbirths | 0. | 12 | (0.02; 0.23) |
| Divorce | 47 | ( | |
| Half-divorce | 38 | ( | |
| Maintenance | 89 | ( | |
| Time since last positive event | 1. | 43 | (1.14; 1.73) |
| Time since last negative event | 0. | 03 | ( |
|
| 64 | ( | |
|
| 84 | ( | |
As a partnership index we used the prediction from the logistic regression model for partnership status. Only records of quasi-couples with known partnership status were included; 20 records with missing values in covariates were also excluded. We used 80% of the remaining 19,133 records to estimate the parameters of the model, and used the other 20% to test its performance.
The problem with partner selection is trivial if there is only one partner to choose from. To not oversimplify the problem, we had to ensure that the test sample includes all possible quasi-partners for each person in the sample. To achieve this goal, we divided the quasi-couples’ graph
Figure 1.
An example of a connected component of quasi-couples’ graph. Each node represents a person, ages are given in the labels. Edge width represents simple sum of SOPs: number of positive SOPs minus number of negative SOPs.
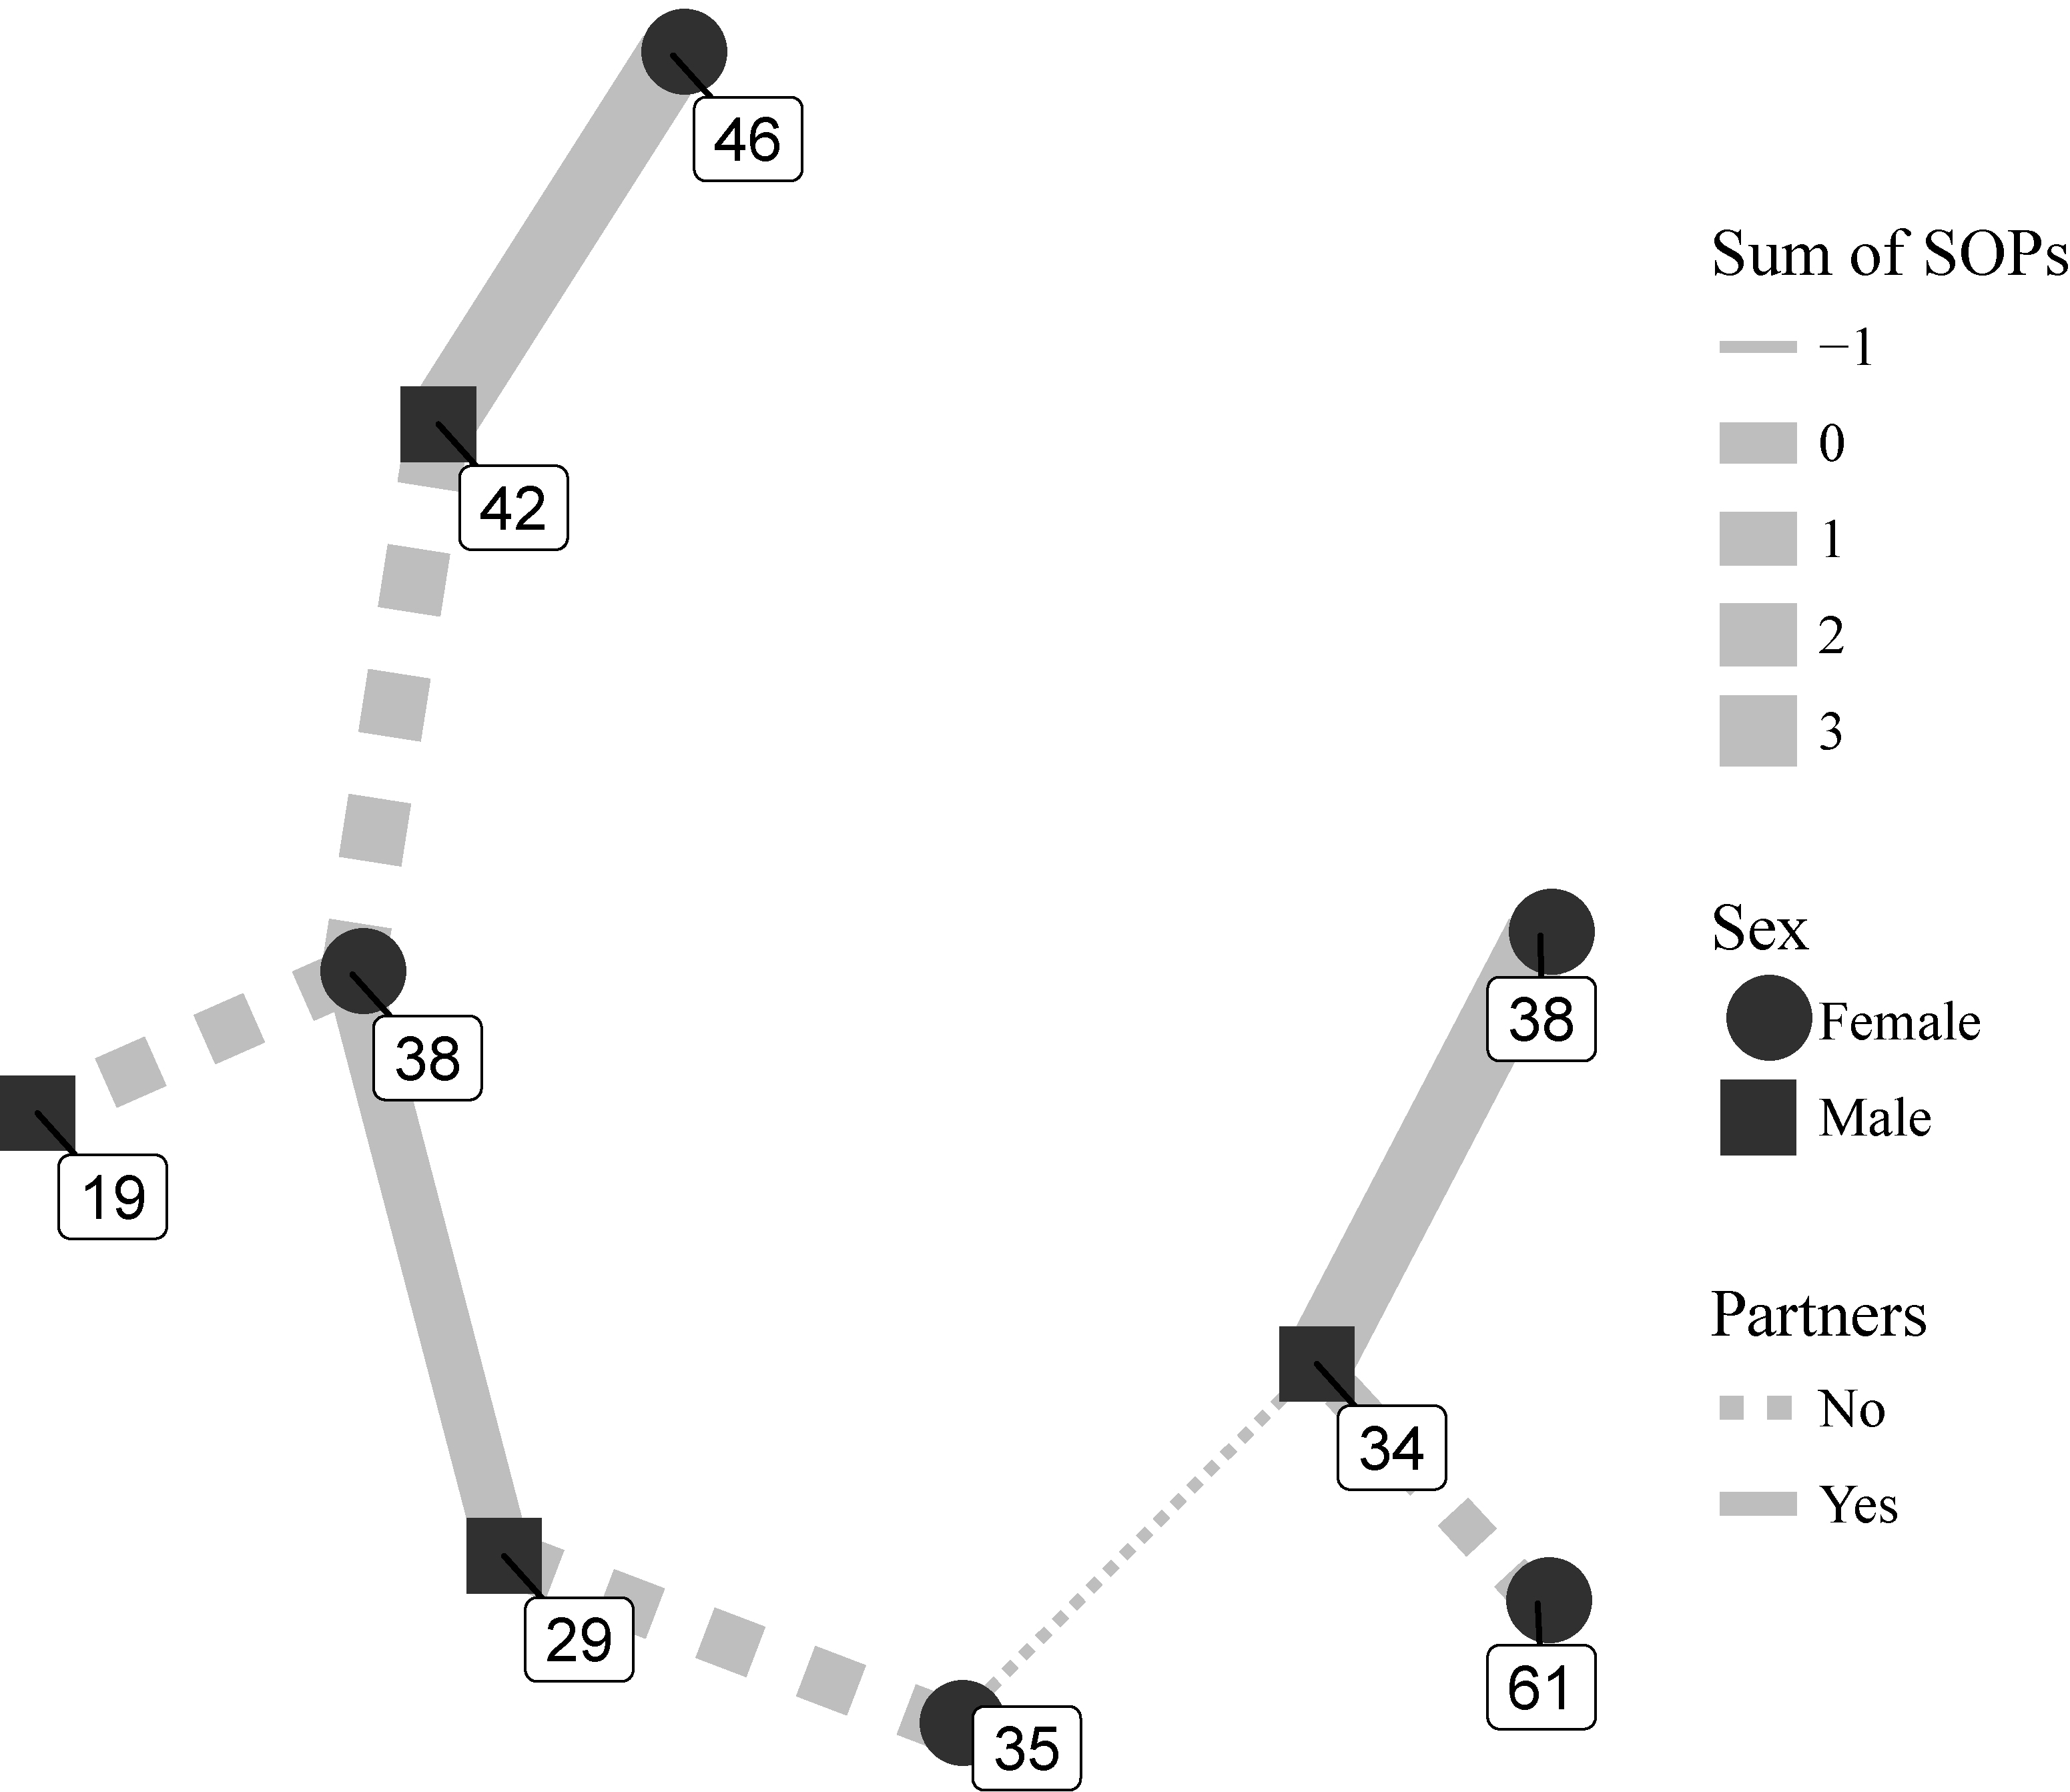
All SOPs from Tables 1 and 3 are included as covariates in the logistic regression model. Time since last event is modelled geometrically, to assign more weight to recent events. If
Table 5
Classification results (percentages)
| Model | Partners by | All quasi-couples | Quasi-couples with | ||
| partnership index | lone parents | ||||
| Partners in survey data | |||||
| No | Yes | No | Yes | ||
| Logistic regression | No | 49.0 | 9.3 | 53.5 | 9.4 |
| Yes | 5.0 | 36.6 | 7.9 | 29.2 | |
| Logistic regression | No | 47.6 | 7.5 | 51.4 | 7.1 |
| Yes | 6.4 | 38.5 | 10.1 | 31.5 | |
Regression coefficients (log odds) are given in Table 4. In general, the coefficients are similar to Tiit et al. [6]. Marriage, half-marriage and co-owning a property strongly increase the odds of partnership. However, if there are more than two owners, the effect is much weaker. Declaration of income, housing loan, number of children and place of residence are also positive signs, as expected, and divorce, half-divorce and child maintenance lower the probability of partnership. Subsistence benefit and time since last negative event are not statistically significant in the model. Other time-related covariates are strong predictors – a recent positive event increases, while unlikely age difference reduces the odds of partnership.
Partnership index is the prediction of the logistic model. To classify quasi-couples into partners and non-partners, we define a threshold that is set on a level that gives same proportion of couples as in original data. If a quasi-couple’s index is higher than the threshold, it is considered a couple.
One shortcoming of this approach is that it does not guarantee each person appearing in one couple at most. By using Gale-Shapley algorithm, we create matching that guarantees determining stable marriages using index values for preferences. In the events of a person having high index values with multiple quasi-partners, the algorithm ensures that only one partner is assigned to him or her. We only include algorithm-generated couples if their index is high enough. A new – lower – threshold is selected to get the same proportion of couples as in original data.
Classification results on test data (3790 quasi-couples) are presented in Table 5. Logistic regression gives correct answers in 85.6% quasi-couples and 82.7% quasi-couples of lone parents. When using stable marriage approach to resolve conflicts, we get 86.1% correct results and 82.9% in lone parents.
There is no major improvement in model accuracy with adding stable marriage approach. This is expected, as there are not many people who would appear in multiple couples anyway – only 0.3% of persons in the test data had an index value exceeding the threshold with more than one quasi-partner. However, some selection method is vital for the census as each person should be assigned to one household only.
4.Further work
The first results of the partnership index with 86% accuracy are promising and it has been stated that the current version could already be used to reconsider the status of lone parents [6].
For wider use in census, the model accuracy must be improved. With current data, the options are limited. Comparison with survey data revealed that 10% of actual couples did not have any SOPs and some non-partners had many.
Adding more SOPs to the dataset should reduce errors of not finding actual couples. Currently, we plan to include data on shared vehicles from the Estonian Traffic Register, fathers using parental benefits, single parent’s child benefit, and paternity leaves from the Estonian National Pension Insurance Register. On the other hand, due to changes in the Income Tax Act, spouses cannot submit joint income tax return as of 2018, thus eliminating the option to use it as a SOP [16].
The model included elapsed times since events as covariates. Viewing erroneously classified records showed that time since last event may sometimes be more important than the quantity of SOPs. For example, after ending a relationship and starting a new one, a person may share more SOPs with ex-partner than his or her actual spouse. It is worth investigating whether giving priority to date information would enhance model behavior.
This example is a reflection of a wider issue. SOPs accumulate over time, therefore new couples may have none. Also, when couples separate, it may not appear immediately in the registers. Thus, there may be a risk of systematic bias in estimating partnership towards older age groups. To provide external validation of partnership index and other new census methodologies, Statistics Estonia has scheduled a control survey in 2018.
5.Conclusions
Household formation in register-based census in Estonia is complicated because place of residence data is inaccurate. Statistics Estonia is developing an index-based measure to estimate the probability of partnership. Partnership index is a function of signs of partnership (e.g. marriage, housing loan) in registers. Index based on logistic regression was accurate on 86% of potential couples. Considering partnership data as a bipartite graph and solving stable marriage problem ensures that each person is used once at most. The partnership index is under active development, with several updates planned in upcoming months to be applied in the next pilot census in 2019.
Acknowledgments
I would like to express my deepest gratitude to colleagues in Statistics Estonia, especially the REGREL team, Kristi Lehto and Ene-Margit Tiit. Also, I am truly grateful to the Selection Committee of IAOS Young Statistician Prize 2018 for the credit and excellent opportunities to share my work.
References
[1] | Matteus D. Roadmap to a register-based census. Q Bull Stat Est (2013) ; 4: : 64-9. |
[2] | Tiit E-M. The Register-Based Population and Housing Census: Methodology and Developments thereof. Q Bull Stat Est (2015) ; 3: : 61-71. |
[3] | Statistics Estonia. Report on the First Trial Census of the Register-Based Population and Housing Census (REGREL). (2017) . |
[4] | Population Register Act [Internet]. Elektrooniline Riigi Teataja Aug 1, (2000) . Available from: https://www.riigiteataja.ee/en/eli/519012018002/consolide. |
[5] | Commission Implementing Regulation (EU) 2017/543 [Internet]. Mar 22, (2017) . Available from: http://eur-lex.europa.eu/legal-content/EN/TXT/?qid=1491315145905&uri=CELEX:32017R0543. |
[6] | Tiit E-M, Visk H, Levenko V. Partnership index. Q Bull Stat Est (2018) ; 1: . |
[7] | Äär H. Coincidence of Actual Place of Residence with Population Register Records. Q Bull Stat Est (2017) ; 1: : 80-3. |
[8] | Maasing E, Tiit E-M, Vähi M. Residency index – a tool for measuring the population size. Acta Comment Univ Tartu Math (2017) ; 21: : 129. doi: 10.12697/ACUTM.2017.21.09. |
[9] | Tiit E-M, Maasing E. Residency Index and Its Applications in Censuses and Population Statistics. Q Bull Stat Est (2016) ; 3: : 53-73. |
[10] | Tiit E-M, Vähi M. Indexes in demographic statistics: a methodology using nonstandard information for solving critical problems. Pap Anthropol (2017) ; 26: : 72. doi: 10.12697/poa.2017.26.1.06. |
[11] | Statistics Estonia. Annual Report 2016 [Internet]. p. 20-1. Available from: https://www.stat.ee/dokumendid/581968. |
[12] | Eurostat. Population by tenure status, level of activity limitation and poverty status [Internet]. Luxembourg: Eurostat; (2017) [cited 2018 Feb 13]. Available from: http://appsso.eurostat.ec.europa.eu/nui/show.do?dataset=hlth_dhc010&lang=en. |
[13] | Statistikaamet. Population at the beginning of the year and mean annual population by sex and age. Tallinn: Statistikaamet; (2017) . |
[14] | Stable marriage problem. In: Wikipedia [Internet]. (2018) [cited 2018 Feb 13]. Available from: https://en.wikipedia.org/w/index.php?title=Stable_marriage_problem&oldid=818301755. |
[15] | Gale D, Shapley LS. College Admissions and the Stability of Marriage. Am Math Mon (1962) ; 69: : 9-15. doi: 10.2307/2312726. |
[16] | Income Tax Act [Internet]. Elektrooniline Riigi Teataja Jan 1, (2000) . Available from: https://www.riigiteataja.ee/en/eli/531012018001/consolide. |


