
Assessing the quality of life in the European Union: The European Index of Life Satisfaction (EILS)
Abstract
Quality of Life (QoL) is a multidimensional phenomenon concerned with the overall well-being of a society or an individual. The indicator-based approach to measuring QoL has attracted the attention of both researchers who propose composite indexes and policy creators who eventually use their results in the process of decision making. To overcome the observed disadvantages of the currently devised composite indexes on QoL, herein we propose a composite index which ranks European Union (EU) member states based on the subjective satisfaction indicators measured by Eurostat. The statistical multivariate analysis on which we base our proposed framework are the Principal Component Analysis (PCA) and the hybrid enhanced Scatter Search Composite I-Distance Indicator (eSS-CIDI) approach which we devised. Our approach could be a foundation for an appropriate framework for ranking EU member states based on the self-evaluated quality of life using a weighting scheme which guaranties high stability of ranks and is free from objectively formed weights.
1.Introduction
The understanding and measurement of human life experience has puzzled and is still puzzling individuals, scientists, and even governments. The term quality of life (QoL) is used to envelop overall life experience of an individual and its personal well-being [1]. QoL can also be defined as the perceived satisfaction or dissatisfaction in various life domains of individuals or groups [2]. Therefore, QoL is a multidimensional concept which encompasses more than just economic power and living standards of individuals [3].
One of the widely popular means to measure the QoL is through GDP, as to one point, as GDP increases, the overall QoL increases [4]. However, the key part of the previous sentence is “to one point” meaning there might be segments of life which are not covered by GDP. Namely, its creator, Kuznets [5] wanted GDP to be a precise and highly specialized tool, devised to quantify only a narrow segment of society’s activity, the marketed economic activity. As such, the GDP is ignorant of natural, social, and human components of community capital which make a vital part of an individuals’ quality of life [4]. Therefore, novel measurements the QoL have emerged.
So far, experts have suggested two types of measurement: the “objective” and “subjective” measurements. The first ones are based on social, economic, and health indicators such as the indicator Life expectancy at birth [3]. On the other hand, “the subjective” measurements rely on the personal experience of the respondents, such as their observed degree to which a particular need was met [2]. Although subjective indicators have been criticized for their methodological flaws, Diener and Lucas [6] provide convincing proof these indicators can be a trustworthy measure of people’s perceived well-being and QoL.
As governing bodies came aware of the importance of their citizens’ self-observed QoL, the QoL slowly but surely became a topic on which countries, regions or even cities could be ranked. A mean of ranking which has seen immense development and application, in particular in the public sector, is the use of composite indexes [7]. The long history of QoL composite indexes dates from 1970’s and the Physical Quality of Life Index devised by Morris [8]. He took into account three indicators, life expectancy, infant mortality, and literacy. United Nations Development Programme (UNDP) stood out as a global organization which in 1990 issued a composite indicator on QoL: the Human Development Index (HDI) [9]. Bérenger and Verdier-Chouchane [10] proposed a composite index of well-being in African countries. More recently, Somarriba and associates [11] ranked European Union (EU) member states using 31 indicators and applying a statistical multivariate
The EU also acknowledged that the GDP, as a stand-alone indicator does not provide sufficient information on how well (or bad) European citizens live [12]. Therefore, the EU initiated the collection of subjective indicators to complement the conventional measures of QoL [13]. The aim of this research is to propose a novel composite index which will rank EU member states based on the perceived satisfaction with the QoL of their citizens using the official data collected by Eurostat. We name the proposed index the European Index of Life Satisfaction (EILS). The EILS should overcome the three observed disadvantages of the currently devised composite indicators of QoL. First, the problem of including just objective indicators in the composite index framework. Second, the issue of high rank instability, and finally, the potential bias in the weighting process.
The work is structured as follows. Section two deals with the framework of the proposed EILS and the QoL indicators published by Eurostat which were chosen to rank EU member states. Section three sets out the proposed weighting methodology, the enhanced Scatter Search Composite I-distance Indicator (eSS-CIDI) approach. The next section sees the obtained results, while the discussion and the concluding remarks are provided in the final chapter.
2.European Index of Life Satisfaction (EILS)
Within the aim of the paper to provide an appropriate framework for evaluating EU member states’ QoL and the satisfaction with life of their citizens, we propose the novel European Index of Life Satisfaction (EILS). As the definition of the concept of QoL is far from easy [11], the process of indicator selection was not a straightforward process. Although there are many QoL indicators available from various renowned databases, according to the aim of the EILS, the best choice of indicators were the subjective QoL indicators devised and collected by the Eurostat [13].
The statistical unit for the observed indicators were individuals living in private households aged 16 and more. According to the European Union Statistics on Income and Living Conditions (EU-SILC) target population, persons living in collective households and in institutions are generally excluded from the target population and therefore were not surveyed. All indicators were collected just once in 2013 [13]. All observed indicators are measured on a scale from 0 to 10 where 0 means not at all satisfied and 10 completely satisfied. Therefore, there was no need to normalize the indicator values prior to weighting and aggregation.
The first two indicators chosen to measure the QoL, Satisfaction with finances and Housing satisfaction, are related to material living conditions. These indicators are collected as material living conditions might constrain an individual in his or hers pursue of needs and wishes [3]. According to the Eurostat [3], it is important to know how satisfied the EU residents are with their occupation as it may undermine one’s life satisfaction. Therefore, we include the indicator Job satisfaction. The next indicator which measures a satisfaction of a QoL dimension is Satisfaction with time use. Since the 1990’s there is recognition that understanding of individuals’ time use is central to the measurement and prediction of QoL [14]. The literature also marked personal relationships as an important factor which influences the overall QoL [15] so the indicator Satisfaction with personal relationships was included in the framework. The EU also believes that the trust in government institutions is closely associated with overall life satisfaction so they issued the collection of the indicator Trust in the legal system which we also take into account [3]. Finally, we include Satisfaction with living environment as Keles [16] in his study explored and showed the relation between QoL and environment.
2.1Suggested EILS framework
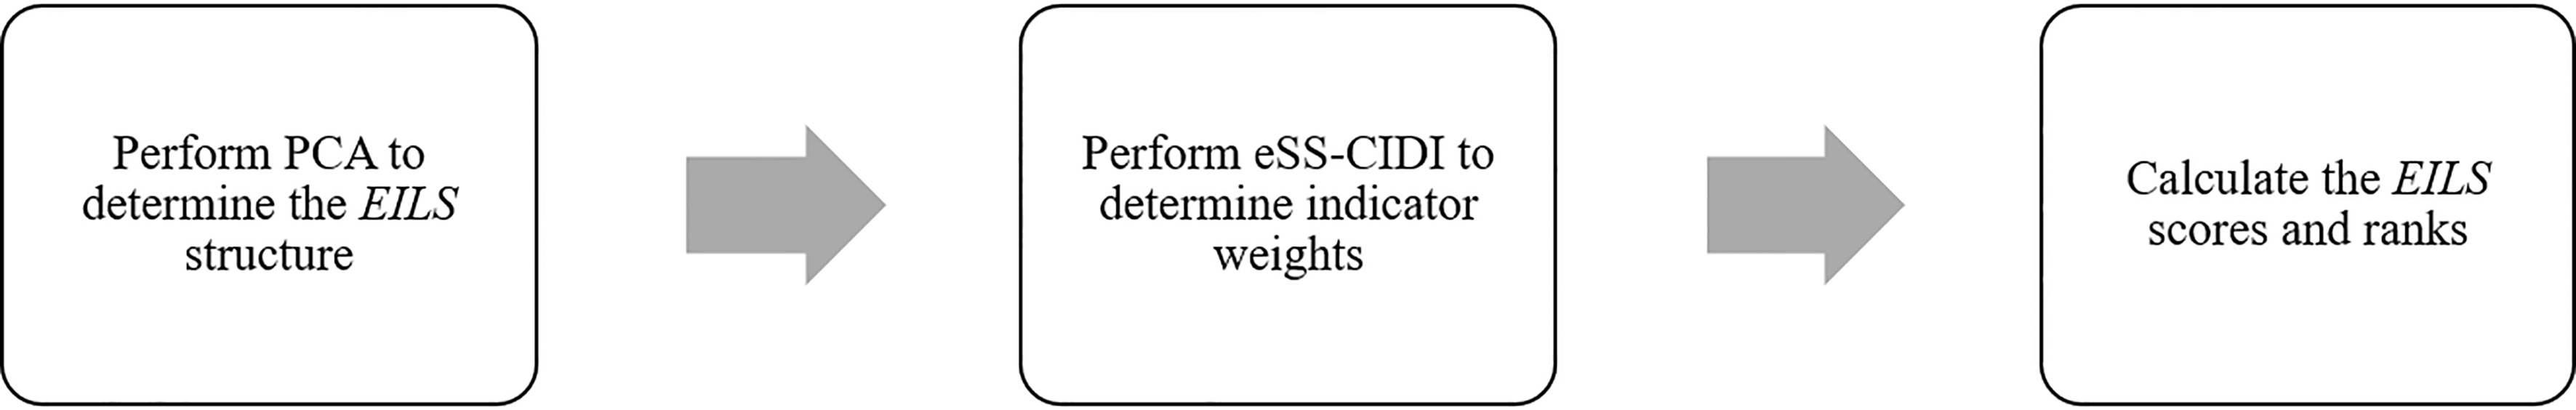
The usually cited steps in the process of creating a composite index that attract the attention of experts are the index structure, the normalization type, and the weighting scheme [17]. As all the observed indicators are on the scale from 0 to 10, there was no need for normalization prior to weighting and aggregation. To resolve the remaining issues, we suggest the Principal Component Analysis (PCA) to propose the index structure and the eSS-CIDI approach for determining indicator weights. The EILS framework is presented in Fig. 1.
Table 1
Descriptive statistics of the observed indicators
| Indicator | Mean | Min | Max | Std |
|---|---|---|---|---|
| Satisfaction with finances | 5.911 | 3.7 | 7.6 | 1.018 |
| Housing satisfaction | 7.514 | 6.0 | 8.4 | 0.578 |
| Job satisfaction | 7.250 | 6.0 | 8.1 | 0.478 |
| Satisfaction with time use | 6.829 | 5.7 | 7.8 | 0.455 |
| Satisfaction with personal relationships | 7.879 | 5.7 | 8.6 | 0.577 |
| Trust in the legal system | 4.736 | 2.7 | 7.5 | 1.292 |
| Satisfaction with living environment | 7.225 | 5.2 | 8.4 | 0.787 |
Figure 1.
The proposed EILS framework.
As the PCA is a widely known and commonly applied statistical analysis, in the following section we will put emphasis on the eSS-CIDI approach which we propose.
3.Enhanced Scatter Search – Composite I-distance Indicator (eSS-CIDI) approach
Our intention is to devise data-driven weights which will create a stable composite index. The stability of a composite indicator is measured through the standard deviation of relative contributions of indicators [18]. The formula is given as [19] where the relative contribution
(1)
The optimization problem that this research attempts to solve is as formulated below:
Minimize (a) Sum of standard deviations of relative contributions of composite index indicators Subject to: (b) Bootstrap CIDI results (c) Sum of weights must equal 1
To constraint the optimization model we propose the bootstrap CIDI methodology. The Composite I-distance methodology (CIDI) is a recently developed methodology for creating composite indexes using the results of the widely applied I-distance method [20, 21]. Namely, the I-distance method has many benefits (e.g. [22]) but it represents the distance of an observed entity from a fictive entity what makes it difficult to compare. Also, there was a growing need to take into account the issues of sensitivity and uncertainty and to compare the data-driven weights and the official weights. Therefore, the CIDI methodology, which overcomes the perceived stepping stone and creates a comparable composite index, using the weights which derive from the I-distance method was created [18].
In a typical application of the CIDI methodology, the researcher would obtain a single data-driven CIDI weighting scheme. But, by performing bootstrap and repeating the CIDI methodology on bootstrap samples, one obtains a confidence interval for each weight, which could be used as weight constraint. Here we opted for the
The enhanced Scatter Search (eSS) algorithm which we propose to implement in our study to solve the optimization problem aims to find the balance between intensification (local search) and diversification (global search) using a small population size, more search directions, and an intensification mechanism in the global phase [25]. Therefore, eSS stands out for its good balance between robustness and efficiency in the global phase and couples with a local search procedure to accelerate the convergence to optimal solutions. The eSS has proved to be an efficient metaheuristic in solving complex-process optimization problems from different fields, providing a good compromise between diversification (exploration by global search) and intensification (local search) [26].
Finally, the objective function of the optimization problem solved using the eSS metaheuristic is given as follows:
(2)
Subject to
(3)
(4)
(5)
(6)
Where
4.Results
The dataset on which the analysis was performed contained all indicator values for 28 EU member states collected for the year 2013. As the dataset was already normalized, the first step in our analysis was to analyse the collected data. The descriptive statistics of the seven observed indicators is given in Table 1.
The mean indicator values show that EU citizens are medium satisfied with five dimensions, while they expressed low satisfaction with finance and the level of trust in the legal system. The EU member states citizens are most satisfied with their relationships (7.879), while they are least satisfied with the legal system (4.736). The standard deviation of the indicator Satisfaction with time use is the lowest, just 0.455, followed by the standard deviation of indicator Job satisfaction, 0.478. Low standard deviation of these indicators indicates there is small difference in satisfaction between EU member states on these two topics. The indicator which attracts attention is the Trust in the legal system for two reasons. First, it is the indicator for which the lowest level of satisfaction has been measured, just 2.7 in Slovenia and second, the standard deviation of this indicator is the highest, 1.292, meaning that the values of this indicator vary more.
The next step in our analysis was to perform the PCA. The Kaiser-Meyer-Olkin Measure of Sampling Adequacy of 0.817 indicates that the variable selection is acceptable for factor analysis [28]. The obtained p value below 0.05 of Bartlett’s test of sphericity showed that the variables are suitable for analysis. The factor analysis with the PCA extraction was conducted. For the interpretation, only eigenvalues greater than one were regarded [17]. The analysis suggested the retention of one dimension which explains 79.414% of variability. This result indicates that the chosen seven indicators should be aggregated into a single dimension.
Table 2
The min and max bootstrap CIDI weights and weights suggested by the eSS-CIDI approach
| Indicator |
|
|
|
|---|---|---|---|
| Satisfaction with finances | 13.6% | 17.9% | 13.6% |
| Housing satisfaction | 12.0% | 16.4% | 16.4% |
| Job satisfaction | 12.5% | 17.0% | 17.0% |
| Satisfaction with time use | 14.3% | 17.7% | 17.7% |
| Satisfaction with personal relationships | 9.1% | 14.3% | 13.8% |
| Trust in the legal system | 10.7% | 16.6% | 10.7% |
| Satisfaction with living environment | 10.8% | 17.9% | 10.8% |
Table 3
Top and bottom EU member states ranked by the EILS
| EU member state | Score | Rank | EU member state | Score | Rank |
|---|---|---|---|---|---|
| Denmark | 8.03 | 1 | Slovak Republic | 6.66 | 19 |
| Finland | 7.90 | 2 | Latvia | 6.64 | 20 |
| Austria | 7.69 | 3 | Cyprus | 6.52 | 21 |
| Sweden | 7.67 | 4 | Spain | 6.51 | 22 |
| Netherlands | 7.63 | 5 | Hungary | 6.44 | 23 |
| Luxembourg | 7.28 | 6 | Italy | 6.32 | 24 |
| Belgium | 7.17 | 7 | Portugal | 6.23 | 25 |
| United Kingdom | 7.13 | 8 | Croatia | 6.16 | 26 |
| Ireland | 7.10 | 9 | Greece | 5.86 | 27 |
| Malta | 7.01 | 10 | Bulgaria | 5.19 | 28 |
To additionally analyse the chosen indicators, correlation analysis was performed. The obtained Pearson’s correlation coefficients between indicators are all positive and statistically significant. It varies from 0.475 (correlation between Trust in the legal system and Satisfaction with personal relationships) to 0.897 (correlation between Job satisfaction and Satisfaction with time use). If the correlation between the indicators is high and in the same direction, then it is likely that they share common factors [17]. The above-presented results again go in hand that the indicators should be aggregated into one composite index. Therefore, we proceed with the application of the eSS-CIDI algorithm.
The first step in the algorithm was to perform the bootstrap CIDI. We performed 1000 iterations with a sample size of 18 (28
In the following step the eSS was performed and the results are also given in Table 2. The most important indicator for the ranking process is Satisfaction with time use, with 17.7% importance, followed by a glimpse less important Job satisfaction, 17.0%. On the other hand, the least significant indicator is the Trust in the legal system, just 10.7%. As it can be observed, the eSS did not assign equal weights to indicators although it could have. The suggested weighting scheme could be interpreted that for a high satisfaction with the QoL it is of value to be satisfied with the job which enables the individual to provide himself with the adequate housing and leaves him with enough free time for leisure and social activities.
After the weights have been devised the values of the EILS were computed. The top and bottom 10 ranked EU member states, EILS score and rank are provided in Table 3.
Table 3 shows that Denmark and Finland top the list, with Austria close behind. As expected, the northern EU member states dominate the rankings, as they take three out of top four ranking places. We can see that Bulgaria and Croatia, as more recent EU member states, found their place at the bottom of the list. Also, the scores placed Greece, Italy and Spain in the lower part of the ranking. In a way, such a result could have been expected, as these countries have been severely hit by the economic crisis [29] which had an effect on their QoL and life satisfaction. Interestingly, Romania, although a recent Member State is ranked 14
5.Discussion and conclusion
Countries worldwide are slowly but surely shifting their policy goals from purely economic to social ones. For example, the kingdom of Bhutan made “gross national happiness” their policy goal [32]. The EU also acknowledged the importance of QoL and social matters and therefore conducted a survey among its citizens to inspect the level of their satisfaction with the current well-being. Herein, we proposed an approach based on official statistics, statistical analysis and optimization method which could help EU member states provide better life to their citizens.
To create the novel European Index of Life Satisfaction (EILS) we took a two-fold approach. First, we applied the PCA to determine the number of dimensions to retain, and second, we conducted the proposed eSS-CIDI approach. The PCA suggested to aggregate the chosen indicators into one dimension. The eSS-CIDI approach suggested unequal weights, whereas the most important indicator for the ranking procedure is Satisfaction with time use.
Our findings make several distinct contributions. First, herein we propose a novel composite index for ranking EU member states using official statistics. Second, we show how can the eSS-CIDI be used in the process of creation a novel composite index. Finally, we provide a ranking list of countries which is based on multiple indicators and is free from expert opinion and potential bias. Above all, the obtained results could be easily used by decision makers and government representatives.
During our research, we identified three future directions of study: framework modification, the application of a hybrid weighting approach, and employment of different weight constraints. The current index consists of seven indicators, but the Eurostat publishes more than 30 indicators on QoL. Most of those indicators are objective and their inclusion in the index framework would be according to the suggestion of Costanza et al. [2] who proposed the use of both subjective and objective indicators of QoL. Next, recent research showed that when it comes to weighting, several different weighting methods should be employed [33]. Therefore, if the EILS framework is to be expanded and the structure of the index is to become two-fold, hybrid weighting approach could be employed [34]. Finally, as the weight constraints of the eSS we used the min and max weights acquired after the bootstrap CIDI. Nevertheless, there are other approaches to constraints. For example, Radojicic et al. [35] used
Based on the foregoing, we believe that the newly proposed eSS-CIDI approach for the construction of composite indices, here employed to create a ranking of EU member states, can initiate further research in the field of composite index creation, weighting procedure and QoL composite indexes.
References
[1] | Malkina-Pykh IG, Pykh YA. Quality-of-life indicators at different scales: Theoretical background. Ecol Indic (2008) ; 8: : 854-62. doi: 10.1016/j.ecolind.2007.01.008. |
[2] | Costanza R, Fisher B, Ali S, Beer C, Bond L, Boumans R, et al. Quality of life: An approach integrating opportunities, human needs, and subjective well-being. Ecol Econ (2007) ; 61: : 267-76. doi: 10.1016/j.ecolecon.2006.02.023. |
[3] | Eurostat. Quality of life Facts and views: 2015 edition. Publications Office of the European Union; (2015) . |
[4] | Costanza R, Hart M, Posner S, Talberth J. Beyond GDP: The Need for New Measures of Progress, Pardee Paper No. 4, Boston: Pardee Center for the Study of the Longer-Range Future, (2009) . |
[5] | Kuznets S. National Income 1929–1932. Washington, DC: (1934) . |
[6] | Diener E, Lucas R. Personality and subjective well-being. In: Kahneman D, Diener E, Schwarz N, editors. Well-Being Found. Hedonic Psychol., New York: (1999) . p. 213-29. |
[7] | Bird SM, Sir David C, Farewell VT, Harvey G, Tim H, Peter C. S. Performance indicators: good, bad, and ugly. J R Stat Soc Ser A (Statistics Soc) (2005) ; 168: : 1-27. doi: 10.1111/j.1467-985X.2004.00333.x. |
[8] | Morris MD. Measuring the condition of the World’s poor: The physical quality of life index. New York: Pergamon Press; (1979) . |
[9] | UNDP. Human Development Report 1990. New York: (1990) . |
[10] | Bérenger V, Verdier-Chouchane A. Multidimensional Measures of Well-Being: Standard of Living and Quality of Life Across Countries. World Dev (2007) ; 35: : 1259-76. doi: 10.1016/j.worlddev.2006.10.011. |
[11] | Somarriba Arechavala N, Zarzosa Espina P, Pena Trapero B. The Economic Crisis and its Effects on the Quality of Life in the European Union. Soc Indic Res (2015) ; 120: : 323-43. doi: 10.1007/s11205-014-0595-9. |
[12] | EUR-Lex. Communication from the Commission to the Council and the European Parliament – GDP and beyond: measuring progress in a changing world 2009. http://eur-lex.europa.eu/legal-content/EN/ALL/?uri=celex:52009DC0433 (accessed January 18, (2018) ). |
[13] | Eurostat. Personal well-being indicators 2013. http//ec.europa.eu/eurostat/cache/metadata/en/ilc_pwb_esms.htm#unit_measure1470211895948 (accessed January 20, (2018) ). |
[14] | Harvey AS. Quality of life and the use of time theory and measurement. J Occup Sci (1993) ; 1: : 27-30. doi: 10.1080/14427591.1993.9686381. |
[15] | Ryff CD, Singer B. Psychological Weil-Being: Meaning, Measurement, and Implications for Psychotherapy Research. Psychother Psychosom (1996) ; 65: : 14-23. doi: 10.1159/000289026. |
[16] | Keles R. The Quality of Life and the Environment. Procedia – Soc Behav Sci (2012) ; 35: : 23-32. doi: 10.1016/j.sbspro.2012.02.059. |
[17] | Nardo M, Saisana M, Saltelli A, Tarantola S, Hoffman A, Giovannini E. Handbook on constructing composite indicators. (2005) . doi: 10.1787/533411815016. |
[18] | Dobrota M, Bulajic M, Bornmann L, Jeremic V. A new approach to the QS university ranking using the composite I-distance indicator: Uncertainty and sensitivity analyses. J Assoc Inf Sci Technol (2016) ; 67: : 200-11. doi: 10.1002/asi.23355. |
[19] | Murias P, de Miguel JC, Rodríguez D. A Composite Indicator for University Quality Assesment: The Case of Spanish Higher Education System. Soc Indic Res (2008) ; 89: : 129-46. doi: 10.1007/s11205-007-9226-z. |
[20] | Jeremic V, Bulajic M, Martic M, Radojicic Z. A fresh approach to evaluating the academic ranking of world universities. Scientometrics (2011) ; 87: : 587-96. doi: 10.1007/s11192-011-0361-6. |
[21] | Maricic M, Kostic-Stankovic M. Towards an impartial Responsible Competitiveness Index: a twofold multivariate I-distance approach. Qual Quant (2016) ; 50: : 103-20. doi: 10.1007/s11135-014-0139-z. |
[22] | Išljamović S, Jeremic V, Petrovic N, Radojicic Z. Colouring the socio-economic development into green: I-distance framework for countries’ welfare evaluation. Qual Quant (2015) ; 49: : 617-29. doi: 10.1007/s11135-014-0012-0. |
[23] | Bickel PJ, Sakov A. On the choice of m in the m out of n bootstrap and its application to confidence bounds for extreme percentiles. Stat Sin (2008) ; 18: : 967-85. |
[24] | De Bin R, Janitza S, Sauerbrei W, Boulesteix AL. Subsampling versus bootstrapping in resampling-based model selection for multivariable regression. Biometrics (2016) ; 72: : 272-80. doi: 10.1111/biom.12381. |
[25] | Egea JA, Balsa-Canto E, Garcia M-SG, Banga JR. Dynamic Optimization of Nonlinear Processes with an Enhanced Scatter Search Method. Ind Eng Chem Res (2009) ; 48: : 4388-401. doi: 10.1021/ie801717t. |
[26] | Otero-Muras I, Banga JR. Multicriteria global optimization for biocircuit design. BMC Syst Biol (2014) ; 8: : 113. doi: 10.1186/s12918-014-0113-3. |
[27] | Radojicic M, Savic G, Jeremic V. Measuring The Efficiency Of Banks: The Bootstrapped I-Distance GAR DEA Approach. Technol Econ Dev Econ (2018) ; 24: : 1581-605. doi: 10.3846/tede.2018.3699. |
[28] | Tabachnick B, Fidell L. Using Multivariate Statistics, 6th Edition. Pearson; (2013) . |
[29] | Zamora-Kapoor A, Coller X. The Effects of the Crisis. Am Behav Sci (2014) ; 58: : 1511-6. doi: 10.1177/0002764214530649. |
[30] | Zagorski K, Evans MDR, Kelley J, Piotrowska K. Does National Income Inequality Affect Individuals’ Quality of Life in Europe? Inequality, Happiness, Finances, and Health. Soc Indic Res (2014) ; 117: : 1089-110. doi: 10.1007/s11205-013-0390-z. |
[31] | Manrai LA, Lascu D-N, Manrai AK. How the Fall of the Iron Curtain Has Affected Consumers’ Perceptions of Urban and Rural Quality of Life in Romania. J East-West Bus (2000) ; 5: : 145-72. doi: 10.1300/J097v05n01_08. |
[32] | Bond M. The pursuit of happiness. New Sci (2003) ; 180: : 440-3. |
[33] | Wang JH, Hopke PK, Hancewicz TM, Zhang SL. Application of modified alternating least squares regression to spectroscopic image analysis. Anal Chim Acta (2003) ; 476: 93-109. doi: 10.1016/S0003-2670(02)01369-7. |
[34] | Maricic M, Bulajic M, Martic M, Dobrota M. Measuring the ict development: the fusion of biased and objective approach. Nav Acad Sci Bull (2015) ; 18: : 326-34. |
[35] | Radojicic M, Savic G, Radovanovic S, Jeremic V. A novel bootstrap dba-dea approach in evaluating efficiency of banks. Nav Acad Sci Bull (2015) ; 18: : 375-84. |


