
Assimilation and coverage of the foreign-born population in administrative records1
Abstract
The U.S. Census Bureau is researching ways to incorporate administrative data in decennial census and survey operations. Critical to this work is an understanding of the coverage of the population by administrative records. Using federal and third party administrative data linked to the American Community Survey (ACS), we evaluate the extent to which administrative records provide data on foreign-born individuals in the ACS and employ multinomial logistic regression techniques to evaluate characteristics of those who are in administrative records relative to those who are not. We find that overall, administrative records provide high coverage of foreign-born individuals in our sample for whom a match can be determined. The odds of being in administrative records are found to be tied to the processes of immigrant assimilation – naturalization, higher English proficiency, educational attainment, and full-time employment are associated with greater odds of being in administrative records. These findings suggest that as immigrants adapt and integrate into U.S. society, they are more likely to be involved in government and commercial processes and programs for which we are including data.
1.Introduction
Administrative records are data collected by federal and state governments in the course of providing services and administering laws such as the tax code, as well as data collected and compiled by third parties for purposes such as marketing analytics. In the current environment of budget constraints and declining respondent cooperation, administrative records can be a cost-effective way to supplement or even replace data collection efforts. For example, administrative records can be used to update and supplement survey frames, inform edit and imputation routines, and construct new estimates. Since administrative records are not typically collected for statistical purposes, however, there may be challenges regarding data quality and coverage of particular populations.
In this study, we examine administrative records coverage of the U.S. immigrant population, which is not only diverse in terms of its demographic and socioeconomic characteristics, but also includes hard-to-reach subpopulations [1, 2, 3]. Administrative records have been used to study wages and employment of the foreign-born population [4], measure immigration and emigration flows [5, 6, 7], and estimate the unauthorized population living in the United States [8, 9]. Much of the research utilizes administrative records from the Department of Homeland Security (DHS) and in previous years from the Immigration and Naturalization Services. The extent to which administrative records that are not from DHS accurately reflect the foreign-born population is beginning to be explored and still not well understood. One recent study finds that Social Security Administration data coverage of foreign-born persons in the Current Population Survey varies by factors related to legal status [10].
This paper expands the literature on administrative records coverage of the foreign born. We ask two main questions: 1) to what extent do a compilation of federal and commercial administrative records provide data on the foreign born, and 2) what characteristics are associated with this coverage. We hypothesize that coverage is associated with the process of assimilation, the gradual and multidimensional process through which immigrants and their offspring adapt, integrate and participate in their host society. We link individual records from the 2006–2010 American Community Survey (ACS) to a compilation of federal and third party administrative records and compare the characteristics of foreign-born individuals who are not found in administrative records to those who are.
Our findings suggest that the administrative records used in this study provide high coverage of foreign-born individuals in the ACS who have received a unique person identifier via our record linkage system, though there is variation in coverage by characteristics. We find more variation in the assignment of unique identifiers, which are required to determine matches to administrative records. As expected, many of the same factors that relate to assimilation processes are also indicators of whether or not foreign-born individuals are assigned unique identifiers and present in administrative records. These findings are important as the Census Bureau continues to evaluate the use of administrative records for data collection and population measurement operations and will assist in determining future areas of research and data acquisition to improve coverage.
2.Literature review
2.1Administrative records
In some countries, particularly in Western Europe, administrative records including vital registration and change of address information provide the basis for maintaining population registers which are used for administrative and in some cases statistical purposes [11, 12]. Independent checks of these registers with census data have shown that registers in Nordic countries such as Belgium, Netherlands, and Luxembourg are quite accurate [13]. One notable example is the case of Denmark, where a central population register was set up in 1968 and where since 1981 there has been a register-based census [12, 14].
The accuracy of population registers is dependent on the ability of administrative records to accurately measure population change. International migration, in particular emigration, unauthorized, and temporary migration can be difficult components to measure [13, 15]. While migration in countries such as Denmark is significant and increasing, the number of immigrants in the United States is much larger, as is the percent undocumented, which both challenge and limit coverage of the foreign born by administrative records [16, 17].
Still, administrative records are increasingly used for statistical purposes in the United States and the Census Bureau is currently exploring additional uses of administrative data in census and survey operations. Two recent studies evaluate coverage of persons in the 2010 Census and 2010 ACS by the same administrative records we use in our analysis [18, 19]. These studies evaluate coverage by race, Hispanic origin, age, and sex as well as geographic and housing factors. However, these evaluations do not include analyses by citizenship or place of birth. Another Census Bureau study evaluates the bias in the assignment of unique identifiers that are required to determine administrative records coverage [20]. This work includes analyses of citizenship status, finding lower rates of assignment of unique identifiers for non-citizens in the ACS compared to natives and naturalized U.S. citizens. Bond et al. [20] also compare results for the 2009 and 2010 ACS and find that record linkage methodological enhancements for 2010 result in diminished biases in the assignment of unique identifiers by many factors, including citizenship status.
While these studies did not focus on nativity, immigration researchers have evaluated Social Security Administration data coverage of the foreign born in the Current Population Survey [10]. This work finds that coverage varies by factors such as country of birth, time in the country, age and other factors expected to be associated with legal status. Bachmeier et al. [10] provide an important understanding of which segments of the foreign-born population are likely found in administrative records. However, their analysis is descriptive and includes a limited number of explanatory variables.
The goal of our paper is to further the understanding of how well administrative records data from a variety of sources cover the foreign-born population. Moreover, we assess how coverage varies by characteristics among foreign-born individuals. We frame our hypotheses of how characteristics may be associated with administrative records coverage around assimilation theories.
2.2Assimilation
Classic assimilation theory posits that immigrant groups become more similar to mainstream society demographically, economically, and culturally over time [21, 22]. Immigrants that have been in a society longer, as well as their offspring, will be more integrated into the host society relative to new immigrants [21]. Measures of assimilation include language, socioeconomic status, residential patterns and spatial concentration, and intermarriage [23]. The theory, formulated based on the experience of European immigrants who arrived in the early 1900s to the United States, assumes straight-line assimilation or convergence of immigrants into the host society [21, 22].
Other researchers argue that immigrant groups follow varied paths towards assimilation. Segmented assimilation theory, proposed as a counter to classic assimilation theory, posits that structural barriers can deter assimilation, resulting in stagnant and declining chances for socioeconomic mobility for some immigrants and their children, while others achieve upward assimilation [24, 25]. Specifically, the human capital that immigrants bring and the reception they encounter in the host country likely influence their respective social and economic assimilation trajectories [26]. Lee and Zhou [27] suggest that interethnic variations in the pathways to socioeconomic assimilation arise from the interplay of immigrants’ understanding of how the world works (“frames” that delineate possibilities), and their access to tangible and intangible resources in co-ethnic communities facilitates or prevents immigrants from reaching such possibilities.
Using assimilation as our theoretical framework, we hypothesize that factors influencing immigrant assimilation affect integration into government programs and third party data and therefore administrative records coverage. We expect that long-term immigrants who have obtained U.S. citizenship – characteristics associated with higher paying jobs, labor force participation, homeownership, and eligibility for government programs – will be more likely to be in administrative records [28, 29, 30, 31, 32, 33]. We also expect socioeconomic status to be tied to coverage – persons in the labor force and those with higher income and educational attainment may be more likely to be in tax data and third party data such as property tax records or credit bureau header information. Race and ethnicity also play a role in assimilation as immigrants of different origins tend to arrive with different socioeconomic characteristics and some groups are more likely to experience discrimination, which can act as a barrier to assimilation [1, 21]. As such, we may find variation in administrative records coverage by race and Hispanic origin.
3.Data and methods
This paper uses data from the 2006–2010 American Community Survey (ACS) and multiple administrative records sources. The ACS is a nationally representative stratified ongoing survey that samples from approximately 295,000 households every month (about 3.5 million households per year).22 The survey includes questions on a variety of demographic, socioeconomic, and household items. Individual and tract-level characteristics used in this analysis are derived primarily from the 2006–2010 ACS data. Additional data from the 2010 Census are used to estimate county population size.
Administrative records from federal agencies and third party vendors are used in this study. Federal data come from Individual Income Tax Returns (IRS 1040) and Information Returns (IRS 1099);33 data from the Department of Housing and Urban Development on people who receive housing or rental assistance or applied for federally-insured mortgages; Social Security Administration Supplemental Security Record data on those who receive SSI; Centers for Medicare and Medicaid Services Medicare enrollee data; the Indian Health Service Patient Registration File; and, data on TANF participants.44
Third party data obtained from five vendors are aggregated from a variety of sources including credit bureau header information, utility records, white pages, magazine/periodical change of address information, property taxes, and voter registration rolls.
Unique person identifiers are used to match persons in the 2006–2010 ACS to persons in each of the administrative record sources listed above. These identifiers, called protected identification keys (PIKs), are assigned to both the 2006–2010 ACS and administrative records data using matching software known as the Person Identification Validation System (PVS) [35]. Following the PVS process, all personal identifiers are removed to anonymize the data and preserve confidentiality in the research files used for statistical purposes.
To evaluate the extent of coverage provided by administrative records, we calculate the percent of individuals who match to each administrative records file. The universe for this analysis includes unweighted respondents in the 2006–2010 ACS whose response to the citizenship question was not allocated.55 The focus of our paper is on foreign-born individuals, i.e. those whose reported citizenship status is non-U.S. citizen or naturalized U.S. citizen. We also show selected results for native individuals for comparison.
To address our second research question regarding the characteristics associated with coverage in administrative records, we evaluate rates of PIK assignment and matching to administrative records among the foreign born by various characteristics. We then use multinomial regressions to evaluate the relationships between indicators of assimilation and coverage in administrative records. The dependent variable is coded into three categories: a) no PIK assigned, b) PIK assigned but does not match to administrative records, and c) PIK assigned and does match to administrative records. Our model predicts the likelihood of being in the first two groups compared to our base category of having a PIK assigned that does match to administrative records. For this portion of the analysis, we further restrict our sample to foreign-born respondents whose age at the time of the ACS was 25 years or older in order to evaluate socioeconomic characteristics such as employment status and educational attainment.
The explanatory variables in our analysis include: length of time in the United States, citizenship status, English language proficiency, educational attainment, household income,66 median income of the tract, employment, occupation, and percent of the Census tract that is foreign born. Demographic characteristics of individuals include age, sex, race, and Hispanic origin. We also control for marital status, household size, whether the individual lives in group quarters, and county population size.
3.1Limitations
A match to administrative records can only be determined for individuals for whom a PIK is assigned. The Census Bureau has examined the potential bias of studies restricted to the population with PIKs and found that PIK assignments vary by characteristics [20]. While we account for this by including individuals who were not assigned PIKs in our analysis, we cannot determine whether those individuals are present in the administrative records files.
The process of assigning PIKs involves matching personally identifiable information in the ACS to a set of federal administrative records including the Social Security Administration’s Numident file, including all Social Security Numbers (SSN) issued. Foreign-born persons who have not obtained a SSN are less likely to get a PIK. To mitigate, the Census Bureau has tested use of Individual Taxpayer Identification Numbers (ITIN) observed in tax data. Individuals may obtain an ITIN to pay taxes when they cannot obtain a SSN. The ITIN matching was conducted for ACS data collected in 2010 only.77
Additionally, the sample universe used in this study is restricted to those who responded to the ACS, and this population may be more likely to be in administrative records data relative to those who are harder to reach.
The data were obtained and compiled for an evaluation of administrative records relative to the 2010 Census. Thus, the reference period for the majority of these data is April 1, 2010. As the ACS data used in this analysis was collected from January 2006 through December 2010, the time frame of the files we are comparing do not match. This difference in reference period may be a reason that some individuals in the ACS are not present in administrative records data (i.e. migration or mortality).
Table 1
PIK assignment and matching to Administrative Records by Nativity and ACS Survey Year (Universe: Persons with non-allocated citizenship)
| Nativity and Survey Year | Total number in sample | Assigned a PIK | Match to AR | |||
| Number | (%) | Number | % of those with PIKs | % of total sample | ||
| Foreign Born | 2,201,371 | 1,750,865 | 79.5 | 1,708,869 | 97.6 | 77.6 |
| 2006 | 441,865 | 342,745 | 77.6 | 335,738 | 98.0 | 76.0 |
| 2007 | 438,526 | 339,929 | 77.5 | 334,123 | 98.3 | 76.2 |
| 2008 | 430,914 | 335,243 | 77.8 | 330,458 | 98.6 | 76.7 |
| 2009 | 441,182 | 337,512 | 76.5 | 333,464 | 98.8 | 75.6 |
| 2010 | 448,884 | 395,436 | 88.1 | 375,086 | 94.9 | 83.6 |
| Native Born | 19,959,597 | 18,746,422 | 93.9 | 18,480,141 | 98.6 | 92.6 |
| 2006 | 4,117,584 | 3,874,602 | 94.1 | 3,821,352 | 98.6 | 92.8 |
| 2007 | 4,026,913 | 3,774,878 | 93.7 | 3,725,786 | 98.7 | 92.5 |
| 2008 | 3,963,710 | 3,710,368 | 93.6 | 3,663,678 | 98.7 | 92.4 |
| 2009 | 3,951,309 | 3,669,411 | 92.9 | 3,623,958 | 98.8 | 91.7 |
| 2010 | 3,900,081 | 3,717,163 | 95.3 | 3,645,367 | 98.1 | 93.5 |
Source: 2006–2010 5-year American Community Survey data and 2010 Administrative Records data.
4.Results
4.1To what extent do administrative records provide data on the foreign born?
Table 1 presents the number and percent of individuals in the ACS who match to at least one administrative records file in our analysis by nativity and survey year. Of the 2.2 million foreign-born individuals in our sample universe, 1.75 million, or 79.5 percent, are assigned a PIK. For natives, we find a higher rate of PIK assignment (93.9 percent). The last two columns of Table 1 show the percent of individuals that match to administrative records – first as a percent of those with PIKs and second as a percent of total persons. If we consider only cases with PIKs, the percent that match to administrative records is high for both the foreign born (97.6 percent) and natives (98.6 percent). This indicates that the administrative records files in our analysis provide high coverage for individuals in our universe that receive a PIK.88 However, due to the lower PIK assignment among foreign-born individuals, the number of cases that match as a percent of the total sample is lower for the foreign born (77.6 percent) compared to natives (92.6 percent).
In Table 2, we show the percent of individuals who match to federal data and those that match to third party data, as well as match rates for each individual administrative records file. In this table, we only include individuals with PIKs. A large percent of both foreign-born and native individuals in our sample – 95.9 percent and 96.8 percent respectively – match to at least one of the federal files in our analysis. Among federal files, the highest coverage comes from tax data. For the foreign born in our sample, 86.3 percent are present in IRS 1040 data and 79.7 percent in IRS 1099 data. Coverage by tax data is similar for natives, approximately 86.7 percent match to IRS 1040 data and 75.9 percent match to IRS 1099 data.
The federal file that provides the next highest coverage is the Medicare Enrollment Database – 18.2 percent of the foreign born and 20.5 percent of natives in our sample match to this file.99 Coverage by the remaining federal files is limited, under 6 percent for both foreign born and natives.
Table 2
Percent of persons who match to Administrative Records by Source File and Nativity (Universe: Persons with PIKs and non-allocated citizenship)
| Administrative Records Source File | Foreign Born | Natives |
|---|---|---|
| Total in Sample | 1,750,865 | 18,746,422 |
| Percent in… | ||
| Any administrative record (federal and third party data) | 97.6 | 98.6 |
| Federal data | 95.9 | 96.8 |
| IRS 1040 | 86.3 | 86.7 |
| IRS 1099 | 79.7 | 75.9 |
| Medicare Enrollment Database | 18.2 | 20.5 |
| HUDCHUMS | 5.5 | 4.1 |
| SSR | 3.5 | 2.2 |
| SSS | 2.8 | 4.7 |
| HUDPIC | 1.8 | 1.8 |
| HUDTRACS | 1.0 | 0.7 |
| Indian Health Service | 0.4 | 2.0 |
| Temporary Assistance for Needy Families | 0.2 | 0.6 |
| Third party data | 81.9 | 76.1 |
| File 1 | 52.6 | 54.1 |
| File 2 | 69.1 | 67.7 |
| File 3 | 55.0 | 56.1 |
| File 4 | 25.0 | 24.6 |
| File 5 | 69.5 | 64.9 |
| File 6 | 10.8 | 10.0 |
| File 7 | 41.3 | 45.2 |
| File 8 | 66.5 | 62.6 |
Source: 2006–2010 5-year American Community Survey data and 2010 Administrative Records data.
Third party data coverage is substantial but lower than the coverage provided by federal files – 81.9 percent of the foreign born and 76.1 percent of natives in our sample match to one or more third party files. The higher match rate for the foreign born relative to natives is unexpected but further investigation suggests it is a result of the age-specific coverage of third party data and differences in the age distribution of the foreign born and natives in our sample. As described earlier, third party data are based on sources such as credit bureau header data, utility records, and white pages. Thus, we expect third party data to cover the adult population more so than children. The foreign born in our sample have a lower percent of young individuals relative to natives – for example, 12.1 percent of the foreign born in our sample are under the age of 25 while 32.5 percent of natives in our sample are under 25.1010 When we restrict our analysis to those ages 25 and older, third party data coverage is higher for natives (98.3 percent) than for the foreign born (88.4 percent).
4.2What characteristics are associated with foreign-born coverage in administrative records?
For the remaining analysis, we focus on coverage for the combined administrative records source files and restrict our universe to those who are ages 25 and older in order to include socioeconomic variables (such as educational attainment and labor force participation) that are not available for young children. Overall PIK assignment rates and administrative records coverage increase slightly when we restrict our sample to those ages 25 and higher. The percent of the foreign born who were assigned a PIK is 82.9 percent for those ages 25 and higher compared to 79.5 percent for those of all ages. Of those with PIKs, 98.2 percent for the foreign born ages 25 and higher match to administrative records compared to 97.6 percent of the foreign born of all ages.
Figure 1.
PIK Assignment and Administrative Records Coverage for the Foreign-born Population by Characteristic. Universe: Foreign-born ages 25 and older with non-allocated citizenship status.
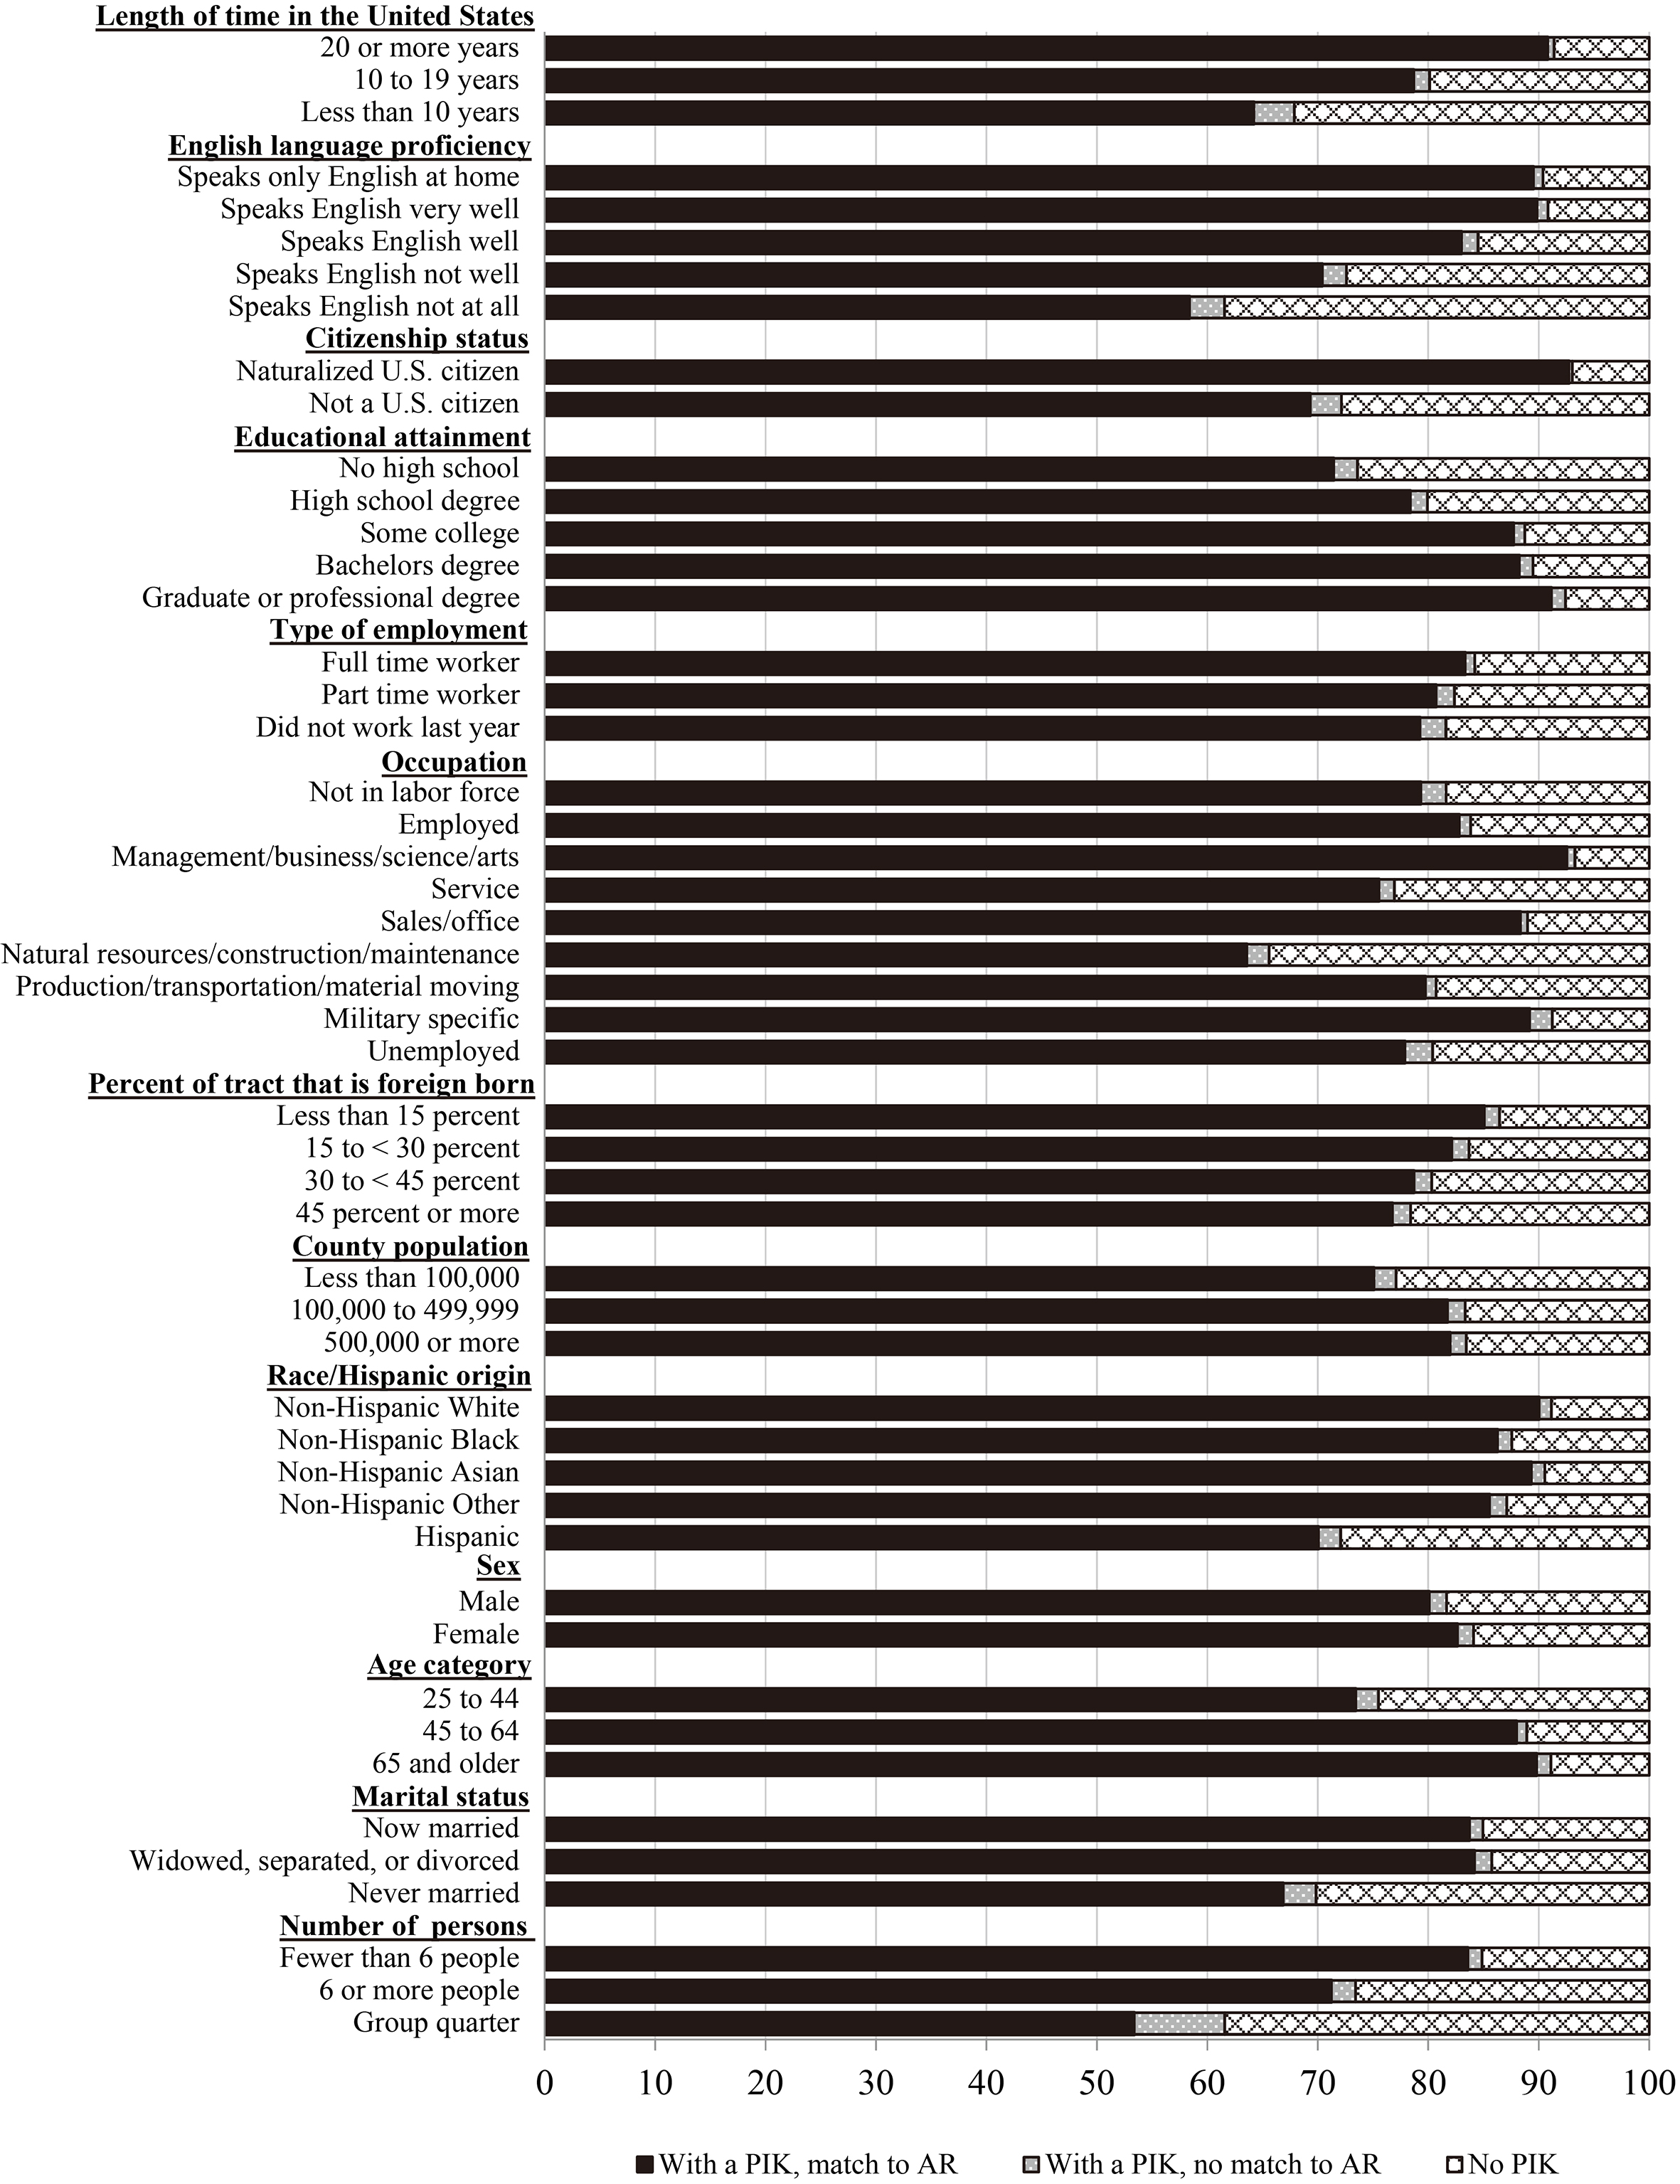
4.2.1Descriptives
We now turn to the second research question and assess the characteristics associated with foreign-born coverage by the compilation of administrative records. In Fig. 1, we present for various characteristics the percent of individuals who a) receive a PIK and match to administrative records, b) receive a PIK and do not match to administrative records, and c) do not receive a PIK.
Table 3
Odds of being in Administrative Records (Universe: Foreign born ages 25 and older with non-allocated citizenship)
| Variable [reference category] | No PIK | With a PIK, no | ||
| match to AR | ||||
| Reference category: | ||||
| With a PIK, match to AR | ||||
| Length of residence in the U.S. [20+ years] | ||||
| 10 to 19 years | 1.65 | *** | 1.94 | *** |
| Less than 10 years | 2.85 | *** | 4.28 | *** |
| English language ability [Speaks only English at home] | ||||
| Speaks English Very Well | 0.74 | *** | 1.01 | |
| Speaks English Well | 0.94 | *** | 1.24 | *** |
| Speaks English Not Well | 1.33 | *** | 1.40 | *** |
| Speaks English Not at All | 1.70 | *** | 1.51 | *** |
| Citizenship [Naturalized U.S. citizen] | ||||
| Not a U.S. Citizen | 1.89 | *** | 5.51 | *** |
| Educational attainment [No high school degree] | ||||
| High School Degree | 1.05 | *** | 0.95 | ** |
| Some College | 0.78 | *** | 0.77 | *** |
| Bachelor’s Degree or Higher | 0.81 | *** | 0.96 | |
| Type of employment [Full time worker] | ||||
| Part time worker | 0.88 | *** | 1.37 | *** |
| Did not work last year | 1.13 | *** | 2.01 | *** |
| Occupation [Not in labor force] | ||||
| Management/business/science/ arts | 0.52 | *** | 0.58 | *** |
| Service | 0.99 | 0.82 | *** | |
| Sales/office | 0.71 | *** | 0.56 | *** |
| Natural resources/ construction/maintenance | 1.29 | *** | 1.10 | ** |
| Production/transportation /material moving | 0.74 | *** | 0.57 | *** |
| Military Specific | 0.56 | *** | 1.40 | |
| Unemployed | 0.79 | *** | 1.00 | |
| Log of household/personal income | 0.93 | *** | 0.93 | *** |
| Median income of tract | 0.96 | *** | 0.95 | *** |
| Percent of tract that is foreign born [Less than 15%] | ||||
| 15 to | 1.08 | *** | 1.08 | *** |
| 30 to | 1.16 | *** | 1.08 | *** |
| 45 percent or more | 1.28 | *** | 1.07 | *** |
| County population [500,000 or more] | ||||
| Less than 100,000 | 1.32 | *** | 1.12 | *** |
| 100,000 to 499,999 | 1.04 | *** | 1.02 | |
| Race [Non-Hispanic White] | ||||
| Non-Hispanic Black | 0.98 | * | 0.80 | *** |
| Non-Hispanic Asian | 0.88 | *** | 0.84 | *** |
| Non-Hispanic other | 1.07 | 1.03 | ||
| Hispanic | 1.75 | *** | 1.11 | *** |
| Sex [Male] | ||||
| Female | 0.89 | *** | 0.81 | *** |
| Age category [25 to 44] | ||||
| 45 to 64 | 0.62 | *** | 0.79 | *** |
| 65 and older | 0.46 | *** | 0.91 | *** |
| Marital status [Now married] | ||||
| Widowed, separated, or divorced | 1.19 | *** | 1.52 | *** |
| Never married | 1.74 | *** | 2.17 | *** |
| Number of persons in household [Fewer than 6 people] | ||||
| 6 or more people | 1.23 | *** | 1.40 | *** |
| Group quarter | 1.78 | *** | 3.54 | *** |
| Sample size | 316,471 | 28,330 | ||
Source: 2006–2010 5-year American Community Survey data and 2010 Administrative Records Data;
The solid black section of the bars shows the percent who both received a PIK and matched to administrative records. For all characteristics this is the largest group – indicating that administrative records coverage is substantial for the foreign born across characteristics. However, there is variation – non-citizens and those who arrived to the United States within the last ten years are less likely to match to administrative records relative to naturalized citizens and those who entered the country more than ten years ago.
In the dotted sections of the bars, we show individuals who are assigned a PIK but do not match to our administrative records. This category makes up a very small proportion across characteristics. There is some variation – for example among recent immigrants we find a higher percentage who have a PIK but do not match to administrative records compared to those who have lived in the United States for more than 20 years (3.7 percent versus 0.6 percent). For both groups the proportion who have PIKs but do not match to one or more administrative records file in our analysis is low.
Finally, in the crisscrossed sections, we show the percent of individuals who are not assigned a PIK. Compared to the foreign born who receive a PIK (the solid black and dotted bars), those without PIKs are more likely to be Hispanic, younger, have lived in the United States for less than ten years, and be non-citizens.
4.2.2Regression results
Results from our multinomial regression are shown in Table 3. These results model the odds of a) not having a PIK and b) having a PIK that does not match to administrative records relative to our reference category of having a PIK that does match to one or more administrative records file.
As predicted, years in the United States, citizenship status, and English language proficiency are predictors of being assigned a PIK and being in administrative records. The odds of being in administrative records are lower for non-citizens and recent immigrants who have been in the United States for fewer than ten years compared to naturalized citizens and long-term immigrants (who have lived in the United States for 20 years or more). Individuals with lower English proficiency have lower odds of being in administrative records than English monolinguals. We find generally similar patterns for these characteristics in predicting the odds of being assigned a PIK, though there are differences in the level of significance.
Higher socioeconomic status is also associated with increased odds of being in administrative data. Individuals with no high school diploma are less likely to be in administrative records compared to those who have a high school diploma, have attended some college, or have a bachelor’s degree or higher. Additionally, the odds of being in administrative records increase with income and with the median income of the tract. These characteristics have similar impacts on the odds of being assigned a PIK.
Labor force participation and employment are generally tied to higher odds of being in administrative records, though this varies by occupation groups. The results suggest differences among those employed in blue-collar versus white-collar jobs – with those in blue-collar jobs (e.g., natural resources, construction, and maintenance occupations) often being less likely to be assigned a PIK or to be in administrative records relative to those not in the labor force; in contrast, those in white-collar jobs (e.g., management, business, arts, science, sales, and office occupations) are more likely to be in administrative records than those not in the labor force. This is not always the case, for example individuals in production, transportation, and material-moving occupations have higher odds of being in administrative records than those not in the labor force.
The amount of time worked in the last year also plays a role. Individuals who worked full time are more likely to be in administrative data compared to those who worked part time and those who did not work in the past year. Part-time workers are more likely to be in the category of having a PIK that did not match to administrative records compared to those who worked full-time. The foreign born who live in tracts with high concentrations of foreign-born persons have lower odds of being assigned a PIK and of matching to administrative records relative to those living in areas with a lower percent foreign born.
Compared to non-Hispanic Whites, the non-Hispanic Black and Asian foreign born have higher odds of being assigned a PIK and matching to administrative records. Hispanics, on the other hand, have lower odds of being assigned a PIK and matching to administrative records. In a reduced model with race as the only independent variable, non-Hispanic single-race Whites have higher odds of being in administrative records compared to all other race and origin groups.
5.Discussion
Our analysis on the magnitude of coverage and descriptive analysis on the characteristics of administrative records coverage indicate that for foreign-born individuals with PIKs, coverage by administrative records is high. However, the assignment of PIKs varies across different characteristics of the foreign born. For both PIK assignment and matches to administrative records, our findings confirm the hypothesis that indicators of assimilation are important factors in administrative records coverage of foreign-born individuals. Living in the country for a longer period of time, being a naturalized citizen, proficiency in English, and higher socioeconomic status are all tied to greater odds of being assigned a PIK and being in the administrative data used in this study. This suggests that the process of integration into society involves participation in programs and services that are included in our data.
Citizenship status has a large association with being in administrative records – naturalized citizens are significantly more likely to be found in administrative records relative to non-U.S. citizens. This is not unexpected – gaining citizenship already signals their ability to navigate through government processes, which allow for even greater economic and social integration. Additionally, citizenship status is an eligibility factor for some of the government benefit programs included in this analysis. Length of time in the United States is also an eligibility factor and moreover, long-term immigrants have simply had more time to become involved in commercial activities and government programs relative to recent immigrants.
Our finding that English language proficiency and socioeconomic status are associated with administrative records coverage may also be related to individuals’ ability to navigate government processes, many of which are conducted primarily in English, as well as increased involvement in commercial activities among those with financial resources. Additionally, higher income and participation in the labor force may result in persons being required to file taxes and thus being in IRS data. Employment and occupation were also related to administrative records coverage, suggesting administrative records have lower coverage of those in informal positions.
We find that controlling for other factors, Asians are more likely to be in administrative records compared to our reference group (non-Hispanic Whites) while Hispanics are less likely to be in administrative records. Differences in human capital held by Hispanic and Asian immigrants when arriving in the country and the experiences they face may result in various paths of integration and these differences in the likelihood of being in administrative records. Our finding that non-Hispanic single-race Black immigrants are more likely to match to administrative records relative to non-Hispanic single-race White immigrants is somewhat surprising in the context of segmented assimilation theory which asserts that racial and ethnic discrimination can act as barriers in the assimilation process [25].
6.Conclusion
As the Census Bureau moves forward in evaluations of administrative records for census and survey operations, the wider implications of this work must be kept in mind. Researchers should acknowledge the selectivity in PIK assignment and administrative records coverage when using these data. Additionally, our findings on the characteristics associated with lower rates of PIK assignment and administrative records coverage should inform the Census Bureau’s efforts to improve PIK assignment and administrative records coverage.
Because we find gaps in PIK assignment rates and high administrative records coverage for individuals who are assigned a PIK, efforts should be made towards increased PIK assignment, particularly for populations with lower PIK rates such as Hispanics and recent immigrants. As shown in our analysis of PIK and match rates by survey year, the addition of ITIN information as a reference file increases the percent of individuals who are assigned a PIK and also increases the percent of individuals matching to administrative records data. We therefore recommend that information from the ITIN files should be used in the PVS process for all census and administrative records data and support continued research into improvements in the PIK assignment process.
While administrative records coverage is high among those with PIKs, acquisition of new data sources may also be useful in increasing coverage rates. The Census Bureau is currently evaluating and acquiring additional data sources to determine if they can enhance coverage of particular populations. In this process, attention should be paid to the coverage of the foreign born and in particular those with characteristics we find to be associated with lower coverage – such as Hispanics, recent immigrants and non-citizens. The Census Bureau should investigate whether data from the Department of Homeland Security could help improve the coverage of the foreign born. In addition, the Census Bureau is pursuing data from the Supplementary Nutrition Assistance Program and Women, Infants, and Children Program. As these data sources are evaluated, researchers should consider whether these sources improve the coverage of the foreign-born population.
Notes
2 For more information on the ACS, see U.S. Census Bureau [34].
3 Information returns data are based on the following forms: W-2, 1099-S, SSA-1099, 1099-G, 1099-DIV, 1099-INT, 1099-MISC, and 1099-R.
4 The administrative records data used in this analysis are the same as those used in the U.S. Census Bureau’s “2010 Census Match Study”. For more information on these data sets, see Rastogi and O’Hara [19].
5 In cases where an ACS respondent does not provide a response for a particular demographic variable, or the reported response was incomplete or invalid, the Census Bureau has to allocate the response. For this study, we restricted our sample to the foreign born whose citizenship response was not allocated – it was either as reported or determined from their reported place of birth. Approximately 2 percent of individuals in the unweighted 2006–2010 ACS were excluded due to allocated citizenship status.
6 For individuals living in group quarters, personal income is used instead of household income.
7 Additional research is underway to assess PIKs determined through Numident matching and ITIN matching. A key difference in the matching involves date of birth: this important field is available in the Numident but not in the tax data containing ITINs.
8 Weighted descriptive and regression analysis results are similar to the unweighted results presented in the paper, and are available upon request.
9 If we restrict our universe to those whose age in the ACS was 65 or older, the percent who match to the Medicare Enrollment Database is 89.5 for the foreign born and 93.9 for natives.
10 Note, while the foreign born have higher fertility rates than natives (Livingston and Cohn [36]), children of the foreign born who are born in the United States are natives.
Acknowledgments
We would like to thank Amy O’Hara, Adela Luque, Mark Leach, B. Dale Garrett, and Sharon Ennis for their valuable comments and suggestions.
References
[1] | Grieco EM, Acosta YD, de la Cruz GP, Gambino C, Gryn T, Larsen LJ. The foreign-born population in the United States: 2010. American Community Survey Reports, ACS-19; Washington, DC: U.S. Census Bureau; (2012) . |
[2] | Massey DS, Capoferro C. Measuring undocumented migration. Int Migr Rev. (2004) ; 38: (3), 1075-1102. |
[3] | Moohn, B. 2010 Census integrated communications program regional partnership assessment report. 2010 Census Program for Evaluations and Experiments, 2010 Planning Memoranda Series No. 217. Washington, DC: U.S. Census Bureau; 2012. |
[4] | Borjas GJ, Tienda M. The employment and wages of legalized immigrants. Int Migr Rev. (1993) ; 27: (4): 712-747. |
[5] | Duleep HO, Dowhan DJ. Incorporating immigrant flows into microsimulation models. Social Security Bulletin. (2008) ; 68: (1). |
[6] | Jasso G, Rosenzweig MR. Estimating the emigration rates of legal migrants using administrative and survey data: the 1971 cohort of immigrants to the United States. Demography. (1982) ; 19: (3): 279-290. |
[7] | Schwabash JA. Identifying rates of emigration in the United States using administrative earnings records. International Journal of Population Research. (2011) ; 2011: , 546201. |
[8] | Hill LE, Johnson HP. Unauthorized immigrants in California. Public Policy Institute of California; (2011) . |
[9] | Hoefer M, Rytina N, Baker B. Estimates of the unauthorized immigrant population residing in the United States: January 2011. Office of Immigration Statistics, Policy Directorate, U.S. Department of Homeland Security, (2012) . |
[10] | Bachmeier JD, Van Hook J, Kestenbaum BM. 2015. The measurement of international migration in U.S. Census surveys: an examination of Current Population Survey data matched to Social Security Administration records. Paper presented at the (2015) ; Annual Meeting of the Population Association of America, San Diego, CA. |
[11] | Ralphs M, Tutton P. Beyond 2011: international models for census taking: current processes and future developments. Office for National Statistics; (2011) . |
[12] | Wallgren A, Wallgren B. Register-based statistics: administrative data for statistical purposes. John Wiley and Sons, Ltd: Chichester, UK. (2007) . |
[13] | Redfern P. Population Registers: Some administrative and statistical pros and cons. Journal of the Royal Statistical Society. Series A (Statistics in Society). (1989) ; 152: (1): 1-41. |
[14] | Pedersen CB. The Danish Civil Registration System. Scandinavian Journal of Public Health, (2011) ; 39: (Suppl 7): 22-25. |
[15] | Verhoef R, van de Kaa DJ. Population registers and population statistics. Population Index, 54: (4), Governmental and International Serial Publications. (1987) ; 633-642. |
[16] | Triandafyllidou A. Clandestino Project: Undocumented migration: counting the uncountable. Data and Trends Across Europe. Final Report. Prepared for the European Commission; (2009) . |
[17] | Krogstad JM, Passel JS. 5 facts about illegal immigration in the U.S. Washington, DC: Pew Research Center; (2015) . |
[18] | Luque A, Bhaskar R. 2010 American Community Survey Match Study. Center for Administrative Records Research and Applications Working Paper Series, Paper No. 2014-03; U.S. Census Bureau; (2014) . |
[19] | Rastogi S, O’Hara A. Census Match Study. 2010 Census Program for Evaluations and Experiments, 2010 Planning Memoranda Series No. 247. Washington, DC: U.S. Census Bureau; (2012) . |
[20] | Bond B, Brown JD, Luque A, O’Hara A. The nature of bias when studying only linkable person records: evidence from the American Community Survey. Center for Administrative Records Research and Applications Working Paper Series, Paper No. 2014-08. Washington, DC: U.S. Census Bureau. |
[21] | Brown SK, Bean FD. Assimilation models, old and new: explaining a long term process. Washington, DC: Migration Policy Institute. (2006) . |
[22] | Gordon MM. Assimilation in American life: the role of race, religion, and national origins. New York: Oxford University Press; (1964) . |
[23] | Waters MC, Jiménez TR. Assessing immigrant assimilation: new empirical and theoretical challenges. Annu Rev Sociol, (2005) ; 31: : 105-125. |
[24] | Portes A, Zhou M. The new second generation: segmented assimilation and its variants. The Annals of the American Academy of Political and Social Science. (1993) ; 530: : 74-96. |
[25] | Portes A, Fernández-Kelly P, Haller W. Segmented assimilation on the ground: the new second generation in early adulthood. Ethnic Racial Stud. (2005) ; 28: : 1000-1040. |
[26] | Haller W, Portes A, Lynch SM. Dreams fulfilled, dreams shattered: determinants of segmented assimilation in the second generation. Social Forces. (2011) ; 89: (3): 733-762. |
[27] | Lee J, Zhou M. Frames of achievement and opportunity horizons. In Card D and Raphael S (Eds.), Immigration, Poverty, and Socioeconomic Inequality. NY: Russell Sage Foundation; (2013) ; p. 206-231. |
[28] | Broder T, Blazer J. Overview of immigrant eligibility for federal programs. National Immigration Law Center. (2011) . |
[29] | Fortuny K, Chaudry A. A comprehensive review of immigrant access to health and human services. U.S. Department of Health and Human Services, (2011) . |
[30] | Kandel WA. The U.S. foreign-born population: trends and selected characteristics. Congressional Research Service; (2011) . |
[31] | Kochar R, Gonzalez-Barrera A, Dockterman D. Through boom and bust: minorities, immigrants, and homeownership. Washington, DC: Pew Research Center; (2009) . |
[32] | Shierholz H. The effects of citizenship on family income and poverty. Washington, DC: Economic Policy Institute; (2010) . |
[33] | Trevelyan E, Acosta YD, de la Cruz GP. Homeownership among the foreign-born population: 2011. American Community Survey Briefs, ACSBR/11-15. Washington, DC: U.S. Census Bureau; (2013) . |
[34] | U.S. Census Bureau. Design and Methodology: American Community Survey. Washington, DC: U.S. Census Bureau; (2014) . |
[35] | Wagner D, Layne M. The Person Identification Validation System (PVS): applying the Center for Administrative Records Research & Applications’ (CARRA) record linkage software. Center for Administrative Records Research and Applications Working Paper, Paper No. 2014-01. Washington, DC: U.S. Census Bureau; (2014) . |
[36] | Livingston G, Cohn D. U.S. birth rate falls to a record low; decline is greatest among immigrants. Washington, DC: Pew Research Center; (2012) . |


