
Network representation learning method embedding linear and nonlinear network structures
Abstract
With the rapid development of neural networks, much attention has been focused on network embedding for complex network data, which aims to learn low-dimensional embedding of nodes in the network and how to effectively apply learned network representations to various graph-based analytical tasks. Two typical models exist namely the shallow random walk network representation method and deep learning models such as graph convolution networks (GCNs). The former one can be used to capture the linear structure of the network using depth-first search (DFS) and width-first search (BFS), whereas Hierarchical GCN (HGCN) is an unsupervised graph embedding that can be used to describe the global nonlinear structure of the network via aggregating node information. However, the two existing kinds of models cannot simultaneously capture the nonlinear and linear structure information of nodes. Thus, the nodal characteristics of nonlinear and linear structures are explored in this paper, and an unsupervised representation method based on HGCN that joins learning of shallow and deep models is proposed. Experiments on node classification and dimension reduction visualization are carried out on citation, language, and traffic networks. The results show that, compared with the existing shallow network representation model and deep network model, the proposed model achieves better performances in terms of micro-F1, macro-F1 and accuracy scores.
1.Introduction
Fig. 1.
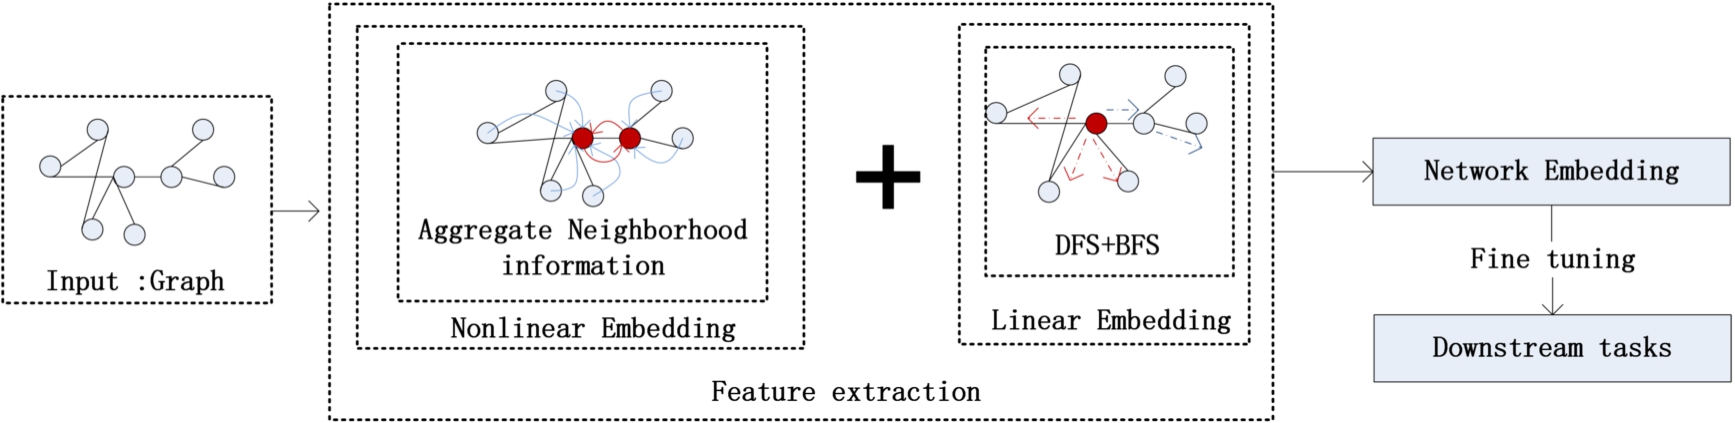
Workflow of the proposed method.
The purpose of network embedding is to map high-dimensional sparse network data into low-dimensional, dense and real-valued vector space, which can be used to adaptively extract features and facilitate analysis of downstream network tasks. These tasks can be performed via using machine learning and other methods, such as node classification, link prediction and dimension reduction visualization [6,24]. At present, the mainstream network embedding methods include a shallow random walk model and a semi-supervised deep learning model based on graph convolution networks (GCNs). In the shallow random walk method, the depth-first search (DFS) method captures the global network structure, whereas the width-first search (BFS) method captures the local network structure.
The DeepWalk [16] method uses a DFS-based random walk and uses second-order similarity to capture local community information, which can be used to observe the entire network in the absence of structural information. LINE [23] considers both the first-order similarity and the second-order similarity of nodes and stitches their trained similarity vectors to represent nodes. Meanwhile, node2vec and struc2vec can flexibly describe the structure of nodes in the network according to their different roles in the network as well. A random walk is usually used in the aforementioned shallow models because it can capture the linear structure of the network.
With the rapid development of graph neural networks, more semi-supervised methods based on GCNs have been used for graph embedding. In real world, due to difficulties of privacy protection and labeling, many real networks do not contain node characteristics and labels, which results in a poor applicability of the original GCN semi-supervised method to a network with only structural information. Thus, Hierarchical GCN (HGCN) is proposed as it can be used to learn the structure of the network. In other words, an HGCN is used to construct an initial node embedding and pseudo label, and then the labels are updated and embedded via using a double GCN, which can describe the nonlinear structure of the network without attributes. However, the two existing types of models cannot simultaneously capture the nonlinear and linear structure information of nodes.
In order to overcome these limitations, we explore the nodal characteristics of network structures and improve the HGCN model, and a representation method based on unsupervised joint learning with shallow and deep learning models is put forward. Our model uses the shallow learning model to extract local and global linear structural features of nodes and obtains global nonlinear structural features of nodes via aggregating information from neighboring nodes with HGCN. More specifically, it fuses the two kinds of extracted features and applies them to downstream tasks in the network. We provide experimental analysis in each stage of the proposed approach and compare our work with several state-of-the-art approaches in depth. The experimental results show that the proposed approach produces higher accuracy, micro-F1 and macro-F1 scores. A detailed flowchart of the proposed method is shown in Fig. 1. Network embedding of the input graph is obtained by extracting nonlinear and linear structural features, which are then applied to downstream tasks, such as node classification and dimension reduction visualization after fine-tuning.
The remainder of the paper is organized as follows. Related work on network embedding is introduced in Section 2. The proposed approach, including shallow linear structure representation, proposed HGCN, and improved HGCN, is presented in Section 3. Experimental results are presented in Section 4. The paper is concluded with several future study options in Section 5.
2.Related work
Network embedding methods have different classification systems. In this section, we briefly sum up existing works on network embedding from three perspectives. First, we introduce matrix methods. Then, we revisit different network embedding methods in machine learning field. Finally, we classify network embedding models based on the structure of the embedding methods, and the disadvantages of existing network embedding methods are analyzed as well.
2.1.Matrix
As mentioned above, traditional network embedding methods are described in the context of dimensionality reduction. From the perspective of linear algebra, unsupervised feature learning methods are usually represented by various graph matrices, especially the Laplacian operator and adjacency matrix [8]. The classic dimensionality reduction techniques include principal component analysis (PCA) [32] and multidimensional scaling (MDS) [11]. In both methods, a graph is represented as an
Several linear (e.g., PCA) and nonlinear (e.g., Isomap) dimensionality reduction techniques [15] have computational and statistical performance defects. In terms of computational efficiency, feature decomposition of the input data matrix requires high computational power.
2.2.Machine learning
Representation learning is an important research topic in machine learning field, and network representation learning is a subset of the set of representation learning. Supervised machine learning methods for complex networks usually need a set of node-distinguishing features. The typical methods by using manual feature extraction to learn node representation primarily focus on the specific fields, which leads to inaccurate feature extraction and poor robustness [2]. For instance, traditional feature extraction methods for machine learning mainly include data cleaning, missing value processing, data annotation and a series of manual works. The other category of methods primarily explore node representation based on which parameters are used when solving an optimization problem, which enables feature extraction with higher accuracy. However, the number of estimated parameters is large, and the process requires significant computation time [4].
In unsupervised learning (e.g., such as DeepWalk, node2vec, and struc2vec) [4], feature representation requires defining an objective function that is independent of downstream tasks to balance accuracy and computational efficiency. Compared with manual feature extraction, using an objective function for determining network representation can ensure more comprehensive features are extracted, which are closely related to the prediction network accuracy [14]. Due to the influence of human subjective factors, manual feature extraction has the problem of inaccuracy or poor robustness, and the problems can be effectively weakened by using the objective function. Therefore, unsupervised graph embedding improves the shortcomings of semi-supervised machine learning. However, since unsupervised graph has no annotated attributes and labels, it needs more link information between nodes when learning the global topological structure of graph. Therefore, unsupervised graph embedding lies in the difficulty of handling the constantly updated network structure, and it is difficult to expand and has high training complexity [4].
2.3.Structure
The structure of neural networks is related to the number of hidden layers. According to the number of hidden layers [13,26,34], network embedding methods are divided into shallow and deep learning methods. First, inspired by successful application of skip-grams in natural language processing [24], a series of network structure coding models based on skip-grams have been proposed in the shallow learning model, such as DeepWalk, LINE, and node2vec. In specific, DeepWalk [16] simulates word sequences, generates node sequences from each node randomly, and forms a “corpus” based on these node sequences. In addition, DeepWalk sets the size of the background window and then imports the “corpus” into the skip-gram model to obtain the node embedding. LINE [23] optimizes the first-order and the second-order similarity of direct connections, and the two similarities are combined as the node embedding. The first-order similarity is defined as the structure of directly connected vertices, whereas the second-order similarity is defined as that two vertices are not directly connected, but have many similar neighbors. Node2vec [7] uses two additional parameters to control the direction of the random walk in the “corpus” generation step in DeepWalk. Struc2vec [19] defines nodes that are not structurally adjacent but have the same structural role. In summary, unsupervised machine learning is normally used in the shallow embedded model because it can better capture the linear structure of the network. However, it has the disadvantage of ignoring nodal features.
2.4.Graph neural networks
In the deep learning model, a mainstream method like GNN uses a deep learning model to capture the nonlinear relationship between nodes [33]. Classic deep learning models include SDNE, GCN, and a series of graph neural network models based on GCN. SDNE [30] uses an unsupervised learning method to automatically capture the local relationship between nodes, and the second-order neighborhood of nodes is used as the low-dimensional representation of input learning nodes. GCN [10] is a deep, semi-supervised graph embedding model, which integrates additional features and labeled data into the graph embedding learning process.
With the development of graph neural networks (GNNs), a series of GNN methods based on GCN have been applied to various types of networks to improve the applicability of GCN in the inductive task. Typical examples are graph attention network (GAT), N-GCN, and Fast-GCN. Specifically, GAT [27] uses an attention mechanism to address the shortcomings of prior methods based on graph convolutions or their approximations. N-GCN [1] improves the scalability of GCN on an entire graph by setting the size of the convolution kernel. Fast-GCN [5] is a batch training algorithm by combining importance sampling, and it can make GCN training more efficient by providing generalized inference. Inspired by unsupervised methods and the idea of pre-training, a series of GCN-based training methods have emerged. DeepGraphInfoMax [28] relies on maximizing mutual information between patch representations and corresponding high-level summaries of graphs, whereas both are derived via using established GCN architectures. The pre-trained GCN model proposed by Hu et al. [9] can capture generic graph structural information that is transferable across tasks. M3S [22] uses the correct extra feature and increases the number of labeled data via self-training to learn the undirected graph embedding. GMNN [18] also applies the correct extra feature and neighbor nodes to generate pseudo-labels for unsupervised learning. Consequently, one main challenge encountered when using the above GNN method is that it still cannot simultaneously consider the feature and the label of the node.
3.Model
Suppose
3.1.Shallow linear structure representation
Qi [17] showed that DeepWalk, LINE, PTE, and Node2vec are implicit matrix factorizations in theory. DeepWalk first generates a low rank transformation of the network’s normalized Laplacian matrix, and then the eigenvector of the decomposed matrix is taken as the representation vector. Because of observing the characteristics of the entire network in the absence of structural information, DeepWalk captures a global linear representation. LINE is a special case where the size of DeepWalk’s window is “1”. The first-order proximity similarity of LINE captures a representation of the local linear structure. The following definitions are given in this paper:
(1) Local structural information: edge information in the network is an observed first-order similarity. In general, the first-order similarity considers that the greater the edge weight between two vertices, the more similar the two vertices are. In this paper, the first-order similarity in the LINE method is used to describe the shallow linear structure. For each pair of undirected edges
In the undirected graph,
(2) Global structural information: global network embedding can obtain more abundant node characteristics [29]. In a realistic network, many legitimate edges are not observed. DeepWalk can be used to predict and learn the global structure of the network with higher accuracy, hence it is used to describe the global information of the network in the shallow linear structure. For an undirected graph, a random walk is used to obtain a random walk sequence with a specific length
For further experiments, we also directly join the local linear embedding and global linear embedding to get the model, named DL. The linear structure embedding is defined as
3.2.Fusion of linear and nonlinear network structure representation based on HGCN
In this section, we focus on the improved hierarchical GCN model. We first introduce GCN, and then introduce the HGCN nonlinear structure representation model. In addition, we further explain the merit of the improved model.
3.2.1.GCN model
GCN is a semi-supervised graph convolution model that integrates additional node attributes with some labeled nodes into the process of learning the node representation. Mathematically, convolution is defined as formula (5):
For any given node, a GCN layer aggregates the previous layer’s embedding of its neighbor with A, followed by a linear transformation
GCN is a deep neural network model. In each hidden layer in the GCN, a neighboring node representation for the aggregation center node is used as the input representation in the next layer, and the nonlinear activation function is connected. From the overall structure of the GCN stacking nonlinear activation function, a GCN model captures the deep nonlinear structural information of the network.
3.2.2.HGCN nonlinear structure representation model
In real world, GCN is suitable for graphs with only structural information. HGCN improves the applicability of the GCN model in graphs with only structural information by constructing an initial node embedding vector and pseudo label. The specific model includes an input layer, a dual GCN updated layer, and an output layer. Detailed definitions are listed as follows:
(1) Input layer: first, HGCN will capture the global information of
Where
(2) Dual GCN updated layer: the dual GCN updated layer in the HGCN is composed of two GCN models, and each GCN model includes three hidden layers. When information from the input undirected graph is known, the first GCN model will be learned and embedded into
Meanwhile, node labels Y are predicted, and the second GCN is used to learn the updated features
(3) Output layer: after the second training iteration, we found that the node classification results become worse. The reason may be that the dual GCN representation aggregate the higher order network structure, but multiple iterations can assimilate the learned structural information. Hence the trained dual GCN model will have an embedding that is too smooth, which can affect the downstream node classification results. Based on this, we further splice
3.2.3.Fusion embedding
The linear structure embedding in the shallow layer includes two types: global linear embedding and local linear embedding. In the output layer, there are two types of fusion embedding methods. One is fusing the local linear embedding into the learned embedding of HGCN, and that is splicing
(1) Fusion of local linear structure embedding (HGCN-L):
In our model,
(2) Fusion of local and global linear structure embedding (HGCN-DL):
Splicing the shallow linear embedding and deep nonlinear structure embedding can integrate local with global network structure information and prevent smoothing. The linear structure embedding
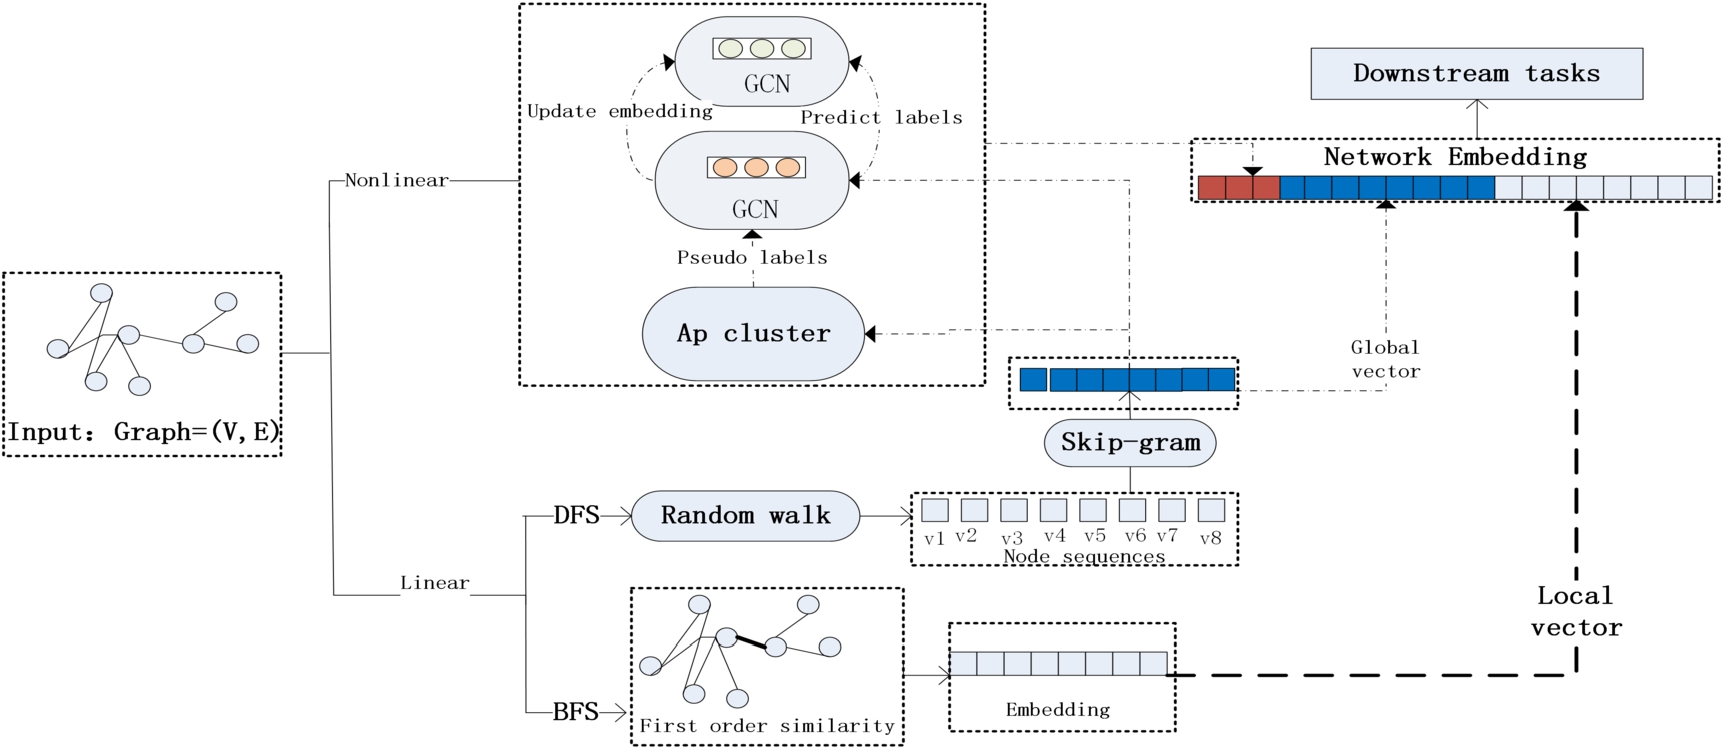
A detailed model is shown in Fig. 2. The graph embedding is composed of nonlinear and linear structure embedding. Among them, the nonlinear structure embedding is generated by the dual GCN updated layer in the HGCN, i.e., the double GCN. The linear structural embedding uses a random walk model and the first-order proximity similarity to describe the global and local vectors, respectively. Finally, the nonlinear and linear structure representations are spliced to obtain the final network structure embedding. Moreover, the splicing operation includes concatenation, product and addition operation between node vectors, and we use the concatenation operation with the best experimental results in this paper.
Fig. 2.
Model architecture.
4.Experiments
In this section, the proposed approach is experimentally evaluated via using three kinds of datasets. We present the dataset, the experimental settings, and a comparison with state-of-the-art baseline results. In addition, we also evaluate the influence of shallow linear structural information for embedding and downstream analysis tasks.
4.1.Data sets
In order to verify the validity of the model, three kinds of undirected graph network data sets are selected: citation network [12], air-traffic network [33], and language network [21]. In this paper, the citation network includes the Cora and Citeseer data sets; the air traffic network includes European and American air traffic data sets; and the language network is a Wikipedia data set. Specifically, the citation network is used as a network with only structural information in this paper, and the correct label is only used to verify downstream tasks. The Citeseer data set includes six categories: Agents, AI (Artificial Intelligence), DB (database), IR (information retrieval), ML machine language), and HCI. The Cora data set includes seven kinds of papers: Based on Case, Genetic Algorithm, Neural Network, Probability Method, Intensive Learning, Rule Learning and Theory.
The details of these data sets are shown in Table 1.
Table 1
Experimental data sets
| Type | Citation network | Language network | Air traffic network | ||
| Datasets | Cora | Citeseer | Wikipedia | American air traffic | European air traffic |
| Nodes | 2708 | 3327 | 2405 | 1190 | 399 |
| Edges | 5429 | 4732 | 17981 | 13599 | 5995 |
| Classes | 7 | 6 | 17 | 4 | 4 |
4.2.Baselines
DeepWalk is a typical unsupervised graph embedding method that adopts the skip-gram language model.
LINE is also a popular unsupervised method that considers the first-order and the second-order proximity information.
Node2vec learns low-dimensional representations for nodes in a graph by optimizing a neighborhood-preserving objective. This method explores the structure of the network by controlling the parameters of p and q, and its d dimension feature representations can be learned by simulating biased random walks.
SDNE learns theddimension node representation by capturing the nonlinear structure of the network via using multi-layer nonlinear functions, which is a semi-supervised deep graph embedding model.
SN2vec is a model that integrates node structure with node content similarity. This model is our previous work. It is a shallow random walk model, which primarily captures linear structures. In this paper, the model is compared as a shallow linear baseline model.
The baseline model SDNE can capture nonlinear structures. The models such as Deepwalk and LINE mainly capture linear structures, which are part of the proposed model.
4.3.Experimental setup
Due to the different sizes of the data sets and different experimental settings in different models, we introduce the parameters of the step size and step number in DeepWalk, the parameters p and q in Node2vec, and batch size in LINE separately. Parameter values are shown in Table 2.
The step number of random walks was set to 80 and the step size was set to 10 in DeepWalk, whereas for the European traffic network data set, the number of random walk steps was reset to 15 after comparing experimental results for different parameter values.
Table 2 shows that for the traffic network, the parameters p and q in Node2vec were set to 0.25 because the datasets are equivalent in structure and content. For the citation network, after comparing experimental results for different parameter values, the experimental results are better when
Regarding the training batch size in LINE, the training batch size for the European traffic data set was set to 128; the training batch size for the other data sets was set to 1024.
4.4.Node classification experiments
Node classification is used to verify the model. The baseline models include the shallow linear structure model and the deep nonlinear structure model. The evaluation indices used in this study are micro-F1, macro-F1 and accuracy. In Table 3 and Table 4 in this paper, we first independently repeated the experiment 10 times. Then, we calculated the average of the 10 results and the confidence interval of the average.
In particular, the SN2vec model was used as a baseline model for exploring the shallow linear structure of undirected graph networks with equivalent structure and content. Among them, the results with * are the experimental results obtained from OpenNE [25]. The specific experimental results are shown in Table 3 and Table 4.
Table 2
Baselines experimental setup
| Model | Traffic datasets | Citation network | Language network | |
| DeepWalk | Step size | 10 | 10 | 10 |
| Step number | 80/15 | 80 | 80 | |
| Node2vec | p | 0.25 | 0.25 | 0.25 |
| q | 0.25 | 2 | 2 | |
| LINE | Training batch size | 128 | 1024 | 1024 |
Table 3
Node classification experimental results on traffic network datasets
| Model | American air traffic | Europe | ||||
| Micro-F1 | Macro-F1 | Accuracy | Micro-F1 | Macro-F1 | Accuracy | |
| DeepWalk | 0.523 | 0.518 | 0.523 | 0.395 | 290 | 0.395 |
| LINE (2nd) | 0.504 | 0.499 | 0.504 | 0.430 | 0.405 | 0.430 |
| Node2vec | 0.493 | 0.459 | 0.493 | 0.43 | 0.340 | 0.430 |
| SN2vec | 0.530 | 0.509 | 0.530 | 0.45 | 0.404 | 0.45 |
| SDNE | 0.580 | 0.56 | 0.58 | – | – | – |
| HGCN | 0.521 ± 0.033 | 0.518 ± 0.032 | 0.521 ± 0.033 | 0.498 ± 0.061 | 0.448 ± 0.065 | 0.498 ± 0.061 |
| HGCN-L | 0.573 ± 0.017 | 0.570 ± 0.020 | 0.573 ± 0.017 | 0.501 ± 0.010 | 0.465 ± 0.010 | 0.501 ± 0.010 |
| HGCN-DL | 0.621 ± .024 | 0.619 ± 0.024 | 0.621 ± 0.024 | 0.526 ± 0.029 | 0.487 ± 0.034 | 0.526 ± 0.029 |
Table 4
Node classification experimental results on citation and language network datasets
| Model | Citation network | Language network | |||||||
| Cora | Citeseer | Wikipedia | |||||||
| Micro-F1 | Macro-F1 | Accuracy | Micro-F1 | Macro-F1 | Accuracy | Micro-F1 | Macro-F1 | Accuracy | |
| DeepWalk | – | – | 0.672∗ | – | – | 0.432∗ | 0.669∗ | 0.560∗ | 0.669∗ |
| LINE (2nd) | 0.704 | 0.684 | 0.704 | 0.444 | 0.399 | 0.444 | 0.576∗ | 0.387∗ | 0.576∗ |
| Node2vec | 0.771 | 0.765 | 0.771 | 0.567 | 0.486 | 0.567 | 0.651∗ | 0.541∗ | 0.651∗ |
| SN2vec | 0.786 | 0.773 | 0.786 | – | – | – | 0.571 | 0.394 | 0.571 |
| SDNE | 0.660 | 0.648 | 0.660 | 0.400 | 0.351 | 0.400 | 0.643∗ | 0.498∗ | 0.643∗ |
| HGCN | 0.797 ± 0.014 | 0.783 ± 0.012 | 0.797 ± 0.014 | 0.544 ± 0.020 | 0.469 ± 0.025 | 0.544 ± 0.020 | 0.622 ± 0.020 | 0.575 ± 0.015 | 0.622 ± 0.020 |
| HGCN-L | 0.668 ± 0.012 | 0.644 ± 0.011 | 0.668 ± 0.012 | 0.396 ± 0.022 | 0.351 ± 0.020 | 0.396 ± 0.022 | 0.533 ± 0.015 | 0.393 ± 0.020 | 0.533 ± 0.015 |
| HGCN-DL | 0.802 ± 0.012 | 0.789 ± 0.013 | 0.802 ± 0.012 | 0.569 ± 0.012 | 0.495 ± 0.020 | 0.569 ± 0.012 | 0.655 ± 0.014 | 0.586 ± 0.018 | 0.655 ± 0.014 |
Table 3 shows that on the American air traffic network, HGCN-L is better than the original HGCN model in terms of all three evaluation indicators. The same results are obtained for the Europe traffic dataset after adjusting the parameters, suggesting the local topological representation is more identifiable for nodes on datasets with the same structure and content.
This also indicates that local structural information is more important for node classification than global structure information for such datasets.
Table 3 also shows that HGCN-DL, which fuses shallow linear local and global structural information, further improves the node classification results on HGCN-L in micro-F1, macro-F1, and accuracy. On the American traffic dataset, HGCN-DL is 4.8% higher than HGCN-L on micro-F1 and accuracy, and 4.9% higher than HGCN-L on macro-F1. For the European dataset, HGCN-DL is 2.5% higher than HGCN-L on micro-F1 and accuracy, and 2.2% higher than HGCN-L on macro-F1. These results indicate that HGCN-DL can more fully capture and represent the topological structure of undirected graphs.
Table 4 shows that, HGCN-DL performs better than other models regarding micro-F1, macro-F1 and accuracy in node classification task. In the Cora dataset, it is 0.5% higher than HGCN in micro-F1 and accuracy, and 0.6% higher in macro-F1. For the Citeseer dataset, it is 2.5% higher than HGCN in micro-F1 and accuracy. Regarding the Wikipedia dataset, it is 3.3% higher than HGCN in micro-F1 and 1.1% higher in macro-F1, however, it is 1.4% lower than DeepWalk in micro-F1. Table 4 further indicates that HGCN-DL, which combines shallow linear local with global structures, can also more fully capture and represent undirected graph topology on citation and language networks.
However, for the citation and language network datasets, our HGCN-L model performs slightly worse than HGCN regarding micro-F1, accuracy and macro-F1. This result may be related to the structure of the selected dataset. Compared with the traffic network, the citation and language network datasets have sparser structures. This shows that in the citation and language network datasets, the integration of global information is more beneficial to downstream node classification tasks. Therefore, compared with the experimental results from the traffic network datasets, the citation and language networks fuse global information to make the classified nodes more distinguishable.
4.5.Experimental results comparison of DL model and HGCN-DL model
In Section 3.1, we propose a linear structure representation model, which directly joins the local linear embedding and global linear embedding, named DL. In order to verify whether the effect of HGCN-DL is entirely influenced by the linear structure representation, we compare the two models on node classification task. The experimental results are shown in Fig. 3 and Fig. 4.
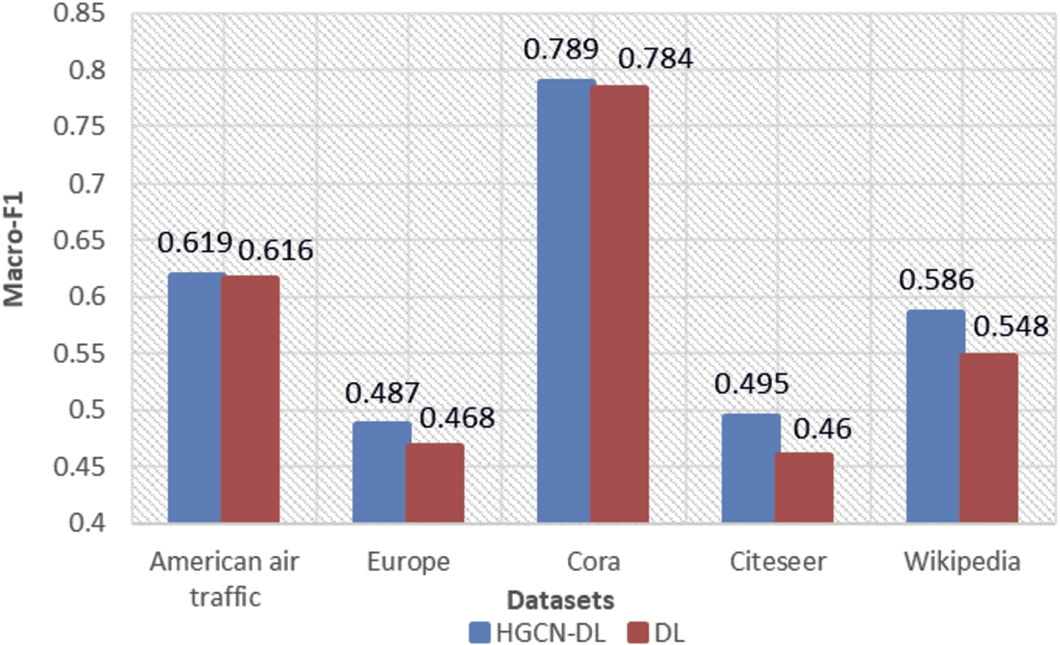
By comparing the results in Fig. 3 and Fig. 4, we find that the HGCN-DL model performs better than the shallow linear model DL in terms of micro-F1 and macro-F1 on all data sets. It shows that the effect of HGCN-DL is not completely affected by the shallow linear structure representation. In other words, HGCN-DL can capture both linear and nonlinear structures.
Fig. 3.
Micro-F1 of the two models for five datasets.
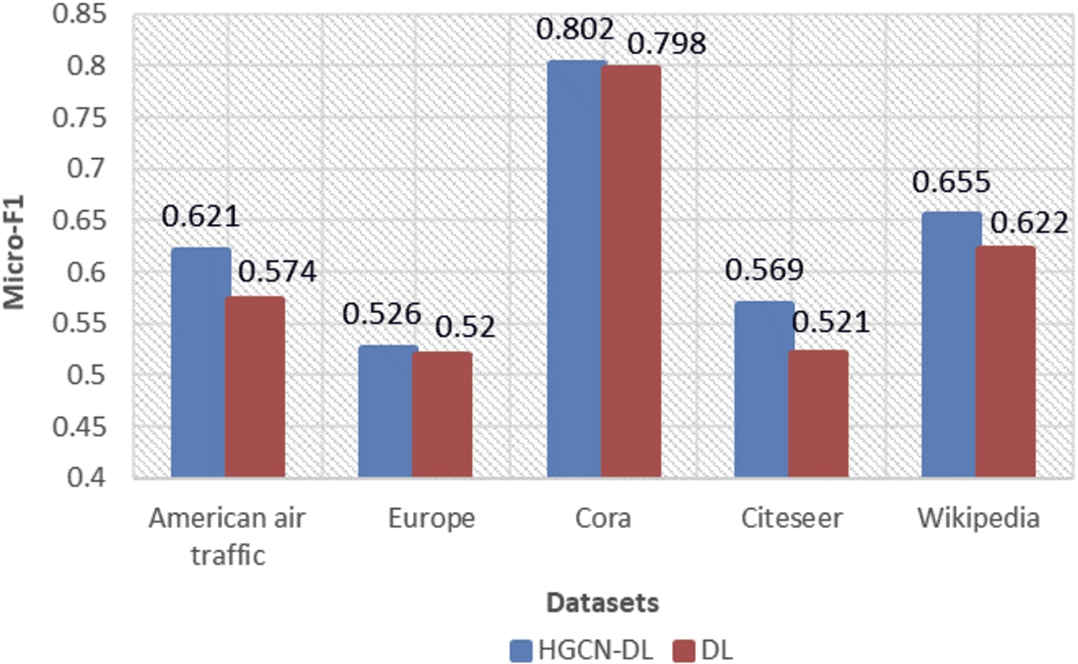
Fig. 4.
Macro-F1 of the two models for five datasets.
4.6.t-SNE
For a more intuitive comparison model, three different kinds of datasets, including the citation, traffic and language networks, are visualized in a reduced dimension from Section 4.6.1 to Section 4.6.3. In addition, the highlighted boxes in all figures are directly selected by observation. The results are shown in Figs 5–7.
Fig. 5.
Dimensionality reduction results for the Citeseer network dataset in citation network. The framed parts regions in (d) correspond to the observation results in (a)–(c),respectively.
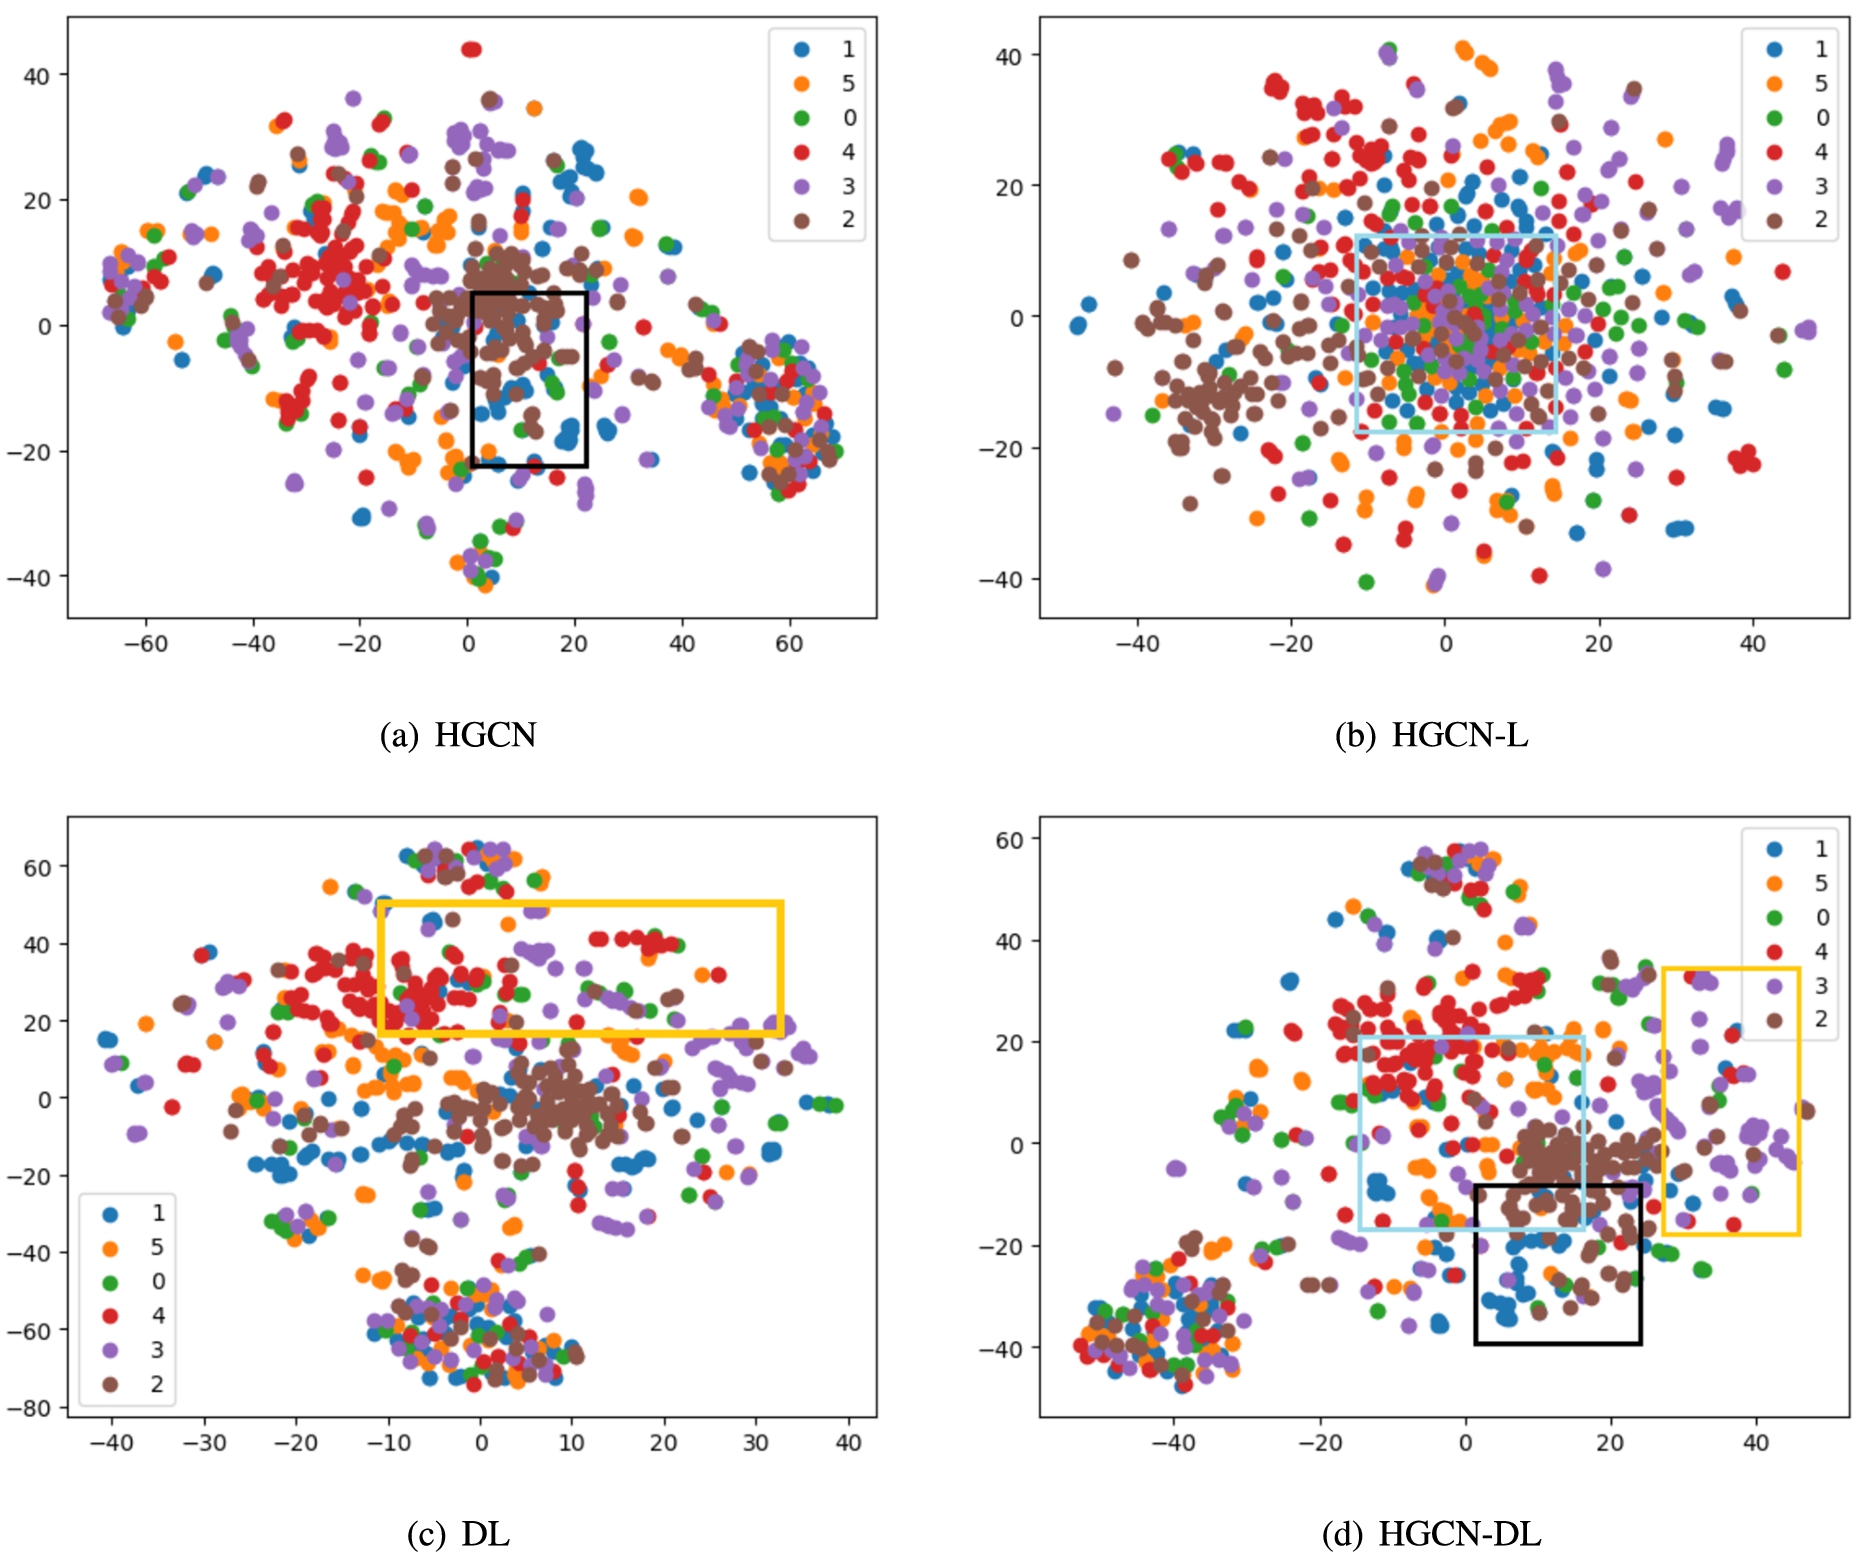
Fig. 6.
Dimensionality reduction visualization of the American-air-traffic network dataset in traffic network. The framed parts regions in (d) correspond to the observation results in (a)–(c), respectively.
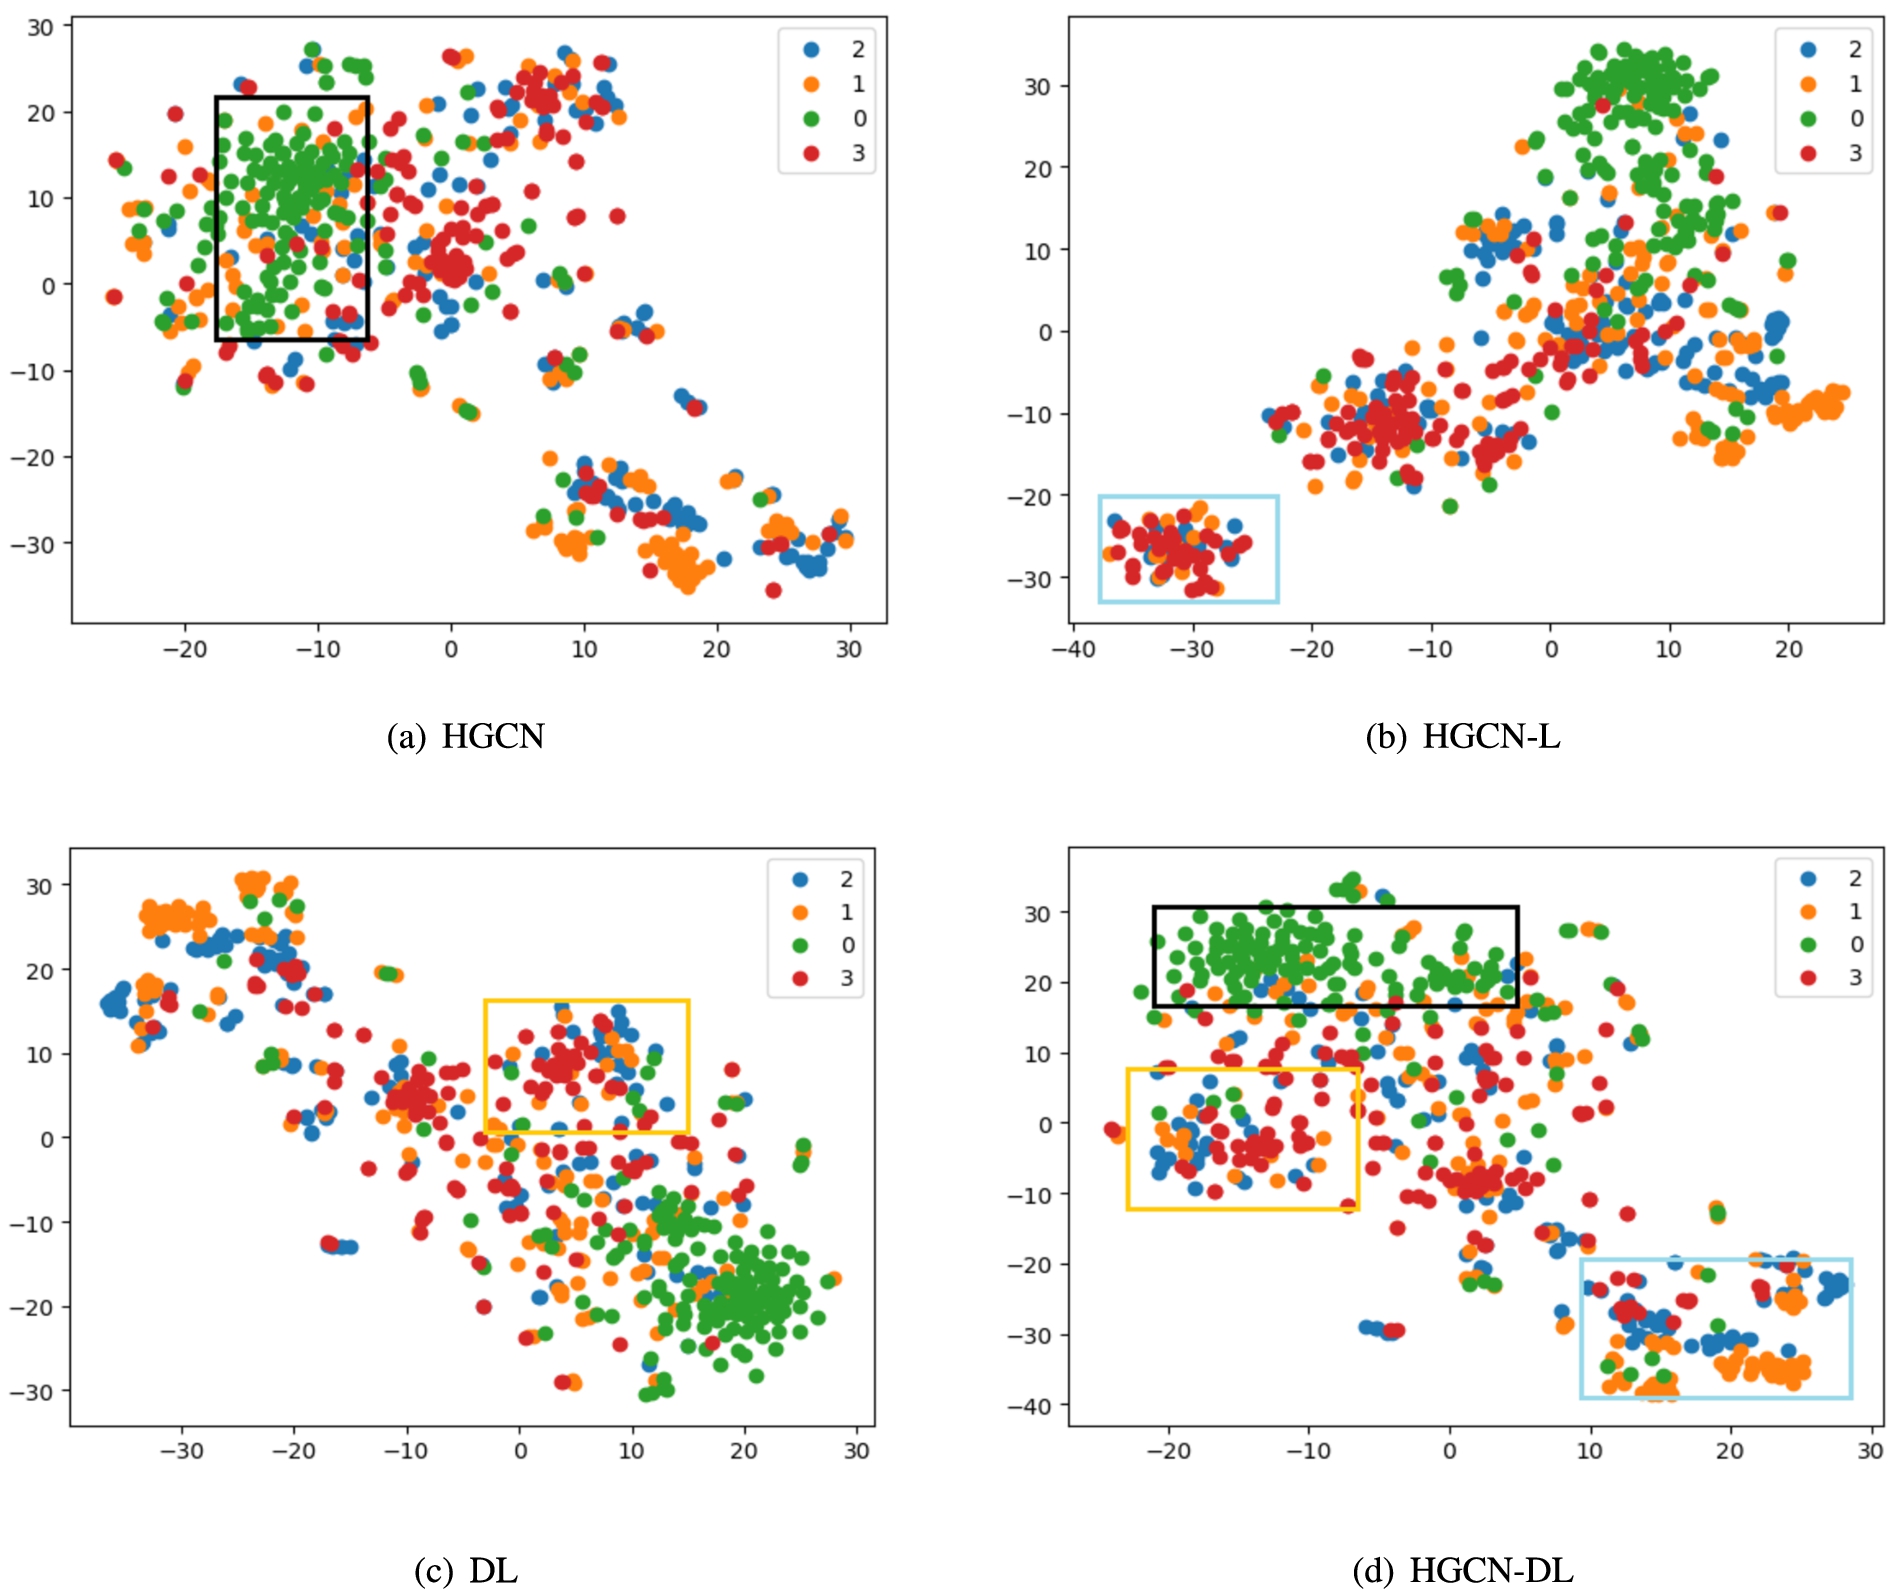
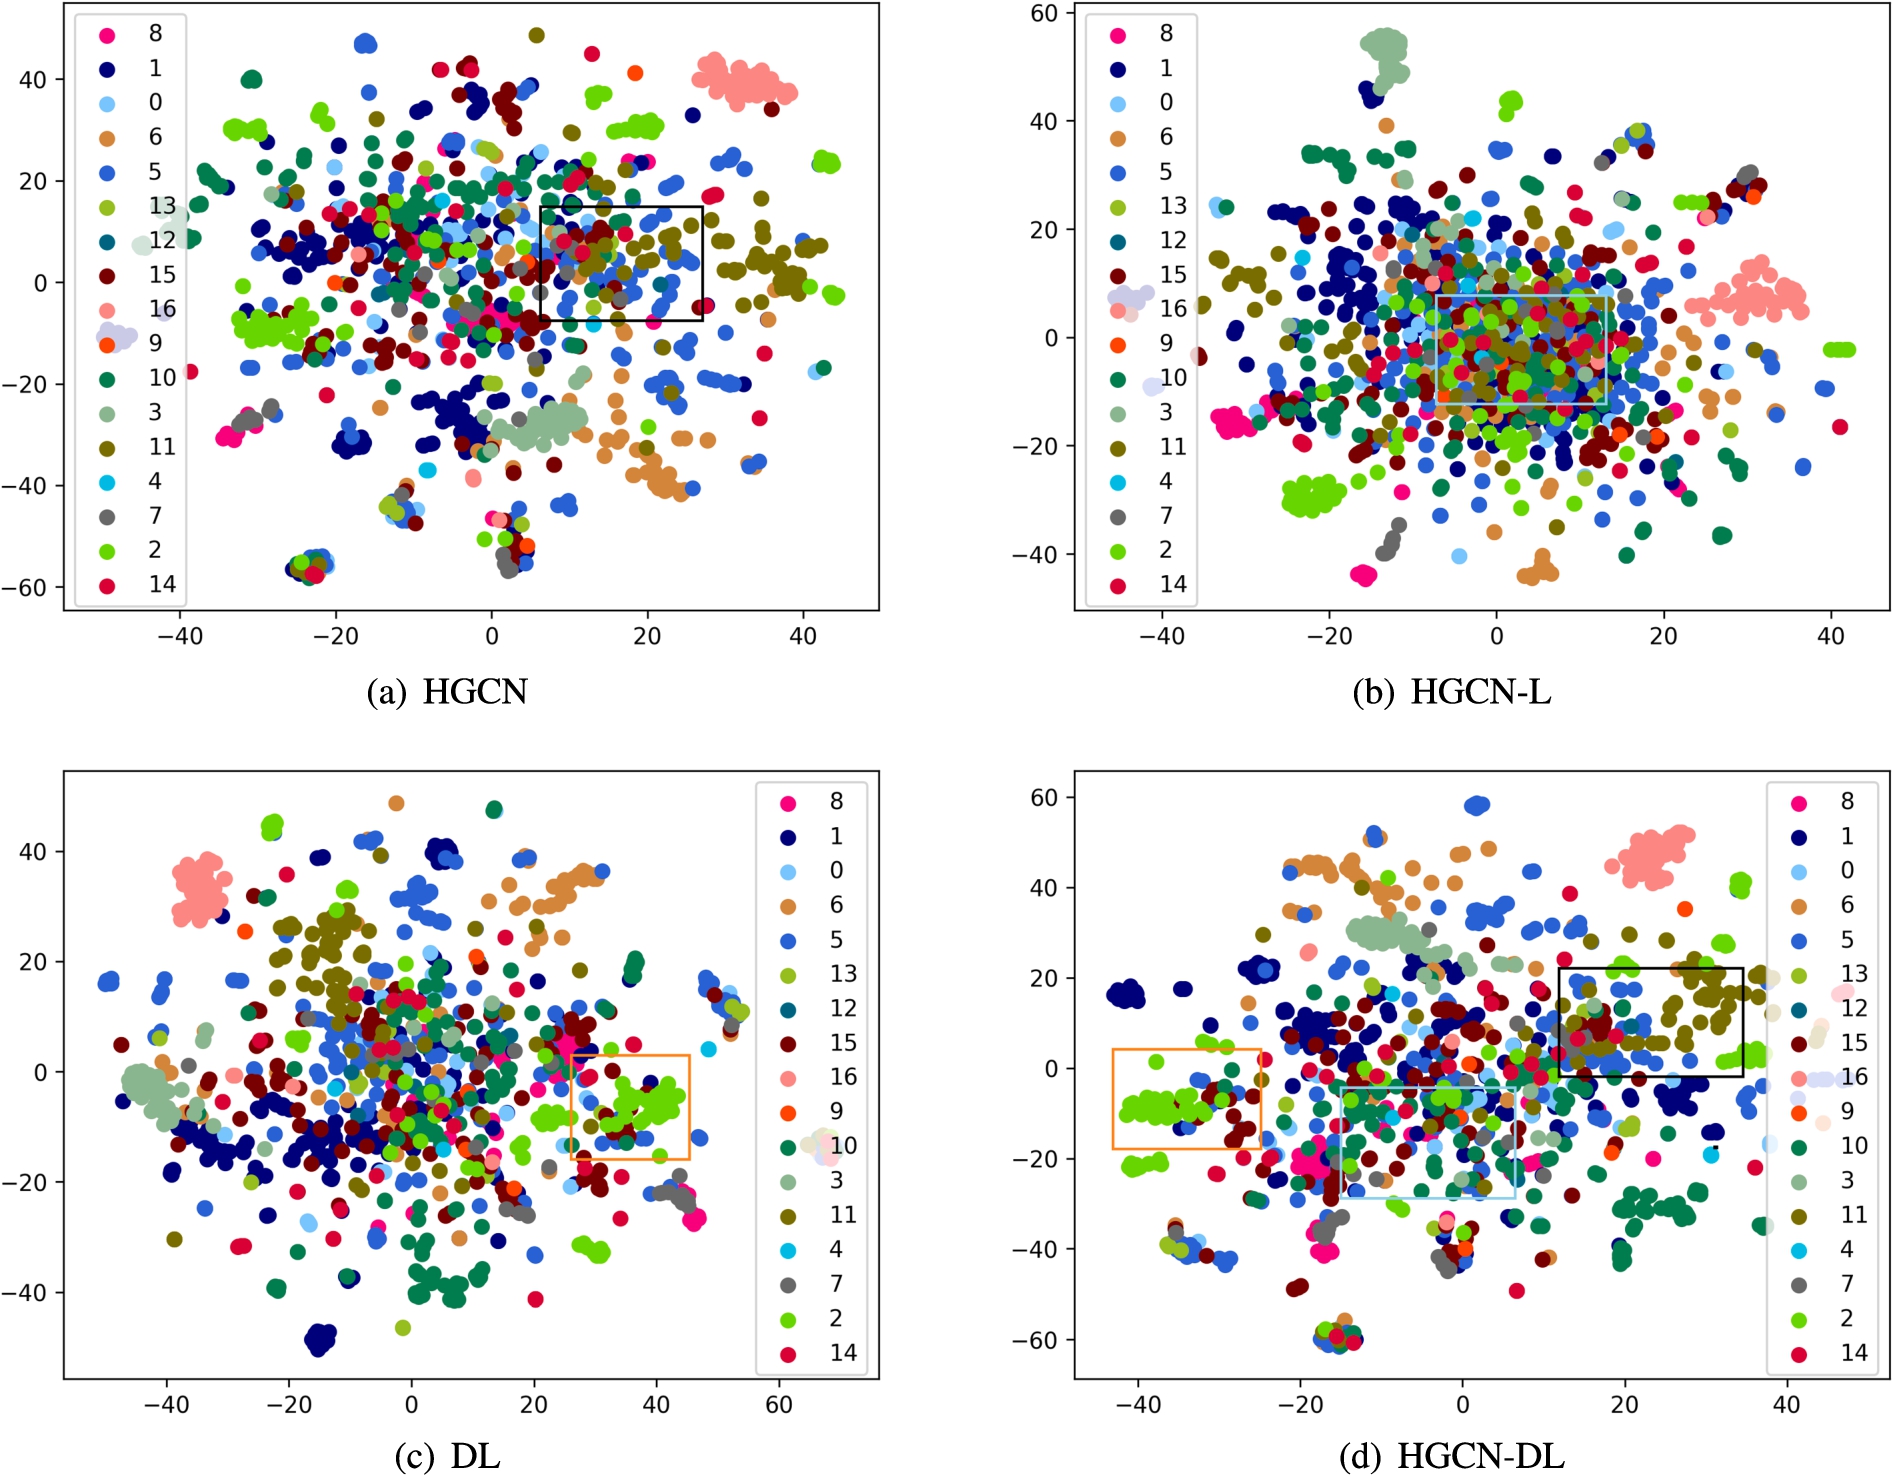
Fig. 7.
Dimensionality reduction visualization of the Wikipedia network dataset in language network. The framed parts regions in (d) correspond to the observation results in (a)–(c), respectively.
4.6.1.Citeseer network
Figure 5(a) shows the dimensionality reduction for the original HGCN model, where categories 1–3 in the black framed parts are not obvious. Figure 5(b) shows the model with local linear features. The edge category features are clear, while the six categories in the middle have no obvious boundaries. Compared with Fig. 5(d), the HGCN-DL model proposed in this paper can refine some categories in the Citeseer dataset, particularly data in the intermediate categories in Fig. 5(b).
Compared with the shallow linear model, the t-SNE results of DL are given. As shown in Fig. 5(c), the shallow linear structure causes features in categories 3 and 4 in the Citeseer dataset to appear mixed. Compared with the corresponding observations in Fig. 5(d), HGCN-DL, which integrates the nonlinear structure, successfully distinguishes categories 3 and 4. This indicates that the fusion of the deep nonlinear and shallow linear structures can more comprehensively describe the features of nodes.
4.6.2.American air traffic network
The American air traffic network comes from struc2vec [33], where air traffic in the US is divided into four categories based on airport activity. Figure 6(a) shows that the original HGCN model does not distinguish category 0 from category 1, whereas Fig. 6(d) displays that HGCN-DL separates category 1 from category 0. Compared with HGCN-L in Fig. 6(b), HGCN-DL makes the dataset more obvious in local distribution.
Similarly, compared with DL in Fig. 6(c), Fig. 6(d) shows that for HGCN-DL the addition of a nonlinear structure can successfully separate the label nodes in category 2 in the edge portion of the graph, which makes the distribution boundaries in different categories of labels more obvious.
4.6.3.Wikipedia network
The Wikipedia language network dataset consists of 17 categories, 2405 Wikipedia pages, and 17981 links, and it is denser than the citation and traffic network datasets.
In Fig. 7(a), the results determined with HGCN show that the boundary between the nodes of category 11 and some nodes of category 5 is indistinguishable on the edge of the middle part. However, the observations in Fig. 7(d) show that HGCN-DL can successfully separate the nodes of category 11.
In Fig. 7(b), HGCN-L with shallow linear local information can better represent the nodes at the edge of the dataset. However, for the denser nodes in Wikipedia, HGCN-L has a weak ability to describe. The above problem is also seen in HGCN-DL, but compared with HGCN-L in Fig. 7(b), HGCN-DL improves the representation ability of HGCN-L for the dense node distributions.
Similarly, the t-SNE results obtained with DL are given. By the comparison between Fig. 7(d) and Fig. 7(c), it is noted that HGCN-DL can capture some category 15 nodes in the language network so that it can be successfully distinguished from nodes in category 5 and category 2 at the edge of the distribution.
5.Conclusions
In this study, we primarily explore a graph embedding approach on combining linear with nonlinear network structures. Because existing shallow and deep learning models cannot simultaneously capture the nonlinear and linear structural information of nodes, we introduce hierarchical graph convolution network to put forward the HGCN-L and HGCN-DL methods respectively. In order to verify the effectiveness of the model, node classification experiments were conducted for citation network, traffic network, and language network data sets. Dimensionality reduction visualization experiments for the three kinds of data sets were conducted.
Besides, we come to the following conclusions:
(1) From the results of the node classification experiment, for the traffic network data set, the results of HGCN-L show that the local topological structure indicates that nodes to be classified are more significant; the proposed HGCN-DL model can capture and represent the topology of the undirected graph more comprehensively.
(2) Compared with the linear model DL, our model HGCN-DL performs better in node classification, which indicates that our model can further capture the depth nonlinear structure.
(3) The dimensionality reduction visualization experiments show that HGCN-DL can capture and distinguish easily confused category label nodes in both sparse traffic networks, dense citation networks, and denser language networks.
In general, HGCN-DL can represent the topology structure of undirected graphs effectively. However, compared with HGCN, HGCN-L performs well in the traffic network, performs poorly in citation and language networks. We suspect that this is related to the structure of the dataset itself. In the future, we will provide evidence for this conjecture.
Acknowledgements
This research was supported by the National Key Research and Development Program of China (No. 2018YFB1005103), the National Natural Science Fund of China (No. 61936012, No. 62176145), and the Natural Science Foundation of Shanxi Province (No. 201901 D111028).
References
[1] | S. Abu-El-Haija, A. Kapoor, B. Perozzi and J. Lee, N-GCN: multi-scale graph convolution for semi-supervised node classification, in: Proceedings of the Thirty-Fifth Conference on Uncertainty in Artificial Intelligence, UAI 2019, Tel Aviv, Israel, July 22–25, 2019, A. Globerson and R. Silva, eds, Proceedings of Machine Learning Research, Vol. 115: , AUAI Press, (2019) , pp. 841–851, http://proceedings.mlr.press/v115/abu-el-haija20a.html. |
[2] | M. Belkin and P. Niyogi, Laplacian eigenmaps and spectral techniques for embedding and clustering, in: Advances in Neural Information Processing Systems 14 [Neural Information Processing Systems: Natural and Synthetic, NIPS 2001], Vancouver, British Columbia, Canada, December 3–8, 2001, T.G. Dietterich, S. Becker and Z. Ghahramani, eds, MIT Press, (2001) , pp. 585–591, https://proceedings.neurips.cc/paper/2001/hash/f106b7f99d2cb30c3db1c3cc0fde9ccb-Abstract.html. doi:10.7551/mitpress/1120.003.0080. |
[3] | M. Belkin and P. Niyogi, Laplacian eigenmaps for dimensionality reduction and data representation, Neural Comput. 15: (6) ((2003) ), 1373–1396. doi:10.1162/089976603321780317. |
[4] | Y. Bengio, A.C. Courville and P. Vincent, Representation learning: A review and new perspectives, IEEE Trans. Pattern Anal. Mach. Intell. 35: (8) ((2013) ), 1798–1828. doi:10.1109/TPAMI.2013.50. |
[5] | J. Chen, T. Ma and C. Xiao, FastGCN: Fast learning with graph convolutional networks via importance sampling, in: 6th International Conference on Learning Representations, ICLR 2018, Conference Track Proceedings, Vancouver, BC, Canada, April 30–May 3, 2018, OpenReview.net, (2018) , https://openreview.net/forum?id=rytstxWAW. |
[6] | P. Goyal and E. Ferrara, Graph embedding techniques, applications, and performance: A survey, Knowl. Based Syst. 151: ((2018) ), 78–94. doi:10.1016/j.knosys.2018.03.022. |
[7] | A. Grover and J. Leskovec, node2vec: Scalable feature learning for networks, in: Proceedings of the 22nd ACM SIGKDD International Conference on Knowledge Discovery and Data Mining, San Francisco, CA, USA, August 13–17, 2016, B. Krishnapuram, M. Shah, A.J. Smola, C.C. Aggarwal, D. Shen and R. Rastogi, eds, ACM, (2016) , pp. 855–864. doi:10.1145/2939672.2939754. |
[8] | W.L. Hamilton, R. Ying and J. Leskovec, Representation learning on graphs: Methods and applications, IEEE Data Eng. Bull. 40: (3) ((2017) ), 52–74, http://sites.computer.org/debull/A17sept/p52.pdf. |
[9] | Z. Hu, C. Fan, T. Chen, K. Chang and Y. Sun, Pre-Training Graph Neural Networks for Generic Structural Feature Extraction, CoRR (2019), abs/1905.13728. |
[10] | T.N. Kipf and M. Welling, Semi-supervised classification with graph convolutional networks, in: 5th International Conference on Learning Representations, ICLR 2017, Conference Track Proceedings, Toulon, France, April 24–26, 2017, OpenReview.net, (2017) , https://openreview.net/forum?id=SJU4ayYgl. |
[11] | J.B. Kruskal, Multidimensional Scaling, Vol. 11: , Sage, (1978) . doi:10.4135/9781412985130. |
[12] | A. McCallum, K. Nigam, J. Rennie and K. Seymore, Automating the construction of Internet portals with machine learning, Inf. Retr. 3: (2) ((2000) ), 127–163. doi:10.1023/A:1009953814988. |
[13] | T. Mikolov, I. Sutskever, K. Chen, G.S. Corrado and J. Dean, Distributed representations of words and phrases and their compositionality, in: Advances in Neural Information Processing Systems 26: 27th Annual Conference on Neural Information Processing Systems 2013. Proceedings of a Meeting Held, Lake Tahoe, Nevada, United States, December 5–8, 2013, C.J.C. Burges, L. Bottou, Z. Ghahramani and K.Q. Weinberger, eds, (2013) , pp. 3111–3119, https://proceedings.neurips.cc/paper/2013/hash/9aa42b31882ec039965f3c4923ce901b-Abstract.html. |
[14] | M. Ou, P. Cui, J. Pei, Z. Zhang and W. Zhu, Asymmetric transitivity preserving graph embedding, in: Proceedings of the 22nd ACM SIGKDD International Conference on Knowledge Discovery and Data Mining, San Francisco, CA, USA, August 13–17, 2016, B. Krishnapuram, M. Shah, A.J. Smola, C.C. Aggarwal, D. Shen and R. Rastogi, eds, ACM, (2016) , pp. 1105–1114. doi:10.1145/2939672.2939751. |
[15] | J. Pennington, R. Socher and C.D. Manning, Glove: Global vectors for word representation, in: Proceedings of the 2014 Conference on Empirical Methods in Natural Language Processing, EMNLP 2014, A Meeting of SIGDAT, a Special Interest Group of the ACL, Doha, Qatar, October 25–29, 2014, A. Moschitti, B. Pang and W. Daelemans, eds, ACL, (2014) , pp. 1532–1543. doi:10.3115/v1/d14-1162. |
[16] | B. Perozzi, R. Al-Rfou and S. Skiena, DeepWalk: Online learning of social representations, in: The 20th ACM SIGKDD International Conference on Knowledge Discovery and Data Mining, KDD’14, New York, NY, USA, August 24–27, 2014, S.A. Macskassy, C. Perlich, J. Leskovec, W. Wang and R. Ghani, eds, ACM, (2014) , pp. 701–710. doi:10.1145/2623330.2623732. |
[17] | J. Qiu, Y. Dong, H. Ma, J. Li, K. Wang and J. Tang, Network embedding as matrix factorization: Unifying DeepWalk, LINE, PTE, and node2vec, in: Proceedings of the Eleventh ACM International Conference on Web Search and Data Mining, WSDM 2018, Marina del Rey, CA, USA, February 5–9, 2018, Y. Chang, C. Zhai, Y. Liu and Y. Maarek, eds, ACM, (2018) , pp. 459–467. doi:10.1145/3159652.3159706. |
[18] | M. Qu, Y. Bengio and J. Tang, GMNN: graph Markov neural networks, in: Proceedings of the 36th International Conference on Machine Learning, ICML 2019, Long Beach, California, USA, 9–15 June 2019, K. Chaudhuri and R. Salakhutdinov, eds, Proceedings of Machine Learning Research, Vol. 97: , PMLR, (2019) , pp. 5241–5250, http://proceedings.mlr.press/v97/qu19a.html. |
[19] | L.F.R. Ribeiro, P.H.P. Saverese and D.R. Figueiredo, struc2vec: Learning node representations from structural identity, in: Proceedings of the 23rd ACM SIGKDD International Conference on Knowledge Discovery and Data Mining, Halifax, NS, Canada, August 13–17, 2017, ACM, (2017) , pp. 385–394. doi:10.1145/3097983.3098061. |
[20] | G. Rizzo, C. d’Amato and N. Fanizzi, An unsupervised approach to disjointness learning based on terminological cluster trees, Semantic Web 12: ((2021) ), 423–447. doi:10.3233/SW-200391. |
[21] | P. Sen, G. Namata, M. Bilgic, L. Getoor, B. Gallagher and T. Eliassi-Rad, Collective classification in network data, AI Mag. 29: (3) ((2008) ), 93–106. doi:10.1609/aimag.v29i3.2157. |
[22] | K. Sun, Z. Lin and Z. Zhu, Multi-stage self-supervised learning for graph convolutional networks on graphs with few labeled nodes, in: The Thirty-Fourth AAAI Conference on Artificial Intelligence, AAAI 2020, the Thirty-Second Innovative Applications of Artificial Intelligence Conference, IAAI 2020, the Tenth AAAI Symposium on Educational Advances in Artificial Intelligence, EAAI 2020, New York, NY, USA, February 7–12, 2020, AAAI Press, (2020) , pp. 5892–5899, https://aaai.org/ojs/index.php/AAAI/article/view/6048. doi:10.1609/aaai.v34i04.6048. |
[23] | J. Tang, M. Qu, M. Wang, M. Zhang, J. Yan and Q. Mei, LINE: large-scale information network embedding, in: Proceedings of the 24th International Conference on World Wide Web, WWW 2015, Florence, Italy, May 18–22, 2015, A. Gangemi, S. Leonardi and A. Panconesi, eds, ACM, (2015) , pp. 1067–1077. doi:10.1145/2736277.2741093. |
[24] | L. Tang and H. Liu, Leveraging social media networks for classification, Data Min. Knowl. Discov. 23: (3) ((2011) ), 447–478. doi:10.1007/s10618-010-0210-x. |
[25] | Tsinghua University, OpenNE, https://github.com/thunlp/OpenNE. |
[26] | C. Tu, C. Yang, Z. Liu and M. Sun, Network representation learning: An overview, Scientia sinica informationis 47: (8) ((2017) ), 980–996. doi:10.1360/N112017-00145. |
[27] | P. Velickovic, G. Cucurull, A. Casanova, A. Romero, P. Liò and Y. Bengio, Graph attention networks, in: 6th International Conference on Learning Representations, ICLR 2018, Conference Track Proceedings, Vancouver, BC, Canada, April 30–May 3, 2018, OpenReview.net, (2018) , https://openreview.net/forum?id=rJXMpikCZ. |
[28] | P. Velickovic, W. Fedus, W.L. Hamilton, P. Liò, Y. Bengio and R.D. Hjelm, Deep graph infomax, in: 7th International Conference on Learning Representations, ICLR 2019, New Orleans, LA, USA, May 6–9, 2019, OpenReview.net, (2019) , https://openreview.net/forum?id=rklz9iAcKQ. |
[29] | A. Vilalta, D. Garcia-Gasulla, F. Parés, E. Ayguadé, J. Labarta, E.U. Moya-Sánchez and U. Cortés, Studying the impact of the full-network embedding on multimodal pipelines, Semantic Web 10: (5) ((2019) ), 909–923. doi:10.3233/SW-180341. |
[30] | D. Wang, P. Cui and W. Zhu, Structural deep network embedding, in: Proceedings of the 22nd ACM SIGKDD International Conference on Knowledge Discovery and Data Mining, San Francisco, CA, USA, August 13–17, 2016, B. Krishnapuram, M. Shah, A.J. Smola, C.C. Aggarwal, D. Shen and R. Rastogi, eds, ACM, (2016) , pp. 1225–1234. doi:10.1145/2939672.2939753. |
[31] | S.T. Wierzchon and M.A. Klopotek, Spectral cluster maps versus spectral clustering, in: Computer Information Systems and Industrial Management – 19th International Conference, CISIM 2020, Proceedings, Bialystok, Poland, October 16–18, 2020, K. Saeed and J. Dvorský, eds, Lecture Notes in Computer Science, Vol. 12133: , Springer, (2020) , pp. 472–484. doi:10.1007/978-3-030-47679-3_40. |
[32] | S. Wold, K. Esbensen and P. Geladi, Principal component analysis, Chemometrics and intelligent laboratory systems 2: (1–3) ((1987) ), 37–52. doi:10.1016/0169-7439(87)80084-9. |
[33] | J. Xie, R.B. Girshick and A. Farhadi, Unsupervised deep embedding for clustering analysis, in: Proceedings of the 33nd International Conference on Machine Learning, ICML 2016, New York City, NY, USA, June 19–24, 2016, M. Balcan and K.Q. Weinberger, eds, JMLR Workshop and Conference Proceedings, Vol. 48: , JMLR.org, (2016) , pp. 478–487, http://proceedings.mlr.press/v48/xieb16.html. |
[34] | J. Zhou, G. Cui, S. Hu, Z. Zhang, C. Yang, Z. Liu, L. Wang, C. Li and M. Sun, Graph neural networks: A review of methods and applications, AI Open 1: ((2020) ), 57–81. doi:10.1016/j.aiopen.2021.01.001. |


