
Visual notations for viewing RDF constraints with UnSHACLed
Abstract
The quality of knowledge graphs can be assessed by a validation against specified constraints, typically use-case specific and modeled by human users in a manual fashion. Visualizations can improve the modeling process as they are specifically designed for human information processing, possibly leading to more accurate constraints, and in turn higher quality knowledge graphs. However, it is currently unknown how such visualizations support users when viewing RDF constraints as no scientific evidence for the visualizations’ effectiveness is provided. Furthermore, some of the existing tools are likely suboptimal, as they lack support for edit operations or common constraints types. To establish a baseline, we have defined visual notations to represent RDF constraints and implemented them in UnSHACLed, a tool that is independent of a concrete RDF constraint language. In this paper, we (i) present two visual notations that support all SHACL core constraints, built upon the commonly used visualizations VOWL and UML, (ii) analyze both notations based on cognitive effective design principles, (iii) perform a comparative user study between both visual notations, and (iv) present our open source tool UnSHACLed incorporating our efforts. Users were presented RDF constraints in both visual notations and had to answer questions based on visualization task taxonomies. Although no statistical significant difference in mean error rates was observed, all study participants preferred ShapeVOWL in a self assessment to answer RDF constraint-related questions. Furthermore, ShapeVOWL adheres to more cognitive effective design principles according to our performed comparison. Study participants argued that the increased visual features of ShapeVOWL made it easier to spot constraints, but a list of constraints – as in ShapeUML – is easier to read. However, also that more deviations from the strict UML specification and introduction of more visual features can improve ShapeUML. From these findings we conclude that ShapeVOWL has a higher potential to represent RDF constraints more effective compared to ShapeUML. But also that the clear and efficient text encoding of ShapeUML can be improved with visual features. A one-size-fits-all approach to RDF constraint visualization and editing will be insufficient. Therefore, to support different audiences and use cases, user interfaces of RDF constraint editors need to support different visual notations.
1.Introduction
Data interoperability is one of the biggest challenges of the current era and the Resource Description Framework (RDF) [13] offers a solution as it is compositional: RDF graphs from different sources can be merged automatically which facilitates the integration of heterogeneous data [35]. However, advantages such as RDF’s flexibility also result in challenges such as the production/consumption dilemma [35] in which the structure of data needs to be described such that producers and consumers can validate transmitted data for reasons such as security or performance [35]. In 2017, the W3C RDF Data Shapes Working Group published a recommendation to define structural constraints of RDF data [33] which can address such needs.
Quality is defined as “fitness for use” [29] implying that constraints for validation are use-case specific; human users usually define these constraints in a manual fashion and need support. Users can use any text editor to create such constraints, but need to be familiar with the textual syntax of the underlying data shape language. User evaluations of visualizations for different Linked Data concepts, such as ontology modeling [41] or Linked Data generation [26], suggest that such visualizations support users to perform respective tasks more intuitively. However, the degree of actual support offered by existing visualizations for RDF constraints is currently unknown, given the lack of scientific evidence for their effectiveness. Furthermore, some of the existing tools are likely suboptimal, as they lack support for edit operations or common constraints types.
Clearly specified visualizations – already used for some Semantic Web concepts [19, 24, 26, 41, 64] – provide a design rationale and can be designed with the human information processing system in mind [43], but are not yet taken into account for RDF constraints which makes the effectiveness of existing tools questionable. A visual notation [43] is defined as a set of graphical symbols, a set of compositional rules, as well as the definitions and meaning of each symbol, and provides an explicit design rationale. UnSHACLed [15], a tool built on top of SHACL [33], lists features for a visual data shape editor. However, important details regarding the used visual notation are not provided, for instance, the meaning of arrows or the selection of colors are not clearly specified. Similarly, RDFShape which uses “UML-like class diagrams” [21] to visualize ShEx [52] constraints does not provide a clear specification of its visual notation and neither do other recently developed tools11,22
Existing tools only provide limited or no editing capabilities, if editing capabilities are provided they are not always in line with real-life constraint use. The first version of UnSHACLed supports constraints editing. However, it does not support all constraint types, for instance, logical constraints are not yet visualized. RDFShape does not support constraints editing at all as it only visualizes constraints, thus users need to use and understand the underlying textual syntax. Similar to the initial version of UnSHACLed, the implementation of RDFShape does not yet support logical relationships such as (exclusive) disjunction; recent statistics show that disjunction constraints are broadly used [37] and thus users probably have the need to create and edit such constraints.
1.1.Research question and approach
The aforementioned motivate our high-level research question: How can we support users familiar with Linked Data in viewing RDF constraints? To address this research question, we investigated visual notations supporting users when viewing RDF constraints. Furthermore, we present a new version of our tool UnSHACLed that implements visual notations and allows users to create and edit RDF constraints.
A few visual notations already exist, but are not formally defined or do not cover all SHACL core constraints which also prevents a fair comparison. Thus, we defined two visual notations to represent all SHACL core constraints and related concepts by reusing existing notations. Different candidates to reuse exist, i.e. commonly used visual notations already familiar to users. Both the Unified Modeling Language (UML) [47] and the Visual Notation for OWL Ontologies (VOWL) [41] can be considered for a visual notation for RDF constraints as they are commonly used for RDF constraints or related Semantic Web concepts [11, 15, 21, 24, 26, 41, 46].
1.2.Hypothesis
We defined the two visual notations ShapeUML and ShapeVOWL both representing all SHACL core constraints and related concepts. Since VOWL, the underlying notation of ShapeVOWL aims to be intuitive and comprehensible [41] and visualizes the tangible graph structure of RDF, we investigate in this paper the following hypothesis: users familiar with Linked Data can answer questions about visually represented RDF constraints more effective with ShapeVOWL than with ShapeUML.
1.3.Contributions
We compare the notations with respect to design principles for visual notations [43] derived from several seminal works in human cognition [4, 23, 58, 61, 65] and evaluate them in a comparative user study.33 We implemented both visual notations in UnSHACLed to allow creating and editing constraints in a constraint language independent way. Users can switch between visual notations and use the created RDF constraints to validate input data from within the same editor.
Our contributions in this paper are:
1. introduction of two alternative visual notations: ShapeUML and ShapeVOWL;
2. analysis of both visual notations with respect to cognitive effective design principles;
3. comparative evaluation between ShapeVOWL and ShapeUML with a user study; and
4. presentation of our open source UnSHACLed editor implementing both visual notations.
The comparative analysis based on cognitive effective design principles [43] reveals that ShapeVOWL adheres to more principles, thus in theory is more cognitively effective. An additional comparative user study shows that there is no significant mean error difference when answering questions about RDF constraints with both notations, however, also that in a self-assessment users prefer ShapeVOWL. We implemented both visual notations in our tool UnSHACLed to also allow editing of RDF constraints in a visual fashion.
The remainder of the paper is structured as follows. We provide background knowledge on data shape languages and visual notations in Section 2 and present two visual notations in Section 3. In Section 4 we compare both presented visual notations based on design principles for cognitive effective visualizations. In Section 5 we present our visual editor UnSHACLed. In Section 6 we present the comparative user evaluation and its results. We discuss and conclude in Section 7.
2.State of the art
In this section, we discuss (i) existing RDF constraint languages (ii) the use of different constraint types suggesting visualizations for manual creation, (iii) existing RDF constraint visualization tools, (iv) closely related Semantic Web visualizations providing possible visualizations to extend, (v) visual notations for human cognition, and (vi) visualization tasks describing the interaction between humans and visualizations.
2.1.RDF constraint languages
Several RDF constraint languages were proposed in the past, we describe how they are related. In this work we consider the Shapes Constraint Language (SHACL) because it (i) is a W3C recommendation, (ii) clearly defines constraint types in its core specification, and (iii) has a significant intersection with the Shape Expressions Language (ShEx) [35], a widely used RDF constraint language.
SPARQL Inference Notation (SPIN) [32] was the earliest W3C member submission (2011). A syntax and a vocabulary were defined to describe constraints and inference rules based on SPARQL.
A few years later in 2014 another two W3C member submission were submitted: the Resource Shape (ReSh) [54, 55] which defines a high-level RDF vocabulary to specify the shape of RDF resources and the grammar-based Shape Expressions Language (ShEx) [51]. ShEx was inspired by ReSh yet provides more expressivity [52].
The Shapes Constraint Language (SHACL) [33] became a W3C recommendation in 2017 and is seen as the legitimate successor of SPIN [31]. SHACL is a constraint language for describing and validating RDF graphs. It defines a RDF vocabulary to define constraints and a specified validation process to validate RDF data based on described constraints: data graph nodes are validated with data shape graph constraints and a validation report in RDF following the SHACL vocabulary is generated. Furthermore, SHACL provides 31 core constraint types and other concepts related to validation both defined using the aforementioned vocabulary. These other concepts comprise (i) a targeting mechanism to assign data graph nodes to data shape graph constraints, (ii) property paths to further specify on which reachable node properties constraints apply, (iii) severity of data shapes as annotation to indicate the severity of a constraint violation in the validation report, (iv) deactivation of data shapes to exclude them from the validation process, and (v) non-validating characteristics to annotate data shapes.
2.2.Creating constraints
More than eighty constraint types were identified [7] from which a subset is used as axioms in ontologies [36] and a subset motivated the creation of SHACL [60]. Existing approaches to generate RDF constraints use UML diagrams or ontologies as source but usually cover only a limited subset of SHACL core constraint types due to an incomplete mapping. We count SHACL core constraint types based on the “Core Constraint Components” of SHACL specification [33].
The Open Standards for Linking Organizations (OSLO) initiative of Flanders, Belgium generates SHACL constraints annotated UML models [16] representing RDF classes and properties. The generated SHACL constraints are limited to a subset of constraint types, i.e. cardinality, class, and datatype, therefore only supporting 3 out of 31 SHACL core constraint types.
Automatic Generation of SHACL Shapes from Ontologies (Astrea) [10] is based on a mapping of conceptual restrictions between patterns of OWL axioms and SHACL constraints. These patterns only contain 20 out of the 31 SHACL core constraint types when counting the core constraint types of the SHACL specification and not their parameterizations. For instance, we count the constraint type sh:nodeKind once and we do not count its parameterizations, such as “sh:nodeKind sh:Literal” or “sh:nodeKind sh:BlankNode”. Besides these core constraints, Astrea also covers other concepts of the SHACL specification, namely property paths and terms related to targeting which applies elements of the shapes graph to elements of the data graph; we also support these concepts and additionally the concepts of deactivation and severity of data shapes.
TopQuadrant generated SHACL constraints from the RDFa of the schema.org vocabulary.44 These constraints consist of the constraint types class, datatype and disjunction, i.e. only 3 out of 31 constraint types.
Manually created RDF constraints are theoretically not limited by any mapping as a user potentially can use all constraint types of a specification. However, similar to ontology axioms [36] only a subset seems to find common use. In our previous work [37] and later updated and extended statistics,55 we investigated the use of constraint types in SHACL shapes. We found that 30 out of 31 constraint types were used, but only a few are used in more than 60 percent of surveyed GitHub repositories: value type (class, datatype, nodekind), cardinality and disjunction constraints. Thus, RDF constraint visualizations and editors should at least cover these commonly used constraint types; however, to avoid a self-fulfilling prophecy where such a limitation reinforces the use of already commonly used constraint types, editors should not be limited to only these constraint types either.
2.3.RDF constraint editors
Tools to edit RDF constraints already exist but are either based on a specific textual syntax or have no formally defined visual notation.
Fajar et al. [18] implemented a SHACL editor as plugin for Protégé. However, their plugin is text-based and does not use a visualization for RDF constraints, therefore users are required to learn a specific RDF constraint language. Similarly, the tool ShapeDesigner from Boneva et al. [6] provides a text-based interface in which users are confronted with ShEx and SHACL representations of RDF constraints.
De Meester et al. [15] list features for a visual data shape editor implemented in an early version of the visual editor UnSHACLed. Although a few comments regarding the visualization were made, important details are not specified. For instance, the meaning of arrows or the selection of colors is not clearly specified, preventing developers of other tools from effectively implementing the visual notation. As a result, the original visualization of UnSHACLed is coupled to the tool hampering the accessibility for users across tools.
RDFShape [21] considers UML-like class diagrams. However, it does not cover all commonly used constraint types and, similarly to UnSHACLed, does not specify all details of how RDF constraints are visualized. The tool visualizes RDF constraints without the possibility of editing the constraints via the visualization and, currently, does not support logical relationships, e.g. (exclusive) disjunction,66 – commonly used according to preliminary statistics [37]. Even though support for additional constraint types can be implemented, it is not specified how it should be visualized, leaving room for different interpretations.
OntoPad77 and shaclEditor88 are visual editors for RDF providing a way to visually interact with SHACL shapes. Similar to the early version of UnSHACLed, neither of these two editors provide a formally specified visual notation.
The desktop application SHAPEness99 visualizes RDF constraints and also allows visual editing, recently a user study was performed to evaluate the application (currently under review [48]). However, even though the user study with this tool reported that expectations of expert users were met, the visualization of the constraints is – similar to the other tools mentioned above – coupled to the tool and not formally defined.
Commercial tools with support for RDF constraints include TopBraid Composer, AllegroGraph, Stardog, GraphDB and Metaphactory.
The tool TopBraid EDG from TopQuadrant, accessible as demo version from the free TopBraid Composer Maestro edition, visualizes SHACL using UML diagrams. Node shapes are visualized as rectangles, properties of related property shapes are listed within this rectangle, and constraints are visualized in colored font and/or as relationships.1010 However, similarly to other tools listed above, this visualization is coupled to the tool and no dedicated specification of the visualization exists. Furthermore, these diagrams are not yet interactive, i.e. the constraints can not be edited using the visualization.1111
The triple stores/knowledge graph systems AllegroGraph,1212 Stardog1313 and GraphDB1414 support SHACL for validation, but do not provide visualizations of constraints. Similarly, the knowledge graph management system metaphactory [25] supports SHACL, but only visualizes validation reports and not constraints.
2.4.Semantic web visualizations
We look into the visualization of other Semantic Web concepts because they might be relevant for the visualization of RDF constraints.
UML is often used for modeling ontologies. The creation of constraints on RDF data from a conceptual point of view shows similarities to the creation of axioms in an ontology. Thus, visualizations for ontologies would be expected to be applicable to RDF constraints as well. A simple version of UML is used within the structural specification of OWL [5] to visualize the definition of conceptual restrictions in the form of axioms. Cranefield and Purvis [11] demonstrate how a subset of UML and the associated Object Constraint Language (OCL) [45] is used to model ontologies. Even the Object Management Group (OMG) – which maintains the UML specification – defined a specific UML profile for OWL and RDF, the Ontology Definition Metamodel (ODM) [46].
A plethora of ontology visualizations exists, but VOWL appears to be the most prominent visualization with respect to practical use and user familiarity for several concepts related to RDF constraints. Combining findings of several surveys [1, 3, 17, 28, 30, 42] and two works [8, 22] presenting visualization tools, 84 ontology visualization tools were identified. Widoco [20], a widely used tool to create ontology documentations, uses WebVOWL [39] to visualize ontologies. WebVOWL implements the Visual Notation for OWL Ontologies (VOWL) [41]. VOWL is also implemented as a plugin for the commonly used modeling tool Protégé in ProtégéVOWL [40]. This suggests that users who use ontologies and read their documentations have at least encountered a VOWL-based visualization. Besides ontologies, VOWL-based visualizations also exist for queries [24], Linked Data visualization [64] and generation [26], all closely related to RDF constraints.
2.5.Visual notations for human cognition
Visual notations are created for human users, thus works related to perception and cognition are relevant to our work. We outline how the most relevant frameworks are combined in the design theory of Moody [43] and its design principles, which we therefore consider for an analysis of our proposed visual notations. For a detailed list of works Moody’s design theory is based on, we refer the reader to the “Physics Of Notation” [43].
Moody’s design theory is based on communication theory [58] in which a diagram-creator encodes an intended message using a visual notation and a diagram-user decodes this message to retrieve the intended meaning [43]. Moody defines design principles that comprise existing theories and empirical findings to create visual notations for the human perceptual processing (seeing) and cognitive processing (understanding) [43], and thus aimed for optimized decoding by humans.
From a perceptual perspective, this decoding is described based on works related to Gestalt principles [65] and feature integration theory [61], the organization of visual stimuli into structures, respectively their pre-attentive and parallel detection by humans. Such decoding features influence the encoding for which Moody relies on Bertin’s work on Semiology of Graphics [4], i.e. defined visual variables such as shape, size or color which can be used to formally define a visual notation. Furthermore, the design principles include measures of anomalies in the correspondence between symbols of the visual notation and the semantic constructs they represent. Therefore it can be measured whether a visual notation fulfills the requirements of a notational system according to Goodman’s theory of symbols [23].
Considering cognition, slower conscious processes such as retrieving prior knowledge from long-term memory are involved. Prior knowledge in this context may refer to already familiar visual notations. Dasgupta [14] identified a familiarity bias, i.e. experts prefer using familiar but suboptimal notations with which the experts perform worse compared to non-familiar optimal visual notations. We explicitly address such prior knowledge as we base our designed visual notations on the already familiar and broadly used visual notations UML and VOWL, thus aiming for the sweet spot between familiar notations and optimal design.
2.6.Visualization tasks
The interaction between humans and visualizations can be systematically described using visualization tasks, this allows us to consider a common set of tasks for our user study.
Brehmer and Munzner [9] reviewed more than 20 works to define a typology of user tasks, on the one hand powerful enough to describe the why (intention), how (interaction) and what (input/output) aspect of visualization tasks, and on the other hand aligning visual tasks of all previous works; therefore their work also covers the seminal works of Wehrend and Lewis [63], Zhou and Feiner [67], and Amar et al. [2], which provide visual task taxonomies and exemplified tasks.
Such taxonomies were evaluated in user studies for example by Morse and Lewis [44] in the form of visual prototypes, or by Valiati et al. [62] for multidimensional visualizations. Saket et al. [56] performed a user study to compare tabular data to other visualization types by instantiating questions from visualization tasks of the taxonomy from Amar et al. [2]. Similarly, for our work – in which we compare two different visual notations representing the same data – we instantiate questions from this taxonomy which, based on a previous alignment [9], could also be annotated with intents and interactions to further investigate editing approaches in the future.
3.Visual notations
We introduce two visual notations for RDF constraints to establish a baseline for a fair comparison, we provide general design considerations for both notations, ShapeUML (based on UML) and ShapeVOWL (based on VOWL). Both visualize fundamental constructs of RDF constraint languages: constraints and the context in which they are applied, i.e. data shapes. We describe which visual variables are used as graphical primitives for both notations, following Moody [43] and thus make design decisions transparent. Cognitive effective design principles [43] where taken into account where applicable, a detailed comparison between both notations based on these principles can be found in the next section (Section 4).
Both notations have different visual features and represent all SHACL core constraints and additionally concepts related to targeting, property paths, severity and deactivation; although both notations are built based on SHACL, they are constraint language independent and semantic constructs of other constraint languages can be mapped to it. Thus, both notations represent the same semantic constructs and their only difference are their visual features, enabling a fair comparison. Currently the visual notations visualize all SHACL core constraints, where necessary with (additional) constraint-language-independent text labels; Figs 1, 2, 5, 6 list all SHACL core constraints and the other supported concepts together with a corresponding terminology mapping used by our notations ShapeUML and ShapeVOWL.
Fig. 1.
Correspondence between semantic constructs and ShapeUML: SHACL core constraints (left) and graphical notations (right).
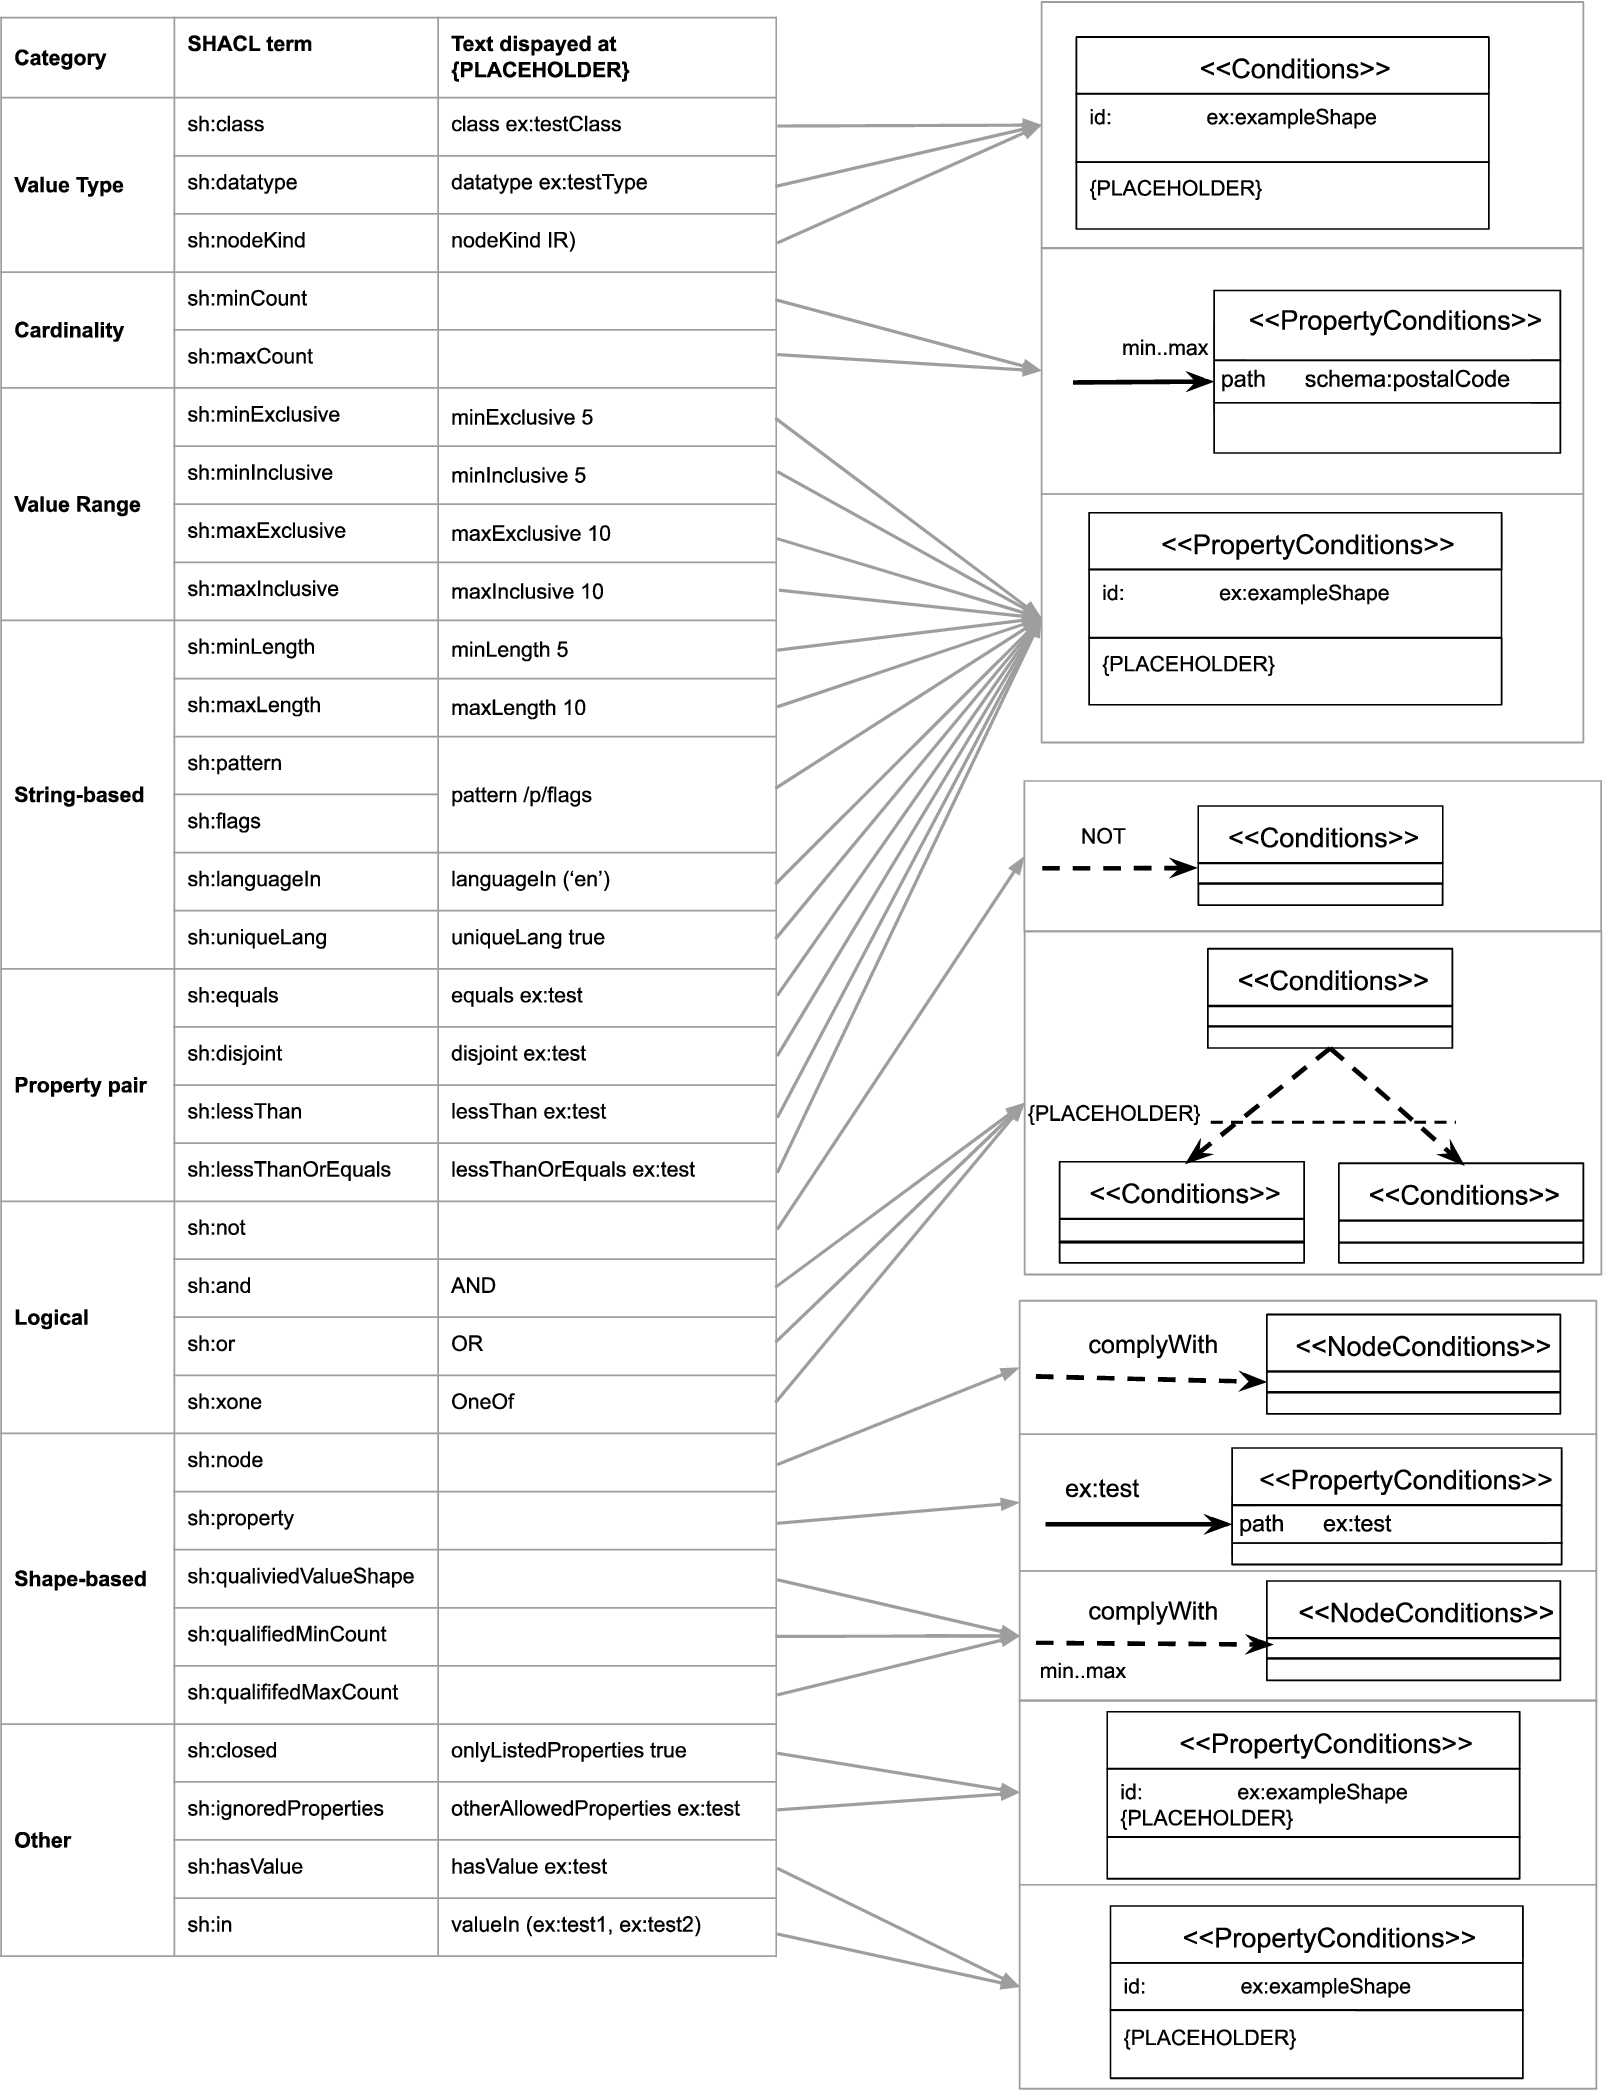
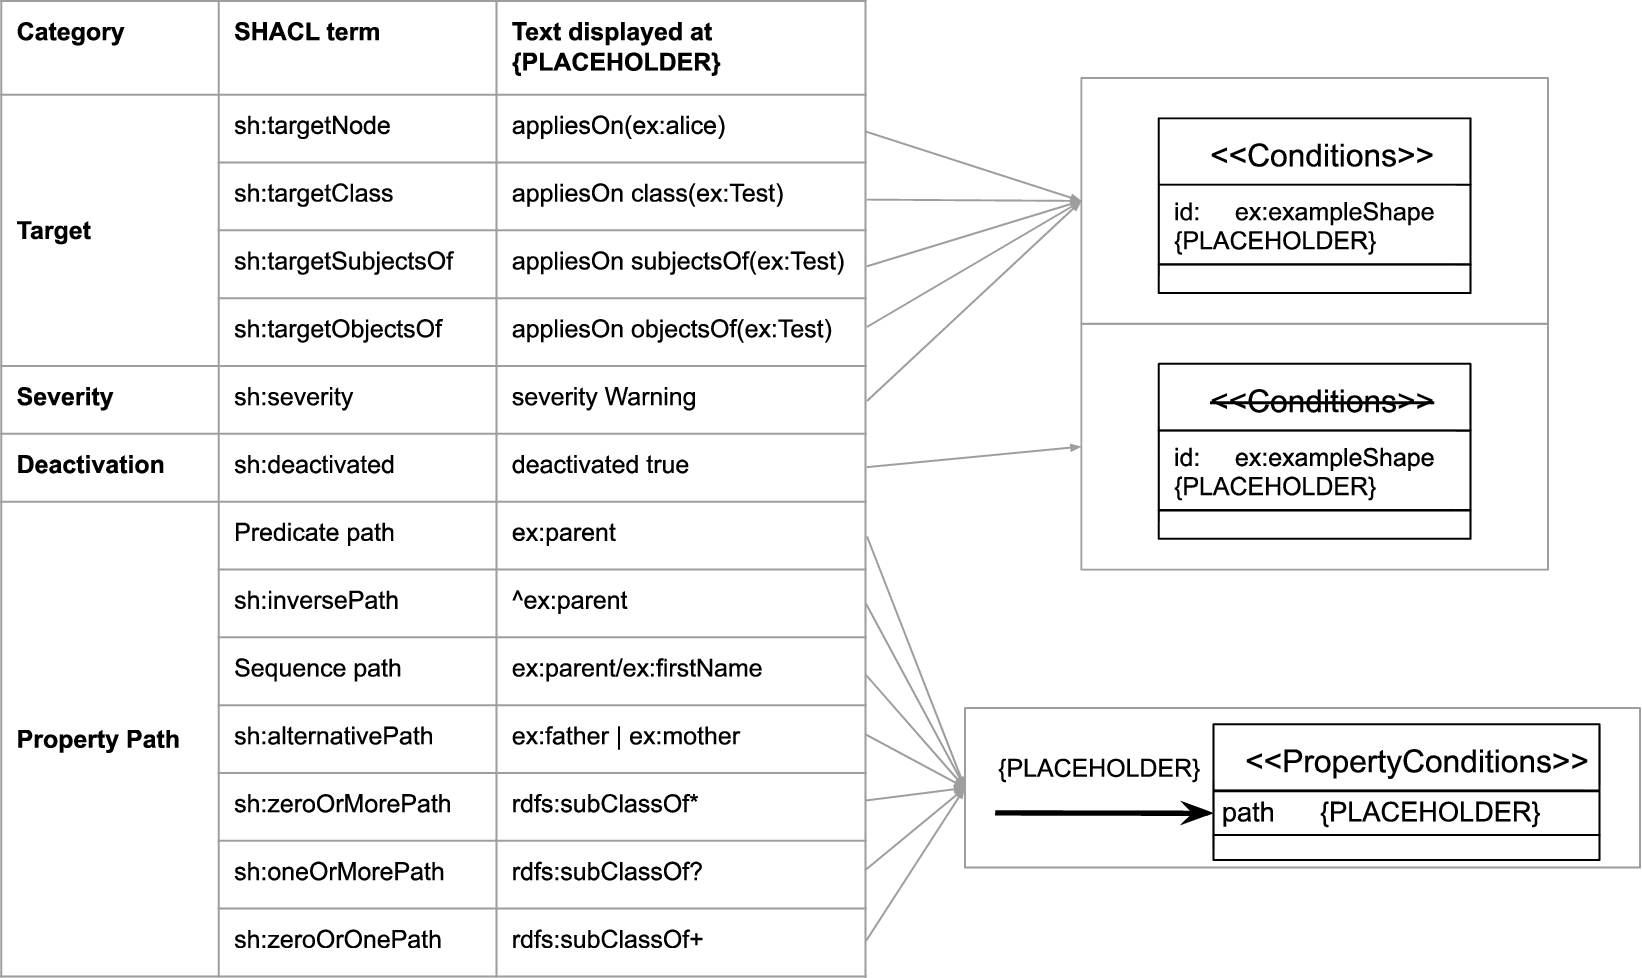
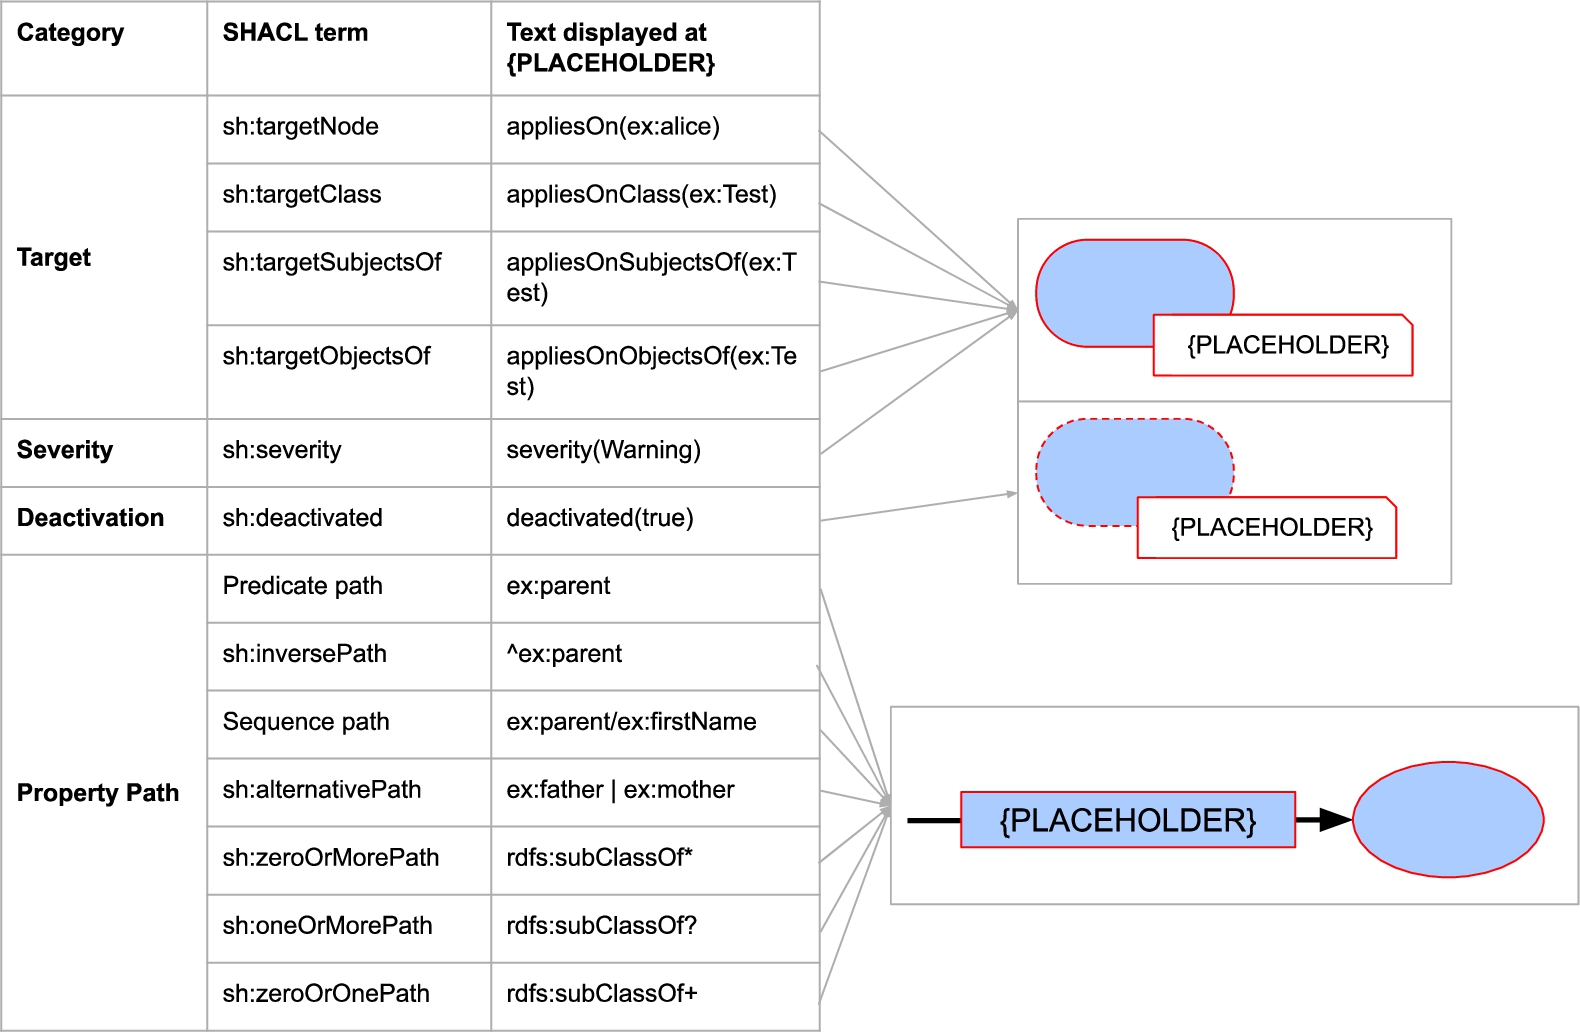
Fig. 2.
Correspondence between semantic constructs and ShapeUML: other relevant SHACL concepts besides core constraints (left) and graphical notations (right).
3.1.ShapeUML
The notation ShapeUML is based on the Ontology Definition Metamodel (ODM) [46] in which both nodes and properties are first-class UML constructs and, thus, graphically represented as class diagram boxes (rectangle). Therefore, constraints on both nodes and properties can be expressed and logical relationships between different types of data shapes can be visualized.
The graphical primitives of ShapeUML are the following visual variables [43]: shape, edge, text, border and position. The full specification is available at https://w3id.org/imec/unshacled/spec/shape-uml/20210118/. In the remaining, we describe the graphical primitives and elaborate with an example.
3.1.1.Shape
We reuse classes (rectangles) from UML [47] to represent both node and property shapes, redefine the meaning of rectangle’s compartments for RDF constraint specifics, introduce data shape stereotypes to indicate a data shape’s type and distinguish it from other UML rectangles representing other concepts.
We use the graphical primitive shape to represent the fundamental construct data shapes and its subclasses node and property shape thus adhering to ODM [46]. Data shapes are represented using a rectangle (Fig. 3 (1)), and describe constraints applying on subjects and objects from the data graph. Node shapes describe constraints on individual focus nodes, while property shapes describe constraints for reachable nodes via a property path.
Fig. 3.
Constraints visualized using ShapeUML: a subject valid to the person data shape should have an IRI (1), at least one but maximum two ex:address properties (2) of class schema:PostalAddress (3) and the object of at least one ex:address property should comply with the existing data shape ex:validAddress (4). Additionally, the subject valid to person should either have exactly one ex:fullName or at least one schema:givenName (5) and at least one schema:familyName all of datatype xsd:string. The value of ex:fullName must not comply with the data shape ex:organizationShape (6). Addresses must only have values for the property postalAddress with an exception for rdf:type (7). Constraints of the ex:organizationShape are not considered for validation (8).
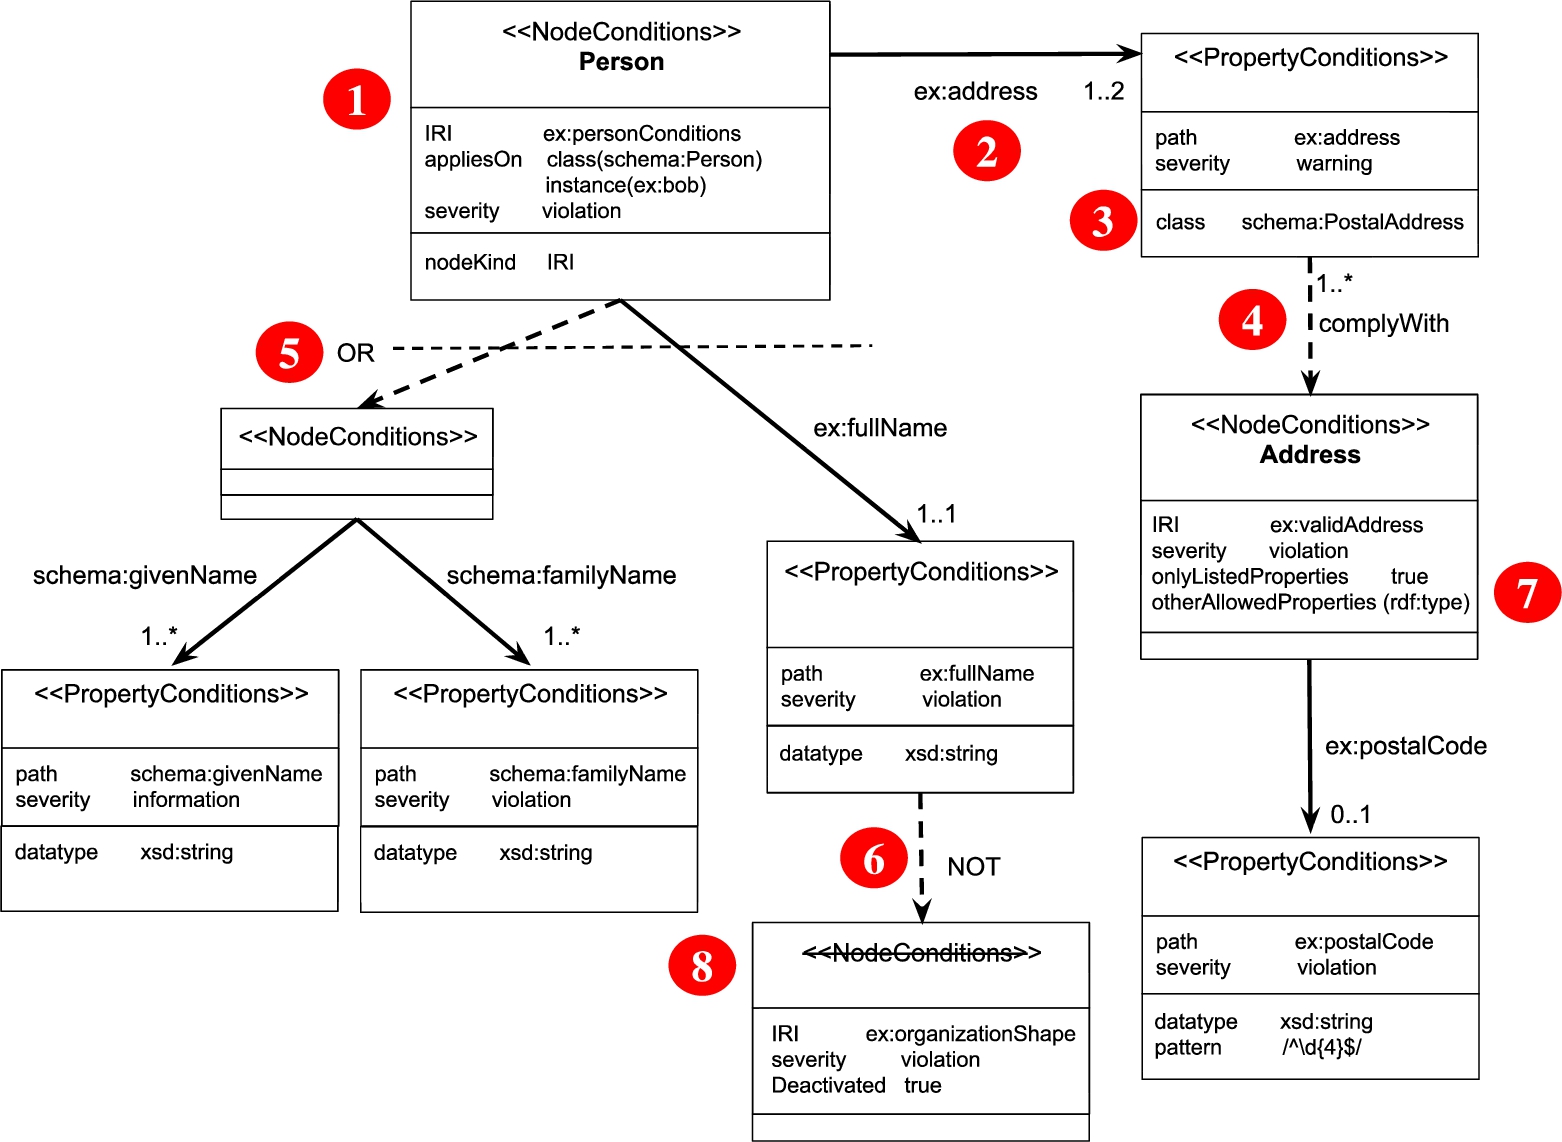
In UML “a class is drawn as a solid-outline rectangle with three compartments separated by horizontal lines” [47] which we redefine for data shapes. The upper compartment contains the data shape’s type and name (Fig. 3 ). We determine the data shape’s type by reusing UML concepts similar to the UML profile for OWL and RDF [46], i.e. we define UML “stereotypes” to signify what the rectangles represent: node shapes declared as ≪NodeConditions≫, property shapes declared as ≪PropertyConditions≫ and (if the data shape type is not specified) data shapes as ≪Conditions≫. The name of the data shape is displayed as bold text to support the user in the identification and differentiation of data shapes. This name may be populated from rdfs:label values of the data shape, thus following best practices in labeling RDF concepts for humans. Both the middle and lower compartment list text-based key-value pairs, therefore we stay compliant to UML. Additionally, constraint language independent labels (Figs 1, 2) are used to convey meaning and support users. The middle compartment lists information about the data shape’s identification and validation (Fig. 3
 ). Thus, data shapes are similar to UML where the middle compartment usually contains the attributes of classes, i.e. what characterizes them. The lower compartment contains actual constraints as a key-value list (Fig. 3
 ).
).
3.1.2.Edge
We reuse directed solid edges from ODM/UML [46] to represent relationships, reuse dashed edges overlaying individual edges from UML [47] to represent one-to-many relationships, and redefine directed dashed edges for RDF constraint specifics.
Directed edges represent different relationships between data shapes and, thus, ShapeUML is able to represent relationships between different types of data shapes. Directed edges have a label at the center of the edge and possibly cardinalities next to the ends of the association (Fig. 3 ). These edges associate a data shape with another data shape or set of data shapes.
We introduce solid and dashed directed edges to visually distinguish between different types of relationships. We indicate the edges from node shapes to property shapes as a directed solid edge (Fig. 3 ) as it represents relationships between subjects and objects of the data graph. The label of such a connection is the property path of the connected property shape which supports readability as humans can read the label while processing the edge and do not have to look for this label elsewhere in a rectangle; annotating an edge with a label also follows UML. A dashed directed edge with the label complyWith indicates that the source data shape needs to comply with the constraints of the destination data shape (Fig. 3
 ). Therefore such connections can be distinguished from property shape connections both via a visual difference and a different label. Similarly, a dashed directed edge with the label NOT indicates that the source data shape must not comply with the destination data shape (Fig. 3
 ). A dashed line vertically over individual edges with label next to the dashed line indicates one-to-many relationships between a data shape to a set of data shapes, following the UML specification [47] (Fig. 3
 ).
).
3.1.3.Text
We reuse text from UML to represent different concepts and introduce striked through text for data shape stereotypes to indicate a deactivated data shape.
Text represents constraints stated by a data shape and provides additional information where necessary. Text is added to the upper, middle and lower compartment of a data shape and as label on edges. The type of a data shape in the upper compartment can be struck through, showing that the constraints of this data shape are not used for validation, i.e. the data shape is deactivated (Fig. 3 ). This visual aid aims in the quick identification of deactivated data shapes which does not introduce any visual symbol and thus does not deviate too much from the UML specification. Values referring to RDF terms can be shortened with a prefix, therefore the tool implementing the visual notation has to provide a prefix list.
3.1.4.Border
We reuse solid borders from UML, they are used for data shapes. According to the UML standard, stylistic details, such as line thicknesses, are not material to the specification. So, all data shapes are rendered using solid borders.
3.1.5.Position
We reuse positions at the beginning and end of directed edges from UML to represent cardinality-related constraint types. Within UML, association ends are among others specified by their cardinality.
In ShapeUML, cardinality constraints referring to properties are visualized next to the arrow head of a directed edge, i.e. minCount and maxCount (Fig. 3 ); cardinality constraints referring to data shapes are visualized next to the source of a directed edge, i.e. qualifiedMinCount and qualifiedMaxCount (Fig. 3
 ). Thus, the visualization reflects the reading direction, for example: the person data shape requires the property ex:address at least 1 but maximum 2 times (Fig. 3
 ) vs a valid address property requires that at least 1 property value need to comply with the address node shape (Fig. 3
 ).
).
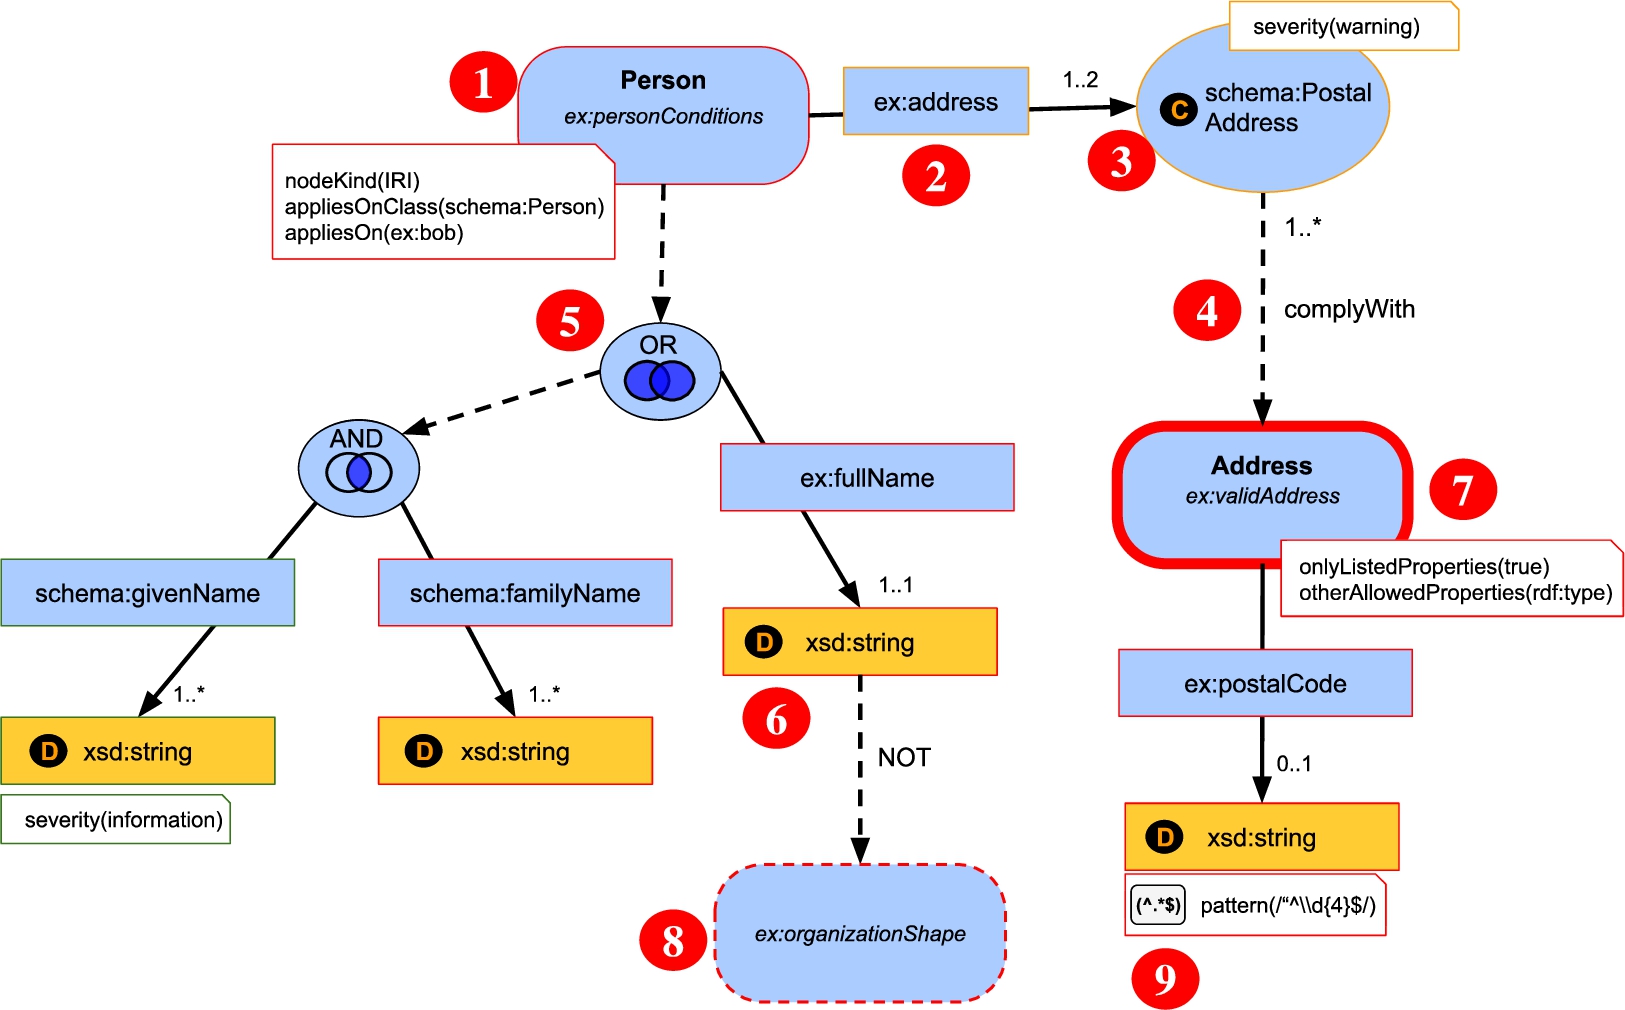
Fig. 4.
Constraints expressed using ShapeVOWL: a subject valid to the person data shape should have an IRI (1), at least one but maximum two ex:address properties (2) of class schema:PostalAddress (3) and the object of at least one ex:address property should comply with the existing condition set ex:validAddress (4). Additionally, the subject valid to person should also either have exactly one ex:fullName or at least one schema:givenName (5) and at least one schema:familyName all of datatype xsd:string. The value of ex:fullName must not comply with the data shape ex:organizationShape (6). Addresses must only have values for the property postalAddress with an exception for rdf:type (7). Constraints of the ex:organizationShape are not considered for validation (8). ShapeVOWL also visualizes optional accompanying logos for constraint types (9).
3.1.6.Visual example
The visual vocabulary of ShapeUML defined in the last section, can be used to represent SHACL shape graphs. We present and discuss an example (Fig. 3).
ShapeUML defines visual elements for data shapes (Fig. 3). Data shapes of different types (≪Conditions≫, ≪NodeConditions≫ and ≪PropertyConditions≫) can be uniquely identified with an IRI but can also have a human readable label. For example, a node shape uniquely identified (ex:personConditions, middle compartment) can have the human readable name Person (bold label in upper compartment) (Fig. 3 ). Such a node shape can by default be applied on resources, e.g. ex:bob, or all instances of a class, e.g. schema:Person, both indicated by the key appliesOn in the middle compartment of a ShapeUML data shape.
Constraints are listed in the lower compartment of a data shape rectangle. A node could be constrained to be of a specific type using the nodeKind constraint. Similarly, constraints on property values are placed in the lower compartment of the corresponding ≪PropertyConditions≫ property shape. A fictive person node shape can represent the constraint that data valid to this data shape must have a unique identifier. And in the same fashion, the value of an ex:address property can be constrained to be of a specific class (Fig. 3 ).
).
Cardinality constraints are represented using text and position. Therefore a constraint to express that a person must have at least one but maximum two addresses will be denoted with the (inclusive) cardinality specification 1..2 next to the arrow head of the directed edge which connects the person node shape with the address property shape (Fig. 3 ).
).
Dashed directed edges can be used to indicate reuse of data shapes. To denote that the value of at least one of the aforementioned ex:address properties must comply with the ex:validAddress data shape, a dashed relationship with corresponding cardinalities 1..* is drawn at the source property shape (Fig. 3 ). In case every address should comply with the provided data shape, the qualified cardinalities at the source of the dashed arrow need to be removed. Such a removal would mean for a SHACL implementation that the two constraints sh:qualifiedValueShape and related sh:qualifiedMinCount are replaced by a single sh:node constraint. However, this is transparent in the visualization and users are not bothered with this specific terminology.
Data shapes can be connected with logical operators to build more complex constraints (Fig. 3 ): subjects valid to the Person node shape should have either exactly one ex:fullName property, or at least one schema:givenName and at least one schema:familyName: dashed vertical OR edge overlaying individual edges.
Fig. 5.
Correspondence between semantic constructs and ShapeVOWL: SHACL core constraints (left) and graphical notations (right).
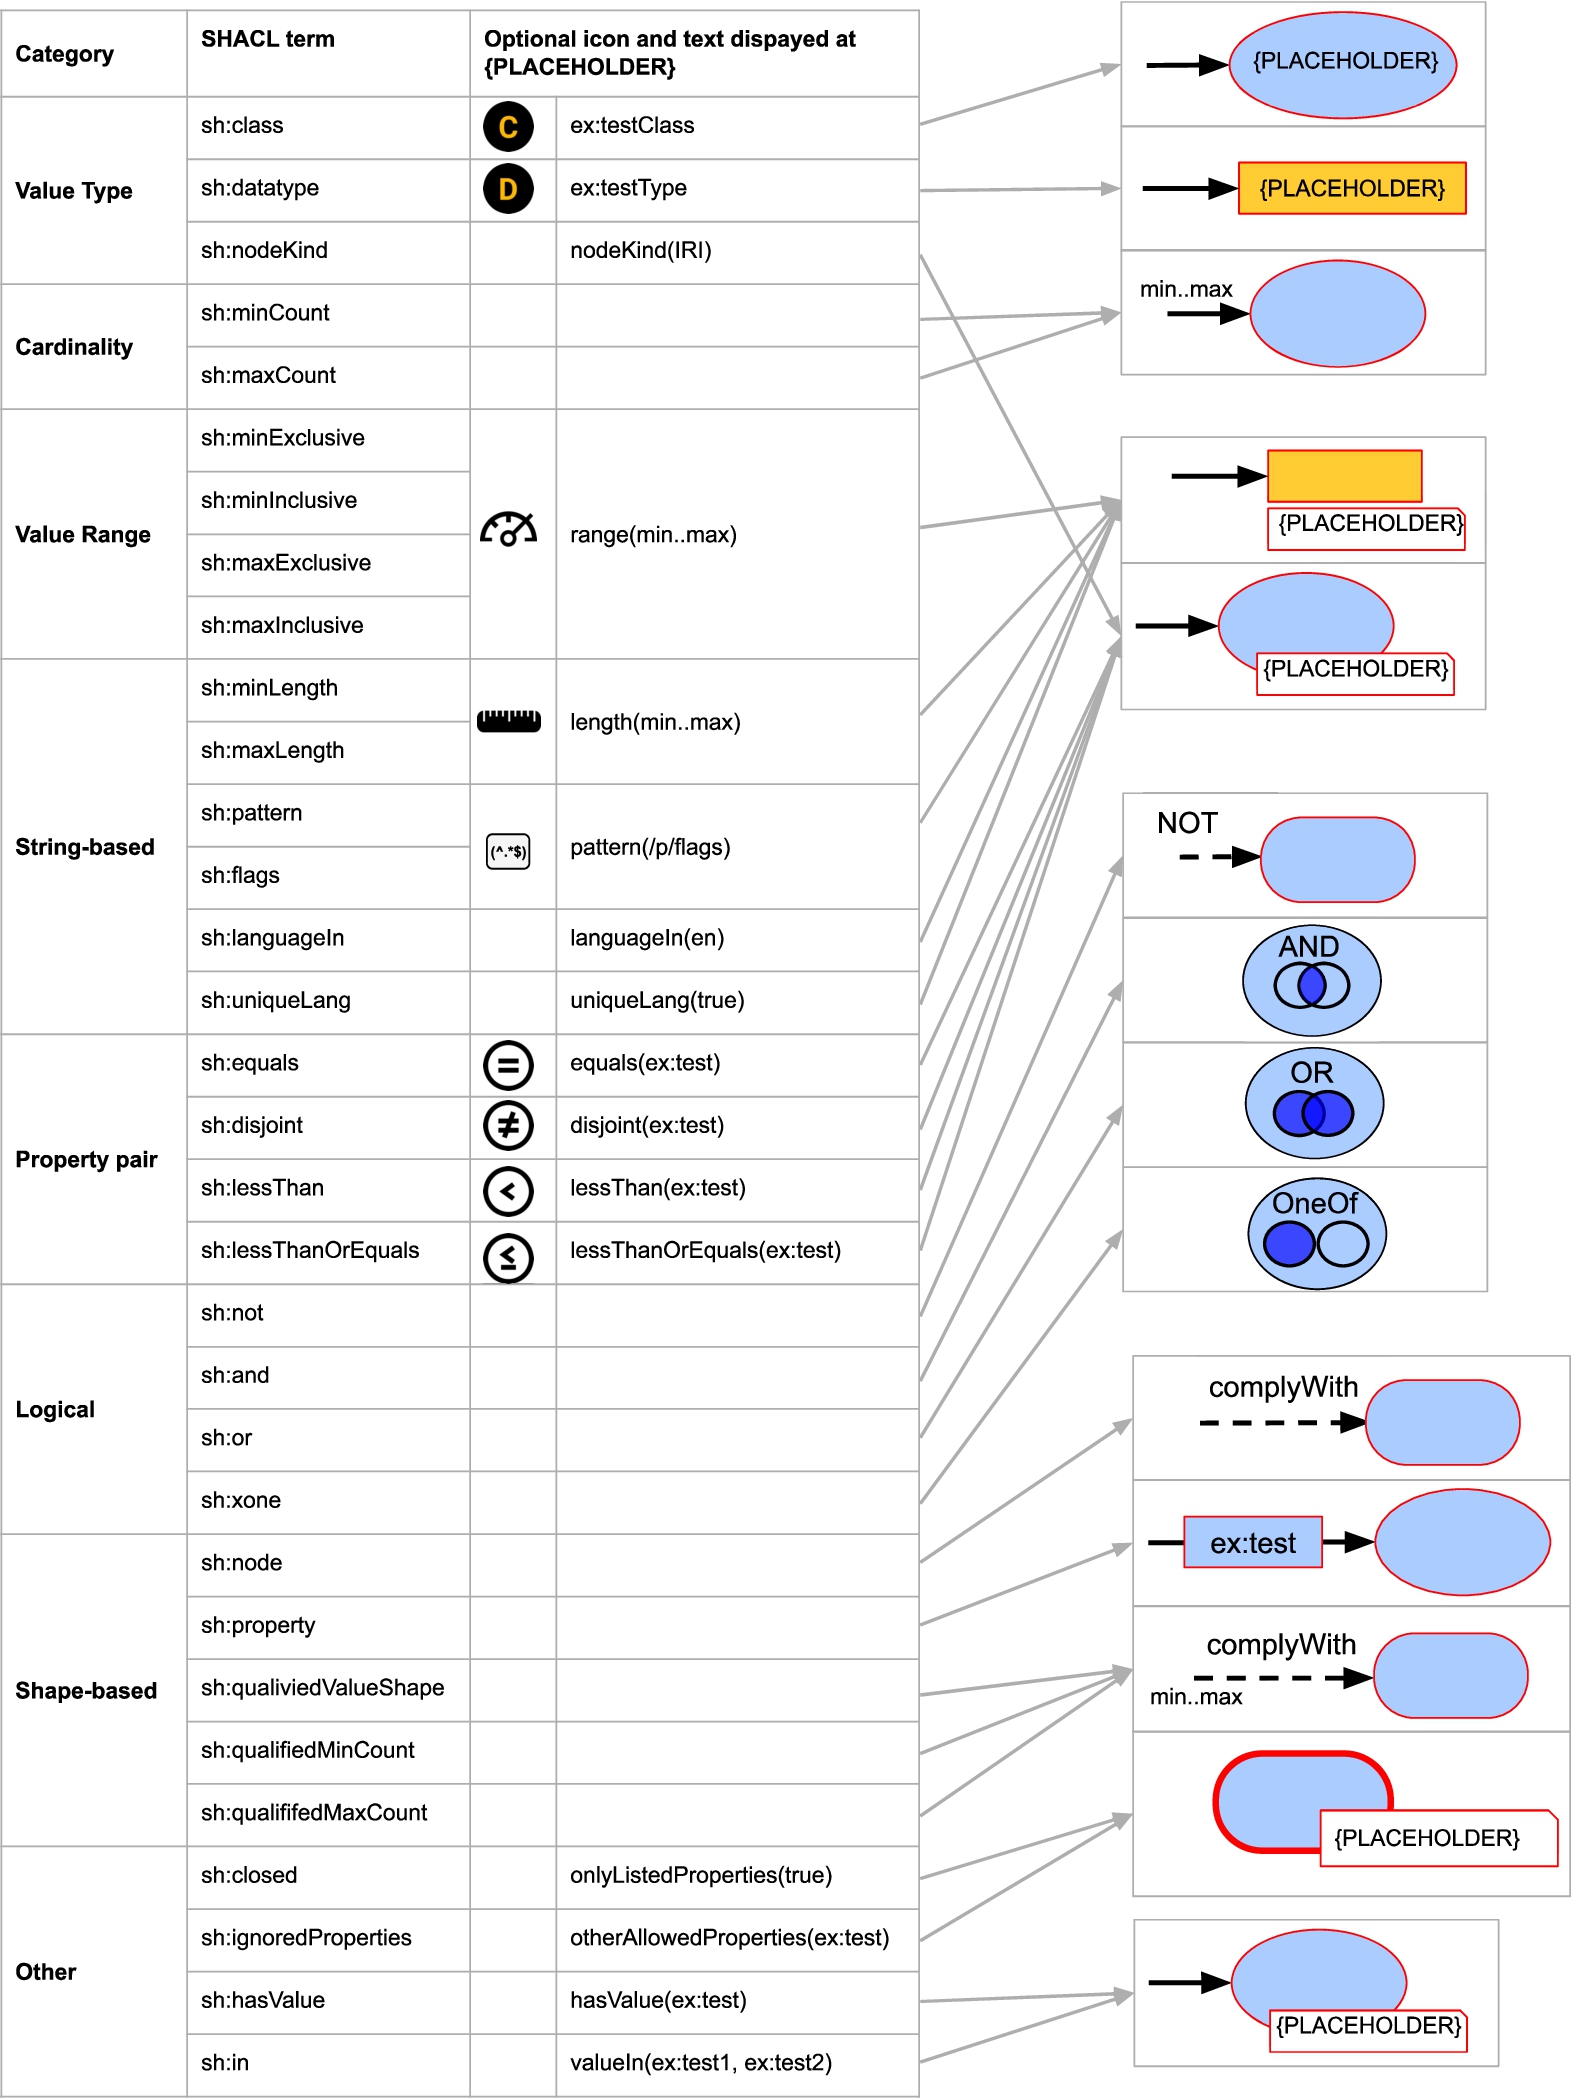
Fig. 6.
Correspondence between semantic constructs and ShapeVOWL: other relevant SHACL concepts besides core constraints (left) and graphical notations (right).
3.2.ShapeVOWL
This visual notation is based on VOWL [41] and designed to be as close as possible to it. The graphical primitives of ShapeVOWL are shape, edge, text, border, position and color. The full specification is available online at https://w3id.org/imec/unshacled/spec/shape-vowl/20211008 We describe the graphical primitives and elaborate with an example.
3.2.1.Shape
We reuse blue ellipses and blue and yellow rectangles from VOWL to represent subjects, predicates and objects of the data shape graph, introduce white note-elements to represent constraints and introduce blue rectangles with rounded corners to represent node shapes.
The graphical primitive shape distinguishes the fundamental constructs node shapes, property shapes and constraints, and represents one-to-many relationships. This follows VOWL where nodes in the graphs as well as specific restrictions such as disjointness are represented with dedicated nodes. Node shapes, subjects of triples, are represented as blue rectangles with rounded corners (Fig. 4 ), property shapes, the predicate and object of a triple, as rectangular label on a directed edge (Fig. 4
 ) and either a ellipse or rectangle at the end of the edge representing the object (Fig. 4
 ,
,  ), and constraints as rectangle with the upper right corner bent (note element) (Fig. 4
 ,
,  ). Thus, node and property shapes align with VOWL as the data shapes appear like the RDF graph on which they define constraints on.
The note-element, containing constraints as text, is visually attached at the node shape or property shape indicating the constraints applying on the represented subjects, predicates or objects of a triple; constraints are visualized where they apply to facilitate the processing of the visualization by users. We also introduce ellipses as intermediate element to denote one-to-many relationships (see edges).
3.2.2.Edge
We reuse directed solid edges with rectangular labels from VOWL to represent properties and redefine directed dashed edges for RDF constraint specifics.
Edges represent relationships between data shapes which makes ShapeVOWL able to represent different kind of constraints in a visual fashion. Directed dashed edges (Fig. 4 ) refer to relationships between data shapes and denote their label directly as text on top of the relationship. They indicate that the source data shape needs to comply with the constraints of the destination data shape.
Directed solid edges are part of a property shape and indicate their label in a rectangle above the edge (Fig. 4 ), following VOWL. The label of directed solid edges is the property path of the represented property shape; relationships between data shapes are visually distinguished from property shapes due to the use of different edges.
Similar to VOWL, cardinalities are denoted next to the arrow head (Fig. 4 ), but additionally data shape related qualified cardinalities are denoted at the start of a directed dashed edge (Fig. 4
 ). Node and property shapes may refer to multiple other node and property shapes in a one-to-many relationship to represent logical relationships. We represent such relationships using additional ellipses, representing the meaning of individual one-to-many relationship, i.e. conjunction and disjunction (Fig. 4
 ), similar to certain restrictions in VOWL, e.g., disjointness.
3.2.3.Text
We reuse text from VOWL to represent labels, redefine datatype to represent datatype constraints, introduce text to represent constraints and italic text to represent the unique identifier of data shapes.
We use text to represent constraints stated by data shapes, unique identifiers, and labels. Text is added in constraint note elements, node shapes and property shapes. Constraint note elements contain constraints in the form of text where the constraint’s name is listed followed by its value in parentheses. This allows a consistent representation of different constraints without introducing a new visual variable for each of possibly more than 80 constraint types [7]. Values referring to RDF terms can be shortened with a prefix, therefore the tool implementing the visual notation has to provide a prefix list. Data shapes may have an optional human readable name which is denoted as bold text in the upper part of the data shape to facilitate the distinction of data shapes. This name may be populated from rdfs:label values, and, thus following best practices for labeling RDF concepts. Additionally, the unique identifier of node shapes is visualized as text in italics in the center of the rectangle with rounded corners representing the node shape (Fig. 4 ). Users can also identify node shapes without a human readable label present. The italic type distinguishes the unique identifier from other text.
3.2.4.Border
All visual shapes have a border, we reuse solid borders from VOWL, redefine dashed borders to accommodate for validation-specific characteristics regarding deactivation and introduce thick solid borders to represent the constraint type closed.
VOWL uses dashed borders for specific OWL classes and literals without datatype. However, we use dashed borders to indicate which data shapes are not considered for validation (deactivated), because in contrast to an ontology visualization, we do not consider specific OWL classes but RDF constraints for validation, and our visualization of literals has a different meaning as we visualize constraints (Fig. 4 ). For deactivated node shapes both the rectangle with rounded corner representing the node shape as well as a possibly attached note element with constraints will get a dashed border (Fig. 4
 ). Similarly, for deactivated property shapes the rectangle of the relationship label, the object and potentially attached note elements get a dashed border.
We introduce thick solid borders for node shapes, indicating that for validation only the explicitly linked properties are allowed (closed data shape, Fig. 4 ).
).
The thick borders aim to represent the closeness whereas dashed borders aim to represent inactiveness. As the thickness and style of the edges are two different visual features, possible combinations of deactivated and closed data shapes can still be represented.
3.2.5.Position
We reuse cardinality positions at directed edge endings for property-based cardinality constraints, introduce cardinalities at the beginning of a directed edge to represent data shape related cardinality constraints, introduce positions for logical constraints within dedicated nodes and introduce positions for datatype and class constraints within the objects of visualized triples.
We use specific positions for cardinality, datatype, class and logical constraints utilizing the graph visualization to support users in the parsing of information. In ShapeVOWL, cardinality constraints referring to properties are visualized next to the arrow head of a directed edge, i.e. minCount and maxCount; cardinality constraints referring to data shapes are visualized next to the source of a directed edge, i.e. qualifiedMinCount and qualifiedMaxCount (Fig. 4 ). The visualization reflects the reading direction, for example: the person data shape requires the property ex:address at least 1 but maximum 2 times (Fig. 4
 ) vs a valid address property requires at least 1 property value to comply with the address node shape (Fig. 4
 ).
).
Datatype and class constraints are not visualized in a note element, but directly as text in the graphical element representing the object, i.e. a yellow rectangle for datatype constraints (Fig. 4 ) or a blue ellipse for class constraints (Fig. 4
 ). VOWL visualizes datatypes as text within the yellow rectangle representing a literal. We reuse this visualization to denote a datatype constraint of a property value and add an additional datatype icon in front of the name of the datatype to indicate that a constraint exists (Fig. 4
 ). This icon is an orange D in a black circle (Fig. 4). Consistently with datatypes, class constraints are denoted as text within the ellipse representing the property value. Class constraints have an additional class icon in front of the name of the class. This icon is an orange C in a black circle (Fig. 4
 ).
).
Logical constraints are not represented in a note element, but as dedicated nodes or as labels on dashed edges which enables ShapeVOWL to represent relationships between different types of data shapes. Conjunction and (exclusive) disjunction constraints are visualized as ellipse with respective labels on the upper part of the ellipse (Fig. 4 ). Additionally, icons representing Venn diagrams are used to distinguish the different logical constraint types. These icons represent Venn diagrams, similar to certain VOWL constructs. Negation constraints are represented as text label “NOT” on top of dashed edges connecting data shapes (Fig. 4
 ).
).
3.2.6.Color scheme
We reuse the VOWL base color to represent subjects, predicates and objects of the data shape graph, reuse the VOWL literal color to represent literals and introduce border colors for data shapes’ severity.
A color scheme is applied on the border color of data shapes and note elements to express different severities (Fig. 4 ). VOWL uses a color scheme for a better distinction of the different elements [41]. We reuse the base color and literal color of VOWL.
Additionally, for ShapeVOWL colors on borders are used to express the severity of data shapes. For the severities violation, warning and information from the SHACL specification we recommend the respective colors red, yellow and green. Green is chosen instead of blue so the severity colors for data shapes are not confused with the VOWL general color.
3.2.7.Visual example
The visual vocabulary of ShapeVOWL defined in the last section, can be used to represent SHACL shape graphs. We present and discuss an example (Fig. 4).
ShapeVOWL defines visual elements for data shapes (Fig. 4). Our color scheme is applied; data shapes are colored with respect to their severity.
Node shapes can be uniquely identified with an IRI but can also have a human readable label. For example, a node shape uniquely identified with the IRI ex:personConditions (center of rectangle with rounded corners representing a subject node) can have the human readable name Person (bold label in upper part of the rectangle with rounded corners) (Fig. 4 ). Such a node shape can by default be applied on resources, e.g. ex:bob or all instances of a class such as schema:Person, both is indicated by the appliesOn annotation in the attached white note-element of a ShapeVOWL data shape.
Constraints have a special position or are listed in white note-elements attached to a data shape; depending on the rendering either overlapping an ellipse/rectangle with rounded corners (Fig. 4 ,
,  ) or next to a rectangle (Fig. 4
 ). A fictive person node shape can represent the constraint that persons must have a unique identifier (Fig. 4
 , nodeKind constraint). The value of an ex:address property can be constrained to be of a specific class whereas value type constraints are listed within the shape representing the object together with an icon (Fig. 4
 ). Cardinality constraints are represented using text and position. Thus, a constraint to express that a person must have at least one but maximum two addresses will be denoted with the (inclusive) cardinality specification 1..2 next to the arrow head of the directed edge which connects the person node shape with the address property shape (Fig. 4
 ).
).
Dashed directed edges with the label complyWith indicate reuse of data shapes. To denote the constraint that the value of at least one of the aforementioned ex:address properties must comply with the ex:validAddress data shape, a dashed relationship with corresponding cardinalities 1..* is drawn at the source property shape (Fig. 4 ). In case every address should comply with the provided data shape, the qualified cardinalities at the source of the dashed arrow have to be removed.
Data shapes can be connected with logical operators to build more complex constraints (Fig. 4 ): subjects valid to the Person node shape should have either exactly one ex:fullName property, or at least one schema:givenName and at least one schema:familyName: disjunction node with label “OR” and Venn diagram icon. The logical operator negation only takes one data shape as argument and not a whole data shape list, therefore it is visualized with the label NOT on a dashed connection (Fig. 4
 ).
).
With respect to validation data shapes may be closed or deactivated. The ex:validAddress data shape is closed, visually indicated by a thick border: valid addresses are only allowed to have the property postalCode and an exception is made for rdf:type denoting the class (Fig. 4 ). The data shape ex:organizationShape is deactivated, visually indicated by dashed border: its constraints are not considered during validation (Fig. 4
 ). Constraint types can be accompanied with a logo displayed before the constraint in the note element (Fig. 4
 ).
).
4.Comparative analysis
Both ShapeUML and ShapeVOWL were designed by following basic principles of cognitive effectiveness [43], however, as we reused the existing notations UML and VOWL these principles could only be applied to a certain extent. Therefore, we analyze ShapeUML and ShapeVOWL with respect to these design principles with the aim of scientifically argue about the impact of design decisions on human information processing and thus the effectiveness of ShapeUML and ShapeVOWL from a theoretical perspective.
We refer to each principle’s definition according to Moody [43] (which includes other frameworks as specified in Section 2.5) and discuss to which extent each visual notation complies. We omit the design principle cognitive integration as it only applies when multiple diagrams of different types are integrated. Table 1 summarizes the comparison which is discussed in Section 4.9.
4.1.Semiotic clarity
Semiotic clarity relates to the correspondence between symbols and their referent concepts [43], there must be a one-to-one correspondence for a visual notation to satisfy the requirements of a notational system [23, 43]. If there is no one-to-one correspondence between semantic constructs and visual symbols, one of the following four anomalies can occur: symbol redundancy, symbol overload, symbol excess or symbol deficit [43]. In case of symbol redundancy, a semantic construct is represented by multiple graphical symbols; the opposite is symbol overload. Symbol excess occurs if graphical symbols do not correspond to any semantic construct; and the opposite is symbol deficit, a semantic construct with no graphical symbol.
ShapeUML All semantic constructs are represented in the visual notation (Figs 1, 2), i.e. terms from the SHACL specification; some constructs use the same graphical symbol but text is used to differentiate, and, thus, to maintain visual expressiveness. Following the ODM-profile of UML, ShapeUML uses rectangles with solid borders to represent data shapes, thus node and property shapes share the same graphical symbol (symbol overload). However, node and property shapes are distinguished by additional text indicating the type. Symbol deficit was deliberately introduced to reduce graphic complexity: more than 30 constraint types are supported, but they are all represented as text, only logical constraint types and cardinality constraints use additional visual variables (edges and position). ShapeUML does not visualize any semantic construct with multiple graphical symbols (symbol redundancy) nor does it contain any graphical symbol which does not correspond to a semantic construct (symbol excess), thus semiotic clarity is achieved.
ShapeVOWL All semantic constructs are represented in the visual notation (Figs 5, 6) and similar to ShapeUML, symbol deficit is deliberately introduced to increase visual expressiveness. Multiple graphical symbols are used in ShapeVOWL. Blue rectangles with rounded corners represent node shapes (subject of triples), blue rectangles over solid arrows represent the property part of property shapes (predicate of triples), and blue ellipses or yellow rectangles represent the object part of property shapes (object of triples). Certain constraint types are represented using the visual variables border, edge and position but to reduce graphic complexity most of the 31 constraint types are represented textually within note-elements. However, constraint types may also be accompanied by an icon which we provide for commonly used constraint types [36] (see Fig. 1) not visualized using other visual variables such as position (see next section). Similar to ShapeUML, ShapeVOWL achieves semiotic clarity as no symbol redundancy nor symbol excess are present.
4.2.Perceptual discriminability
Perceptual discriminability describes the ease and accuracy with which graphical symbols can be differentiated from each other [43]. A factor is the visual distance, i.e. the number of visual variables on which the symbols differ and the size of differences in perceptible steps (capacity). Shapes are the primary basis for humans to identify objects in the real world, while textual differentiation is a cognitively ineffective way to handle graphic complexity [43]. This principle includes perceptual popout, i.e. preattentively detection of visual elements [43, 61]
ShapeUML ShapeUML uses the visual variables shape, edge, text, border, and position. But because shape is always a rectangle and border is always solid, both are not variable anymore and the perceptual discriminability of ShapeUML is low. However, therefore we stay close to the UML specification, where users potentially are familiar with. Given the limited number of graphical symbols, i.e. rectangles with solid borders for data shapes, text for constraints as well as solid and dashed edges to relate data shapes, ShapeUML only provides limited visual distance.
ShapeVOWL ShapeVOWL uses the visual variables shape, edge, text, border, position, and color. On the one hand, ShapeVOWL uses one visual variable more than ShapeUML; and on the other hand, ShapeVOWL uses different shapes and borders, i.e. in constrast to ShapeUML these concepts are variable in ShapeVOWL. Nodes and properties are clearly distinguished by the visual variable shape and color, i.e. the VOWL base-color blue is used for nodes and property labels and the VOWL color yellow is used for literals. Additionally, the visual distance between symbols is increased because ShapeVOWL defines optional icons for different constraint types.
4.3.Semantic transparency
Semantic transparency is the extent to which a notation’s meaning can be inferred from its appearance, informally its “intuitiveness” or the degree of how much the appearance provides a cue to its meaning [43]. This principle is not measured binary, semantic transparency can appear in a continuum from semantically immediate where a novice can infer the meaning (e.g. a stick figure to represent a person), to semantic perversity where even a wrong meaning is inferred [43].
ShapeUML ShapeUML is based on UML which uses abstract shapes, and, thus it does not provide much semantic transparency. The boxes representing data shapes do not provide a cue to their meaning. However, presenting the property path as a label on edges connecting node with property shapes may resemble the underlying graph structure of RDF and could minimally provide semantic transparency.
ShapeVOWL ShapeVOWL uses a graph visualization based on nodes and edges of the actual RDF graph for which it defines the constraints. Several indicators suggest that ShapeVOWL has a higher semantic transparency compared to ShapeUML. Previously defined VOWL-based visual notations already demonstrated that users find the graph visualization intuitive [41]. ShapeVOWL also reuses visual metaphors such as Venn diagrams for logical constraints, which, according to Moody, increases semantic transparency. ShapeVOWL attaches constraints visually to where they apply to which further increases semantic transparency; certain property shape constraints apply on the property, such as cardinalities, and others on the value of the property, such as minimum inclusive value constraints. If not visually separated, min/max cardinality constraints on the property and min/max constraints on the value might be confused.
To further increase semantic transparency, ShapeVOWL defines optional icons for constraint types which can speed up recognition and recall as well as improve understanding for novice users [43]. However, according to a recent meta study [34], semantic transparency is not increased with the use of icons per se, empirical tests need to be performed to diminish cultural associations. To this end ShapeVOWL mostly relies on icons representing arithmetic operators such as an equal-sign or less-than. Additionally, icons are only optional and future studies may provide more insights in appropriate icons for RDF constraints.
4.4.Complexity management
Complexity management aims not to overload the human mind. For instance, visual representations often do not scale well [43]. Modularization and hierarchy offer solutions to manage complexity.
Both proposed visual notations do not yet account for modularization or hierarchy. However, tools implementing visual notations can account for this and e.g. offer zoom functionality [26]. Currently our tool UnSHACLed provides geometric zooming (Section 5).
4.5.Visual expressiveness
Visual expressiveness refers to the number of visual variables in the whole notation. Each variable has a power denoting the information which can be used [43].
The visual expressiveness of both visual notations is not very high considering that most constraints types, one of the fundamental constructs are represented as text only (with the exception of logical relationships in both notations). However, on the one hand this is because both notations were built with the objective to reuse existing notations already familiar to users, thus inheritance of visual expressiveness, and on the other hand we tried to keep the graph complexity low by deliberately not representing each constraint type with different visual variables.
If required by specific use cases, both notations can be improved specifically towards visual expressiveness. For example, ShapeVOWL has higher expressiveness due to the use of more visual variables compared to ShapeUML, in a similar fashion more visual variables can be used for both notations.
4.6.Dual coding
Dual coding is the use of text to complement graphics. Text on its own is cognitively ineffective to encode information, but, in a supplementary fashion, it can reinforce and clarify meaning [43]. However, although textual annotations improve understanding, having a dedicated graphical symbol only for annotations not representing any semantic construct of the language it harms semiotic clarity, i.e. a case of symbol excess as the graphical symbol of annotation does not represent a semantic construct [43].
ShapeUML is based on UML, heavily text-based and thus has limited dual coding. Text is mostly used to denote constraints, but also for labels and unique identifiers. The deactivation of data shapes may be considered dual coded because, in addition to the textual declaration, the type of the data shape in the upper compartment is struck through, i.e. an additional visual change of font. Node shapes may refer to property shapes which in ShapeUML is encoded using a directed solid edge.
Following UML, logical constraints are represented with specific edges additionally labeled with the logical constraint’s name. However, this is not considered dual coded as without label, edges of different logical constraints are not distinguishable. Both visual variable and text are needed to denote logical constraints.
ShapeVOWL visualizes graphs, and text is added to graph elements. Several elements are dual coded in ShapeVOWL. Similar to ShapeUML, text is mostly used to denote constraints, but also for labels and unique identifiers. All constraints are represented textually in a note-element, but some constraint types are also represented using additional icons or the visual variables border, edge and color. ShapeVOWL defines optional icons for constraint types, e.g. for class, datatype or literal pattern constraints. Together with the visual variable color and border, text also denotes the severity of data shapes. Dashed and thick solid borders, in addition to text, are used to indicate characteristics relevant to validation of the RDF constraints, the constraint type closed and deactivation of data shapes.
4.7.Graphic economy
Graphic economy states that the size of the visual vocabulary should be cognitively manageable to achieve a low graphical complexity [43]. The number of semantic constructs can be limited, symbol deficit can be introduced or the visual expressiveness can be increased.
Both visual notations should be cognitively manageable. SHACL supports a subset of possibly more than eighty constraint types, thus the number of semantic constructs is already limited (all concepts listed in Figs 1, 2, 5, 6). Additionally, symbol deficit is deliberately introduced by the design decision of not visualizing each constraint type of the SHACL core using separate visual variables. An unlimited number of symbols can be created by combining visual variables, however, this does not scale due to cognitive limits where humans must remember the meaning of the symbol [43]. Both ShapeUML and ShapeVOWL have a small visual vocabulary as both use less than five graphical primitives.
4.8.Cognitive fit
Cognitive fit means different representations are suitable for different tasks and audiences [43]. Optimizing visual notations for novice users can reduce effectiveness for experts and vice versa. More, the medium on which a visual notation is presented influences the effectiveness, i.e. manual drawing with pen and paper vs computer display. Icons, color, and texture are more difficult to draw than simple geometric shapes [43].
ShapeUML ShapeUML is based on UML, and, thus is suited for users already familiar with UML. It also consists only of rectangles, edges and text which facilitates manual drawing. ShapeUML uses a small number of visual variables and encodes a lot as text. For novice users it may be difficult to understand ShapeUML but optimizing it for novice users might introduce large deviations from UML which would make it harder for experts to understand.
ShapeVOWL ShapeVOWL uses a graph visualization with nodes and edges. Experiments with other VOWL-based notations already suggest that VOWL is intuitive also for people with less knowledge about the underlying languages [41]. Additionally, semantic web experts are usually already familiar with different VOWL-based notations and the graph model in general; ShapeVOWL leverages this and may provide a trade-off between understanding for experts and novices. ShapeVOWL relies on simple geometric shapes and text, colors are optional, thus, with respect to perceptual discriminability, semantic transparency and visual expressiveness, ShapeVOWL can also be drawn by hand without effort (neglecting certain dual coding like more complicated icons).
4.9.Discussion
We analyzed both visual notations with respect to Moody’s design principles, which itself is based on seminal works of human cognition such as communication theory [58], feature integration theory [61], Bertin’s work on Semiology of Graphics [4], or Goodman’s theory of symbols [23]; and in the following discuss our findings which are summarized in Table 1.
One the one hand, ShapeVOWL uses more visual variables and symbols to express semantic constructs than ShapeUML. For example, it uses more shapes, meaning of borders but also colors and optionally icons. This – in addition to the depiction of the underlying RDF graph data, specific edges to connect elements, and Venn diagrams – results in high scores for semiotic clarity and semantic transparency. All other principles are at least partially addressed with the exception of complexity management which can be accomplished by a tool implementing ShapeVOWL, e.g. by providing different means of zooming. However, more research regarding appropriate icons is needed, following a recent meta-study on semantic transparency [34].
On the other hand, ShapeUML shows semiotic clarity and graphic economy with an advanced cognitive fit. This means that ShapeUML represents all RDF constraints’ needed concepts in a cognitively manageable fashion and, additionally, may be suited for specific tasks and audiences. Perceptual discriminability, semantic transparency and visual expressiveness are affected by cognitive fit [43], thus, considering hand-drawn representations of ShapeUML, its simplicity may become an advantage as no special drawing abilities are needed.
Table 1
A comparative analysis with Moody’s design principles [43] for cognitive effective visual notations reveals that ShapeVOWL scores better compared to ShapeUML. A double plus (
| Principle | ShapeUML | ShapeVOWL |
| Semiotic Clarity | + | |
| Perceptual Discriminability | – | + |
| Semantic Transparency | – | |
| Complexity Management | – | – |
| Visual expressiveness | – | + |
| Dual Coding | – | + |
| Graphic Economy | + | + |
| Cognitive Fit | + |
5.UnSHACLed editor
UnSHACLed is a graphical editor for RDF constraints. It allows users to validate RDF data against RDF constraints and view a validation report by loading existing RDF data into the tool and validate them with separately loaded or visually created RDF constraints. The main goal of UnSHACLed is to enable users familiar with RDF but not familiar with specific RDF constraint languages to create and edit RDF constraints. UnSHACLed offers a web interface and thus can be used with any browser. An early prototype was presented in previous work [15] and is available on GitHub.1515 In this paper we present a recently reworked version: https://github.com/KNowledgeOnWebScale/unshacled.
In this section we discuss features for an RDF constraint editor (Section 5.1) and how visual notations contribute to it, as well as introducing the implementation of our RDF editor UnSHACLed (Section 5.2).
5.1.Features for data shape editing
In previous work [15] we introduced seven desired features for the editing of data shapes.
F1: Independence of constraint language Data shape editors should not confront domain experts with writing the textual syntax of a specific constraint language. Moreover, the visualization of the constraints should be independent of the underlying constraint language: generic (graphical) symbols can be used to (partially) hide language-specific textual syntax, as constraint languages have overlapping semantic constructs. Both ShapeUML and ShapeVOWL are constraint language independent and have a defined visual vocabulary covering semantic constructs of RDF constraints.
F2: Support multiple data sources Data shape editors should support domain experts in defining data shapes referring to multiple data sources at once. The proposed visual notations allow to define RDF constraints in a visual fashion for different data sources.
F3: Support different serializations Data shape editors should not restrict domain experts to specific serializations of the data source nor the constraint language. A data graph can be serialized in different ways without changing the actual data or structure (e.g. RDF/XML vs Turtle). The visual vocabulary of both ShapeUML and ShapeVOWL covers semantic constructs of RDF constraints and is currently mapped to SHACL. Thus it is represented in RDF which can be serialized to different serializations.
F4: Support multiple ontologies Data shape editors should support domain experts in defining data shapes for data graphs annotated with multiple ontologies simultaneously. Both notations use URIs where necessary, e.g. for property paths or class constraints. Thus, multiple ontologies are supported by both notations.
F5: Multiple alternative modeling approaches Data shape editors should enable and support multiple alternative modeling approaches and allow domain experts to choose the most adequate one for their needs. Two modeling approaches, complementary to visual notations, were discussed in our previous work [15].
F6: Non-linear workflows Data shape editors should allow domain experts to keep an overview of the relationship between the data graph and data shapes, by providing non-linear editing. Although the data graph is not visualized together with the shapes graph, the data is visualized in the data panel. Terms related to data shapes’ assignment to instance data is covered by the visual notations, i.e. the appliesOn concept indicating on which data shown constraints apply by default.
F7: Independence of execution Data shape editors should allow importing and exporting the data shapes specified by the domain experts, as a use case may require to execute the data shapes elsewhere. Both ShapeUML and ShapeVOWL are currently mapped to SHACL and, thus, to RDF which provides interoperability and allows the import and export of data shapes.
5.2.Implementation
We describe the modular architecture of our RDF constraint editor UnSHACLed (Section 5.2.1), and relevant GUI components providing user interactions in a visual fashion (Section 5.2.2).
5.2.1.Architecture
UnSHACLed is a web-based RDF constraint editor independent from specific data formats, visual notations or validation engines.
Framework UnSHACLed is implemented with the web framework Vue.js following the model-view-viewmodel (MVVM) design pattern introduced by John Gossman in 2005.1616
It therefore can run in modern Browsers and no additional server infrastructure such as databases are required.
Intermediate format UnSHACLed uses the state management pattern and library Vuex to store RDF constraints using an intermediate data format which allows all application components to access the RDF constraints in a controlled manner. Therefore other constraint languages can be supported by providing a mapping to the intermediate format without the need to change other parts of the implementation.
Visual notations UnSHACLed uses the VueKonva library to draw canvas graphics. Several components for both ShapeUML and ShapeVOWL were developed to render the two notations. New visual notations can be added in the form of new components which also read and write data to the intermediate format of Vuex store.
Validation For validation the intermediate format is transformed to a representation of a concrete RDF constraint language (currently supported is SHACL) and is passed together with the data to a separate validation engine. Another constraint language and validation engine can be used which only leads to adjustments in UnSHACLed with respect to transformations of the intermediate representation or invocation of another validation engine, no adjustments to the GUI are required.
5.2.2.Graphical user interface
In this section we discuss the graphical user interface of UnSHACLed, namely the different existing panels and interactions elements with which users can interact using visual notations.
Panels The GUI consists of three panels representing different parts of a Linked Data validation workflow: a data panel, modeling panel and validation result panel.
The Data panel shows data which should be constrained or described (left panel in Fig. 7). RDF is currently supported in different serializations, such as turtle and JSON-LD. This is raw data and can also be edited. UnSHACLed is modular and the functionality can be extended to also visualize data of other kind to support other editing approaches.
Fig. 7.
The user interface of our tool UnSHACLed consisting of several panels supporting different editing approaches.
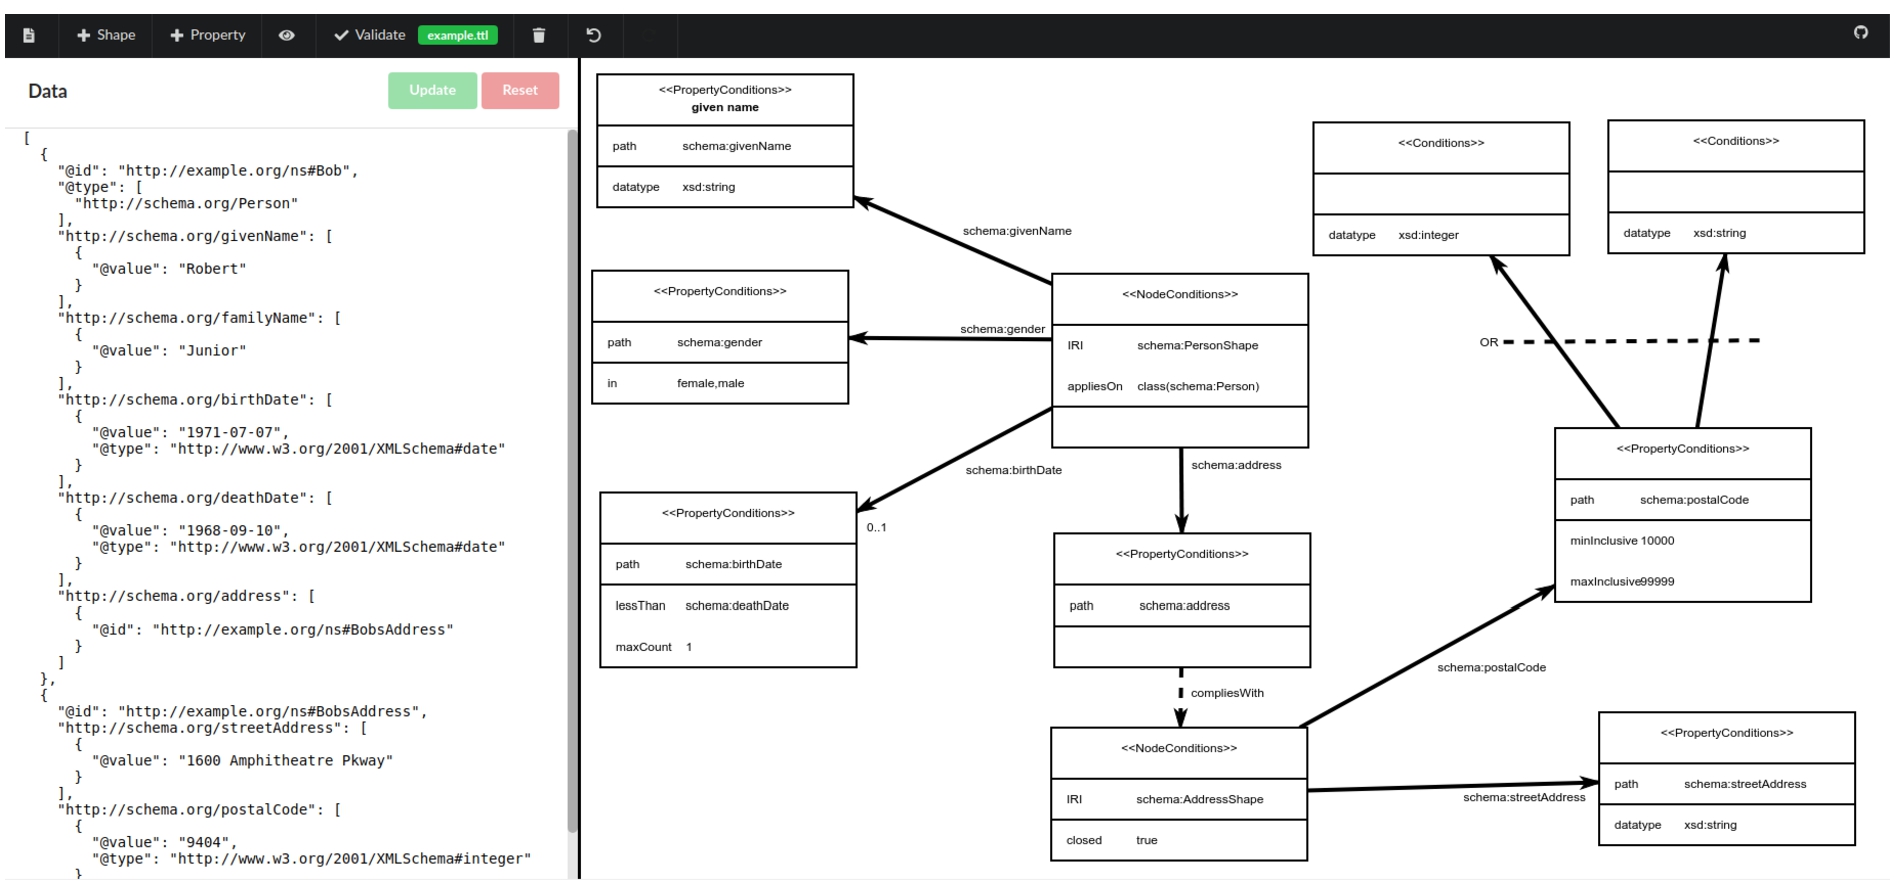
The Modeling panel shows RDF constraints in the visual notation chosen in the menu, both ShapeUML and ShapeVOWL are supported (middle panel in Fig. 7). Elements in the modeling panel are denoted visually and scalability is addressed with geometric zooming.
The Validation result panel shows the validation result of applying the RDF constraints of the modeling panel on the data of the data panel as reported by a validation engine for RDF constraints. The validation result panel is implemented as a modal dialog, i.e. it appears after clicking the validation button. UnSHACLed is independent of concrete RDF constraint languages, it can be extended with different validation engines.
Interactions Visual notations specify how RDF constraints are visualized, but UnSHACLed also allows to interact with the visualizations. Most notably nodes in the graph can be dragged and dropped inside the modeling panel. When hovering over an element a red and a green button appear representing actions for delete and editing. In the latter case a modal dialog opens in which users can change or add constraints. Thus, users can also edit RDF constraints using the visual notations and do not have to learn a specific textual syntax.
6.User evaluation
We conducted a comparative study to validate our main hypothesis that users familiar with Linked data can answer questions about visually represented RDF constraints more effective with ShapeVOWL than with ShapeUML. We compared how accurately users can answer questions about data shapes represented using either ShapeUML or ShapeVOWL. In Section 6.1, we describe the questionnaires to cover various aspects of the data shape domain based on the SHACL core specification. In Section 6.2, we elaborate on the experiment, in Section 6.3, we discuss potential threats to validity, in Section 6.4, we analyze the results of quantitative questions, and in Section 6.5, we analyze results of qualitative questions. Collected (anonymized) data, the questionnaire and user introductions as well as code for the quantitative and qualitative analysis are openly available at https://doi.org/10.6084/m9.figshare.13614440.v2.
6.1.Questionnaires
We created two RDF constraints-related questionnaires, the first containing questions related to RDF constraint concepts based on the SHACL specification which was used in an initial user study, and a second follow-up questionnaire covering more diverse visualization tasks and specific questions informed by the findings of the initial user study. These questionnaires are available at our online resource https://doi.org/10.6084/m9.figshare.13614440.v2
6.1.1.Constraint concepts questionnaire
We derived questions from the SHACL specification relevant to RDF constraints and validation, which were used in a user study to validate our hypothesis.
We created questions to test (i) at least one constraint type per core constraint category of the SHACL specification, and (ii) other RDF constraint concepts relevant for validation, i.e. the targeting mechanism, property paths, severity and deactivation. The SHACL specification lists eight core constraint categories:
1. value type, 1 constraint
2. cardinality, 1 constraint
3. value range, 1 constraint
4. string-based, 1 constraint
5. property pair, 1 constraint
6. logical, 1 constraint
7. shape-based, 2 constraints
8. other, 2 constraints
We selected at least one constraint type for each category and created an associated question, for example “How many datatype constraints can you see?” for the constraint type datatype of value type category. The last two categories mix several relevant constraint types, so, we selected 2 constraints types for each.
Additionally we created one question for each of the aforementioned other relevant concepts, such as “How many property conditions with the severity ‘information’ can you see?” for the concept severity or “How many zero-or-more property paths can you see?” for the concept property paths.
6.1.2.Follow-up questionnaire
We created six questions to cover more diverse visualization tasks compared to the initial user study questionnaire and one question to test participants’ understanding of property paths for which we observed the highest error rate in the initial user study.
The questions cover the following six visualization tasks from ten Amar et al. [2] tasks, which we have chosen based on a taxonomy alignment from Brehmer and Munzner [9], see also Fig. 10 and the Task description paragraph in the next section.
– Find extremum
– Determine range
– Retrieve value
– Order
– Compute derived value
– Filter
To keep the follow-up questionnaire short, we have chosen to select maximum one task per taxonomy leaf node. Therefore, no question was asked for the tasks Find anomalies, Find clusters, Find correlation and Characterize distribution as the first three belong to the same taxonomy leaf node explore such as Find extremum, and the last belongs to the same taxonomy leaf node identify such as Determine range.
Additionally we asked the question “Do you see any ‘property path’ which is not just a single property?” because in the initial user study participants identified property paths in test cases when in fact no were shown. In case they answered yes, we also asked the question “Which is the property path and where do you see it, please elaborate” to obtain more information.
6.2.Method
The user study follows a within-subject design (also referred to as within-group or repeated measures [12]) in which all participants are confronted with examples of both visual notations ShapeUML and ShapeVOWL. However, to mitigate learning effects, we decided not to show the same examples twice to a single participant (see threats to validity in Section 6.3). We discuss the method of the user study by explaining the procedure, elaborating on recruited participants, and introduce the example test cases.
Procedure Potential participants with Linked Data knowledge were directly contacted by the authors. Those who participated were assigned in a round-robin fashion to one of two groups (groups A and B) to mitigate order effects (see threats to validity Section 6.3), and had to (i) read introductions to both ShapeUML and ShapeVOWL (presented in this order), and (ii) complete an online questionnaire. The initial user study is divided into three steps: a pre-assessment, a session in which the questionnaire is answered, and a post-assessment. Additionally, a smaller follow-up user study with only one questionnaire was performed in a later stage where the first author contacted previous participants again.
(i) The pre-assessment is focused on the participants’ sociodemographic traits, such as year of birth, gender, and level of education, to provide indicators of the studied population. Additionally, through a self-assessment, the participants’ expertise with Linked Data and with RDF constraints is assessed as well as their familiarity with the topic and tools.
(ii) The main questionnaire consists of 11 questions about data shapes presented using ShapeUML and ShapeVOWL to assess how effective visualized elements are recognized. After that, 15 questions on 4 test cases were asked to compare visualizations in ShapeUML and ShapeVOWL. These questions include 14 questions derived from the SHACL specification (Section 6.1.1) and one open question to provide feedback about the shown examples and asked questions. For group A the general example is first shown in ShapeUML afterwards in ShapeVOWL and then the test cases are presented started with the first test case in ShapeUML, the second in ShapeVOWL and so forth; it is the other way around for group B to mitigate order effects (see validity threats in Section 6.3).
(iii) The post-assessment consists of 4 questions and collects information about the participants’ preference for either ShapeUML or ShapeVOWL to answer questions about data shapes, whether they want to use one of the notations also for the editing of data shapes, besides only to visualize them; and general feedback.
Tasks Questions of the main questionnaire and the follow-up study represent different visualization tasks which are well studied in visualization task taxonomies and typologies (see Section 2.6). Our questions cover tasks from Amar et al. [2] and have the high level goal to discover [9] and more concretely to understand as defined by Pike et al. [9, 49], depicted in Fig. 10. Each question of the main questionnaire is a combination of Retrieve Value and Compute derived value tasks. Follow-up study tasks cover 6 out of 10 tasks from Amar et al. [2], maximum 1 task per typology leaf node in case there were multiple. Therefore we still cover all leaf nodes from the alignment between Amar et al. [2] and the multi-level topology from Brehmer and Munzner [9].
Participants The online questionnaire was sent to 14 potential participants in September 2020. 12 participants took part in the experiment, their age range was 23 to 40. All participants were highly educated: all have at least a master degree, one a PhD. According to a self assessment, all participants are familiar with Linked Data, most participants generate or use Linked Data (Fig. 9). All participants are familiar with UML class diagrams, the underlying notation of ShapeUML, and the majority of the participants is familiar with the tool WebVOWL, a tool implementing VOWL, the underlying notation of ShapeVOWL (Fig. 8). For the follow-up user study we could recruit 10 from the initially 12 participants in June 2021.
Fig. 8.
UML diagrams known by all participants and already used by the majority, other tools/frameworks less commonly known.
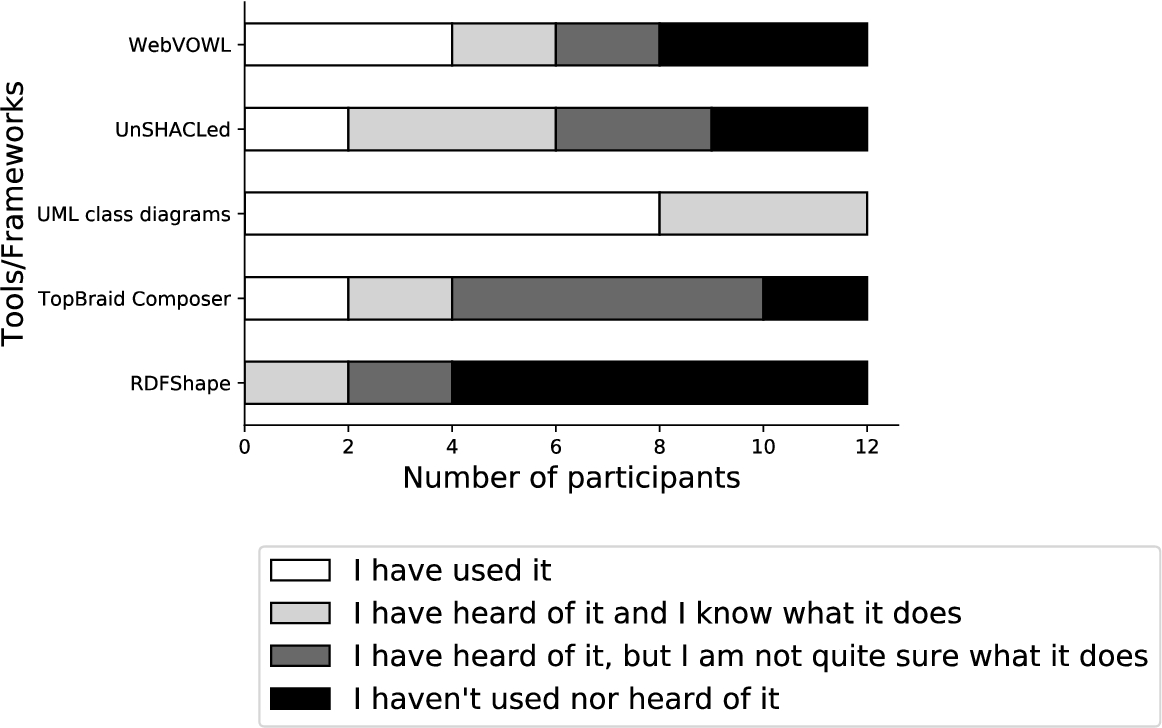
Fig. 9.
Answers based on self assessment: all participants are familiar with linked data, most participants generate or use linked data.
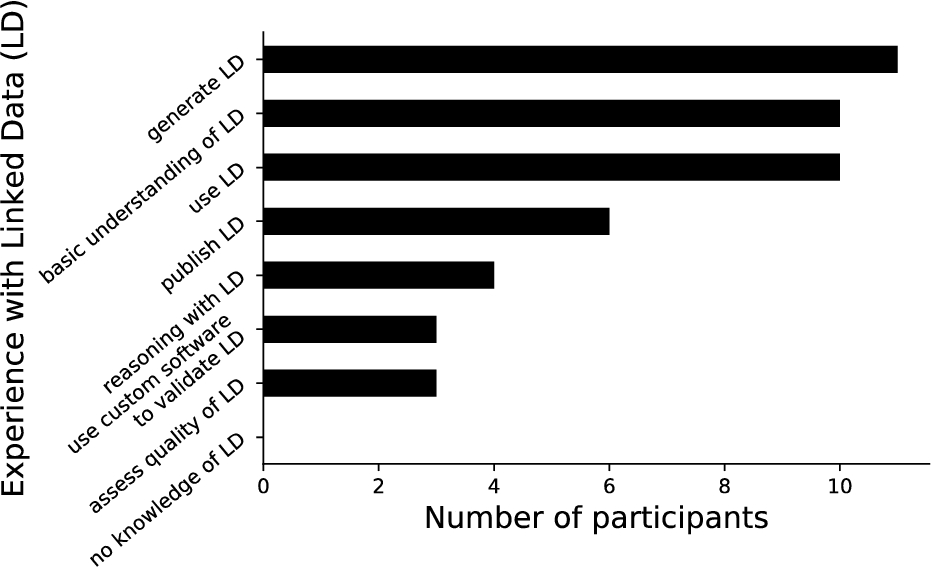
Fig. 10.
Selected tasks from Amar et al. [2] (bold) arranged in the typology of Brehmer and Munzner [9] according to their multi-level alignment. The user study had the high-level goal to discover, concretely to understand as defined by Pike et al. [49]. This involves mid-level search tasks of explore and lookup, low-level tasks of identifying, as well as cognitive interaction methods (introduce and manipulate). From 10 tasks introduced by Amar et al. only 6 were chosen to keep the follow-up study short, i.e. maximum 1 task per typology leaf node in case there were multiple.
![Selected tasks from Amar et al. [2] (bold) arranged in the typology of Brehmer and Munzner [9] according to their multi-level alignment. The user study had the high-level goal to discover, concretely to understand as defined by Pike et al. [49]. This involves mid-level search tasks of explore and lookup, low-level tasks of identifying, as well as cognitive interaction methods (introduce and manipulate). From 10 tasks introduced by Amar et al. only 6 were chosen to keep the follow-up study short, i.e. maximum 1 task per typology leaf node in case there were multiple.](https://content.iospress.com:443/media/sw/2022/13-5/sw-13-5-sw210450/sw-13-sw210450-g066.jpg)
Test cases All test cases besides the initially shown general example are real world datasets from online resources such as GitHub, the visual benchmark ShapeViBe,1717 and the SHACL performance benchmark by Schaffenrath et al. [57]. Figure 11 displays the distribution of RDF constraint concepts in the test cases from which a subset was relevant for asked questions.
We created the general example test case to expose various constraint concepts to participants in one example. This test case contains 40 constraint concepts in total, arranged around 3 node shapes and 6 property shapes (all predicate paths). This test case represents constraints on several attributes of a person as well as on email addresses. Some node shapes are linked with constraints but not all, additionally one node shape is deactivated.
The Traffic Lights test case represents constraints on RDF lists.1818 This test case contains 13 constraint concepts in total, arranged around 2 node shapes and 2 property shapes. Furthermore, this test case is characterized by containing a zero-or-more and sequence property path as well as several constraints on RDF list elements while also reusing an external data shape by referring to it with a constraint.
The Address test case is an excerpt from possible schema.org data shapes.1919 This test case contains 21 constraint concepts in total, arranged around 1 node shape and 3 property shapes (all predicate paths). It was manually curated to constrain schema.org addresses for Australia. This test case is characterized by containing logical constraints as well as a few other constraints on literal values.
The DCAT test case is an excerpt from the DCAT application profile for Swiss data portals.2020 This test case contains 30 constraint concepts in total, arranged around 1 node shape and 6 property shapes (all predicate paths). It has constraints on many properties of a single node, mostly constrained by their cardinality, datatype or class, but also by logical constraints, e.g. either class A or B.
The Geo coordinates test case is from the ShabeViBe benchmark.2121 This test case contains 36 constraint concepts in total, arranged around 2 node shapes and 5 property shapes (all predicate paths). It is characterized by containing combinations of different minimum and maximum constraints which can be easily confused. Namely, min/max cardinality constraints on properties, min/max value range constraints on property values as well as qualified cardinalities related to data shapes.
Fig. 11.
The occurrence of RDF constraint concepts in the test cases of our user study. Each test case contained several node and property shapes including cardinalities and a few selected other constraint concepts.
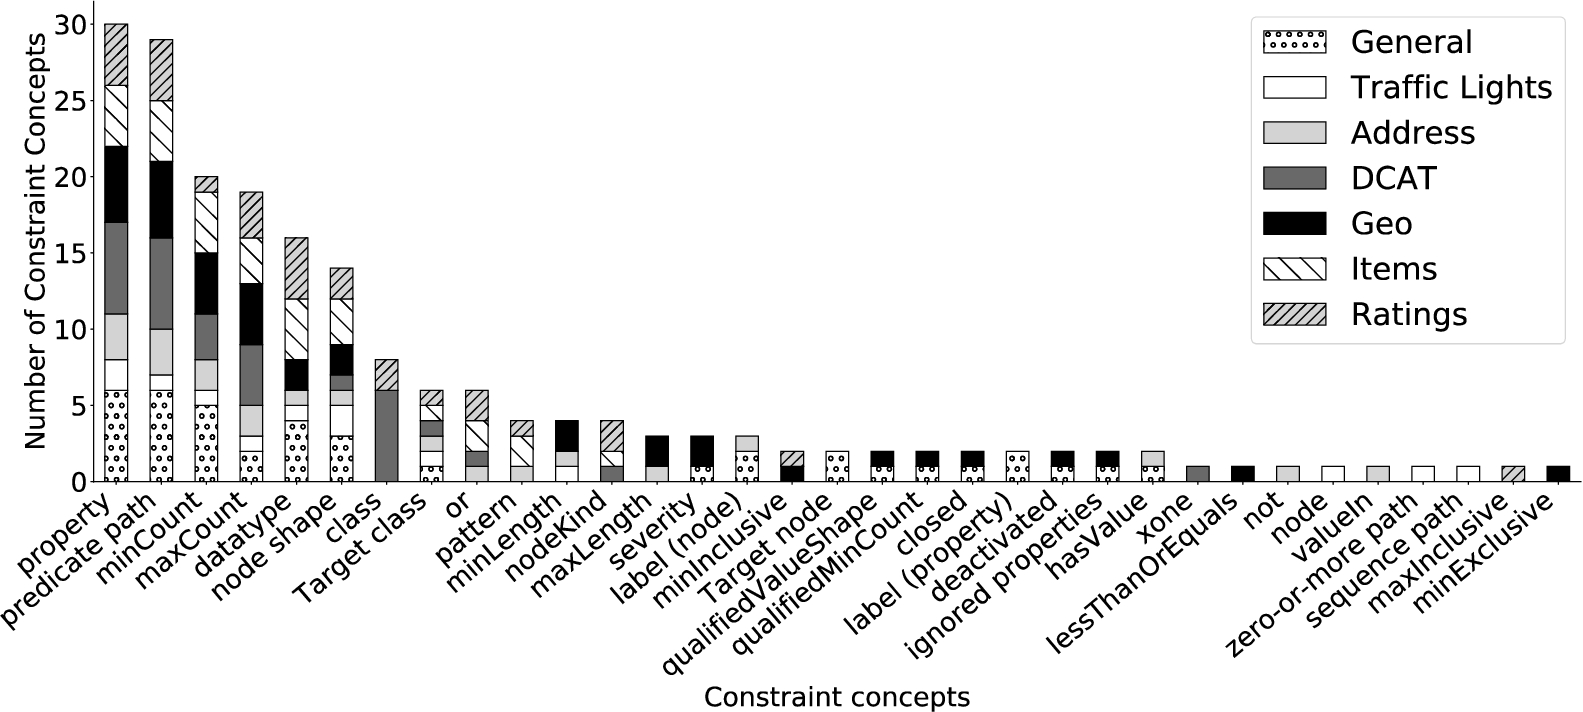
The Items test case is a subset of RDF constraints from a SHACL performance benchmark [57]. This test case contains 28 constraint concepts in total, arranged around 3 node shapes and 4 property shapes (all predicate paths). It mainly consists of datatype, class, disjunction, and literal pattern constraints. All property shapes are displayed with cardinalities, i.e. no default has to be assumed. Additionally 2 non-related node shapes are shown.
The Ratings test case is a subset of RDF constraints from a SHACL performance benchmark [57]. This test case contains 28 constraint concepts in total, arranged around 2 node shapes and 4 property shapes (all predicate paths) It mainly consists of datatype constraints, but also literal value constraints. One property shape has no cardinality constraints, thus default values need to be assumed.
6.3.Threats to validity
External and internal threats to the experiment’s validity exist, we identified the following threats and we discuss how we addressed them in our study design.
6.3.1.External validity threats
External validity threats occur when wrong inferences from sample data are made beyond the studied population or experimental setup [12]. We identified two external threats: participants familiarity with Linked Data and experiment environment.
Participants familiarity with linked data This threat concerns the generalization to individuals outside the study [12]. All our participants were recruited from Ghent University, Belgium and RWTH Aachen, Germany and were familiar with Linked Data, thus the findings might not be generalizable to a more general population. However, this was intentional as we aimed to study users already familiar with RDF graphs, a prerequisite to understand RDF constraints which are the semantic constructs our visual notations represent.
Experiment environment This threat concerns the generalization to individuals outside the experiment’s setting [12]. The experiment was an online questionnaire. Participants could use any browser and computer, thus, they participates from a well-known environment. No specific experimental setup prevents generalizations to individuals outside our study.
6.3.2.Internal validity threats
Internal validity threats concern the experimental setup or experience of participants which threaten the ability to draw correct conclusions about the population in the experiment [12]. We identified three internal threats: selection bias, sample size and order effects.
Selection bias This threat concerns the selection of biased participants, i.e. participants with certain characteristics that predispose them to have certain outcomes [12]. Our participants were all recruited from Ghent University and RWTH Aachen and have similar demographics. All participants have knowledge about Linked Data, but this is intentional as it is a prerequisite of the user study. To mitigate a selection bias all participants were assigned in a round-robin fashion to one of two groups, i.e. groups were not assigned based on specific characteristics. Some participants might be more familiar with one of the underlying visual notations of ShapeUML or ShapeVOWL. However, they self-assessed their familiarity with UML class diagrams and the WebVOWL tool in the pre-questionnaire, therefore any bias is visible. Please note that familiarity with one of the notations is considered positive as the design rationale of both visual notations is to build upon the underlying visual notation.
Sample size A small sample size may not have sufficient statistical power to detect an effect. Our sample size is relatively small. To mitigate this threat, we chose a within-subject study design [12]. It reduces errors associated with individual differences without requiring a large pool of participants.2222
Order effects When participants perform tasks several times certain effects like learning can occur. To counterbalance potential order effects when presenting ShapeUML and ShapeVOWL, we assigned participants in a round-robin fashion to two different groups. The first group (group A) started with the first example in ShapeUML, the second in ShapeVOWL, the third in ShapeUML and so forth. Participants of the second group (group B) were presented the first example in ShapeVOWL, the second in ShapeUML and so forth.
6.4.Quantitative results
We statistically validate the significance of the overall error rate differences between ShapeUML and ShapeVOWL (Section 6.4.1), analyze error rates per RDF constraint concept (Section 6.4.2), and analyze the participants’ self assessment given by a Likert scale [38] (Section 6.4.3).
6.4.1.ShapeUML/ShapeVOWL error rate
Based on the correct answers, we calculated the error rates of all questions to compare ShapeUML and ShapeVOWL: initial questions for general examples and the 4 test cases (Section 6.1.1), as well as for questions in the follow-up study covering different tasks (Section 6.1.2).
Fig. 12.
The error rates for both visual notations are relatively similar. Higher error rates for both visual notations were observed for property paths and maximum value.
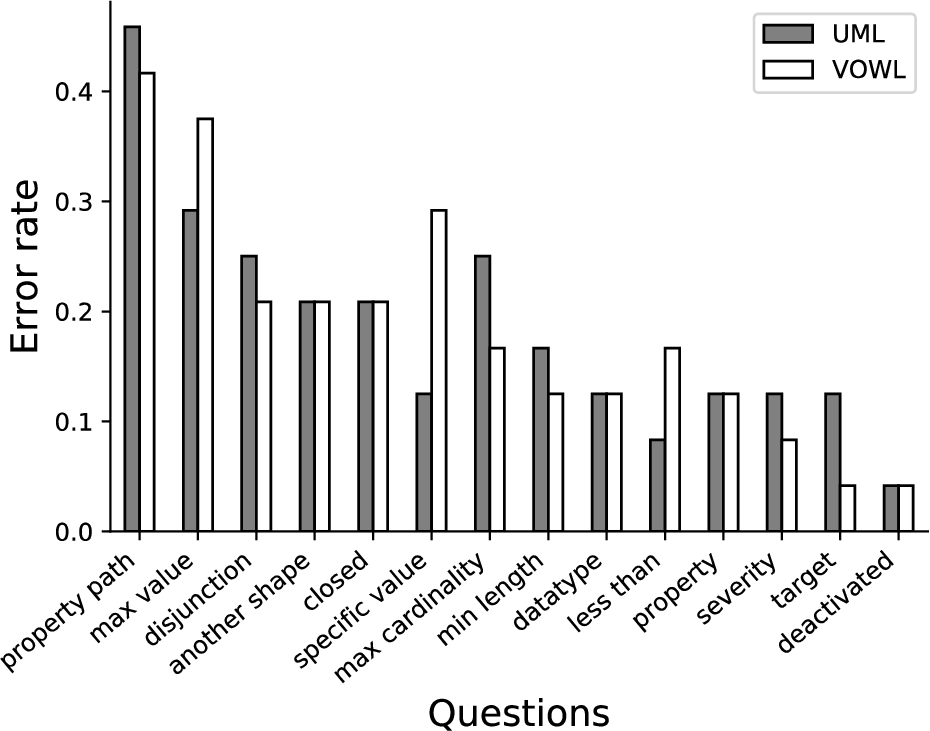
There is no significant difference in the mean error rates of ShapeUML and ShapeVOWL. We first tested the normality of the error rates’ distribution using a distribution plot and a Shapiro–Wilk test [59] with
6.4.2.Constraint concepts
The questions of Section 6.1.1 represent tasks identifying fundamental concepts and core constraints of RDF constraint languages. With both visual notations more than 81% of questions were answered correctly. We elaborate for each constraint concept why mistakes possibly happened by qualitatively analyzing provided answers (Figs 12 and 13) and optionally given free text feedback answers. We elaborate on (i) the tasks themselves, (ii) constraint concepts which have similar error rates between both notations, and (iii) constraint concepts which show more error variation between notations. Finally, we discuss overall findings. The analysis is further enriched with findings from a follow-up user study covering different questions, yet also involving certain constraint concepts.
Visualization tasks Questions of the main questionnaire combine the tasks to retrieve a value and compute a derived value, i.e. retrieving constraint types and compute the sum as aggregated value. If tasks resulted in wrong results it is usually because participants retrieved the value wrongly, for example because they did not understand a constraint concept or were unaware of default values (see following discussion); similarly for errors in the other tasks covered in the follow-up user study. However, for the main questionnaire a small possibility that participants retrieved the value correctly and just computed the sum wrongly cannot be ruled out completely.
Fig. 13.
The error rates for the different questions across the 4 real world test cases of the main questionnaire. Most RDF constraint concepts related questions were answered correctly. Participants made the most errors for property paths, maximum value, specific value and disjunction.
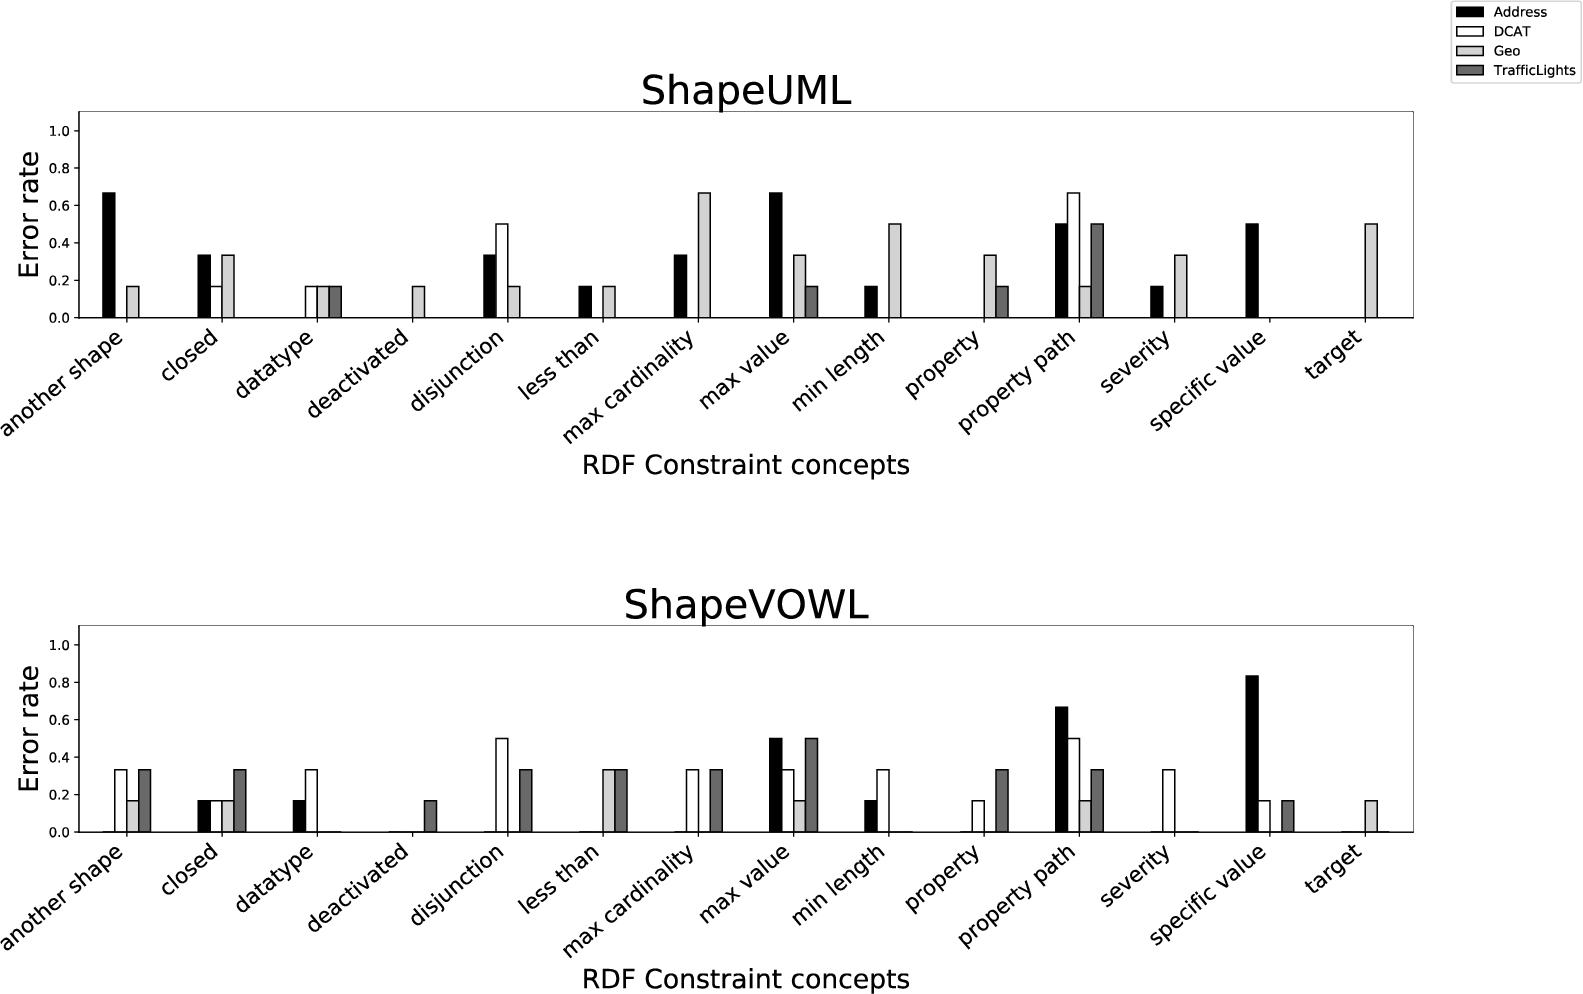
Best and worst recognized constraint concepts There was (almost) no difference in error rates between ShapeUML and ShapeVOWL for 8 out of 13 constraint concepts. Most notably this covers the questions with the least and most errors, meaning that certain constraint concepts are equally good/bad recognized.
The least errors in the main questionnaire, only 4%, were observed for deactivated data shapes with both notations. This constraint type is indicated by struck-through text in ShapeUML and by dashed borders in ShapeVOWL. One participant who was not sure whether deactivation is a transitive constraint, pointed out that the visualization helped to make clear which data shapes are deactivated. The participant raised the same point for the severity constraint for which around 10% errors were made. Regarding visualization tasks, these constraint concepts had to be retrieved and then counted. In the follow-up study one question asked to only retrieve the correct value of a nodeKind constraint with multiple choice answers and there no errors were observed.
The most errors, more than 40%, were observed for property paths. In both notations this concept is encoded as an atomic label for property shapes. The provided answers suggest that participants have confused property paths with a combination of logical relationships and cardinalities on properties. To further investigate this issue, we performed a follow-up study where we explicitly asked the participants to indicate if they can identify property paths and if so where. No property path was present in the examples, yet three participants identified property paths. One wrongly identified property path was a property constrained with a literal pattern containing a pipe symbol (logical disjunction) separated list of URIs, hence probably identified as an alternative path. In another example the value of one property shape contains a class constraint, the same class is mentioned as target by another shown node shape – without any explicit link. According to the provided feedback, this implicit link appeared to be a property path for at least one participant, another participant identified the same property but did not provide explicit reasoning. Finally, one participant mentioned to not understand the question “Do you see any ‘property path’ which is not just a single property?”, which may indicate issues in understanding the underlying semantic construct (property paths were explained in the user introduction to both visual notations users had to read before the study).
Constraint concepts with similar error rates between visual notations Other constraint concepts with similar error rates between ShapeUML and ShapeVOWL were datatype, disjunction, property, closed and comply with. Whereas comply with constraints are encoded in the same way in both notations, the other constraint concepts are encoded differently, usually with more visual features in ShapeVOWL.
Datatype constraints were mostly identified correctly. Based on the provided answers it seems that one participant once wrongly counted a nodeKind literal constraint as a datatype constraint in a retrieve value task. Within an ordering task of the follow-up study participants had to alphabetically order properties with datatype constraints, but 40% of participants wrongly ordered a property with literal value without datatype constraint. However, they correctly excluded a property with class constraint in another example which at least for ShapeVOWL could indicate issues in understanding a datatype constraint if the value is visualized as a literal.
Two real world test cases contained disjunction constraints, one of the test cases additionally contained an exclusive disjunction constraint which was not supposed to be counted. However, one participant counted both and another participant indicated that in fact a second (exclusive) disjunction is present but was not counted by the participant. We acknowledge that our question leaves room for interpretation. One participant seemed to have counted properties instead of disjunctions and two participants identified this constraint when in fact it was not present, a zero-or-more property path constraint and an associated cardinality might have been counted as these were the only other constraint types shown in the example.
Property constraints were mostly correctly recognized. Mistakes were mainly made when the property shape or the corresponding node shape were deactivated, in this case some participants did not count the deactivated properties.
Two test cases contained closed constraints, participants also counted node shapes in other test cases when no closed constraint was present and did not count it when it was present.
Constraint concepts with error variation between visual notations Even though not significant, there is more variation between ShapeUML and ShapeVOWL error rates for 5 out of 13 constraint concepts. This includes the constraint concepts target, less than, specific value as well as constraints related to a minimum or maximum namely min length, max cardinality, and max value.
In 3 out of 4 real world test cases, there was 1 target concept encoded which was correctly recognized. However, in the last test case where no target concept was present, 4 participants probably counted the number of node shapes, which was 2, or the single node shape which had constraints attached. No additional feedback was provided, therefore we cannot interpret why these participants failed to recognize this constraint concept in the last test case.
A few participants miscounted the constraint type less than or equals, but the provided answers do not indicate they were mistaken for other constraint concepts.
Participants counted specific value constraints mostly correct. However, most errors occurred in the only test case which actually contained specific value constraints. One valueIn and one hasValue constraint were present which we both intended as “specific value” according to the question phrasing. Yet, 5 out of 12 participants only count 1 which suggests that they either counted valueIn or hasValue. This indicates the question was too ambiguous, and indeed a participant also pointed out for another test case that even a range constraint might be considered “specific”.
Error rates related to minimum and maximum values are explained by participants’ misconception or misinterpreted questions. The provided answers suggest that participants counted cardinality constraints when in fact they were supposed to count min length or max value. One participant even pointed out to not understand the difference between max cardinality and maximum value. This indicates issues in understanding the underlying semantic constructs and not necessarily issues with the visual notations or questions. Furthermore, provided answers suggest that cardinalities were miscounted because firstly min/max pairs were counted instead of only minimum respectively maximum cardinalities in the general example, and secondly, wrong default cardinalities were assumed by the participants for the 4 real world test cases; “For me, an arrow without cardinalities means ‘1..1”’ said by one participant is actually the wrong default, our introduction mentions a default cardinality of 0..* if no values are provided, i.e. no minimum or maximum constraints present.
Discussion of findings Based on the qualitative analysis of the results, we discuss findings related to default values, needed understanding of semantic constructs, and clarity of questions.
Default values should be encoded explicitly. On the one hand, according to provided feedback, encoded severities and constraint deactivation helped a participant to correctly interpret these concepts and discard the wrong assessment that these concepts are transitive. On the other hand, missing defaults lead participants to assume wrong cardinality defaults.
Clear documentation and/or tooltips are necessary to support users in understanding constraint concepts, because some constraint types are conceptually similar and need clarification. We noticed that users mistook e.g. different minimum and maximum constraint concepts with each other and property paths with a combination of logical relationships and cardinalities. A visual notation represents semantic constructs, the used visual notations do not suffer from symbol redundancy, symbol overload or symbol excess, thus they provide semiotic clarity (see Section 4). However, if underlying semantic constructs are not clear to a user, visual notations can only support to a small extent to alleviate misunderstandings, e.g. by providing semantic transparency.
We acknowledge that a limited number of questionnaire questions leave room for interpretation which negatively influences the analysis of results. For the follow-up user study we relied on adapted questions from related work, increasing consistency. Furthermore, for further research on RDF constraint visualization, we recommend a pilot study with a smaller number of participants – ideally from different backgrounds – to reveal possible ambiguities in questions.
6.4.3.Self assessment
The post-questionnaire contained three questions in which the participants could self assess how confident they are with their answers, if they prefer ShapeVOWL over ShapeUML and if they would like to use ShapeVOWL also for RDF constraint editing. These three questions were asked using a 7-point Likert scale from 1 (not agree at all) to 7 (fully agree).
All participants were asked if they are confident that their provided answers are correct. Their average value is 3.6 and median is 3, thus in a self assessment participants are not very confident. Participants could also provide feedback for each test case via a text field. Considering the provided feedback, some participants had trouble interpreting the asked questions which could relate with their low confidence.
All participants were asked if ShapeVOWL is preferred and the average value is 4.6 and median is 5, thus in a self assessment participants prefer ShapeVOWL. Similarly the average is 4.8 and median is 5 for the question if the participants would like to use ShapeVOWL to edit RDF constraints.
6.5.Qualitative analysis
Qualitative feedback is derived from each test case in the main questionnaire and generally for both notations in the post assessment. We qualitatively analyze provided answers for the post assessment following a common data analysis for qualitative data [12]: we explain the used analysis method, and present the results. In total 58% of participants answered this question.
6.5.1.Method
A general procedure for a qualitative analysis involves the process of “coding” [12], a commonly used technique for reducing qualitative data to meaningful information by assigning labels to chunks of data [53]. Following common guidelines [12] we read answers provided in the post questionnaire and thus were able to identify 5 high level codes: advantages, disadvantages, uncertainty, suggestion and preference. These codes are further detailed in a hierarchy, for example the high level code advantages is further specified as easier comprehensible, display of sparse constraints and space efficiency. In a similar fashion the other high level codes are further specified to be used as annotation for the qualitative data.
6.5.2.Interpretation and meaning
Based on the created annotations we interpret the feedback provided by the participants by discussing the high level codes such as advantages and which information specifically was provided.
Participants preference and suggestions Findings regarding preferences and provided suggestions correspond with our analysis of cognitive effective design principles in both notations, i.e. ShapeVOWL adheres to more design principles. In total 4 participants explicitly indicated which visual notation they prefer, 3 of them prefer ShapeVOWL and 1 ShapeUML. To improve ShapeUML one participant suggested to remove potential redundancies in ShapeUML (see disadvantages) and “a more user-friendly visualisation of UML (eg: colors, option to hide parts)”.
Advantages Slightly more advantages were pointed out for ShapeVOWL, whereas both notations have their own advantages mostly related to how comprehensible they are for certain use cases. In total 5 participants provided feedback with respect to advantages, 3 of them for ShapeUML and 4 for ShapeVOWL. ShapeUML was recognized more space efficient by 1 participant whereas the same participant mentioned that for sparse constraints ShapeVOWL “looks cleaner”. For both notations 3 participants indicated that the respective notation is easier comprehensible. For ShapeUML 2 participants pointed out that its list representation allows to condense more constraints of a single node and 1 participant expressed that ShapeUML is more intuitive. For ShapeVOWL 2 participants pointed out that it is easier to spot constraints due to visual features and 1 participant explicitly mentioned the familiarity to VOWL as reason.
Disadvantages Although ShapeVOWL was preferred, more disadvantages were explicitly pointed out for it compared to ShapeUML. In total 3 participants provided feedback with respect to disadvantages, 1 for ShapeUML and 3 for ShapeVOWL. ShapeUML was perceived redundant by 1 participant in a negative sense, i.e. the repetition of property paths both in the data shape rectangle and on the relationship between node and property shape. For ShapeVOWL, 2 participants reported possible complications when interacting with it, namely “many small comment boxes” for constraints which “would be less orderly” and the different geometrical shapes and colors as “things” which are “more of a hassle to work with (more clicking and less typing involved)”. Additionally, 1 participant noted that ShapeVOWL “looks very simplistic, but needs more understanding to apply”.
Uncertainty Corresponding with Likert-scale answers regarding confidence and our quantitative analysis, participants explicitly mentioned unclear terminology. In total 3 participants provided feedback with respect to unclarity, whereas 2 participants mentioned an unclear terminology and 1 participant ambiguous questions. This corresponds also with observations from the quantitative analysis, i.e. wrong answers for conceptually similar constraint types.
7.Discussion and conclusion
Data integration as main challenge in our time can be addressed with the uniform graph data model of RDF. Use case specific data quality requires validation, but currently human users – often the creators of constraints – are not well supported when viewing and editing RDF constraints. Therefore, we investigated visual notations for RDF constraints tailored for the human information processing system to answer the research question how we can support users in viewing RDF constraints?. Furthermore, we presented a new version of our tool UnSHACLed that implements investigated visual notations. The human information processing system requires effective visual notations that move the cognitive load from the slow cognitive processing to the fast perceptual processing.
The two visual notations UML and VOWL are broadly used within the Semantic Web community. We reused these already familiar to users notations and adapted them for RDF constraints: the two notations are dubbed ShapeUML and ShapeVOWL.
In particular, we investigated in this work the hypothesis that “users familiar with Linked Data can answer questions about visually represented RDF constraints more effective with ShapeVOWL than with ShapeUML”, because VOWL was built with the aim to be intuitive. We could not validate this hypothesis: there was no significant difference in error mean values which would indicate that better results are achieved with ShapeVOWL. However, analyzing the design considerations of both visual notations and user study results in detail we conclude the following things.
Potential for ShapeVOWL For both notations on average 81% of questions related to RDF constraints were answered correctly. Even though different constraint types were recognized more accurate with one or the other notation, we could not measure a statistically significant error difference between ShapeUML and ShapeVOWL in the performed user evaluation. However, a comparison between both visual notations based on design principles (Section 4 and Table 1) and participant’s self assessment to prefer ShapeVOWL make us assume that ShapeVOWL has a higher potential to represent RDF constraints more effective compared to ShapeUML; yet further investigation is required. Different use cases and types of users exist which motivates further research covering specific domains.
ShapeVOWL disadvantages Disadvantages brought up in the qualitative analysis – such as complicated interaction or space efficiency – mainly concern more complex and dense RDF constraint graphs. Instead of aiming for a one-size-fits-all visual notation, such disadvantages can be mitigated by complementary functionality of RDF constraint editors implementing ShapeVOWL. Existing visualization task taxonomies [9, 63, 67] may guide this feature implementation as they allow to describe cognitive tasks with respect to goals and thus provide candidate tasks which can be implemented as interactive functionality, e.g. filtering or sorting displayed constraints based on selected criteria in the tool rather than the mind of the user. Similarly, such functionality can improve the use of ShapeUML as well.
Clear and efficient text encoding of ShapeUML with potential improvement Despite visual features for cognitive effective processing by humans, we noticed that ShapeUMLs textual representation in certain cases was as effective as ShapeVOWL and sometimes even more effective. According to our qualitative analysis, ShapeUML has an advantage for more dense or complex RDF constraint graphs due to its space efficient representation. Although text is processed using the slower cognitive processing system [43], this system might be needed for RDF constraints in any case. But instead of providing an enhanced alternative notation such as ShapeVOWL, the already space efficient ShapeUML can be improved by addressing specific design principles to support users even better. However, this would cause that ShapeUML may deviate from the UML specification, but as one participant put it: “I do believe a more UML-like format would be preferred by users IF [sic] users were allowed some slack from the rigid UML definitions”.
Visual notation Visual notations developed with effectiveness in mind may not be necessarily adopted [14], but we built on already familiar visual notations to increase a possible adoption. Despite optimized perceptual processing, users may fall for a familiarity bias: even though experts perform worse with familiar less-optimal notations, they still hesitate to switch to a non-familiar but more optimal notation [14]. Our solution tries to combine the best of both worlds, i.e. familiar notations adapted for RDF constraints by relying on cognitive effective design principles. However, more involvement from users of different domains is needed, for instance to resolve findings of our study related to misunderstood terminology or concepts. Improvements such as more specific labels or visual symbols for conceptually similar constraint types can be developed in a participatory fashion with targeted audiences, which increases the chance of adopting [14].
Limitations Our work covers the accurate processing of visually represented RDF constraint concepts and, thus, does not cover scalability of visual notations or the speed in which users processed presented information. To the best of our knowledge this is the first work investigating visual notations for RDF constraints in detail. Hence our results are initial results. We studied how different RDF constraint concepts can be visualized and how this affects the accuracy of user-provided answers based on related questions.
Future work Findings of our analysis suggest future work regarding the integration of visual notations in RDF editors, the visual notations itself and, additionally, a possible mapping from ShEx concepts. In future work we plan to incorporate features in our tool UnSHACLed to complement both visual notations such as semantic zooming to improve working with large RDF constraint graphs or enhanced user interactions to accommodate for different use cases; generally, more research towards user interactions is needed to understand real needs, especially with respect to different editing approaches for RDF constraints (cf. editing approaches for RDF mapping definitions [27, 50]).
Regarding the visual notations, a visually enhanced ShapeUML variant – as suggested by a participant – could represent a trade-off in space efficiency and effective processing and it would be an appropriate candidate for future developments and user evaluations.
Finally, a mapping from ShEx concepts to the presented visual notations could motivate efforts to extend the presented tool UnSHACLed with respect to ShEx validation of RDF data, thus more users would profit from the developed effective visual notations.
Notes
3 Material: https://doi.org/10.6084/m9.figshare.13614440.v2
11 We received information from TopQuadrant that this visualization will get a significant re-work in the future, including interactive diagram and new styling.
Acknowledgements
We would like to thank the organizers and participants of the Open Summer of Code 2019 in Belgium in which an updated version of UnSHACLed was implemented. We also thank all participants of the user study for their time and efforts as well as the reviewers for their constructive comments which helped to improve this work. The described research activities were funded by Ghent University, imec, Flanders Innovation & Entrepreneurship (VLAIO), and the European Union. Ruben Verborgh is a postdoctoral fellow of the Research Foundation – Flanders (FWO).
References
[1] | N. Achich, B. Bouaziz, A. Algergawy and F. Gargouri, Ontology visualization: An overview, in: 17th International Conference on Intelligent Systems Design and Applications (ISDA), (2017) . doi:10.1007/978-3-319-76348-4_84. |
[2] | R. Amar, J. Eagan and J. Stasko, Low-level components of analytic activity in information visualization, in: IEEE Symposium on Information Visualization, INFOVIS 2005, IEEE, (2005) , pp. 111–117. doi:10.1109/INFVIS.2005.1532136. |
[3] | A. Anikin, D. Litovkin, M. Kultsova, E. Sarkisova and T. Petrova, Ontology visualization: Approaches and software tools for visual representation of large ontologies in learning, in: Creativity in Intelligent Technologies and Data Science, Springer International Publishing, (2017) , pp. 133–149. ISBN 978-3-319-65551-2. doi:10.1007/978-3-319-65551-2_10. |
[4] | J. Bertin, Semiology of Graphics: Diagrams Networks, Maps, Technical Report, University of Wisconsin Press, (1983) . |
[5] | C. Bock, A. Fokoue, P. Haase, R. Hoekstra, I. Horrocks, A. Ruttenberg, U. Sattler and M. Smith, OWL 2 Web Ontology Language – Structural Specification and Functional-Style Syntax (Second Edition), Recommendation, World Wide Web Consortium (W3C), 2012, http://www.w3.org/TR/owl2-syntax/. |
[6] | I. Boneva, J. Dusart, D. Fernández Alvarez and J.E.L. Gayo, Shape designer for ShEx and SHACL constraints, in: Proceedings of the ISWC 2019 Satellite Tracks (Poster & Demonstrations, Industry, and Outrageous Ideas), Vol. 2456: , CEUR-WS.org, (2019) , pp. 269–272, https://hal.archives-ouvertes.fr/hal-02268667. |
[7] | T. Bosch, A. Nolle, E. Acar and K. Eckert, RDF Validation Requirements – Evaluation and Logical Underpinning, (2015) , http://arxiv.org/abs/1501.03933. |
[8] | G. Braun, C. Gimenez, L. Cecchi and P. Fillottrani, crowd: A visual tool for involving stakeholders into ontology engineering tasks, KI, Künstliche Intelligenz 34: (3) ((2020) ), 365–371. doi:10.1007/s13218-020-00657-8. |
[9] | M. Brehmer and T. Munzner, A multi-level typology of abstract visualization tasks, IEEE Transactions on Visualization and Computer Graphics 19: (12) ((2013) ), 2376–2385. doi:10.1109/TVCG.2013.124. |
[10] | A. Cimmino, A. Fernández-Izquierdo and R. García-Castro, Astrea: Automatic generation of SHACL shapes from ontologies, in: European Semantic Web Conference (ESWC), A. Harth, S. Kirrane, A.-C. Ngonga Ngomo, H. Paulheim, A. Rula, P. Haase and M. Cochez, eds, Springer International Publishing, (2020) , pp. 497–513, Springer. doi:10.1007/978-3-030-49461-2_29. |
[11] | S. Cranefield and M. Purvis, UML as an Ontology Modelling Language, in: Intelligent Information Integration, (1999) . |
[12] | J.W. Creswell, Research Design: Qualitative, Quantitative, and Mixed Methods Approaches, 3rd edn, Sage Publications Ltd., (2008) . ISBN 9781506386706. |
[13] | R. Cyganiak, D. Wood and M. Lanthaler, RDF 1.1 Concepts and Abstract Syntax, Recommendation, World Wide Web Consortium (W3C), (2014) , http://www.w3.org/TR/rdf11-concepts/. |
[14] | A. Dasgupta, Experts’ familiarity versus optimality of visualization design: How familiarity affects perceived and objective task performance, in: Cognitive Biases in Visualizations, Springer, (2018) , pp. 75–86. doi:10.1007/978-3-319-95831-6_6. |
[15] | B. De Meester, P. Heyvaert, A. Dimou and R. Verborgh, Towards a uniform user interface for editing data shapes, in: Proceedings of the 4th International Workshop on Visualization and Interaction for Ontologies and Linked Data, V. Ivanova, P. Lambrix, S. Lohmann and C. Pesquita, eds, CEUR Workshop Proceedings, Vol. 2187: , CEUR-WS.org (2018) , pp. 13–24, ISSN 1613-0073, http://ceur-ws.org/Vol-2187/paper2.pdf. |
[16] | D. De Paepe, G. Thijs, R. Buyle, R. Verborgh and E. Mannens, Automated UML-based ontology generation in OSLO2, in: The Semantic Web: ESWC 2017 Satellite Events – ESWC 2017, E. Blomqvist, K. Hose, H. Paulheim, A. Ławrynowicz, F. Ciravegna and O. Hartig, eds, Lecture Notes in Computer Science, Vol. 10577: , Springer, Cham, (2017) , pp. 93–97. doi:10.1007/978-3-319-70407-4_18. |
[17] | M. Dudáš, S. Lohmann, V. Svátek and D. Pavlov, Ontology visualization methods and tools: a survey of the state of the art, The Knowledge Engineering Review 33 (2018). doi:10.1017/s0269888918000073. |
[18] | F.J. Ekaputra and X. Lin, SHACL4P: SHACL constraints validation within Protégé ontology editor, in: 2016 International Conference on Data and Software Engineering (ICoDSE), IEEE, (2016) . doi:10.1109/icodse.2016.7936162. |
[19] | H.-G. Fill, B. Pittl and G. Honegger, A modeling environment for visual SWRL rules based on the SeMFIS platform, in: International Conference on Design Science Research in Information System and Technology, Springer, (2017) , pp. 452–456. doi:10.1007/978-3-319-59144-5_30. |
[20] | D. Garijo, WIDOCO: A wizard for documenting ontologies, in: The Semantic Web – International Semantic Web Conference (ISWC 2017), C. d’Amato, M. Fernandez, V. Tamma, F. Lecue, P. Cudré-Mauroux, J. Sequeda, C. Lange and J. Heflin, eds, Springer International Publishing, (2017) , pp. 94–102, Springer. doi:10.1007/978-3-319-68204-4_9. |
[21] | J.E.L. Gayo, D. Fernández-Álvarez and H. García-González, RDFShape: An RDF playground based on shapes, in: Proceedings of the ISWC 2018 Posters & Demonstrations, Industry and Blue Sky Ideas Tracks Co-Located with 17th International Semantic Web Conference (ISWC 2018), M. Van Erp, M. Atre, V. Lopez, K. Srinivas and C. Fortuna, eds, CEUR Workshop Proceedings, Vol. 2180: , CEUR-WS.org, (2018) . |
[22] | F. Ghorbel, N. Ellouze, F. Métais, F. Gargouri, N. Herradi et al., MEMO GRAPH: An ontology visualization tool for everyone, Procedia Computer Science 96: ((2016) ), 265–274. doi:10.1016/j.procs.2016.08.139. |
[23] | N. Goodman, Languages of Art: An Approach to a Theory of Symbols, Hackett Publishing, (1976) . ISBN 9780915144341. doi:10.2307/2066203. |
[24] | F. Haag, S. Lohmann, S. Siek and T. Ertl, QueryVOWL: A visual query notation for linked data, in: Proceedings of ESWC 2015 Satellite Events, LNCS, Vol. 9341: , Springer, (2015) , pp. 387–402. doi:10.1007/978-3-319-25639-9_51. |
[25] | P. Haase, D.M. Herzig, A. Kozlov, A. Nikolov and J. Trame, Metaphactory: A platform for knowledge graph management, Semantic Web 10: (6) ((2019) ), 1109–1125. doi:10.3233/SW-190360. |
[26] | P. Heyvaert, A. Dimou, B. De Meester, T. Seymoens, A.-L. Herregodts, R. Verborgh, D. Schuurman and E. Mannens, Specification and implementation of mapping rule visualization and editing: MapVOWL and the RMLEditor, Web Semantics: Science, Services and Agents on the World Wide Web 49: ((2018) ), 31–50, https://biblio.ugent.be/publication/8559065/file/8559068.pdf. doi:10.1016/j.websem.2017.12.003. |
[27] | P. Heyvaert, A. Dimou, R. Verborgh, E. Mannens and R. Van de Walle, Towards approaches for generating RDF mapping definitions, in: Proceedings of the 14th International Semantic Web Conference: Posters and Demos, CEUR Workshop Proceedings, Vol. 1486: , (2015) , ISSN 1613-0073, http://ceur-ws.org/Vol-1486/paper_70.pdf. |
[28] | M.F. Joseph and R. Lourdusamy, Feature analysis of ontology visualization methods and tools, Computer Science and Information Technologies 1: (2) ((2020) ), 61–77. doi:10.11591/csit.v1i2.p61-77. |
[29] | J.M. Juran, Juran’s Quality Control Handbook, 4th edn, Mcgraw-Hill, Texas, USA, (1988) , http://www.pqm-online.com/assets/files/lib/books/juran.pdf. |
[30] | A. Katifori, C. Halatsis, G. Lepouras, C. Vassilakis and E. Giannopoulou, Ontology visualization methods – a survey, ACM Comput. Surv. 39: ((2007) ), 10. doi:10.1145/1287620.1287621. |
[31] | H. Knublauch, From SPIN to SHACL, Technical Report, 2017, https://spinrdf.org/spin-shacl.html. |
[32] | H. Knublauch, J.A. Hendler and K. Idehen, SPIN – Overview and Motivation, Member Submission, World Wide Web Consortium (W3C), (2011) , https://www.w3.org/Submission/spin-overview/. |
[33] | H. Knublauch and D. Kontokostas, Shapes Constraint Language (SHACL), Recommendation, World Wide Web Consortium (W3C), (2017) , https://www.w3.org/TR/shacl/. |
[34] | S. Kuhar and G. Polančič, Conceptualization, measurement, and application of semantic transparency in visual notations, Software and Systems Modeling ((2021) ). doi:10.1007/s10270-021-00888-9. |
[35] | J.E. Labra Gayo, E. Prud’hommeaux, I. Boneva and D. Kontokostas, Validating RDF Data, Synthesis Lectures on the Semantic Web: Theory and Technology, Vol. 7: , Morgan & Claypool Publishers LLC, (2017) , pp. 1–328, http://book.validatingrdf.com/. doi:10.2200/s00786ed1v01y201707wbe016. |
[36] | S. Lieber, B. De Meester, A. Dimou and R. Verborgh, MontoloStats – ontology modeling statistics, in: Proceedings of the 10th International Conference on Knowledge Capture – K-CAP’19, R. Troncy, ed., ACM, (2019) , pp. 69–76. doi:10.1145/3360901.3364433. |
[37] | S. Lieber, B. De Meester, A. Dimou and R. Verborgh, Statistics about data shape use in RDF data, in: Proceedings of the 19th International Semantic Web Conference: Posters, Demos, and Industry Tracks, K. Taylor, R. Gonçalves, F. Lecue and J. Yan, eds, CEUR Workshop Proceedings, Vol. 2721: , (2020) , pp. 330–335, ISSN 1613-0073, http://ceur-ws.org/Vol-2721/paper584.pdf. |
[38] | R. Likert, A technique for the measurement of attitudes, Archives of Psychology 22: (140) ((1932) ), 55. |
[39] | S. Lohmann, V. Link, E. Marbach and S. Negru, WebVOWL: Web-based visualization of ontologies, in: International Conference on Knowledge Engineering and Knowledge Management, Springer, (2014) , pp. 154–158. doi:10.1007/978-3-319-17966-7_21. |
[40] | S. Lohmann, S. Negru and D. Bold, The ProtégéVOWL plugin: Ontology visualization for everyone, in: European Semantic Web Conference, Springer, (2014) , pp. 395–400. doi:10.1007/978-3-319-11955-7_55. |
[41] | S. Lohmann, S. Negru, F. Haag and T. Ertl, Visualizing ontologies with VOWL, Semantic Web 7: ((2016) ), 399–419. doi:10.3233/SW-150200. |
[42] | S. Mikhailov, M. Petrov and B. Lantow, Ontology visualization: A systematic literature analysis, in: Joint Proceedings of the BIR 2016 Workshops and Doctoral Consortium Co-Located with 15th International Conference on Perspectives in Business Informatics Research (BIR 2016), CEUR Workshop Proceedings, Vol. 1684: , CEUR-WS.org, (2016) . |
[43] | D. Moody, The “physics” of notations: Toward a scientific basis for constructing visual notations in software engineering, IEEE Transactions on Software Engineering 35: (6) ((2009) ), 756–779. doi:10.1109/TSE.2009.67. |
[44] | E. Morse, M. Lewis and K.A. Olsen, Evaluating visualizations: Using a taxonomic guide, International Journal of Human-Computer Studies 53: (5) ((2000) ), 637–662. doi:10.1006/ijhc.2000.0412. |
[45] | OMG, Object Constraint Language, Version 2.4, Technical Report, Object Management Group, 2014, Object Management Group, https://www.omg.org/spec/OCL/2.4. |
[46] | OMG, Ontology Definition Metamodel, Version 1.1, Technical Report, Object Management Group, 2014, Object Management Group, https://www.omg.org/spec/ODM/1.1. |
[47] | OMG, Unified Modeling Language, Version 2.5.1, Technical Report, Object Management Group, 2017, Object Management Group, https://www.omg.org/spec/UML/2.5.1/. |
[48] | R. Pacielloa, D. Bailoa, L. Tranib, V. Vinciarellia, M. Sbarrac and S. Capotostic, SHAPEness: a SHACL-driven RDF Graph Editor, 2021, http://www.semantic-web-journal.net/content/shapeness-shacl-driven-rdf-graph-editor. |
[49] | W.A. Pike, J. Stasko, R. Chang and T.A. O’Connell, The Science of Interaction, Information visualization 8: (4) ((2009) ), 263–274. doi:10.1057/ivs.2009.22. |
[50] | C. Pinkel, C. Binnig, P. Haase, C. Martin, K. Sengupta and J. Trame, How to best find a partner? An evaluation of editing approaches to construct R2RML mappings, in: The Semantic Web: Trends and Challenges, Springer International Publishing, (2014) , pp. 675–690, Springer. doi:10.1007/978-3-319-07443-6_45. |
[51] | E. Prud’hommeaux, Shape Expressions 1.0 Primer, Member Submission, World Wide Web Consortium (W3C), 2014, https://www.w3.org/Submission/2014/SUBM-shex-primer-20140602/. |
[52] | E. Prud’hommeaux, J.E. Labra Gayo and H. Solbrig, Shape expressions: An RDF validation and transformation language, in: Proceedings of the 10th International Conference on Semantic Systems, H. Sack, A. Filipowska, J. Lehmann and S. Hellmann, eds, Association for Computing Machinery, New York, NY, United States, (2014) , pp. 32–40, ACM, http://dl.acm.org/citation.cfm?id=2660523. doi:10.1145/2660517.2660523. |
[53] | J. Recker, Scientific Research in Information Systems: A Beginner’s Guide, Springer Science & Business Media, (2013) . ISBN 9783642-300479. |
[54] | A. Ryman, Resource Shape 2.0, Member Submission, World Wide Web Consortium (W3C), 2014, https://www.w3.org/Submission/shapes/. |
[55] | A.G. Ryman, A.J. Le Hors and S. Speicher, OSLC resource shape: A language for defining constraints on linked data, in: Proceedings of the WWW2013 Workshop on Linked Data on the Web, C. Bizer, T. Heath, T. Berners-Lee, M. Hausenblas and S. Auer, eds, CEUR Workshop Proceedings, Vol. 996: , CEUR-WS.org, (2013) , http://ceur-ws.org/Vol-996/papers/ldow2013-paper-02.pdf. |
[56] | B. Saket, A. Endert and Ç. Demiralp, Task-based effectiveness of basic visualizations, IEEE Transactions on Visualization and Computer Graphics 25: (7) ((2018) ), 2505–2512. doi:10.1109/TVCG.2018.2829750. |
[57] | R. Schaffenrath, D. Proksch, M. Kopp, I. Albasini, O. Panasiuk and A. Fensel, Benchmark for performance evaluation of SHACL implementations in graph databases, in: International Joint Conference on Rules and Reasoning, Springer, (2020) , pp. 82–96. doi:10.1007/978-3-030-57977-7_6. |
[58] | C.E. Shannon and W. Weaver, The Mathematical Theory of Communication, Univ. of Illinois Press, Urbana-Champaign, (1949) . doi:10.1063/1.3067010. |
[59] | S.S. Shapiro and M.B. Wilk, An analysis of variance test for normality (complete samples), Biometrika 52: (3/4) ((1965) ), 591–611. doi:10.2307/2333709. |
[60] | S. Steyskal and K. Coyle, SHACL Use Cases and Requirements, Technical Report, W3C, 2017, https://www.w3.org/TR/2017/NOTE-shacl-ucr-20170720/. |
[61] | A.M. Treisman and G. Gelade, A feature integration theory of attention, Cognitive Psychology 12: (1) ((1980) ), 97–136. doi:10.1093/acprof:osobl/9780199734337.003.0011. |
[62] | E.R. Valiati, M.S. Pimenta and C.M. Freitas, A taxonomy of tasks for guiding the evaluation of multidimensional visualizations, in: Proceedings of the 2006 AVI Workshop on Beyond Time and Errors: Novel Evaluation Methods for Information Visualization, (2006) , pp. 1–6. doi:10.1145/1168149.1168169. |
[63] | S. Wehrend and C. Lewis, A problem-oriented classification of visualization techniques, in: Proceedings of the First IEEE Conference on Visualization: Visualization90, IEEE, (1990) , pp. 139–143. doi:10.1109/VISUAL.1990.146375. |
[64] | M. Weise, S. Lohmann and F. Haag, Extraction and visualization of tbox information from sparql endpoints, in: European Knowledge Acquisition Workshop, Springer, (2016) , pp. 713–728. doi:10.1007/978-3-319-49004-5_46. |
[65] | M. Wertheimer, Laws of organization in perceptual forms, A source book of Gestalt psychology (1938), 71–88. doi:10.1037/11496-005. |
[66] | F. Wilcoxon, Individual comparisons by ranking methods, in: Breakthroughs in Statistics, Springer, (1992) , pp. 196–202. doi:10.1007/978-1-4612-4380-9_16. |
[67] | M.X. Zhou and S.K. Feiner, Visual task characterization for automated visual discourse synthesis, in: Proceedings of the SIGCHI Conference on Human Factors in Computing Systems, (1998) , pp. 392–399. doi:10.1145/274644.274698. |


