
Efficacy of cumulative high-frequency rTMS on freezing of gait in Parkinson’s disease
Abstract
Purpose: Freezing of gait (FOG) affects mobility and balance seriously. Few reports have investigated the effects of repetitive transcranial magnetic stimulation (rTMS) on FOG in Parkinson’s disease (PD). We investigated the efficacy of high-frequency rTMS for the treatment of FOG in PD.
Methods: Seventeen patients diagnosed with PD were recruited in a randomized, double-blinded, cross-over study. We applied high frequency rTMS (90% of resting motor threshold, 10 Hz, 1,000 pulses) over the lower leg primary motor cortex of the dominant hemisphere (M1-LL) for five sessions in a week. We also administered alternative sham stimulation with a two-week wash out period. The primary outcomes were measured before, immediately after, and one week after the intervention using the Standing Start 180° Turn Test (SS-180) with video analysis and the Freezing of Gait Questionnaire (FOG-Q). The secondary outcome measurements consisted of Timed Up and Go (TUG) tasks and the Unified Parkinson’s Disease Rating Scale part III (UPDRS-III). Motor cortical excitability was also evaluated.
Results: There were significant improvements in the step required to complete the SS-180 and FOG-Q in the rTMS condition compared to the sham condition, and the effects continued for a week. The TUG and UPDRS-III also showed significant ameliorations over time in the rTMS condition. The MEP amplitude at 120% resting motor threshold and intracortical facilitation also increased after real rTMS condition.
Conclusions: High frequency rTMS over the M1-LL may serve as an add-on therapy for improving FOG in PD.
1Introduction
Freezing of gait (FOG) is defined as a brief, episodic absence or marked reduction of forward progression of the feet despite the intention to walk (Nutt et al., 2011). Almost 50% of patients with Parkinson’s disease (PD) experience FOG at least twice a month, and 80% of patients in the more advanced stages may suffer from this symptom (Macht et al., 2007). Mobility and postural stability deteriorate over time due to FOG, ultimately resulting in the need for a wheelchair (Bloem et al., 2004). Levodopa, which keeps the patient in the “on” state for most of the time, is the most common treatment to reduce theoccurrence of FOG (Nutt et al., 2011). However, higher doses of levodopa are needed to control FOG, and its effect lessens as the disease progresses (Moreau et al., 2012). Intensive physical therapy (Allen et al., 2010) and attentional strategies using visual (Donovan et al., 2011) and auditory cues (Kadivar et al., 2011) may serve as effective rehabilitation to reduce FOG. Deep brain stimulation of the subthalamic nucleus can alleviate symptoms of FOG (Ferraye et al., 2008). Despite intense investigations, standard rehabilitation strategies have not been established in PD (Tomlinson et al., 2013), and the invasiveness of DBS is a strong drawback.
Repetitive transcranial magnetic stimulation (rTMS) is a valuable non-invasive brain stimulation tool for interventional neurophysiology applications, and modulates brain activity in a specific, distributed, cortico-subcortical network (Fregni and Pascual-Leone, 2007). Many studies about rTMS in PD have focused on its beneficial effects on motor and gait function. Meta-analyses found modest efficacy of high-frequency rTMS on motor function in PD (Fregni et al., 2005; Elahi et al., 2009). In terms of FOG in PD patients, a cross-over study that applied anodal transcranial direct current stimulation (tDCS), another non-invasive brain stimulation technique, recently showed therapeutic potential (Valentino et al., 2014). Recently, our previous research showed the 10 Hz rTMS on the primary motor cortex of the dominant hemisphere of the lower leg (M1-LL) was therapeutically effective for FOG in patients with Parkinsonism (Lee et al., 2014). Unlike single session rTMS, multi-session cumulative rTMS might provide a long-lasting effect in cortical excitability and function (Baumer et al., 2003; Chang et al., 2010). However, investigations regarding the effect of cumulative rTMS on FOG in PD are scarce.
On the basis of above previous researches, we designed and implemented a randomized, double-blinded, cross-over study to investigate immediate and long-term effects of cumulative high-frequency rTMS over M1-LL on FOG in patients with PD.
2Methods
2.1Subjects
We recruited 19 patients diagnosed as PD with FOG. Diagnoses were made by neurologists with expertise in movement disorders (JWJ and JYY) based on medical history, physical examination, and neuroimaging studies. All participants were able to walk independently without walking devices. “Freezers” were defined as patients who had a positive answer for question 3 (score ≥1), “Do you feel that your feet get glued to the floor while walking, making a turn, or when trying to initiate walking (freezing)?” on the freezing of gait questionnaire (FOG-Q) (Shine et al., 2012).
All study assessments took place in the “on” state at the same time of the day for each patient. Dosages of anti-parkinsonism medication were expressed as the levodopa equivalent dose using a formula (Tomlinson et al., 2010). We excluded patients with pre-existing and active major neurological diseases other than PD and those with a previous history of seizures or implanted metallic objects that would contraindicate rTMS (Rossi et al., 2009).
2.2Study design
This study was a randomized, double-blinded crossover design. All patients received 5 sessions of high-frequency rTMS (real) or sham stimulation (sham) over M1-LL for a week after block randomization. The stimulation was conducted with a two week interval between real and sham stimulation to avoid carryover effects, and the session order was counterbalanced across patients (Fig. 1). The assessment was carried out three times: at the baseline before stimulation (pre-rTMS at day 1), immediately after the intervention (post-rTMS at day 5), and 1 week after cessation of the intervention (follow up at day 12). It took five weeks for each participant to complete the entire trial. Medication was kept constant throughout the trial, and all interventions were performed at the same time of day.
2.3Standard protocol approvals
All study procedures were carried out with adequate understanding and written consent of the subjects involved and with the ethical approval of the authors’ institutional review boards. Written informed consent was obtained from each participant.
2.4Motor cortex mapping
The patients were seated in an armchair with a silver-silver chloride surface electrode placed over the tibialis anterior muscle contralateral to the dominant hemisphere. The hot spot was determined using a Rapid2 ® Stimulator TMS System (The Magstim Company Ltd, Wales, UK) and the double corn coil. The double corn coil was placed over the scalp and repositioned until the maximal motor evoked potential (MEP) was elicited. After determining the hot spot, the resting motor threshold (RMT) was obtained by delivering single pulse transcranial magnetic stimulation to the hot spot. The RMT was defined as the lowest TMS intensity capable of eliciting a MEP greater than a 50μV peak-to-peak amplitude in five of the ten subsequent trials.
2.5rTMS intervention
Pulses were delivered through a double corn coil and the coil was held so that the induced current was perpendicular to the midline for M1-LL stimulation. Twenty trains of 10 Hz rTMS were delivered to the target motor cortex areas of the dominant hemisphere at an intensity of 90% RMT using a Rapid ® II stimulator with two Booster Modules (The Magstim Company Ltd.). Each train was 5 seconds, with 55-second inter-train intervals, delivering 1,000 pulses in 20 minutes. Sham stimulation was conducted with a coil held at a 90° position in order to ensure that the magnetic field did not stimulate the motor cortex. The stimulation paradigm was the same as that of real M1-LL rTMS.
2.6Outcome measures
2.6.1Primary outcome measures
We used the FOG-Q, a self-assessment scale for evaluating FOG symptoms in Parkinson’s syndrome, as the primary outcome measure. Because the FOG-Q is subjective measure of FOG, we adopted an additional objective evaluation tool, a modified Standing-Start 180° Turn Test (SS-180), as another primary outcome measure. Video-based analysis of the SS-180 showed valid findings for measuring turning steps (TS) and turning time (TT) with acceptable reliability (Stack and Ashburn, 2005). We modified the SS-180 while performing a standard Timed Up-and-Go (TUG) task (Fig. 2). Specifically, the participants were instructed to walk to a target (traffic cone) 1 m behind them, turn around, and then return during the TUG task. The TUG task was repeated twice in each direction, and the entire process was video recorded to quantify FOG. The mean number of steps and time to complete the task were obtained by averaging each trial. All evaluations and video analysis were independently performed by a blinded rater.
2.6.2Secondary outcome measures
Secondary outcome measures included the mean time to complete a standard TUG task and the Unified Parkinson’s Disease Rating Scale part III (UPDRS-III). Participants were initially prepared in the sitting position, and were then requested to rise up and walk for a distance of five meters (Fig. 2). Then, the patients came back to the chair after turning 180° around a traffic cone in a 0.5 m×0.5 m box on the floor, as described previously (Shine et al., 2012). The UPDRS-III consists of 14 items that evaluate motor function.
2.6.3Measurement of cortical excitability
MEP was performed for neurophysiological testing with the TA muscle contralateral to the dominant hemisphere using single-pulse TMS at complete rest. We then investigated cortical excitability using resting motor threshold (RMT), MEP amplitude at 120% RMT intensity (AMP), short-interval intracortical inhibition (SICI), and intracortical facilitation (ICF). SICI and ICF were measured using the paired-pulse TMS technique (Kujirai et al., 1993). In the paired-pulse TMS trials, the test stimulus was applied after the conditioning stimulus at the interstimulus interval of 2 ms for SICI and 15 ms for ICF. The test and conditioning stimulus intensity was set to 120% and 80% of rMT intensity. Each trial was repeated 10 times.
2.7Statistical analysis
The sample size was determined a priori, assuming a 2-tailed independent t-test with α equal to 0.05 and power at 80% . The sample size was determined to be sufficient to detect differences (δ) of 2.0 in changes of FOG-Q post-rTMS (the main primary outcome measure), with respective standard deviations of 1.95 as calculated using the results of our previous study (Lee et al., 2014). Using Lehr’s formula (16/(δ/σ)) (Lehr, 1992) and a 20% dropout rate, we calculated that more than 19 subjects would be needed. To evaluate the effect of rTMS on all of the primary and secondary outcome measures across all time points, we performed the Friedman test with time as the within-subject factor and treatment (real or sham) as the between-subject factor. Post-hoc analysis with the Wilcoxon signed-rank test was performed. Between-group differences were analyzed using the Mann-Whitney test. Bonferroni’s pairwise comparisons across the three different assessment times were done as post-hoc analyses to interpret significant effects. The significance level was set at 0.05. All statistical analyses were performed using the software package SPSS 21.0 (SPSS Inc., Chicago, IL, USA).
3Results
3.1Subject characteristics
Two patients dropped out and 17 subjects completed this study. One patient reported a mild headache, which disappeared soon after stopping stimulation. One patient was dropped due to acute aggravation of previous heart disease that was unrelated to this study. The detailed baseline characteristics of the subjects are presented in Table 1.
3.2Changes in primary outcomes: FOG-Q and SS-180
There were no significant differences in baseline scores for the primary outcome measures between the two conditions. The Friedman test revealed significant interactions between time and condition for the FOG-Q and TS (χ 2 2 = 13.440, p = 0.001; χ 2 2 = 13.320, p = 0.001, respectively). In the real condition, the FOG-Q and TS at post-rTMS significantly improved compared with at pre-rTMS and were maintained at follow up in the real condition (p < 0.05). However, there were no significant changes in FOG-Q, TS and TT at post-rTMS and follow up in the sham condition (Table 2).
The change of FOG-Q at post-rTMS showed a significant improvement in the real condition compared with the sham condition (p < 0.05). At post-rTMS and follow up, the change of the TS in the real condition showed significant improvements compared with the sham condition (p < 0.05, Fig. 3).
3.3Changes in secondary outcomes: TUG and UPDRS-III
There were no significant differences in baseline scores on the secondary outcome measures between the two conditions. The Friedman test revealed significant interactions between time and condition for the TUQ and UPDRS-III (χ 2 2 = 10.073, p = 0.006; χ 2 2 = 8.603, p = 0.014, respectively). In the real condition, the TUG and UPDRS-III at post-rTMS significantly improved compared with at pre-rTMS and were maintained at follow up (p < 0.05). However, there were no significant changes in the TUG and UPDRS-III at post-rTMS and follow up in the sham condition (Table 2).
At post-rTMS and follow up, the change of the UPDRS in the real condition showed significant improvements compared with the sham condition (p < 0.05, Fig. 3).
3.4Cortical excitability change
The baseline values of all parameters reflecting cortical excitability did not differ between the rTMS and sham conditions. The significant interactions between time and condition of the group on the ICF were confirmed in the rTMS condition (χ 2 2 = 6.154, p = 0.046) (Table 3). The mean change in AMP at post-rTMS was significantly greater than at pre-rTMS (p < 0.05), but there was no significant difference from pre-rTMS to follow up in the rTMS condition. The mean change of ICF at post-rTMS and follow up increased significantly from pre-rTMS in the rTMS group. However, there was no significant improvement in AMP or ICF at post-rTMS or follow up in the sham condition. The RMT and ICI also failed to show significant time and condition factor interaction effects (Table 3).
4Discussion
This study demonstrated that 5 cumulative sessions a week of 10 Hz high-frequency rTMS was likely to alleviate FOG in patients with PD, and the effect continued for a week. Similar results were found in the motor and the gait function. This study provides evidence that the cumulative high-frequency rTMS is a good candidate as an add-on therapy for FOG in PD.
The behavioral data observed in this study demonstrate a clear pattern of within-group changes for the real rTMS condition. In addition, the behavioral data differed significantly between the two conditions. It is noteworthy that the effects of high-frequency rTMS on FOG were cumulative and continued for at least one week after treatment. Behavioral effects of rTMS depend on the number of sessions administered(Gershon et al., 2003). We hypothesized that this cumulative and long-lasting effect is likely due to a combination of the mechanisms described previously and direct plastic changes. Baumer et al. (Baumer et al., 2003) reported that repeated consecutive rTMS sessions led to cumulative changes in cortical excitability. Similarly, MEP parameters (AMP and ICF) that reflect cortical excitability in this study increased in the rTMS group, which suggest an increase in synaptic efficacy (Fregni et al., 2006). However, further research is needed to investigate the relationship between synaptic plasticity and FOG.
Several hypotheses might explain the favorable influence of rTMS on FOG in PD. First, rTMS might correct basal ganglia dysfunction through a cortico-basal ganglia-thalamo-cortical circuit (Shine et al., 2011; Kamble et al., 2014). Decreased neural reserve and automaticity due to dysfunctional basal ganglia are the major pathophysiological mechanisms of FOG (Shine et al., 2011). rTMS over M1 influences the premotor cortex, supplementary motor area, thalamus, and cerebellum with its connections (Kamble et al., 2014). In this study, motor cortical excitability increased significantly after treatment in the real condition. Therefore, high-frequency rTMS over the M1-LL directly increased cortical excitability, indirectly triggering striatal hyperactivity through motor pathways in the basal ganglia. These activities may modulate inhibitory impulses of the globus pallidus interna, leading to improvement of FOG (Shine et al., 2013). Second, high-frequency rTMS over M1-LL might directly activate dopaminergic neurons in the striatum, replenishing endogenous dopamine. Some previous reports support this hypothesis (Strafella et al., 2003; Khedr et al., 2007). Using positron emission tomography, high-frequency rTMS on M1 was previously shown to increase endogenous dopamine release in the ipsilateral dorsal striatum by activating corticostriatal projections (Strafella et al., 2003). In addition, Khedr et al. (Khedr et al., 2007) reported that serum dopamine levels were significantly elevated after six daily sessions of high-frequency rTMS over the right and left hand and leg motor cortex using an enzyme immunoassay.
The results of a previous study of rTMS on FOG were inconsistent with those of this study (Rektorova et al., 2007). Rektorova et al. (Rektorova et al., 2007) conducted a pilot study of rTMS for 6 patients with PD who featured off-related FOG. Using 10 Hz rTMS over either the M1-LL or DLPFC, 1,350 pulses per session were delivered for 5 days in the on state. However, the investigation was prematurely terminated because of a subjective lack of treatment. There were several factors that contributed to these differences. We delivered 1,000 rTMS pulses per session over the M1-LL only. Our rTMS protocol, including total pulses, differs from this previous study, which might result in variability (Hamada et al., 2013). In addition, different characteristics of the participants in each study may affect the results, because the FOG in PD is deeply associated with disease severity and longer levodopa treatment (Giladi et al., 2001; Macht et al., 2007).
We evaluated FOG-Q and the SS-180 as primary outcomes. Because the episodes of FOG were highly variable and usually shown in the off state, histories or questionnaires are often good indicators (Nutt et al., 2011). Shine et al. (Shine et al., 2012) found that the TUG task was a reliable method for provoking FOG in the clinical setting. In particular, they also reported that the patients with PD were most likely to freeze during turns, making it the most sensitive measure for eliciting FOG (Shine et al., 2012). However, the TUG may improve regardless of the degree of FOG if the patients were able to walk faster straight forward due to improvement in motor function. Considering these points, the modified SS-180 is likely to be a useful tool to evaluate changes in FOG for research purposes. The SS-180 based on video analysis was a comprehensive test to evaluate turning performance in a clinical setting, and has proven reliability (Stack and Ashburn, 2005, 2008). However, the validity and reliability of a modified SS-180 for evaluating FOG requires further investigation. We used a crossover design in which subjects receive a sequence of cumulative real and sham rTMS. Although this study design has the advantage of reducing the influence of confounding covariates, it has two major limitations including order effects and carry-over effects (Mills et al., 2009). The random-ordered design used in this study is intended reduce order effects. However, carry-over effects could still have affected the results, because the wash out period was relatively short at two weeks. These carry-over effects may have caused TS and TUG at pre-rTMS to appear higher in the real condition than sham condition. Despite these tendencies between the two conditions, we observed no significant differences in TS or TUG at pre-rTMS between the two conditions. In addition, episodes of FOG are often rare or absent in the clinic, and therefore a questionnaire is an appropriate assessment tool for the presence and severity of FOG (Nutt et al., 2011). FOG-Q was significantly different between the two conditions. However, differences in the subjectivemeasurement at baseline constitute one of limitations of this study, and further studies with longer wash out periods or parallel designs will be needed.
This study has some limitations. Because the sham stimulation was conducted without a sham coil, some participants could be identified the difference between the real and sham condition. Even though the blind observer assessed the behavioral and cortical excitability analysis, it is one of limitations of this study. Also, there were a relative small number of participants to parametric statistical analysis. All measurements and treatment were performed in the “on” state in PD. Because this study was conducted on an outpatient basis, the participants could not visit every day in the “off” state. However, we focused on rTMS as an add-on therapy rather than as a medication replacement in this study. Further investigations are required to supplement these limits in the future.
In conclusion, despite many studies of the therapeutic role of rTMS in PD, few studies investigate the effects of rTMS on FOG. Our results suggest that the cumulative high-frequency rTMS over the M1-LL may serve as an add-on therapy for improving FOG in PD.
Acknowledgements and sources of funding
This study was supported by the Samsung Medical Center grant [#CRO112051], the NationalResearch Foundation of Korea (NRF-2014R1A2A1A01005128), and the Korea Science and Engineering Foundation (M10644000022-06N4400-02210).
Conflict of interest
None.
REFERENCE
1 | Allen NE, Canning CG, Sherrington C, Lord SR, Latt MD, Close JC, O’Rourke SD, Murray SM, Fung VS(2010) The effects of an exercise program on fall risk factors in people with Parkinson’s disease: A randomized controlled trialMov Disord25: 912171225 |
2 | Baumer T, Lange R, Liepert J, Weiller C, Siebner HR, Rothwell JC, Munchau A(2003) Repeated premotor rTMS leads to cumulative plastic changes of motor cortex excitability in humansNeuroimage20: 1550560 |
3 | Bloem BR, Hausdorff JM, Visser JE, Giladi N(2004) Falls and freezing of gait in Parkinson’s disease: A review of two interconnected, episodic phenomenaMov Disord19: 8871884 |
4 | Chang WH, Kim YH, Bang OY, Kim ST, Park YH, Lee PK(2010) Long-term effects of rTMS on motor recoveryinpatients after subacute strokeJ Rehabil Med42: 8758764 |
5 | Donovan S, Lim C, Diaz N, Browner N, Rose P, Sudarsky LR, Tarsy D, Fahn S, Simon DK(2011) Laserlight cues for gait freezing in Parkinson’s disease: An open-label studyParkinsonism Relat Disord17: 4240245 |
6 | Elahi B, Elahi B, Chen R(2009) Effect of transcranialmagnetic stimulation on Parkinson motor function–systematicreview of controlled clinical trialsMov Disord24: 3357363 |
7 | Ferraye MU, Debu B, Fraix V, Xie-Brustolin J, Chabardes S, Krack P, Benabid AL, Pollak P(2008) Effects of subthalamic nucleus stimulation and levodopa on freezing of gait in Parkinson diseaseNeurology70: 16 Pt 214311437 |
8 | Fregni F, Boggio PS, Valle AC, Rocha RR, Duarte J, Ferreira MJ, Wagner T, Fecteau S, Rigonatti SP, Riberto M, Freedman SD, Pascual-Leone A(2006) A sham-controlled trial of a -day course of repetitive transcranial magnetic stimulation of the unaffected hemisphere in stroke patientsStroke37: 821152122 |
9 | Fregni F, Pascual-Leone A(2007) Technology insight: Noninvasive brain stimulation in neurology-perspectives on the therapeutic potential of rTMS and tDCSNat Clin Pract Neurol3: 7383393 |
10 | Fregni F, Simon DK, Wu A, Pascual-Leone A(2005) Non-invasive brain stimulation for Parkinson’s disease: A systematic review and meta-analysis of the literatureJ Neurol Neurosurg Psychiatry76: 1216141623 |
11 | Gershon AA, Dannon PN, Grunhaus L(2003) Transcranial magnetic stimulation in the treatment of depressionAm J Psychiatry160: 5835845 |
12 | Giladi N, Treves TA, Simon ES, Shabtai H, Orlov Y, Kandinov B, Paleacu D, Korczyn AD(2001) Freezing of gait in patients with advanced Parkinson’s diseaseJ Neural Transm108: 15361 |
13 | Hamada M, Murase N, Hasan A, Balaratnam M, Rothwell JC(2013) The role of interneuron networks in driving human motor cortical plasticityCereb Cortex23: 715931605 |
14 | Kadivar Z, Corcos DM, Foto J, Hondzinski JM(2011) Effect of step training and rhythmic auditory stimulation on functional performance in Parkinson patientsNeurorehabil Neural Repair25: 7626635 |
15 | Kamble N, Netravathi M, Pal PK(2014) Therapeutic applications of repetitive transcranial magnetic stimulation (rTMS) in movement disorders: A reviewParkinsonism Relat Disord20: 7695707 |
16 | Khedr EM, Rothwell JC, Shawky OA, Ahmed MA, Foly N, Hamdy A(2007) Dopamine levels after repetitive transcranial magnetic stimulation of motor cortex in patients with Parkinson’s disease: Preliminary resultsMov Disord22: 710461050 |
17 | Kujirai T, Caramia MD, Rothwell JC, Day BL, Thompson PD, Ferbert A, Wroe S, Asselman P, Marsden CD(1993) Corticocortical inhibition in human motor cortexJ Physiol471: 501519 |
18 | Lee SY, Kim MS, Chang WH, Cho JW, Youn JY, Kim YH(2014) Effects of repetitive transcranial magnetic stimulation on freezing of gait in patients with ParkinsonismRestor Neurol Neurosci32: 6743753 |
19 | Lehr R(1992) Sixteen S-squared over D-squared: A relation for crude sample size estimatesStat Med11: 810991102 |
20 | Macht M, Kaussner Y, Moller JC, Stiasny-Kolster K, Eggert KM, Kruger HP, Ellgring H(2007) Predictors of freezing in Parkinson’s disease: A survey of, patientsMov Disord22: 7953956 |
21 | Mills EJ, Chan AW, Wu P, Vail A, Guyatt GH, Altman DG(2009) Design, analysis, and presentation of crossover trialsTrials10: 27 |
22 | Moreau C, Delval A, Defebvre L, Dujardin K, Duhamel A, Petyt G, Vuillaume I, Corvol JC, Brefel-Courbon C, Ory-Magne F, Guehl D, Eusebio A, Fraix V, Saulnier PJ, Lagha-Boukbiza O, Durif F, Faighel M, Giordana C, Drapier S, Maltete D, Tranchant C, Houeto JL, Debu B, Sablonniere B, Azulay JP, Tison F, Rascol O, Vidailhet M, Destee A, Bloem BR, Bordet R, Devos D(2012) Methylphenidate for gait hypokinesia and freezing in patients with Parkinson’s disease undergoing subthalamic stimulation: A multicentre, parallel, randomised, placebo-controlled trialLancet Neurol11: 7589596 |
23 | Nutt JG, Bloem BR, Giladi N, Hallett M, Horak FB, Nieuwboer A(2011) Freezing of gait: Moving forward on a mysterious clinical phenomenonLancet Neurol10: 8734744 |
24 | Rektorova I, Sedlackova S, Telecka S, Hlubocky A, Rektor I(2007) Repetitive transcranial stimulation for freezing of gait in Parkinson’s diseaseMov Disord22: 1015181519 |
25 | Rossi S, Hallett M, Rossini PM, Pascual-Leone ASafety of, T.M.S.C.G.(2009) Safety, ethical considerations, and application guidelines for the use of transcranial magnetic stimulation in clinical practice and researchClin Neurophysiol120: 1220082039 |
26 | Shine JM, Matar E, Ward PB, Bolitho SJ, Gilat M, Pearson M, Naismith SL, Lewis SJ(2013) Exploring the cortical and subcortical functional magnetic resonance imaging changes associated with freezing in Parkinson’s diseaseBrain136: Pt 412041215 |
27 | Shine JM, Moore ST, Bolitho SJ, Morris TR, Dilda V, Naismith SL, Lewis SJ(2012) Assessing the utility of Freezing of Gait Questionnaires in Parkinson’s DiseaseParkinsonism Relat Disord18: 12529 |
28 | Shine JM, Naismith SL, Lewis SJ(2011) The pathophysiological mechanisms underlying freezing of gait in Parkinson’s DiseaseJ Clin Neurosci18: 911541157 |
29 | Stack E, Ashburn A(2005) Early development of the standing-start ° turn testPhysiotherapy91: 613 |
30 | Stack E, Ashburn A(2008) Dysfunctional turning in Parkinson’s diseaseDisabil Rehabil30: 1612221229 |
31 | Strafella AP, Paus T, Fraraccio M, Dagher A(2003) Striatal dopamine release induced by repetitive transcranial magnetic stimulation of the human motor cortexBrain126: Pt 1226092615 |
32 | Tomlinson CL, Patel S, Meek C, Herd CP, Clarke CE, Stowe R, Shah L, Sackley CM, Deane KH, Wheatley K, Ives N(2013) Physiotherapy versus placebo or no intervention in Parkinson’s diseaseCochrane Database Syst Rev9: CD002817 |
33 | Tomlinson CL, Stowe R, Patel S, Rick C, Gray R, Clarke CE(2010) Systematic review of levodopa dose equivalency reporting in Parkinson’s diseaseMov Disord25: 1526492653 |
34 | Valentino F, Cosentino G, Brighina F, Pozzi NG, Sandrini G, Fierro B, Savettieri G, D’Amelio M, Pacchetti C(2014) Transcranial direct current stimulation for treatment of freezing of gait: A cross-over studyMov Disord29: 810641069 |
Figures and Tables
Fig.1
Study design. This study was a randomized, double-blind crossover design. All participants received 5 sessions of high-frequency rTMS or sham stimulation after block randomization. The stimulation was conducted with a two week interval between real and sham sessions, and the session order was counterbalanced across the participants. The assessment of FOG was carried out three times: at the baseline before stimulation (pre-rTMS at day 1), immediately after the intervention (post-rTMS at day 5), and 1 week after cessation of the intervention (follow-up at day 12).
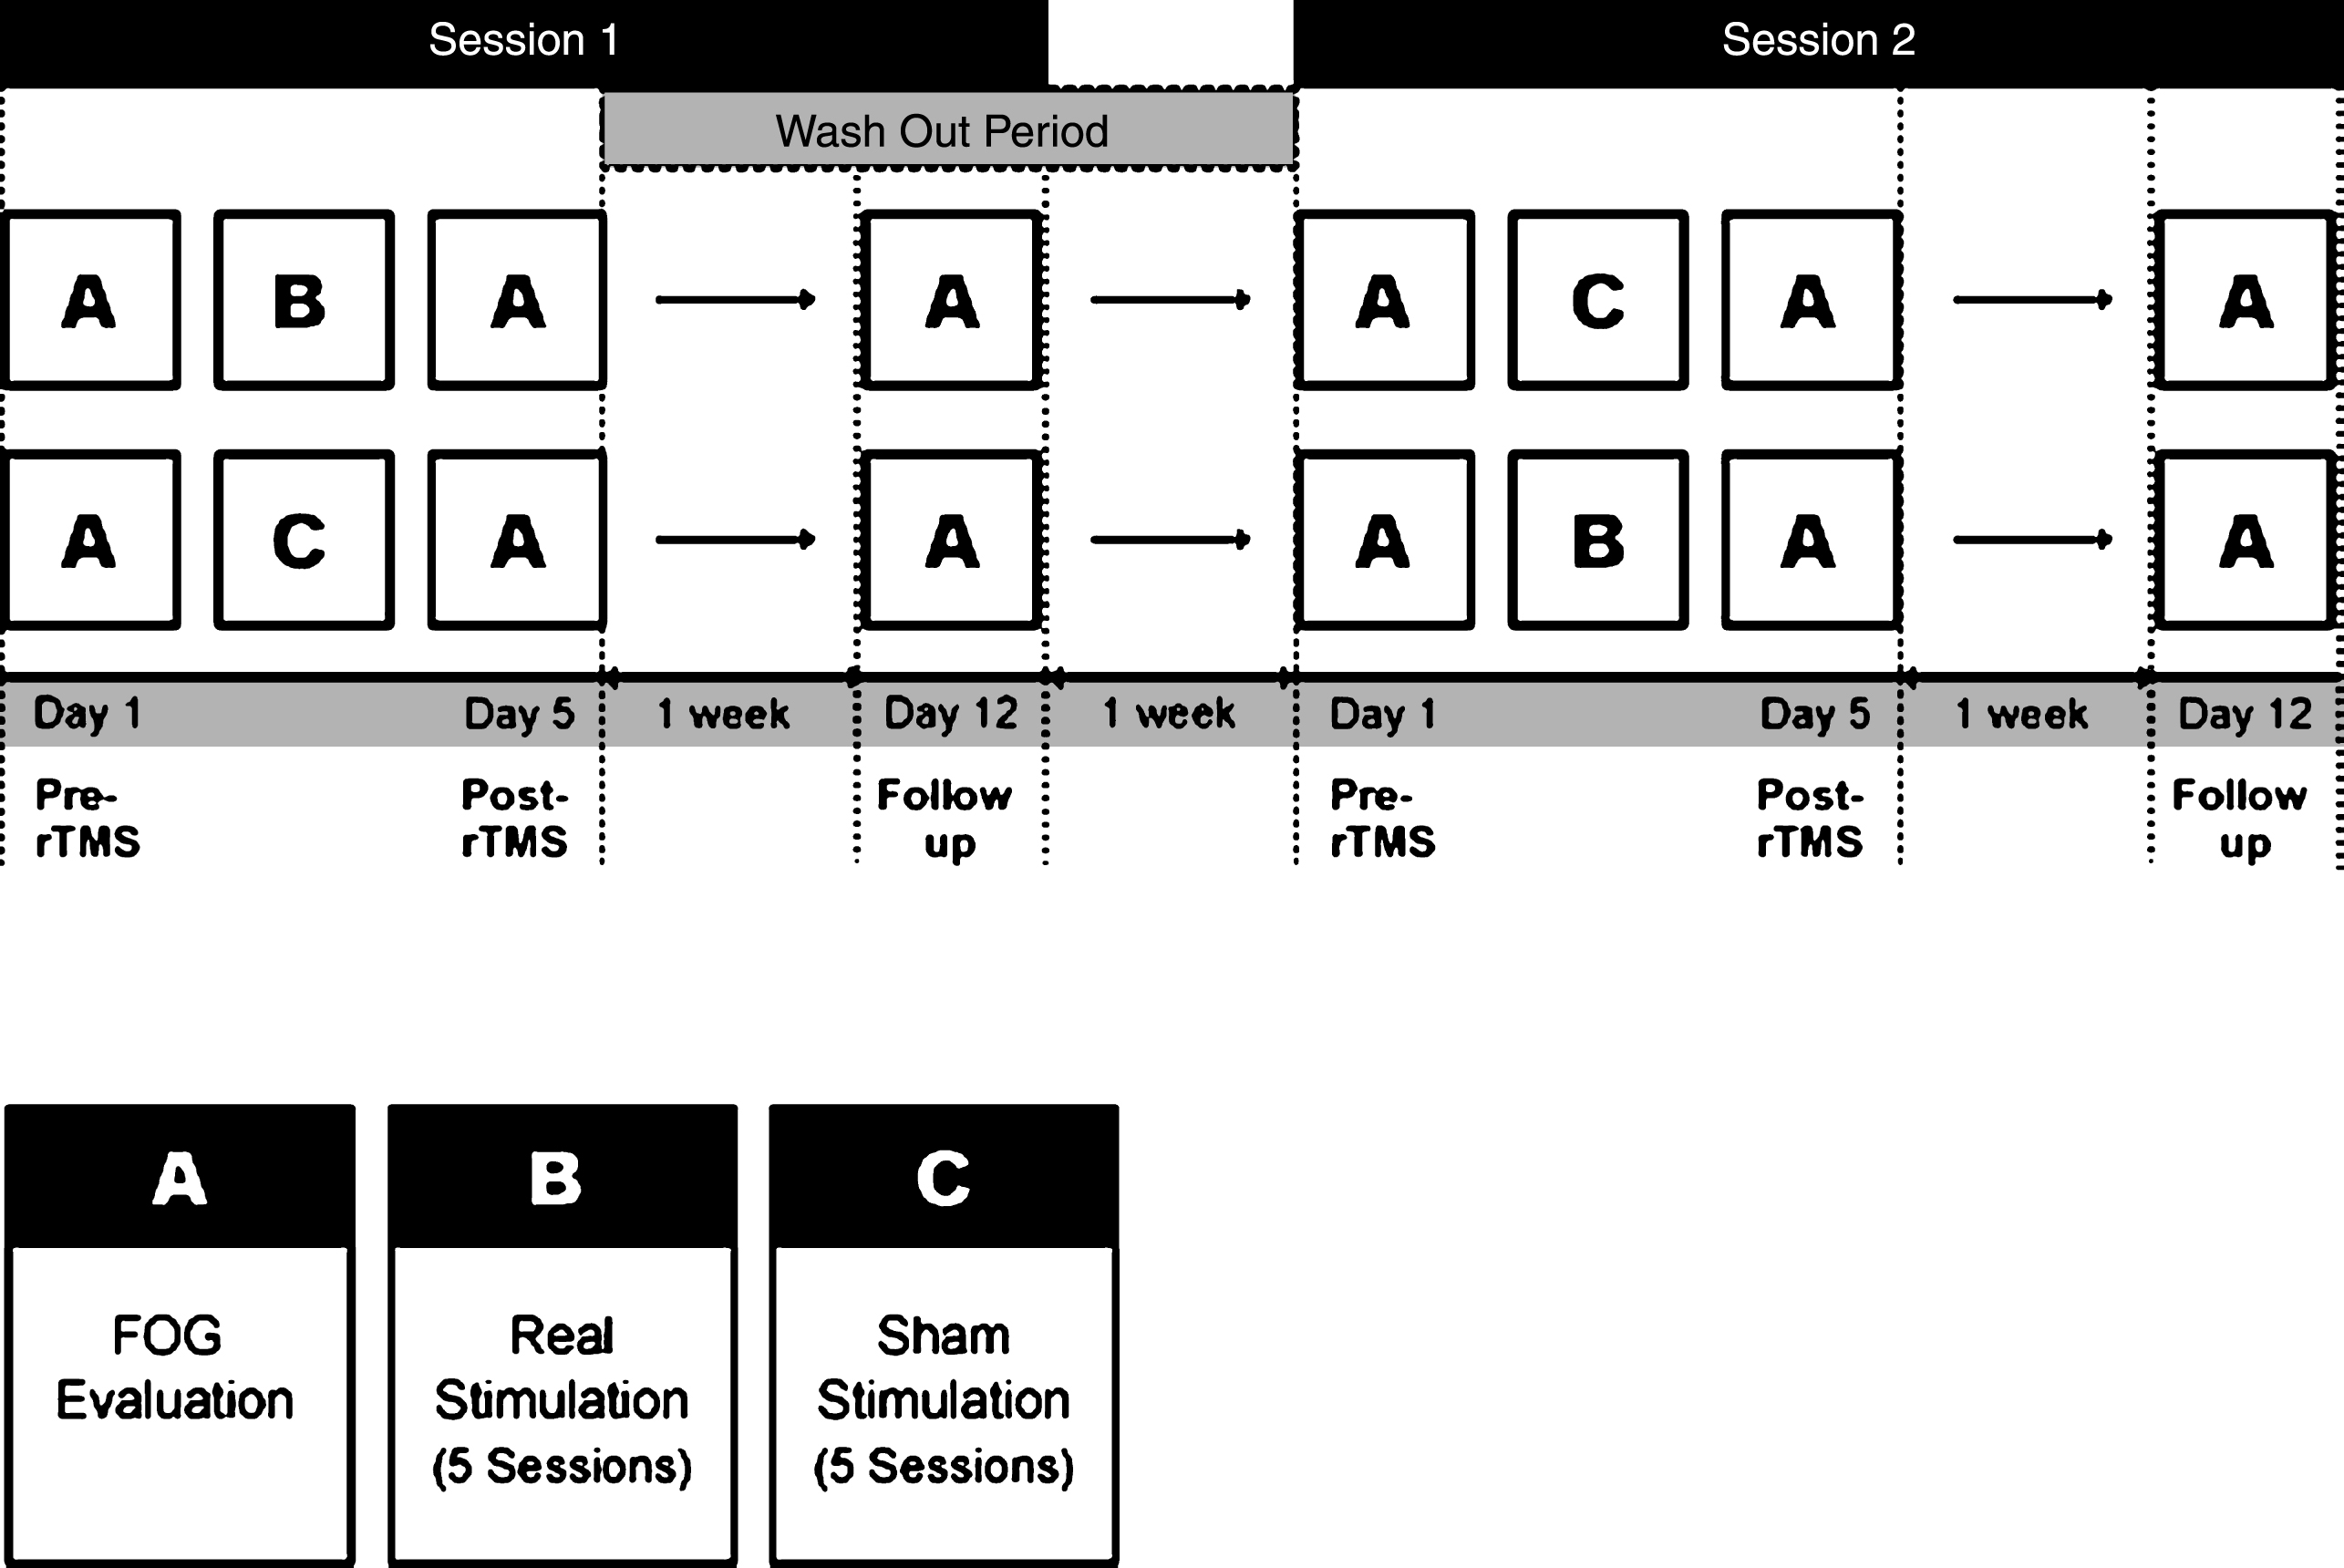
Fig.2
Schematic drawing of the standard Timed Up and Go (TUG) task and the modified Standing Start 180° Turn Test (SS-180). The participants walk for a distance of five meters from a sitting position and come back to the chair after turning 180° around a traffic cone in a 0.5 m × 0.5 m target box. The time and number of steps during the 180° turn are measured from the point when the patient is one meter from the cone. The whole process is recorded by a video camera.
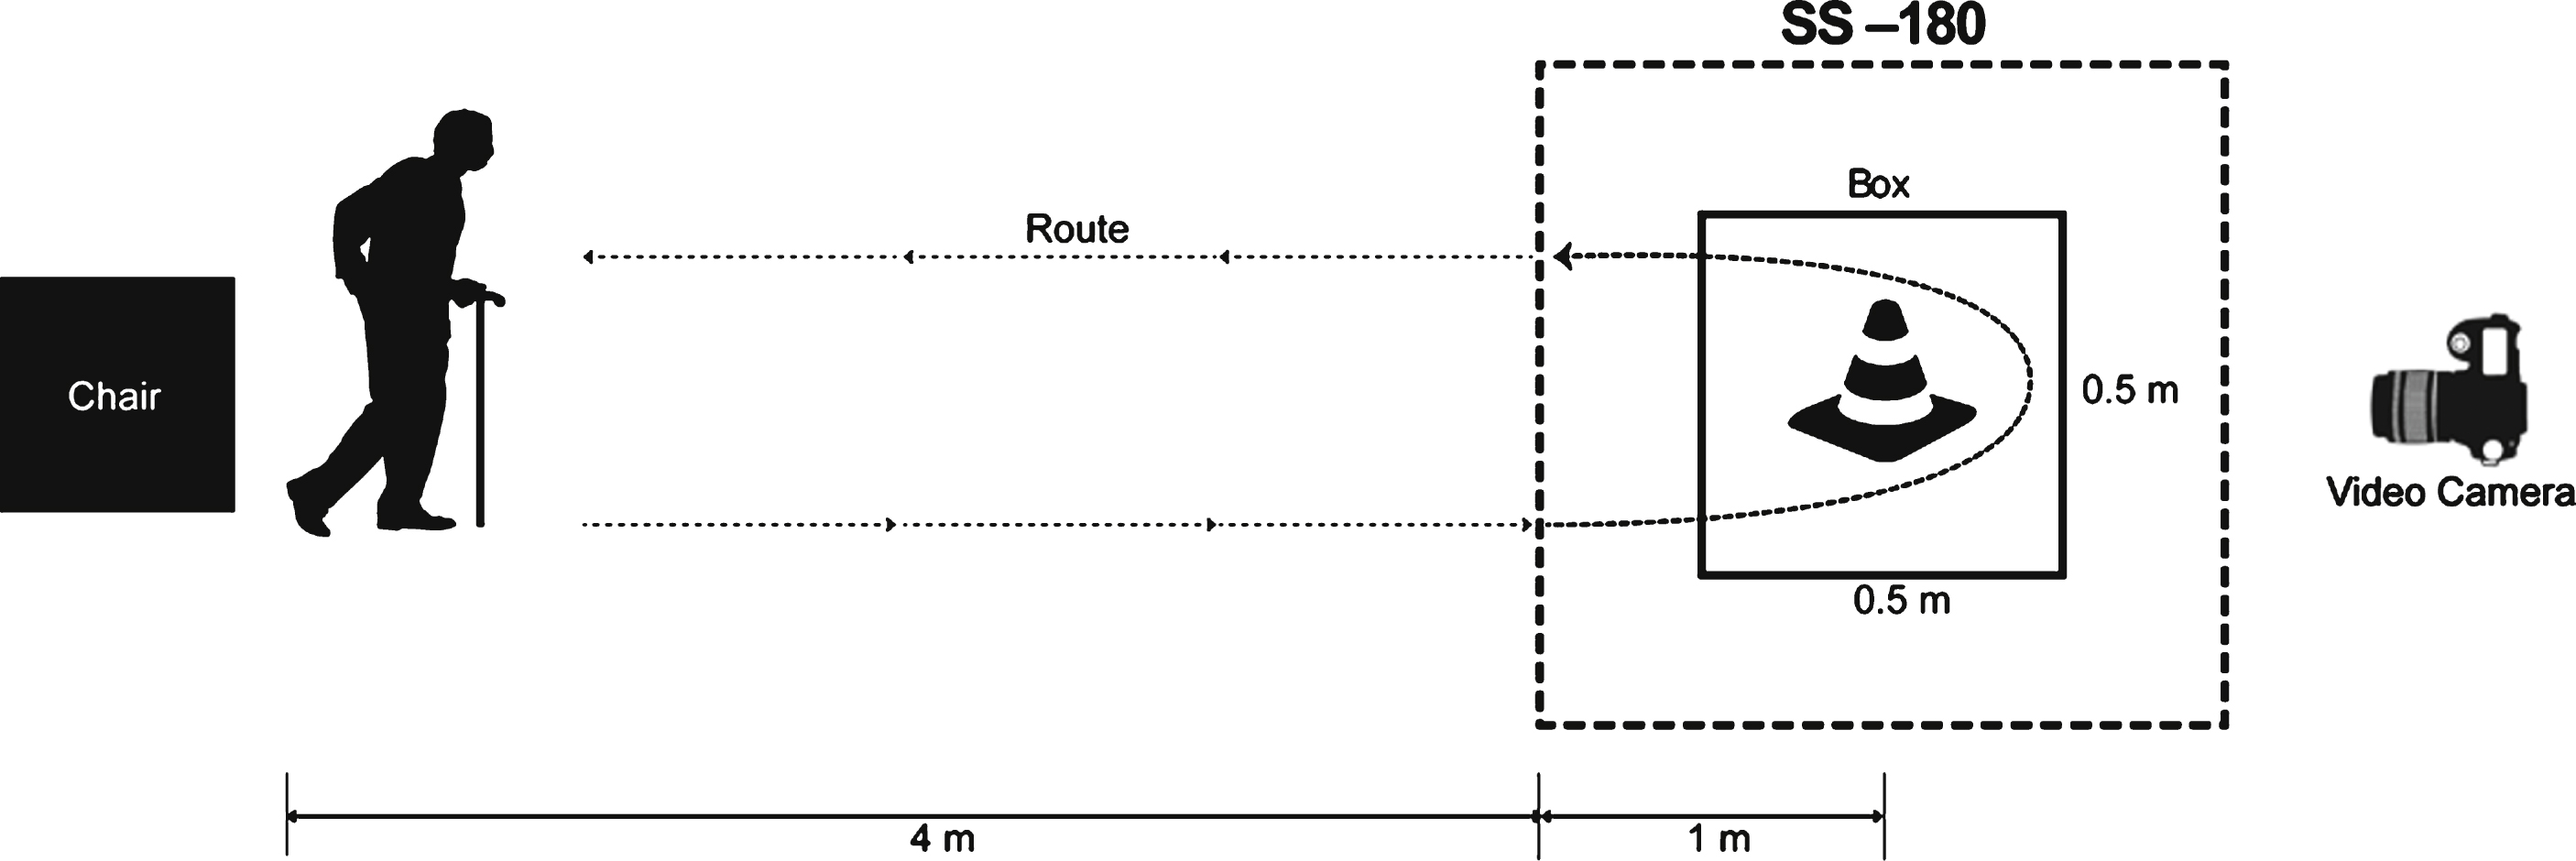
Fig.3
Changes of behavioral data in the real and sham conditions. (A) the freezing of gait questionnaire (FOG-Q) (B) turning steps (TS), (C) turning time (TT) using the Standing Start 180° Turn Test, (D) the Timed Up and Go task and (E) the Unified Parkinson’s Disease Rating Scale part III (UPDRS-III). *, P < 0.05 comparison with sham condition.
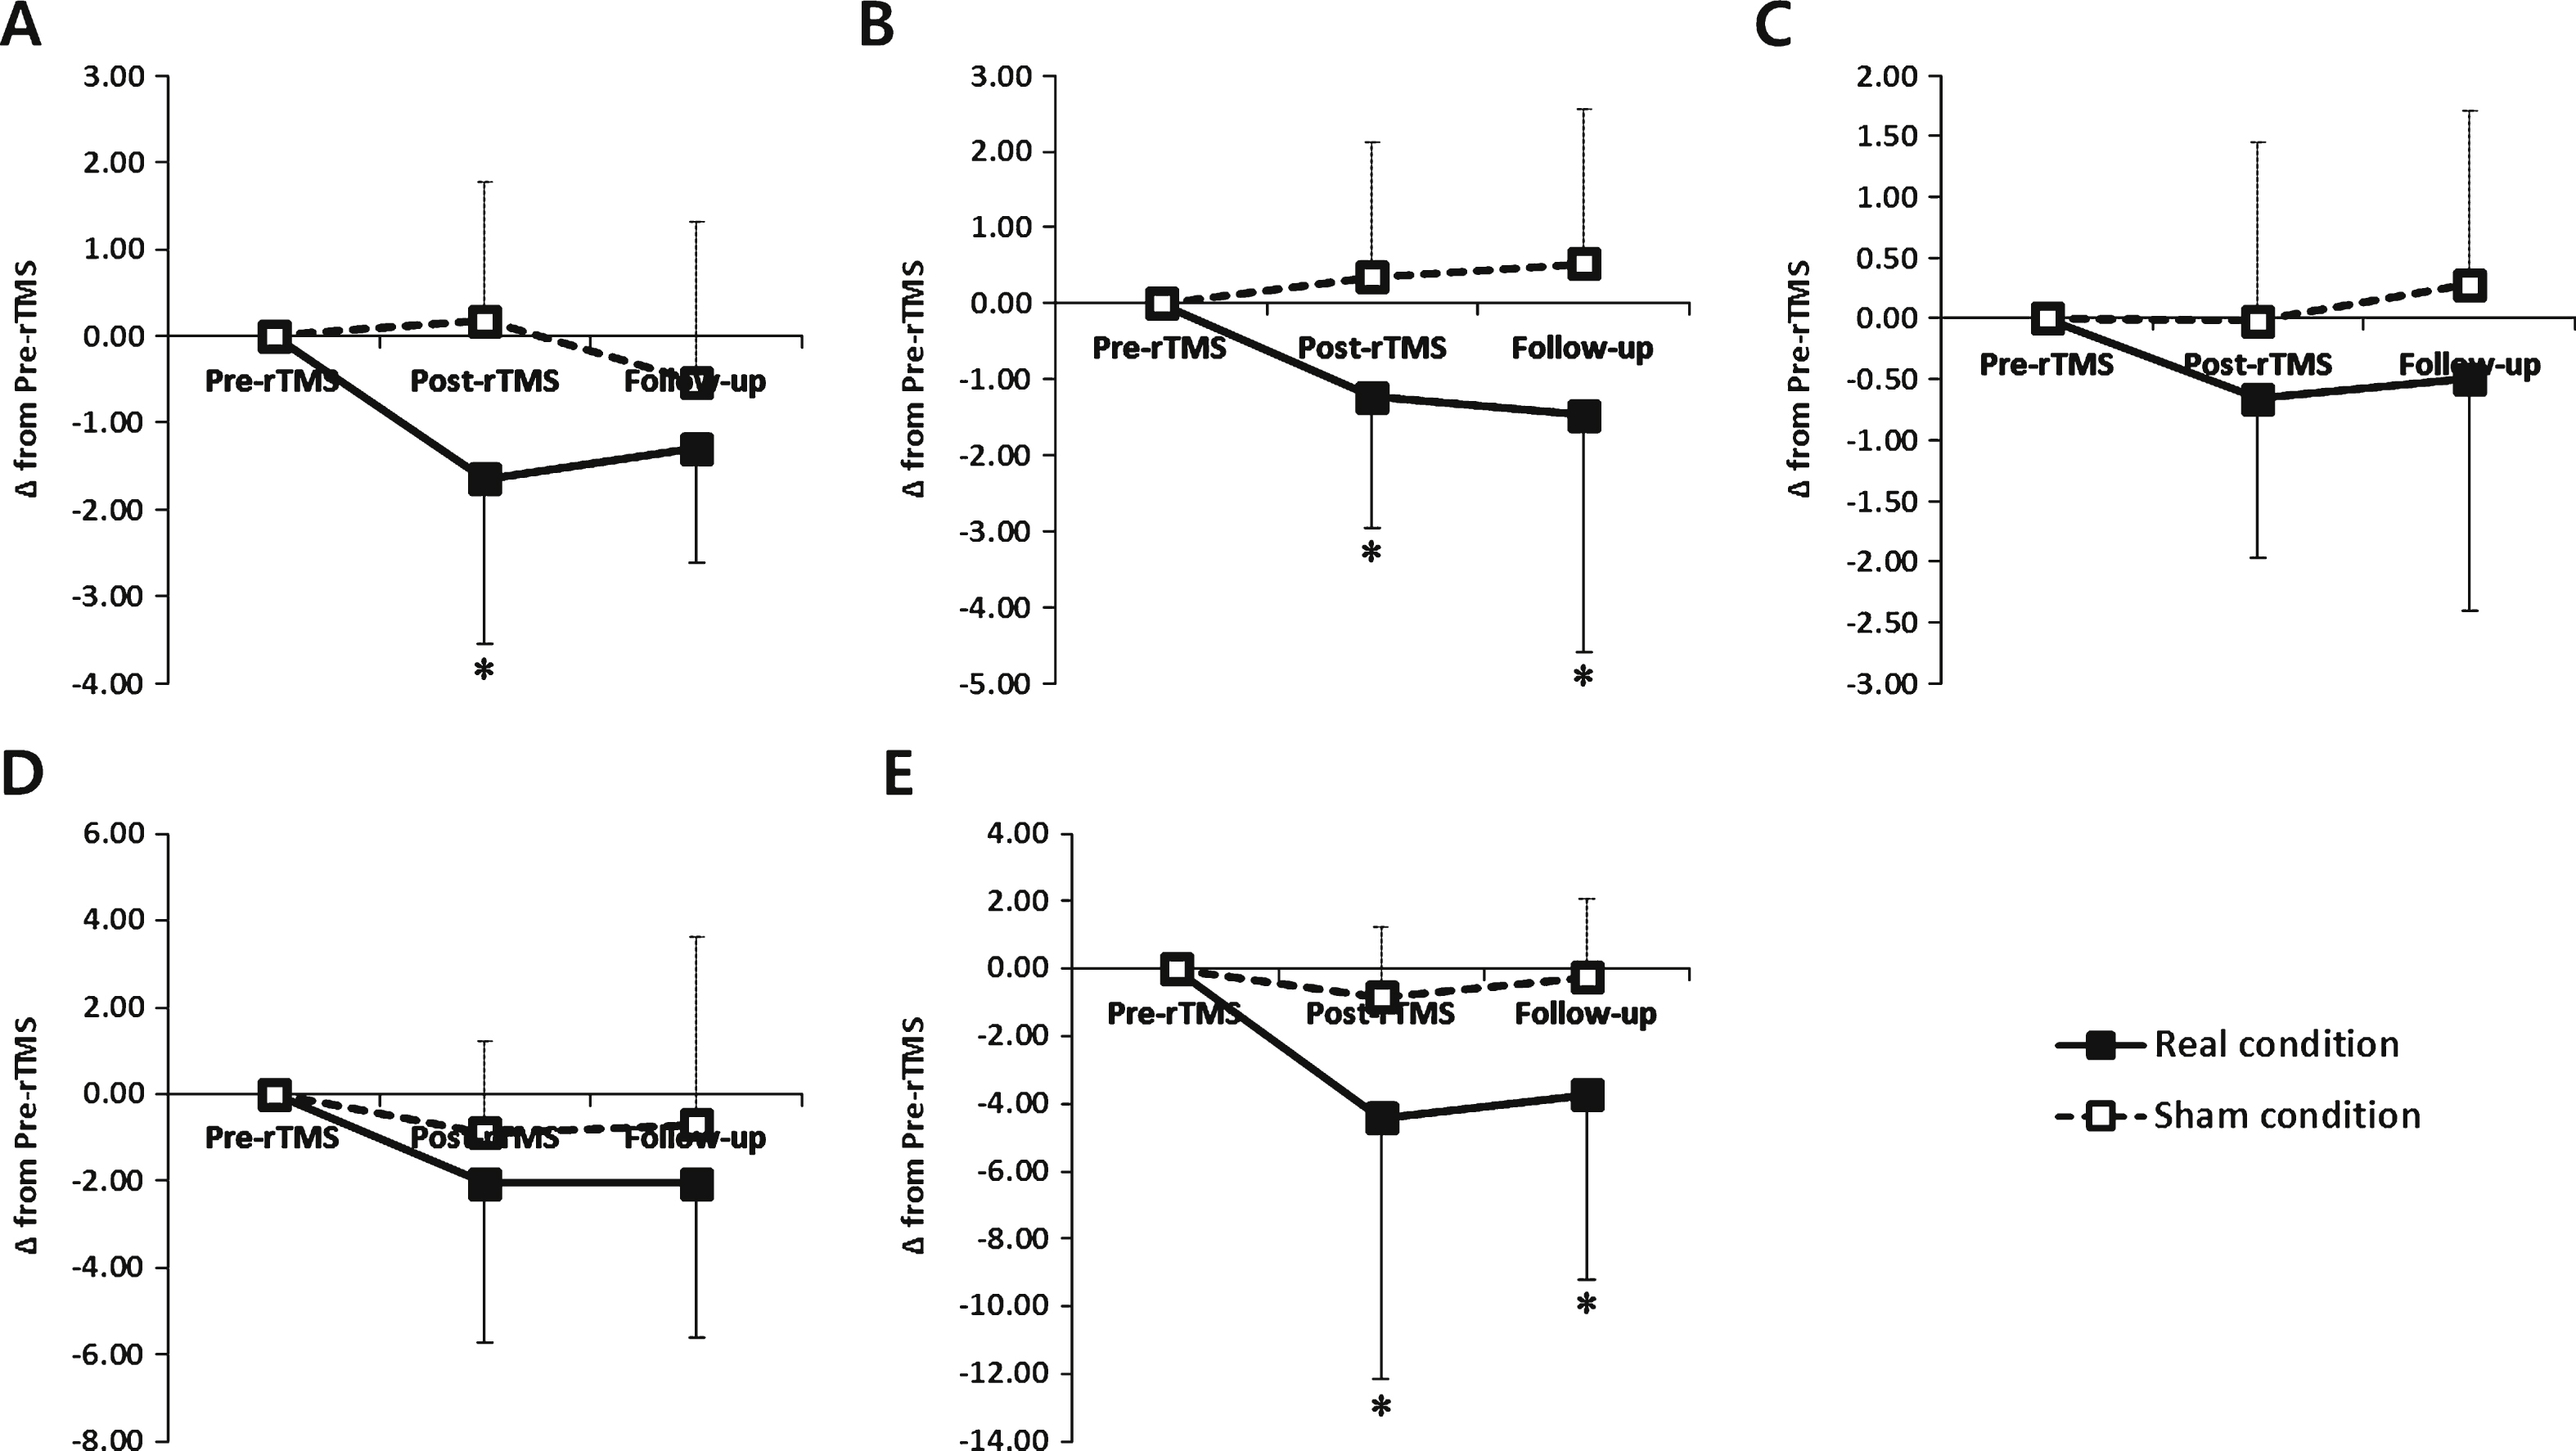
Table 1
Baseline characteristics of patients
| Pt. no. | Gender | Age (yrs) | Disease duration (yrs) | Hoehn & Yahr stage | LEDD (mg/day) |
| 1 | M | 77 | 5 | 4 | 1,350 |
| 2 | F | 67 | 6 | 3 | 940 |
| 3 | M | 69 | 2 | 4 | 300 |
| 4 | F | 74 | 4 | 3 | 830 |
| 5 | M | 78 | 6 | 3 | 750 |
| 6 | M | 64 | 6 | 2.5 | 960 |
| 7 | F | 47 | 7 | 2.5 | 1,060 |
| 8 | F | 56 | 9 | 3 | 600 |
| 9 | F | 57 | 11 | 3 | 735 |
| 10 | M | 69 | 5 | 2.5 | 250 |
| 11 | M | 71 | 12 | 3 | 650 |
| 12 | M | 64 | 11 | 2.5 | 620 |
| 13 | M | 57 | 16 | 4 | 440 |
| 14 | M | 66 | 8 | 2.5 | 1,100 |
| 15 | M | 54 | 1 | 3 | 900 |
| 16 | F | 65 | 20 | 2.5 | 600 |
| 17 | M | 61 | 4 | 2.5 | 760 |
| Mean ± SD | M:F = 12:5 | 64.5 ± 8.4 | 7.8 ± 4.9 | 3.0 ± 0.5 | 755.6 ± 285.9 |
LEDD: the levodopa equivalent daily dose.
Table 2
Behavioral outcomes measures
| Pre-rTMS | Post-rTMS | Follow up | ||
| Primary outcome measures | ||||
| FOG-Q | Real condition | 12.6 ± 5.3 | 11.0 ± 5.4 * | 11.4 ± 5.0 * |
| Sham condition | 12.2 ± 5.1 | 12.4 ± 6.1 | 11.7 ± 4.9 | |
| TS (steps) | Real condition | 14.4 ± 6.4 | 13.1 ± 6.1 * | 12.9 ± 5.9 * |
| Sham condition | 13.0 ± 7.4 | 13.3 ± 8.3 | 13.5 ± 7.7 | |
| TT (sec) | Real condition | 10.07 ± 4.93 | 9.41 ± 5.57 | 9.57 ± 6.13 |
| Sham condition | 9.60 ± 4.82 | 9.58 ± 5.70 | 9.88 ± 5.63 | |
| Secondary outcome measures | ||||
| TUG (sec) | Real condition | 27.05 ± 22.24 | 25.00 ± 21.26 * | 25.00 ± 23.03 * |
| Sham condition | 24.94 ± 20.28 | 24.22 ± 19.44 | 24.33 ± 18.88 | |
| UPDRS-III | Real condition | 14.4 ± 13.5 | 10.0 ± 10.3 * | 10.7 ± 12.7 * |
| Sham condition | 14.2 ± 11.8 | 13.4 ± 10.9 | 14.0 ± 11.3 | |
Values are presented as mean ± SD. FOG-Q: freezing of gait questionnaire; TS: turn steps of a modified Standing-Start 180° Turn Test; TT: turn time of a modified Standing-Start 180° Turn Test; TUG: Timed Up and Go; UPDRS-III: Unified Parkinson’s Disease Rating Scale part III. *Within condtion: p < 0.05, when compared with baseline.
Table 3
Cortical excitability measures
| Pre-rTMS | Post-rTMS | Follow up | ||
| RMT (% ) | Real condition | 46.2 ± 7.9 | 46.70 ± 8.8 | 47.7 ± 8.3 |
| Sham condition | 46.8 ± 8.0 | 46.2 ± 8.0 | 46.8 ± 8.1 | |
| AMP (uV) | Real condition | 471.9 ± 422.9 | 644.2 ± 488.0 *† | 585.4 ± 421.3 |
| Sham condition | 495.8 ± 421.8 | 432.6 ± 462.3 | 457.2 ± 287.9 | |
| SICI (% ) | Real condition | 61.88 ± 23.07 | 61.35 ± 36.19 | 57.23 ± 28.74 |
| Sham condition | 52.76 ± 22.33 | 63.7 ± 25.04 | 56.05 ± 27.80 | |
| ICF (% ) | Real condition | 105.3 ± 47.4 | 176.9 ± 74.9 *† | 133.9 ± 51.7 * |
| Sham condition | 106.9 ± 48.9 | 100.7 ± 41.3 | 111.0 ± 62.4 |
Values are presented as mean ± SD. RMT: resting motor threshold; AMP: MEP amplitude at 120% RMT intensity; SICI: short-interval intracortical inhibition; ICF: intracortical facilitation. *Within condition: p < 0.05, when compared with baseline. †Between conditions: p < 0.05, when compared with the sham condition.

