
Validation of laser scanner for the collection of anthropometric measurement
Abstract
BACKGROUND:
Laser imaging provides an alternative to manual measurements in the collection of general anthropometric surveys focused on 1-D measures. This study aimed to develop a systematic method of comparing manual and digital anthropometric measurements and validate a commercial three-dimensional laser scanner for anthropometric measurements.
OBJECTIVE:
The purpose of this preliminary project is to validate a laser scanner for selected length and girth measurements.
METHODS:
A variety of linear and circumferential segmental measures from 20 participants were either extracted from a 3D commercial laser imaging device scans or measured manually. Error between manual and scan-extracted measurements was compared based on ISO20685, and clinical standards. Regression analysis improved the quality of the measurements and residuals were again compared to the standards.
RESULTS:
After regression, 7 of the 9 the measurements were within, or close to (two times standard), standards. Error was caused by a combination of image quality issues associated with the laser scanner, as well as algorithmic issues associated with larger participants.
CONCLUSIONS:
Overall, the results are promising, and given the indicated population, a small number of minor improvements may very quickly allow the scanner to collect measurements on a clinical population.
1.Introduction
Human anthropometry is used in a variety of scientific and applied areas including health (e.g. skin folds, girths) sports (e.g. stature, body mass, strength) and occupational ergonomics (structural anthropometry, reach, etc.). However, across the research areas the overlapping measurement principles and techniques are reliant on basic measurement concepts of accuracy, repeatability and validity.
There is also a constant need to continue to obtain these accurate and valid measures as that can be obtained as quickly as possible. Early anthropometric measures relied on manual measures of length and girth or volumetric measures of limb and body volumes through fluid displacement for their application. Modern measurement processes such as laser scanning present attractive alternatives to capture a greater number of measures in less time as well as preserving the original image for secondary data analyses. Scanning also provides the opportunity to extend the measures from uni-dimensional measures of length, breadth, girth to 3-D measures of volume. Volumetric measures are useful in ergonomics to determine the volume space requirements of the human and the effects of addition items such as clothing and equipment.
Early in the application of laser scanning, the focus of the measurement process and results of laser scanning was for traditional length and girth dimensions of the population. The CAESAR project is but one example of the use of laser scanning for large scale population based measures. Robinette and Daanen [1] as a part of that project demonstrated the repeatability of the anthropometric measures across measurement groups and machines. Generally accepted guidelines for repeatability [2] were able to demonstrate high intra-rater reliability of the measures across a larger number of 1-D dimensions. More recently the application of laser scanning has been also included the measures of clothed and or encumbered individuals to better understand the volume and space requirements of the person [3]. This information is extremely useful in studying interior space requirements for fully clothed individuals.
However, measures of area and volumes are more susceptible to cumulative error propagation due to the basics of area and volume calculations and the varied effect shape has on the measures. Well before laser scanning, Hanivan [4] developed a method of estimating segmental and total body volumes by assuming each segment could be modelled as a regular shape (sphere, fulstrum, other) in which knowledge of a few measures would allow for estimates of areas and volumes. This method increased the ability to estimate anthropometric information about human subjects for biomechanical studies. However, the method still relied on a substantial modeling assumption about the regular shape of humans and the various body segments.
Laser scanning clearly has the potential to improve the manual (immersion) and modeling measures of volumes, it also should be faster and more accurate than the manual methods and it does not require the condition that the segment shapes be a regular shape. Sub-dividing larger body segments into smaller components should improve the accuracy of the measures surface and volume measures. The purpose of this study was to evaluation a low-cost, low-resolution laser scanner for determining total segmental and whole-body volume measures of humans.
2.Methods
2.1Population sampling
This study is a proof of concept validation to test if a 3D low resolution laser scanner (Unique Solutions, Inc.) would adequately measure linear and circumferential anthropometric measurements, especially in severely obese populations. Consequently, participants composed a small-scale sample of convenience of the target population. This stratified sampling allows to determine the systematic error of the scanner over a large range of possible measurements, and larger variety of body shape, prior to determination of agreement between manual and 3D scan extracted measures in obese participants. The stratification of the participants was based on the following BMI categories:
2.2Data collection
All participants underwent the same measurement protocol consisting in one landmark identification station and two measurement stations. The order of stations was the following: Landmark Identification, Laser Scan acquisition and Linear Manual measurements.
2.2.1Landmark identification
Participants were asked to change into standard garments provided by the researchers. Males wore white boxer briefs, and females wore white undergarments, or spandex shorts, and a white sport (or other) brassiere. All the anatomical landmarks were palpated and identified with a small non-toxic marker. The twenty seven anthropometric landmarks identified were the following: Apex of Head, Glabella, Eye (left corner), Spinous process of the 7th cervical vertebrae (C7), Below bulge of thyroid cartilage, Right Acromion, Left Acromion, Right Front Scye Crease (no marking), Left Front Scye Crease (no marking), Maximum Circumference Upper Arm, Right Olecranon, Left Olecranon, Right Ulnar Styloid, Left Ulnar Styloid, Midpoint of Nipple Line, Omphalion, Right Iliocristale, Left Iliocristale, Right Greater Trochanter, Left Greater Trochanter, Right Gluteal Fold, Left Gluteal Fold, Crotch (no marking), Right Lateral Femoral Epicondyle, Left Lateral Femoral Epicondyle, Right Lateral Malleolus, Left Lateral Malleolus [5, 6, 7].
2.2.2Laser scanning acquisition
The participants then proceeded to the 3D laser scanner from Unique Solutions. Small (1 cm dia.) hyperreflective (3 M tape) spherical markers were applied over the previously identified landmarks, such that the centres of the markers were adjacent with the surface markings. Participants were then instructed to remain still and assume a posture “as if their height was undergoing measurement.” Furthermore, the participant was instructed to breathe normally, as it may have been difficult to hold their breath for the duration of the scan. The participant entered the scanner, stepped onto the scale, and assumed the posture. The participant then scanned an identifier barcode under a reader in the front of the scanner, and remained still while the scan was performed. This scan process was repeated three times for each participant and required approximately 30 seconds per scan. Once each scan was complete, the participant proceeded to the third station (manual measurement). The raw data from the laser scanner was processed after all the data acquisition was done.
2.2.3Manual measurement – circumferences, breadths, and lengths
After laser scanning, the participant proceeded to the manual measurement station that involved the measurement of circumferences, breadths, and lengths. Each measurement was collected three times and averaged. All limb measurements were taken on the participants’ left side. All measurements were defined using documented standards (see Table 1).
Table 1
Manual measurements collected
| Measurement type | Measurement | Method obtained | Standard used |
|---|---|---|---|
| Circumferences | Neck circumference (C7 landmark) | Direct measure | Chamberland et al. [5] |
| Chest circumference (midpoint of nipple line) | Direct measure | STANDARD & ISO, 2008 [7] | |
| Waist circumference (omphalion) | Direct measure | Chamberland et al. [5] | |
| Hip circumference (trochanterian landmarks) | Direct measure | Chan et al. [14] | |
| Lengths | Stature | Direct measure | Standard & ISO, 2008 [7] |
| Breadths | Chest breadth | Direct measure | Chamberland et al. [5] |
| Hip breadth | Direct measure | Chamberland et al. [5] | |
| Depths | Chest depth | Direct measure | Chamberland et al. [5] |
| Waist depth | Direct measure | Chamberland et al. [5] | |
| Other relevant data | Weight | Direct measure | Chamberland et al. [5] |
| Age | Participant reported |
| |
| Sex | Participant reported |
|
A stadiometer was used for vertical lengths, such as stature and C7 height. Participants were measured three times to the nearest millimeter. Length, breadth, and depth measures between landmarks were obtained using an anthropometer (Harpenden). All measurements were taken three times to the nearest millimeter.
All manual circumferences were taken at the landmark locations described in Table 1. A flexible cloth or metal measuring tape was used to collect circumference measurements to the nearest millimeter. Each circumference measurement was taken three times.
2.3Laser scanner post data collection processing
Following the data collection, each laser scan was converted to a point cloud of three-dimensional data points (Unique Solutions, Inc.). Custom software was developed to identify landmarks and begin the measurement process. The custom software identified the distal and proximal landmarks of the length measurements in Table 1 and measured the distances between them. In cases where the ground was the terminal point of the measurement, the lowest data point on the foot was determined to be the end-point. Furthermore, to create the circumferences, the software used the landmarks described in Table 1 to create planes segmenting the body into individual segments.
The custom analysis software extracted measurements based on ISO and research standards such that the scanner could be validated based on compatible comparisons. Briefly, the custom software processed the point cloud data, identified anthropometric landmarks, and performed linear as well as circumferential measurements. Furthermore, a graphical user interface (GUI) was developed to allow non-technical users to interact with point cloud data.
The GUI dashboard was the main workspace for user interaction with point cloud data. It displayed the three-dimensional point cloud and allowed users to select a series of anthropometric landmarks from the plot, from which measurements were extracted. Once the user loaded the point cloud file, they then visually identified the 1-cm diameter landmark markers and clicked them in a pre-determined order. The index locations of the three-dimensional coordinates selected were automatically stored. Once the user had selected all 43 landmarks, the user inspected each of the major segments in the segment viewer each point cloud segment was saved in a separate file for measurement, if necessary. For all segments measured, the vertical (superior-inferior) axis was the Y-axis, the anterior-posterior axis was the Z-axis, and the medial-lateral axis was the X-axis. Because arm segments were abducted in the standard posture, an algorithm in the custom software calculated the abduction angle, and rotated the local long axes of these segments to be aligned with the global Y axis, orienting the arm segments vertically.
To calculate linear measurements, Euclidian distances were calculated between three-dimensional coordinates of appropriate three-dimensional landmarks. Circumferences were determined as the maximum distance around the segment. Each major segment was viewed as 1-cm transverse slices of body segments taken along each long axis and each slice was “flattened” into a two-dimensional cross-section. An algorithm identified the vector connecting the maximally displaced data points as the major axis of the slice, and rotated the slice data to align the line joining the points with the horizontal axis. The cross-section was divided horizontally into two independent sets of data which were curve fitted using an 8
(1)
The lower and upper limits of integration in the case above were defined to be the origin of the X-Z plane, and the X-axis value farthest from the origin, respectively. In the cases where the upper and lower regions were discontinuous at the end of the curves away from the origin, a straight-line fit was calculated between the distal points, and the length was added to the total circumference. Finally, using the index positions of the identified landmark markers, the anthropometrically relevant circumferences were extracted.
2.4Statistical analyses
The data (linear and circumferential) collected using manual measurement methods and extracted using three-dimensional imaging was compared statistically to confirm agreement between the two measurement methodologies. All data from the manual and scanner was tested for normality using the Shapiro-Wilkes test using a critical value equal to 1 (
2.4.1Concurrent validity
Concurrent validity for each measurement between the two methods was tested using Pearson Product Moment Correlation Coefficient (PPMC) and paired t-test. The linearity of the relationship was tested with the correlation whereas the systematic error between the two measurement strategies was tested through the paired t-test.
A Bland-Altman Agreement test was also used to determine the limits of agreement of the two strategies within a 95% confidence interval. The difference between the measurements taken from 3D scans and manual techniques were plotted against the manual values. Ideally, these differences should be randomly distributed; however, if a systematic error was found, it was accounted for, and the data adjusted accordingly. This test also determined if the 95% confidence interval of linear measurements are within the maximum allowable error as discussed in ANSUR [1], and maximum allowable errors outlined in ISO 20685 [8].
2.4.2Regression
Finally, due to the presence of systematic errors in many of the scan-extracted measurements when compared to manual methodologies, regression analysis was used to improve the prediction of the laser scanner for acquiring anthropometric measurements. In some cases, standard healthcare-related measurements of manual stature and manual mass were used as predictors in the regressions of scan-extracted measurements, if they were significant coefficients in a backwards stepwise linear regression (
Coefficients of determination (R
The residuals of these regressions were then correlated to the manual measurements to determine if there was a significant linear error. The 95th percentile confidence intervals of residuals of the regressed measurements were then substituted for differences when comparing to ISO standards for human anthropometry for allowable confidence intervals of difference values. Finally, a single sample t-test was then used to determine if the mean value was significantly different from zero.
3.Results
Twenty participants (11 males, 9 females) with a stratification based on their BMI (
For each linear anthropometric measurement, a scatterplot was prepared for visual inspection prior to any statistical analysis. Following visual inspection, the PPMC of the manual versus scan data was calculated. Table 2 contains the PPMC and their related p-values for each of the measurement. All the nine manual and scan-extracted measurements were significantly correlated. Furthermore, all nine anthropometric measurements did have a significant difference between the manual and scan-extracted values (Table 2, P-value t-test). Differences between manual and scanned measurements were calculated (the difference being defined as manual minus scan values; Table 2) and plotted against manual measurements in Bland-Altman Plots. To determine if linear systematic trends between the differences and manual measurement data existed, a PPMC coefficient was calculated for each of the nine Bland-Altman plots. A significant positive correlation meant an increasing (or decreasing, with a negative correlation coefficient) amount of difference with an increasing magnitude of measurement. Table 2 (B-A PPMC) summarizes these PPMC coefficients and respective P-values. The only moderately significant correlation was the one between error values and neck circumference magnitude (
Table 2
Manual, 3D Laser scanner, and regression adjusted measurements comparison
| Measurement | Manual | Scan | PPMC | P-value | B-A | B-A | Difference | Difference | ANSUR | Adjusted |
|---|---|---|---|---|---|---|---|---|---|---|
| (cm) | (SD) | (SD) | (P-value) | T-Test | PPMC | 95% CI | 95% CI | 95% CI | ISO | scan |
| (P-value) | Before Reg | After Reg | Standard | (SD) | ||||||
| Stature | 172.4 | 170.2 | 0.929 | 0.013 | 0.492 | ( | (0.6, | ( | ( | 172.4 |
| (9.3) | (8.2) | (0.000) | (0.027) | 9.9) | 3.9) | 1.3) | 0.4) | (8.8) | ||
| Chest breadth | 34.0 | 35.3 | 0.938 | 0.002 | 0.342 | ( | ( | ( | ( | 34.0 |
| (4.7) | (4.4) | (0.000) | (0.14) | 3.1) | 0.5) | 0.4) | (4.5) | |||
| Hip breadth | 35.3 | 36.9 | 0.986 | 0.000 | ( | ( | ( | ( | 35.2 | |
| (4.4) | (36.9) | (0.000) | (0.589) | 0.3) | 0.4) | (4.4) | ||||
| Chest depth | 21.5 | 22.6 | 0.935 | 0.000 | 0.196 | ( | ( | (- | ( | 21.4 |
| (4.5) | (4.5) | (0.000) | (0.407) | 2.1) | 0.6) | 0.5) | (4.3) | |||
| Waist depth | 21.7 | 23.3 | 0.995 | 0.000 | ( | ( | ( | ( | 21.7 | |
| (6.0) | (23.3) | (0.000) | (0.006) | 0.1) | 0.3) | 0.5) | (6.0) | |||
| Neck circumference | 36.2 | 53.6 | 0.825 | 0.001 | ( | ( | ( | ( | 36.3 | |
| (5.6) | (23.0) | (0.000) | (0.000) | 19.2) | 1.1) | 0.4) | (5.1) | |||
| Chest circumference | 96.8 | 100.2 | 0.983 | 0.000 | ( | ( | ( | ( | 96.9 | |
| (17.4) | (18.6) | (0.000) | (0.262) | 3.6) | 1.1) | 0.9) | (17.2) | |||
| Waist circumference | 91.5 | 92.6 | 0.996 | 0.023 | ( | ( | ( | ( | 91.5 | |
| (18.9) | (19.7) | (0.000) | (0.088) | 2.6) | 0.7) | 0.9) | (18.8) | |||
| Hip circumference | 99.1 | 101.4 | 0.985 | 0.001 | 0.113 | ( | ( | ( | ( | 99.2 |
| (14.0) | (14.0) | (0.000) | (0.635) | 2.5) | 1.0) | 0.9) | (13.9) |
To maximize the amount of variation captured by the regression, identify sources of systematic error, and possibly improve on the quality of the regressive relationships, standard manual measurements of height and mass were included as predictive variables. A stepwise linear regression with backwards elimination of non-significant factors was computed for each linear measurement. The mean of the adjusted scan values is presented in Table 2 (Adjusted Scan) whereas a summary table of the multi-term regressions, the p-values for the regression coefficients and the R
Table 3
3D Laser scanner measurements regression analysis adjustments coefficients
| Regression Method (Scan Measurement, Height, Mass) | |||||
|---|---|---|---|---|---|
| Measurement | Scan P-Value | Mass P-Value | Stature P-Value | Constant P-Value | Regression R |
| Stature (cm) | 0.837 (0.000) | 0.0982 (0.006) |
| 22.5 (0.215) | 90.1 |
| Chest breadth (cm) | 0.514 (0.004) | 0.0834 (0.003) |
| 9.42 (0.027) | 93.0 |
| Hip breadth (cm) | 1.07 (0.000) | 0.0595 (0.048) | | 97.9 | |
| Chest depth (cm) | 0.831 (0.000) |
| 0.102 (0.027) | | 90.7 |
| Waist depth (cm) | 0.914 (0.000) |
|
| 0.461 (0.401) | 98.9 |
| Neck circumference (cm) | 0.0903 (0.046) | 0.115 (0.003) |
| 22.6 (0.000) | 81.0 |
| Chest circumference (cm) | 0.552 (0.000) | 0.249 (0.002) |
| 22.4 (0.001) | 98.1 |
| Waist circumference (cm) | 0.955 (0.000) |
|
| 3.1 (0.114) | 99.2 |
| Hip circumference (cm) | 0.935 (0.000) |
| 0.141 (0.061) | | 97.0 |
Figure 1.
Analysis of the effect of the regression equations on the neck circumference measurements. The Bland-Altman analysis for the measured and scanned measurements is presented using open circles and dotted line (linear regression and 95% CI). The Bland-Altman analysis for the measured and adjusted scanned mesurements is presented using closed circles and full line (linear regression and 95% CI).
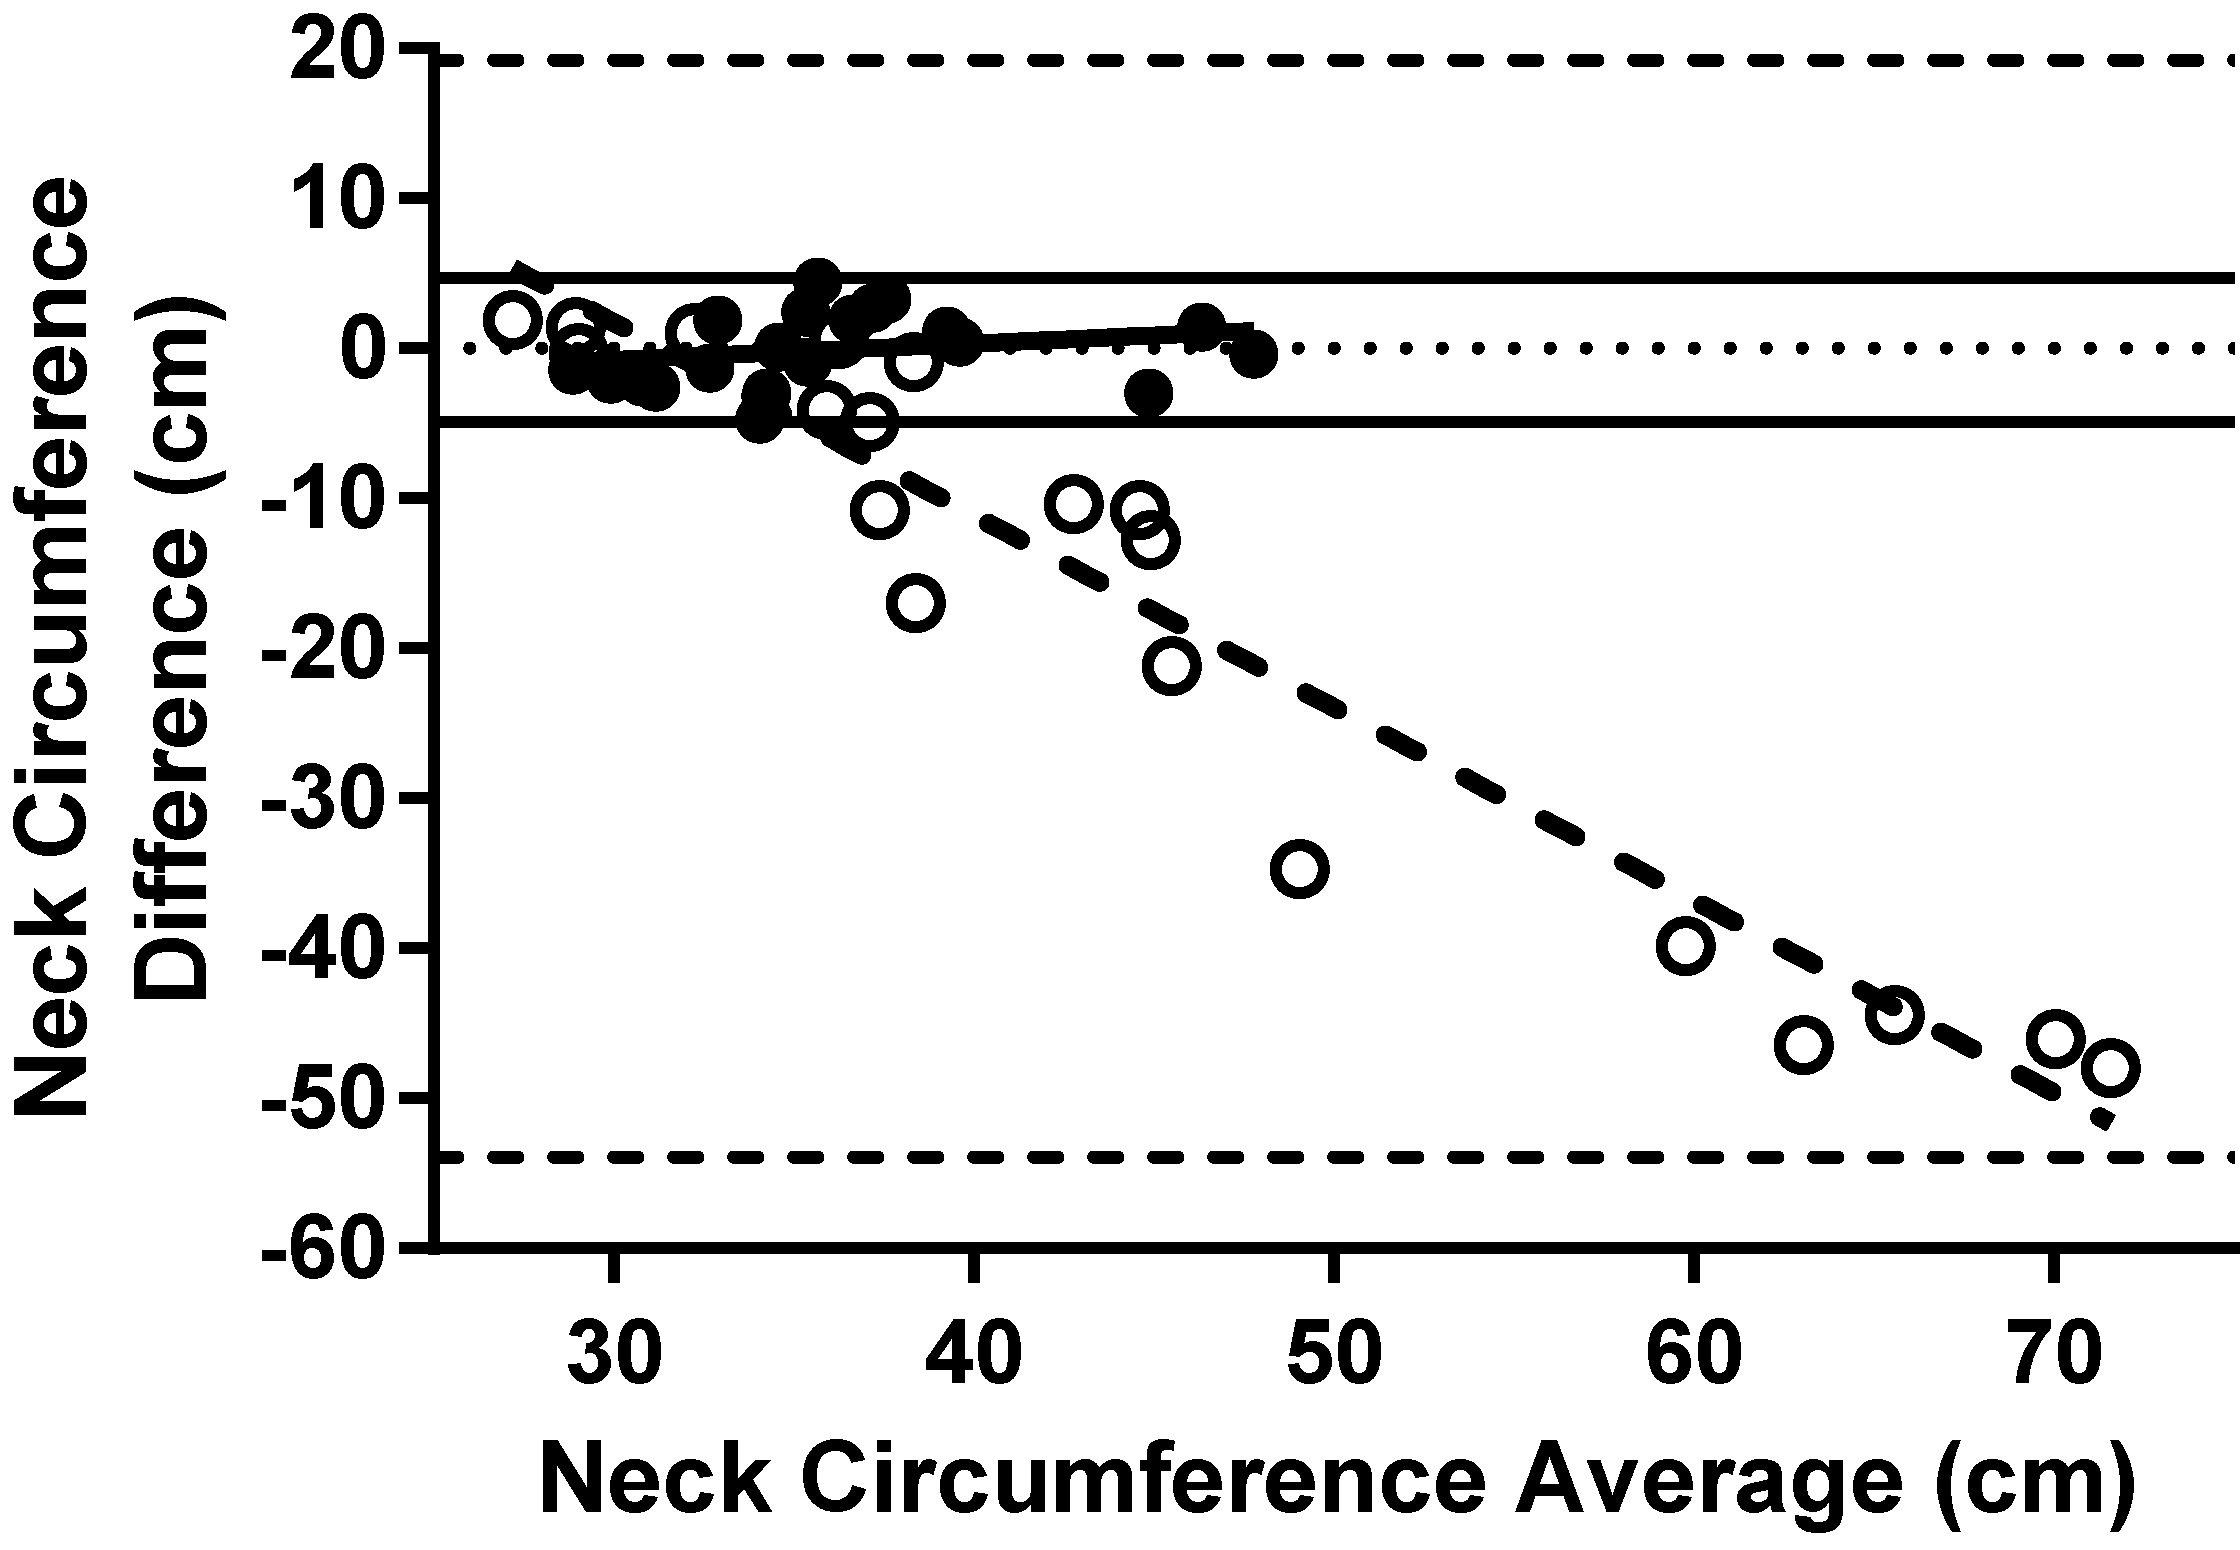
A PPMC coefficient of the residuals of each regression tested for linear trends not accounted for by the regressions is displayed in Table 3 (Regression column). Additionally, single sample T-tests were performed on regression residuals, testing for a significant difference between manual and regressed scan-extracted values with every p-value calculated being greater than 0.999, indicating no significance between manual and regressed scan-extracted measurements. The correlations between residuals of regressions and manual measurements were not significant (
The means and standard error values of the residuals of the multi-factor regressions were used to calculate 95th percentile confidence intervals about the mean of the residuals, and are summarized in Table 2 (Difference 95% CI Before and After Regression columns). Unlike the Bland-Altman confidence intervals, which employed standard deviation, the ANSUR/ ISO confidence intervals utilized standard error. It is quickly apparent that there is substantial overall improvement in the quality measurement following the use of the regression equations. There were 3 of 9 linear measurements (Hip Breadth, Waist Depth, Waist Circumference) that met the ISO requirement for acceptable error. Yet another 4 of the 9 linear measurements (Chest Breadth, Chest Depth, Chest Circumference, Hip Circumference) were close to meeting the standard (defined here as falling within two times the acceptable limit). The remaining two (Stature, Neck Circumference) grossly exceeded the ANSUR/ ISO standard.
4.Discussion
The primary goal of this study was to validate the use of a low-cost laser scanner system (Unique Solutions, Inc.) to provide scan-extracted anthropometric measurements. The validity of the measures is greatly influenced by the quality of scanned images, software developed for the measures and the experimental methods employed for the study. This study is novel in terms of the method of acquiring anthropometric measurements from 3D scans, a novel method of validating the measurements, and presents a quantification of errors associated with the scan of human participants, which to this point has be notably absent from the literature.
4.1Image quality improvement
Observation of the scans yielded a source of error related to limitations of field of view. A hard-coded algorithm in the scanner software was designed to exclude data points at the limit of the scan volume to ensure that data points representing the walls of the scanner are not included in the participant’s scan file. Often this resulted in the truncation of hand segment data points. Furthermore, due to the placement of the scan heads, a resulting reduction of field of view was observed at the upper and lower regions of the scan volume along the vertical Y-axis. Despite some mechanical alterations to the scanner hardware, the field of view was only increased a small amount. This resulted in the removal of data points in the region of some participants’ heads and feet. While this was a known limitation of the scans after analysis, the truncated segments were included in the regressions because this evaluation serves as the measure of the performance of the scanner as it currently exists. Furthermore, without improving the quality of the scans, exclusion criteria can be designed that will prevent users over a certain height to be measured in the scanner (
Aside from mechanical improvements used to increase the scanner’s field of view, several sources of error in the acquisition of scan images were also identified. Radial distortion was most notable at the periphery of the scan volume. While this was not directly corrected by improving the quality of the scan itself, the regression of scanned measurements substantially improved the quality of the measurements at the periphery. Based on the early work using a phantom [9], it was clear that radial distortion was a problem in the images. This is an example of an error that is camera specific that should be corrected early within the measurement process. A systematic regression was employed to compensate for the distortion across participants, and the results were validated [9]. The scanner limitations were most notably experienced at the periphery of the scan volume. There is in fact little mention in the literature of these errors or their effect if any on the scan quality of prior studies [10]. Thus, it is not known if the error was not present in their measures or what of any processes were used to minimize their effects.
4.2Comparison of scan-extracted and manual measurements
Several research groups have employed 3D laser imaging in the collection of segment and total body volumes, and have published their work; however, notably absent from the literature is a validation of these measurements beyond mannequin measurements, and large segment volumes; in 2006, Wang published results of repeated measures on a single mannequin [10]. However, until this point, no comprehensive study has been performed that compares segment volumes acquired through manual methodologies to those computationally extracted from 3D scans on a sample of human participants, or even on a variety of body shapes. This validation is essential to determine the reliability of 3D laser scanning apparatus, as its eventual application is a clinical environment.
4.3Other sources of scan-extracted and manual testing errors
The primary error sources in the process can be separated into five major types. Image quality and radial distortion, field-of-view (FOV) limitations and manual volumetry issues have been discussed previously. In addition to those sources of errors there are motion artifacts (sway, breathing), and post-scan digitization.
4.3.1Motion artifacts
Once the door of the scanner is closed, there can be no visual interaction between the technician and the participant. As a result, any position, or motion-related errors by the participant within the scanner would result in increased error in the resulting measurements and cannot be easily detected. Motion can be caused by the postural sway of the participant, or by breathing artifacts [11]. Furthermore, it was observed in early pilot work that participants under scanning measurement assume postures such as slouching during a scan, which was not observed during manual measurement of stature. These errors occurred during the scan process, and there is no way for retrospective analysis to be performed. These errors will be assumed to contribute both a constant and a random error inherent to the scan process and will affect comparisons with the annual measures.
4.3.2Landmark detection
Unlike some work in the literature, which employed automatic, or semi-automatic, landmark detection during three-dimensional laser scanning [12], in this study anthropometric landmarks were digitized manually using custom software. In some cases, the identification of anthropometric landmarks posed difficulty due to participants’ anatomical features, or sparse distribution of data points. This was especially true in the identification of scye creases and crotch landmarks.
The averaging of measurements from multiple digitisations and some post-processing exclusion of outliers improved the quality of the measurements; however, the magnitude of the user error has not yet been quantified, and will be assumed to contribute to the random error associated with measurement. This has been an artifact of manual landmark detection in the literature [11].
4.4Stepwise analysis of statistical validation process
From the correlation relationships between measurement methods, it was apparent that one-dimensi-onal scan-extracted measurements are highly correlated to manual measurements.
Bland-Altman analysis allows for analysis of trends in errors between measurement modalities, and to determine the limits of agreement between measurement modalities. When the differences were calculated between manual and scan extracted measurements, and confidence intervals were calculated (95% CI), the confidence intervals far exceeded the allowable range as presented in the ISO. Due to an inability to improve scan quality through improved intrinsic and extrinsic calibration techniques (software licensing issues with the partner company), regression was used as a means of using scan-extracted measurements to predict the true measurements.
In addition to the ISO, ANSUR has provided a secondary standard for allowable error in human anthropometry – called “Maximum Allowable Error” (MAE) between repeated linear manual measurements. Its application was originally applied to the repeated measurements of manual anthropometry: a measure of precision, not a validation across measurement methodologies, and was extended for use in the evaluation of the two scanners employed during the CAESAR studies [1]. However, because this work comprises a validation of a technology that compares two measurement methodologies, not simply the precision of a single apparatus, this error standard is insufficient.
In addition to calculating confidence intervals, the Bland-Altman plots were used to determine trends between the magnitude of the error and the magnitude of true measurements. The strongest correlation can be seen in the neck circumference measurements (
A novel method of regression analysis was applied to the scan-extracted measurements, to improve the quality of predicted measurements. In place of difference calculations in the ISO documentation, the 95
The regressions measurements included the manual measurements of mass and stature (frequently collected clinically) as predictive factors in the regressions, to test for a systematic effect caused by the size of the participant.
The resulting linear models incorporated the new variables almost exclusively additively to the regression equations, implying an under-prediction in the absence of the compensatory variables: as the mass and stature of the participants increased, the correction factors increased the compensatory effects in the regression by linearly increasing the magnitude of the predicted measurement (besides hip breadth, where mass was inversely proportional). The correlations between residuals and manual measurements were non-significant after manual stature and mass were included in the regressions. The implication of this is that one-dimensional metrics of patient size easily captured clinically, can substantially improve the quality of scans.
Several limitations with these regressions should be noted. Firstly, the manual measurements of stature and mass are significantly and moderately correlated (
4.5Limits of agreement
In the initial work, Bland-Altman confidence intervals were compared the ANSUR standards to determine whether a linear scan-extracted measurement was valid; however, ANSUR maximum allowable error (MAE) values only apply to repeated manual measurements and the objective of this research is to compare across measurement methodologies. The ISO standard of comparison quantifies measurement validity, which is a combination of measurement accuracy and precision.
Whereas the Bland-Altman formula (applied to ANSUR standards) for determining limits of agreement utilized standard deviation, the ISO standard utilized standard error to develop the limits of agreement between measurement methodologies. Both ANSUR and ISO methods were used to compare the limits of agreement of linear measurements to absolute thresholds of allowable error. The clinical threshold for allowable error developed for this study was 5.3%, against which confidence intervals were converted to relative errors for comparison. An examination of the results shows that most of the measurements were close to, or met, the criterion standards for each measurement. Again, unsurprising was the result that both stature and neck circumference grossly exceeded the ISO standard for linear measurement. One proposed source of neck circumference variability discussed prior is the inclusion of landmark markers in the circumference calculation. Again, discussed prior was the effect in several taller participants where stature was underpredicted due to the truncation of the point cloud near the apex of the head.
While prior discussion has shown that breathing has little impact on the error in torso volumes, one study has shown that tidal breathing artifacts can affect circumference measurements by as much as 2.0 cm, greater than the ISO standard for allowable variation in chest circumference [13]. This may explain the error in the linear measurements in chest depth, chest circumference and chest breadth.
5.Conclusion
While the original intent of this research was the validation of a closed-platform technology, the customization of some hardware and ground-up development of novel software utilizing innovative measurement techniques, yields this apparatus a custom device better-suited to laser anthropometry.
Because the technology selection phase of scanner investigation demonstrated that on-board software neither captured standardized ISO or clinical measurements, nor did it capture segment volumes. As a result, custom software was developed that required testing on human participants.
The results of this study have shown promise for the future of the use of this device for the acquisition of anthropometric measurements. When compared to ISO and clinical standards, most of the measurements collected were within, or close to, these standards. The implication of these results is that the implementation of a small number of minor improvements may very quickly allow the scanner to collect measurements on a clinical population.
Several drawbacks exist with the scanner that will require further investigation before clinical application. Stature is used in the computation of the most commonly used measure of obesity: BMI. As such, it is important that any measurement methodology can accurately acquire this measurement. Due to a threshold “cut-off” because of the scanner’s field of view, participants taller than approximately 1.8 m are unable to be scanned.
5.1Improvements to the scan process
The main goal of this study was the validation of a commercial three-dimensional laser scanner. The intended use of the scanner for clinical applications, the custom nature of the software developed for this project, and the novel application of the Unique Solutions, Inc scanner lead to many improvements for the future application of the three-dimensional laser scanner.
Firstly, algorithms related to image acquisition should be modified to accommodate improved intrinsic lens parameters, to correct radial lens distortion. This will impact all measurements; however, those at the most distal locations – such as the hands and feet – would likely experience the greatest increase in measurement quality. While improved intrinsic parameters may result in somewhat improved distortion, the replacement of the cameras on the scanners may further improve the quality of scan-extracted measurements. In the measurement of smaller circumferences, such as the neck circumference, it would likely be beneficial to improve upon the design of landmark markers such that they do not interfere with the measurement of circumferential measurements. Slight improvements to the field of view of upper scan heads may further improve the total field of view, and improve stature, and other head and neck measurements. Experimentation in the algorithm used to model circumference measurements, such as optimizing the order of polynomial, or incorporating spline fits into the circumference fits to scan data, may increase the quality of scan-extracted circumferential measurements.
5.2Improvements to methodology
Retrospective consideration of the second purpose of this study, the validation of a process by which laser scanners can be validated, has given rise to several concerns that may require improvement in the future.
Statistical methodologies have been shown to improve the predictive ability of three-dimensional laser imaging for measurements related to obesity. There remain some proprietary hardware and software issues related to the scan process that have been identified and will likely require resolution before the scanner can be used for all measurements. With the limitations identified, the scanner is unlikely to become useful for hand and foot measurements in the near future; however, with minor modifications, clinically relevant measurements taken in the arm, torso and thigh regions will be the most useful measurements extracted by this scan system.
Acknowledgments
This work was supported by a grant from PRAC-enCANA.
Conflict of interest
The authors have no conflict of interest to report.
References
[1] | Robinette KM, Daanen HA. Precision of the CAESAR scan-extracted measurements. Appl Ergon (2006) May; 37: (3): 259-265. |
[2] | Gordon CC, Bradtmiller B, Clausen CE, Churchill T, McConville JT, Tebbetts I, et al. 1987–1988 Anthropometric survey of US Army personnel. Methods & Summary Statistics. (1989) Natick/TR-89-044. |
[3] | Jones MLH, Lamb M, Shih JMV, Sy LA, Keefe AA. Extraction of Encumbered Anthropometric Measures from Whole-Body Scan Data. Proceedings of the Human Factors and Ergonomics Society Annual Meeting (2014) October 27–31, 58: (1): 934-938. |
[4] | Hanavan EP. A mathematical model of the human body. (1964) ; AMRL-TR-64-102, AD-608-463. |
[5] | Chamberland A, Carrier R, Forest F, Hachez G. Anthropometric survey of the land forces. (1998) ; DCIEM-98-CR-15. |
[6] | The mass and inertia characteristics of the main segments of the human body. Biomechanics VIII-B; (1983) . |
[7] | STANDARDB., ISOB., ISO 7250-1: Basic human body measurements for technological design, 2008; ISO 7250-1. |
[8] | STANDARDB., ISOB., ISO 20685: 3-D scanning methodologies for internationally compatible anthropometric databases, 2010; ISO 20685. |
[9] | Preliminary Error Analysis in a Commercial Whole-Body Laser Scanner. Proceedings of the 36th Annual conference of the Canadian Medical and Biological Engineering Society (CMBES); May 21-24, (2013) . |
[10] | Wang J, Gallagher D, Thornton JC, Yu W, Horlick M, Pi-Sunyer FX. Validation of a 3-dimensional photonic scanner for the measurement of body volumes, dimensions, and percentage body fat. Am J Clin Nutr (2006) Apr; 83: (4): 809-816. |
[11] | Reducing movement artifacts in whole body scanning. Proceedings of the International Conference on Recent Advances In 3-D Digital Imaging and Modeling, (1997) . |
[12] | 3-D landmark detection and identification in the CAESAR project. Proceedings of the Third International Conference On 3-D Digital Imaging and Modeling, (2001) . |
[13] | Wade OL. Movements of the thoracic cage and diaphragm in respiration. J Physiol (1954) May 28; 124: (2): 193-212. |
[14] | Chan DC, Watts GF, Barrett PH, Burke V. Waist circumference, waist-to-hip ratio and body mass index as predictors of adipose tissue compartments in men. QJM (2003) Jun; 96: (6): 441-447. |


