
Assessment of thermal comfort in a Portuguese metalworking industry
Abstract
BACKGROUND:
Thermal discomfort is mentioned as one of the major causes of dissatisfaction in workplaces when people are exposed to extremely hot or cold thermal environments in the industrial context. Studies evaluating the comfort of the thermal environment are becoming increasingly important, but this kind of studies is time-consuming and it becomes expensive and difficult to implement for many organizations.
OBJECTIVE:
The purpose of this study was to evaluate thermal comfort in a metalworking industry located in Portugal, applying user-friendly thermal indexes supported by real data collected using inexpensive measuring tools.
METHODS:
To this end, this study was conducted using objective measurements of air temperature T (
RESULTS:
The results revealed a high risk of heat stress for some workstations, which required the intervention of the Health and Safety Department.
CONCLUSIONS:
The indexes applied in this work, namely the WMO diagram and the EsConTer index, offer a sound model for thermal stress risk evaluation, minimizing difficult and time-consuming investigations to identify thermal comfort problems in workplaces, each emphasizing particular aspects, in order to create value.
1.Introduction
Due to climate change, the average global temperature may increase by 1.4
According to Bluyssen et al. [1], there are several studies that demonstrate a strong relationship between comfort, health, environment control in indoor spaces and productivity in workplaces. One crucial human requirement is a working environment that allows people to perform their work optimally under comfortable conditions [2]. Moreover, citing Huizenga et al. [3], the major cause of dissatisfaction in workplaces is thermal discomfort.
Within the context of industrial and operational performance, the thermal comfort of workers has long been considered a key performance indicator, which is why this issue has been widely studied in the scientific area of occupational ergonomics. Research about the thermal environment belongs to the field of ergonomics and has been the target of diverse studies. Controlling thermal environment conditions inside a building allows higher levels of satisfaction and productivity to be achieved, while reducing the number of work accidents and worker fatigue [4].
There are different approaches to defining the concept of thermal comfort. The American Society of Heating, Refrigerating and Air-Conditioning Engineers (ASHRAE) define it as “the condition of the mind in which satisfaction is expressed with the thermal environment” [4]. Close to this definition is the one presented in the ISO standard 7730 [5] as “the satisfaction expressed when an person is subjected to a thermal environment”. This implies a certain degree of subjectivity, requiring not only the analysis of the physical aspects of the environment, but also the analysis of subjective aspects associated with the state of mind of the subject when inserted in a working environment.
On the other hand, thermal discomfort, also termed thermal stress, corresponds to a state of dissatisfaction on the part of a person in terms of their thermal sensation, when exposed to extremely hot or cold thermal environments [4, 6]. This thermal state may reduce productive capacity or cognitive and physical performance, increasing the likelihood of fatigue and injury to workers and of workplace accidents [7, 8].
According to Nematchoua et al. [9] “thermal comfort in a work environment is very important not only for good health, but also for other factors like productivity and motivation of an individual or occupant”. The same authors state that thermal comfort depends on a set of subjective parameters like the origin of the individual, age, sex, health condition and clothing. This thereby confirms that within an environment with the same characteristics and climate, the thermal sensation differs among individuals. Indeed, it can be noted that the satisfaction of all subjects within a thermal environment is an almost impossible task, since a thermally comfortable environment for one person may not be comfortable for another, i.e. thermal sensation can be different among people even in the same environment. About this issue, Djongyang et al. [10] says that comfort is not a physical state, but rather a state of mind.
According to Cox [11], a healthy environment can be found when the combined physical, chemical, and biological properties do not cause or aggravate any of workers’ diseases, ensuring high levels of comfort and contributing to the best performance in executing their functions or tasks.
Thus, thermal comfort plays an important role in building sustainability [12] and it is a key factor for a healthy and productive workplace [13].
In fact, the scientific literature shows that research on the thermal environment in workstations is necessary, as individuals spend most of their time at work. Thus, an understanding of the adaptation of individuals to the workstation and their reaction to different thermal environments is very important [14]. However, according to the methodology applied in most case-studies reported in the literature, it is difficult to understand the thermal patterns of an indoor space using cheap and easy measuring tools which also take into account the thermal sensation of its occupants [8]. In fact, the subjectivity associated with the concept of thermal sensation hinders an objective analysis of thermal comfort that allows the creation of indoor spaces which satisfy most of the population who occupy them [7, 15].
This paper describes a study that aimed to evaluate the thermal environment in a metalworking industry in order to enable the reorganization, change or deployment of new equipment, improving the comfort of the occupants. To this end, this study was conducted using objective measurements of air temperature T (
2.Research methodology
2.1Study location and brief characterization of jobs
This study aims to evaluate the thermal comfort of workers in a multinational industrial metalworking company located in centre of Portugal, with geographical coordinates of 40.68
The workplaces are characterized as follows:
• A – Manual welding booth. This compartment was installed in this section about two years ago, and has an adequate ventilation system;
• B – Place of exit of products from the furnace and where the quality inspection is made;
• C – Place of entry of products (into the furnace), with a protective mechanism before the entrance;
• D – Automatic welding booth. In this space there is a cooling system of products installed;
• E – Manual welding booth. This station receives the product coming from the workstation D, but it only works when it is necessary;
• F – Manual welding booth. This station has an old system and consequently it has an inappropriate ventilation system;
• G – Place of exit of products (from the furnace). The products from this station register a high temperature and are removed and placed in appropriate transport carriages;
• H – Manual welding booth. Like workstation F, this has an outdated and consequently inappropriate ventilation system. Additionally, it is located close to workstation B and near to the entrance door.
2.2Data collection and calculations
The thermal environment of the workplaces was determined using two different approaches: (i) objective evaluation of thermal comfort – physical measurements of air temperature T (
2.2.1Objective evaluation of thermal comfort: Physical measurements
To evaluate the objective aspects, the data about air temperature T (
To analyse the results, three methods were applied: the Effective Temperature Index (ETI), the EsConTer Index and, the diagram of the World Meteorological Organization (WMO).
The Effective Temperature Index (ETI) [16] is defined as the temperature of a saturated atmosphere which would produce the same effect as the atmosphere in the absence of radiation. It is usually applied to discover the inner and outer thermal sensation of a place, and resulted from an empirical study conducted in climatic chambers in which different individuals were asked about their well-being when exposed to different environmental conditions.
This index allows a correlation of the effects of air temperature T (
(1)
where
Regarding the EsConTer Index [8], its calculation formula is based on a colour scale (Es), using data related to the thermal comfort sensation of occupants (Con) and is classified as a thermal scale (Ter). The calculation equation of EsConTer index is given by:
(2)
where
The diagram of the World Meteorological Organization [17] adapted by Talaia and Rodrigues [18] was applied by considering the air temperature T (
2.2.2Subjective evaluation of thermal comfort: Questionnaire survey
According to Nematchoua et al. [9], thermal comfort depends not only on environmental factors but also on physical, physiological, and psychological aspects of the worker. In this sense, a questionnaire survey was conducted to evaluate the subjective aspects related to the thermal comfort of workstations based on the perception of their occupants. Sixteen employees that work in the section which was studied and considered hottest were surveyed. Their ages ranged from 23 to 56, with the mean value of the ages being 42.0 years. Fifty percent of the respondents are aged between 34 and 43 years, followed by 33% of human subjects from 44 to 56 years old.
The questionnaire was composed by 9 questions grouped into three parts which allowed it to: (i) characterize the sample, (ii) characterize the workplaces and working conditions, and (iii) evaluate the perception of workers regarding the thermal comfort they feel in their workplace. This third part in particular aims to question occupants about certain aspects in order to assess their perception about (i) the influence of the temperature, (ii) the sensation of comfort; and (iii) the satisfaction in the workplace during summer and winter. In this third part, the answers were measured on a 5-point Likert scale, where the number “1” corresponds to statements “not warm”, “not comfortable” and “not satisfied” and the number ‘5’ to the statements “very warm” “very comfortable” and “very satisfied”. The 5-point Likert scale was chosen because it is an appropriate scale to measure attitudes and perceptions and, additionally, it is considered as easy to understand by the public we wanted to study. It should be noted that the results obtained from the 5-point Likert scale were analysed and were consistent with the seventh ASHRAE scale [4].
The data were analysed based on a set of descriptive statistical techniques.
3.Results and discussions
3.1Results of objective evaluation of thermal comfort
Based on the three methods described in the methodology section – the Effective Temperature Index (ETI), the EsConTer Index and the WMO diagram, eight workplaces were objectively evaluated. A more detailed analysis made it possible to create two areas of intervention (see Fig. 1):
Figure 1.
Layout of workstation in section studied.
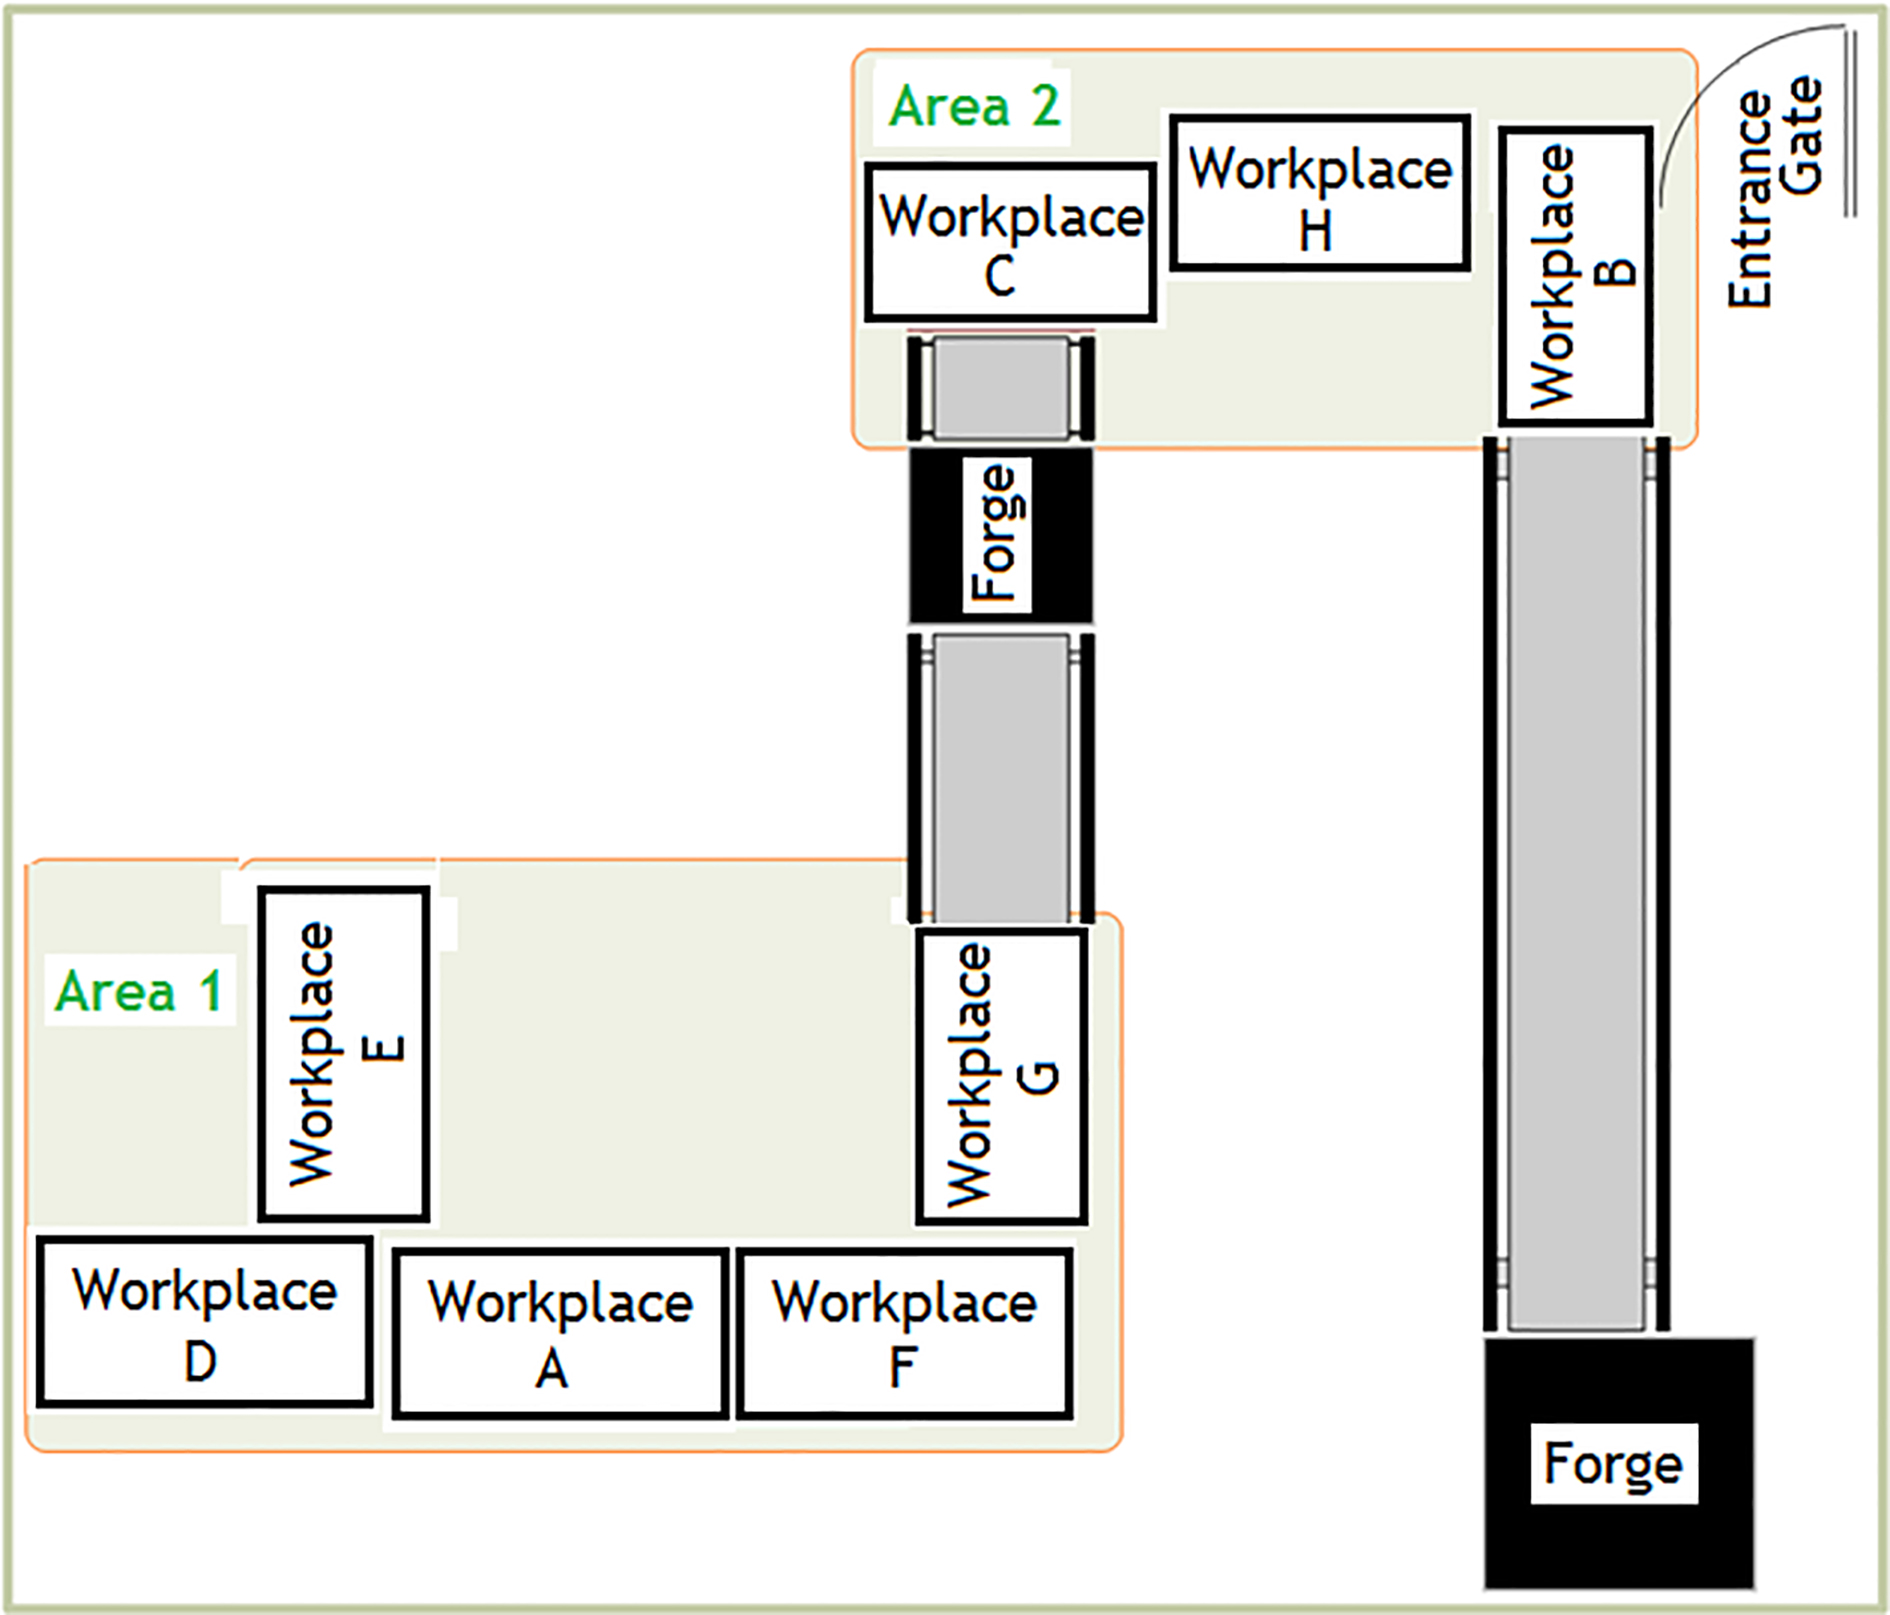
(i) Area 1, which includes the workplaces F, G, D, A and E;
(ii) Area 2, which includes the workplaces H, B and C.
The strategy adopted to group workplaces was based on the proximity and consequently the contiguous influence of each thermal environment created in each workplace.
Figure 2.
ETI index applied in Area 1.
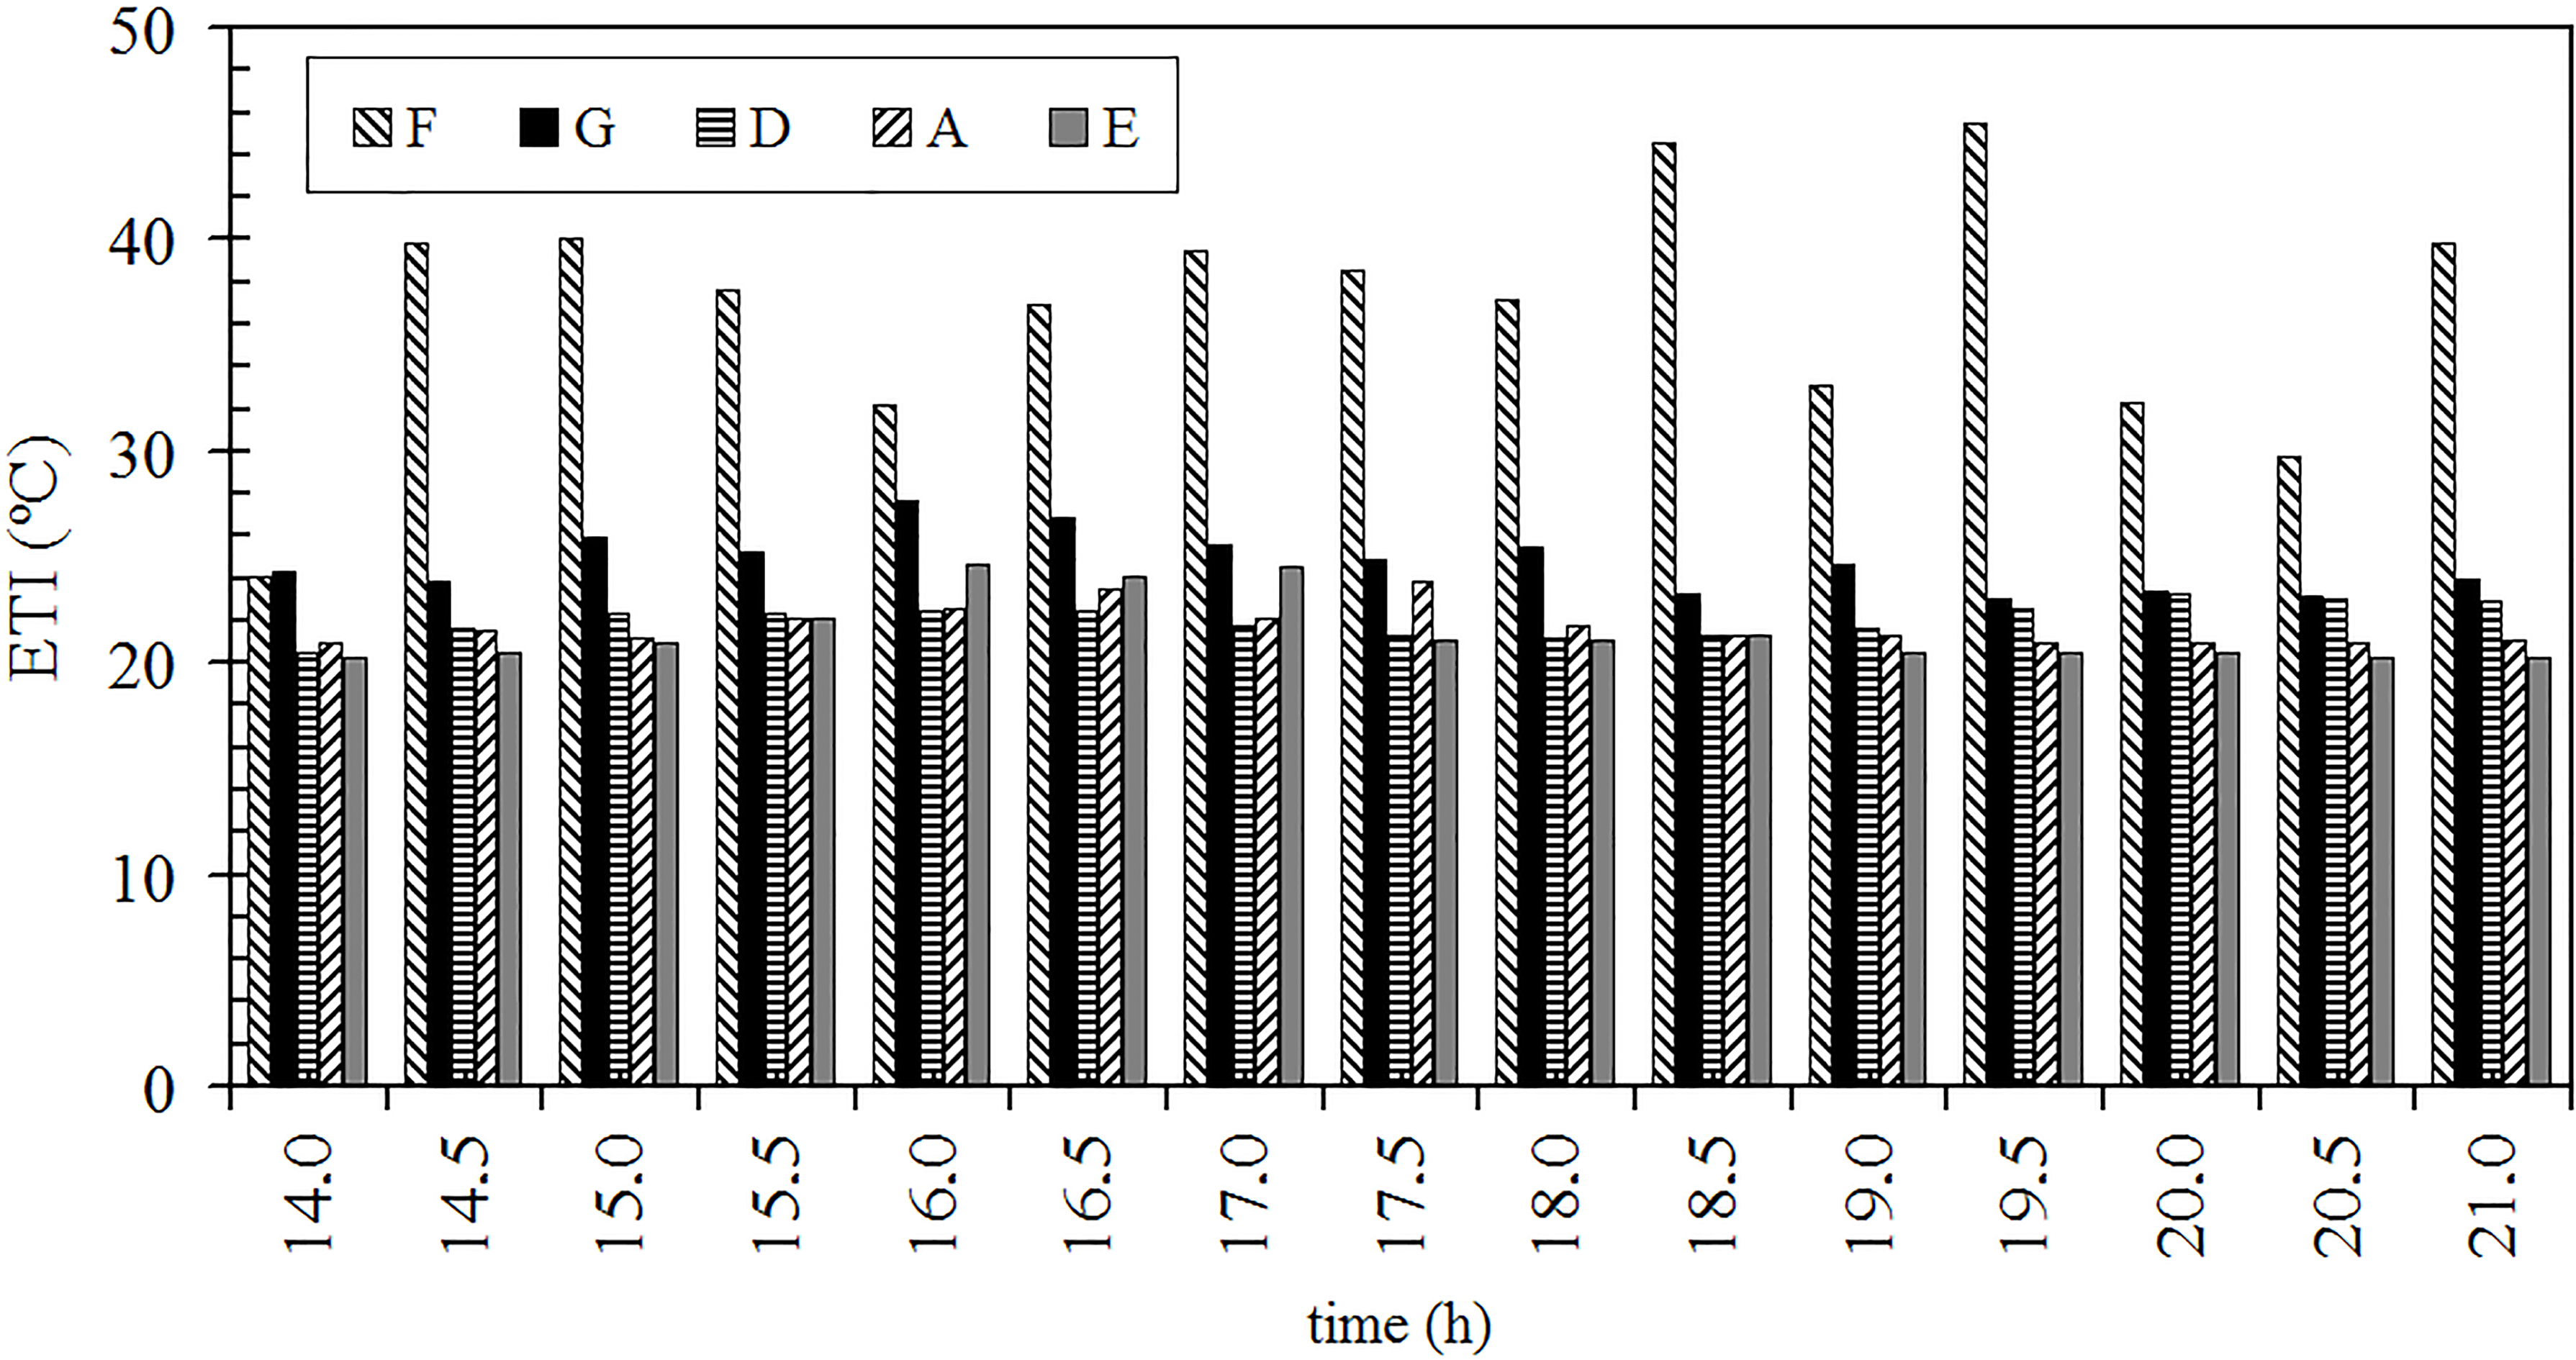
For the workstations located in area 1 (F, G, D, A and E), Fig. 2 shows the results obtained with the ETI over the time period. Unequivocally, workplace F presents very hot environment conditions that might raise heat stress. Workplace F has manual welding and an inadequate ventilation system. Concerning the remaining workplaces of area 1, these present very similar values, but can be classified as suitable.
Figure 3.
EsConTer index applied in Area 1.
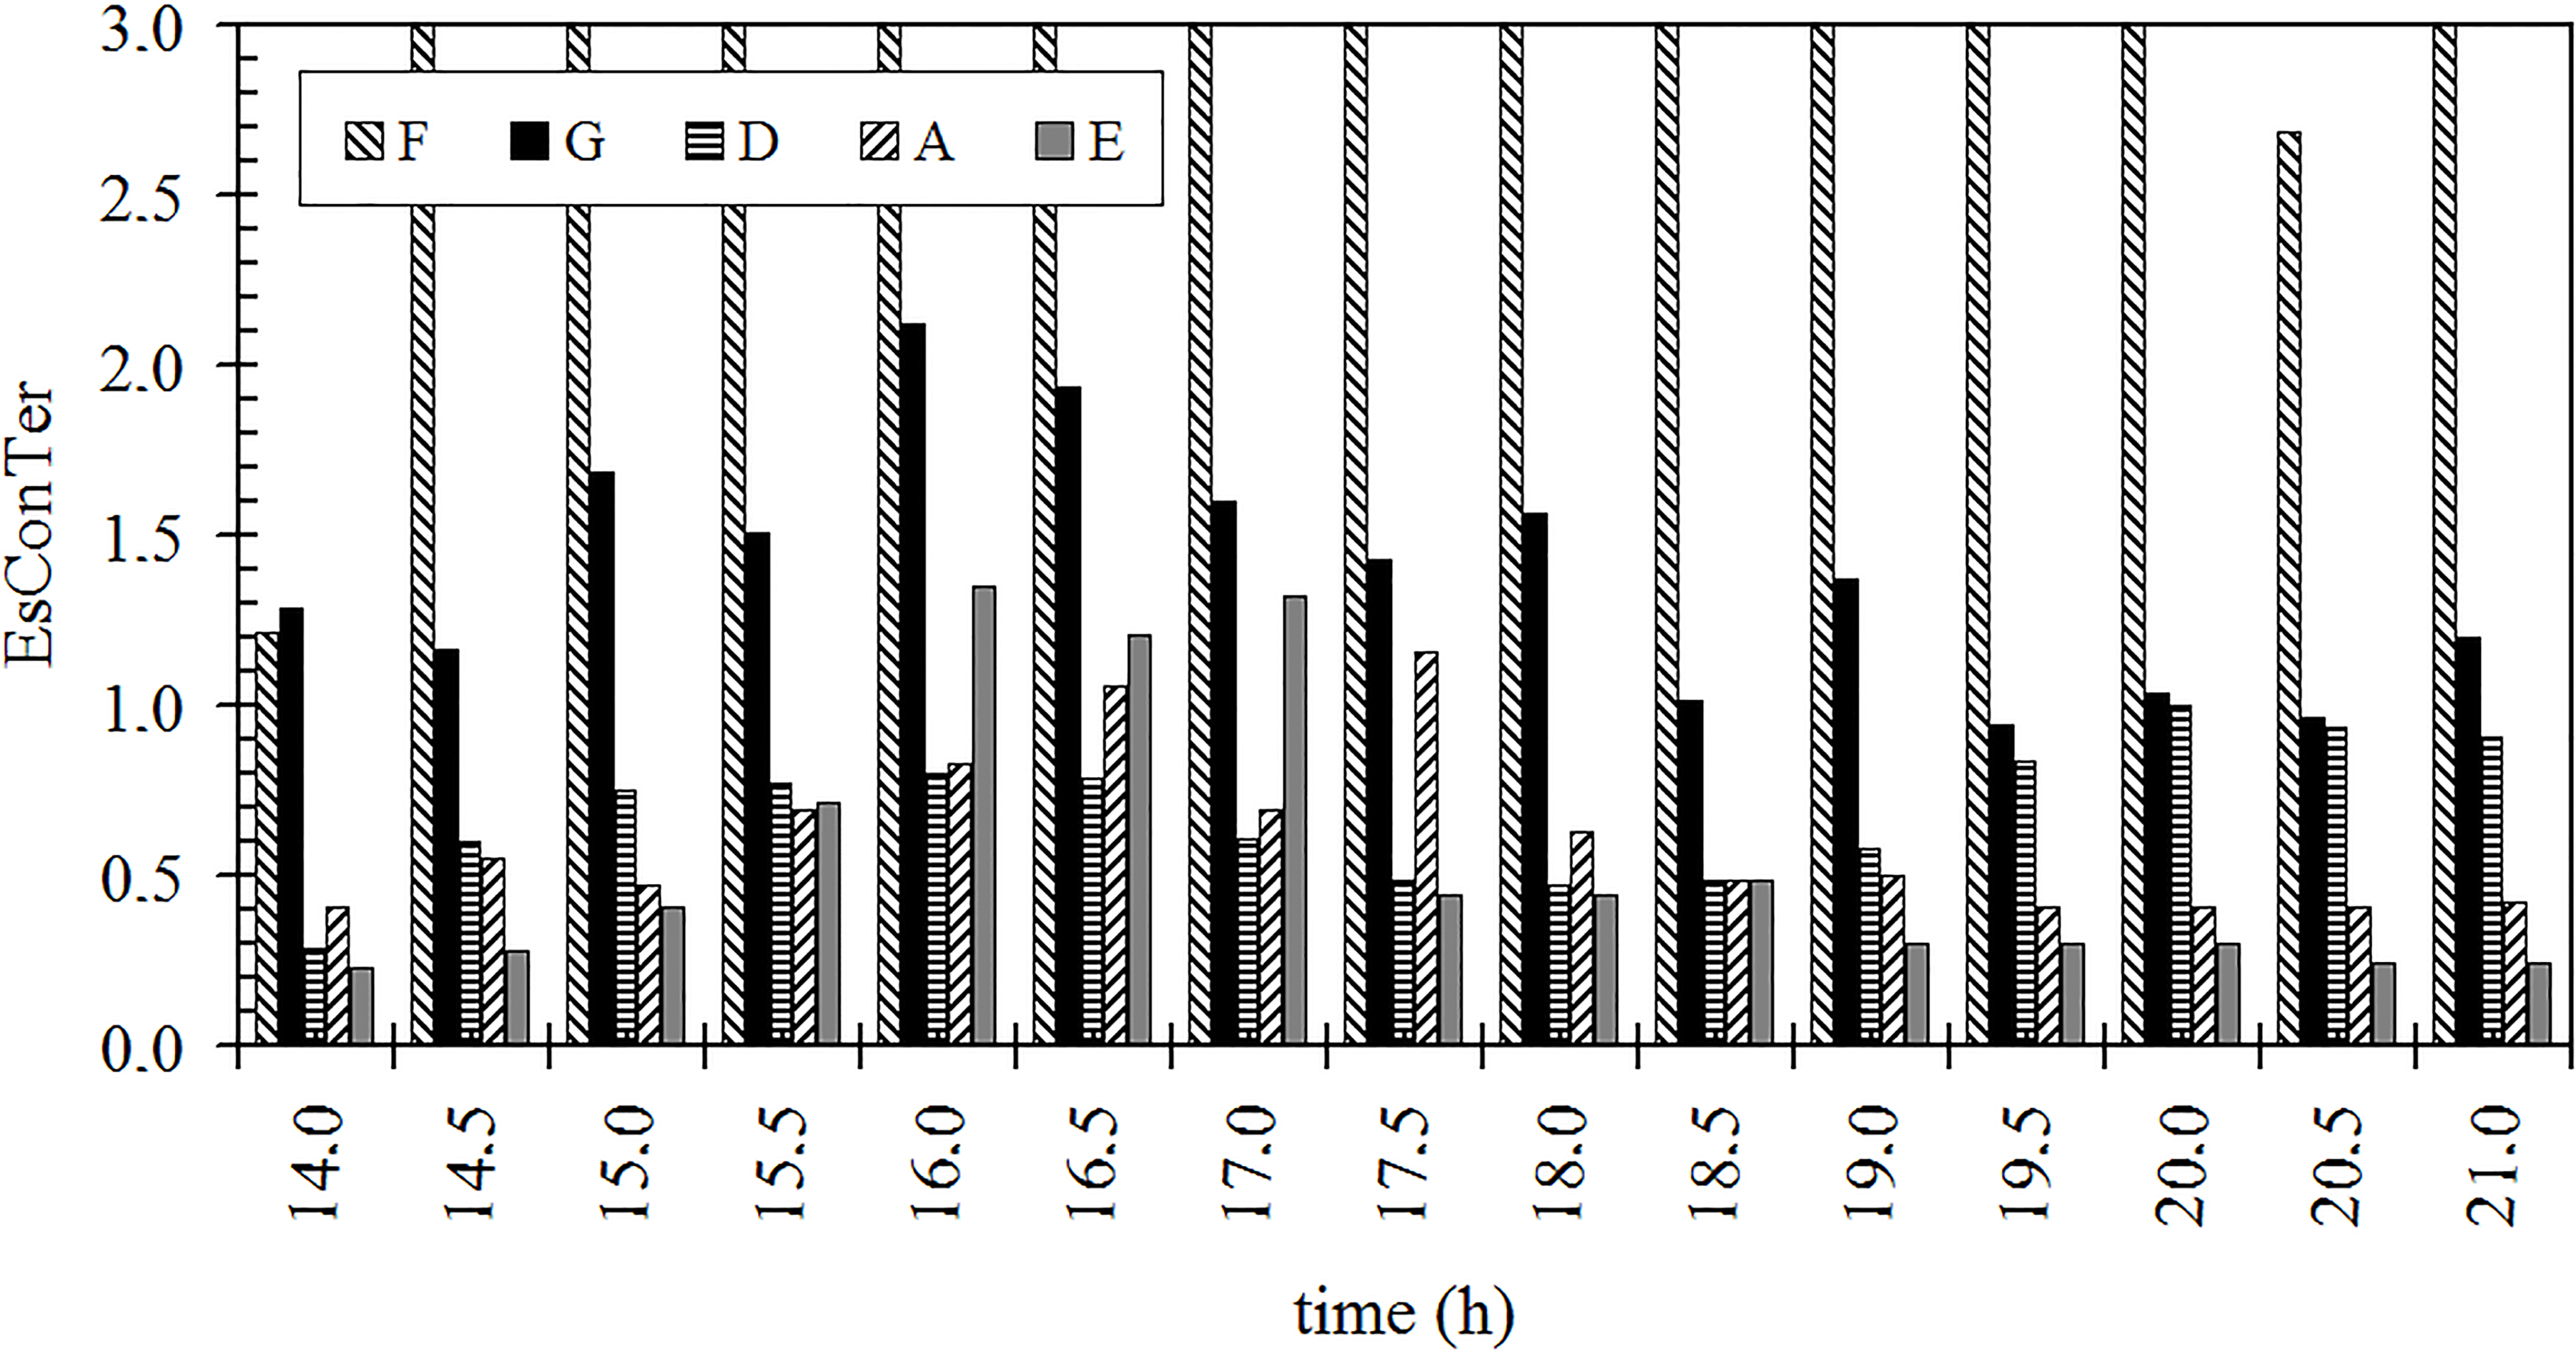
Figure 3 shows the results obtained with the EsConTer index, and the results corroborate the suggestions of ETI. However, the EsConTer index is sensitive to the diurnal solar cycle, which is the big advantage of this representation.
![WMO Diagram [17] adapted by [18] applied in Area 1.](https://content.iospress.com:443/media/oer/2017/13-S1/oer-13-S1-oer254/oer-13-oer254-g004.jpg)
Figure 4 illustrates the results obtained with the application of the WMO diagram and according to these observations, it is possble to clearly ascertain that the workplace F is experiencing an overheated environment, thus requiring ventilation. In a nutshell, Fig. 4 shows that there are cases where the workplace has comfortable thermal characteristics and others that are too hot and in need of ventilation (the case of the worktsation F).
Figure 5.
ETI index comparing workplaces A and F.
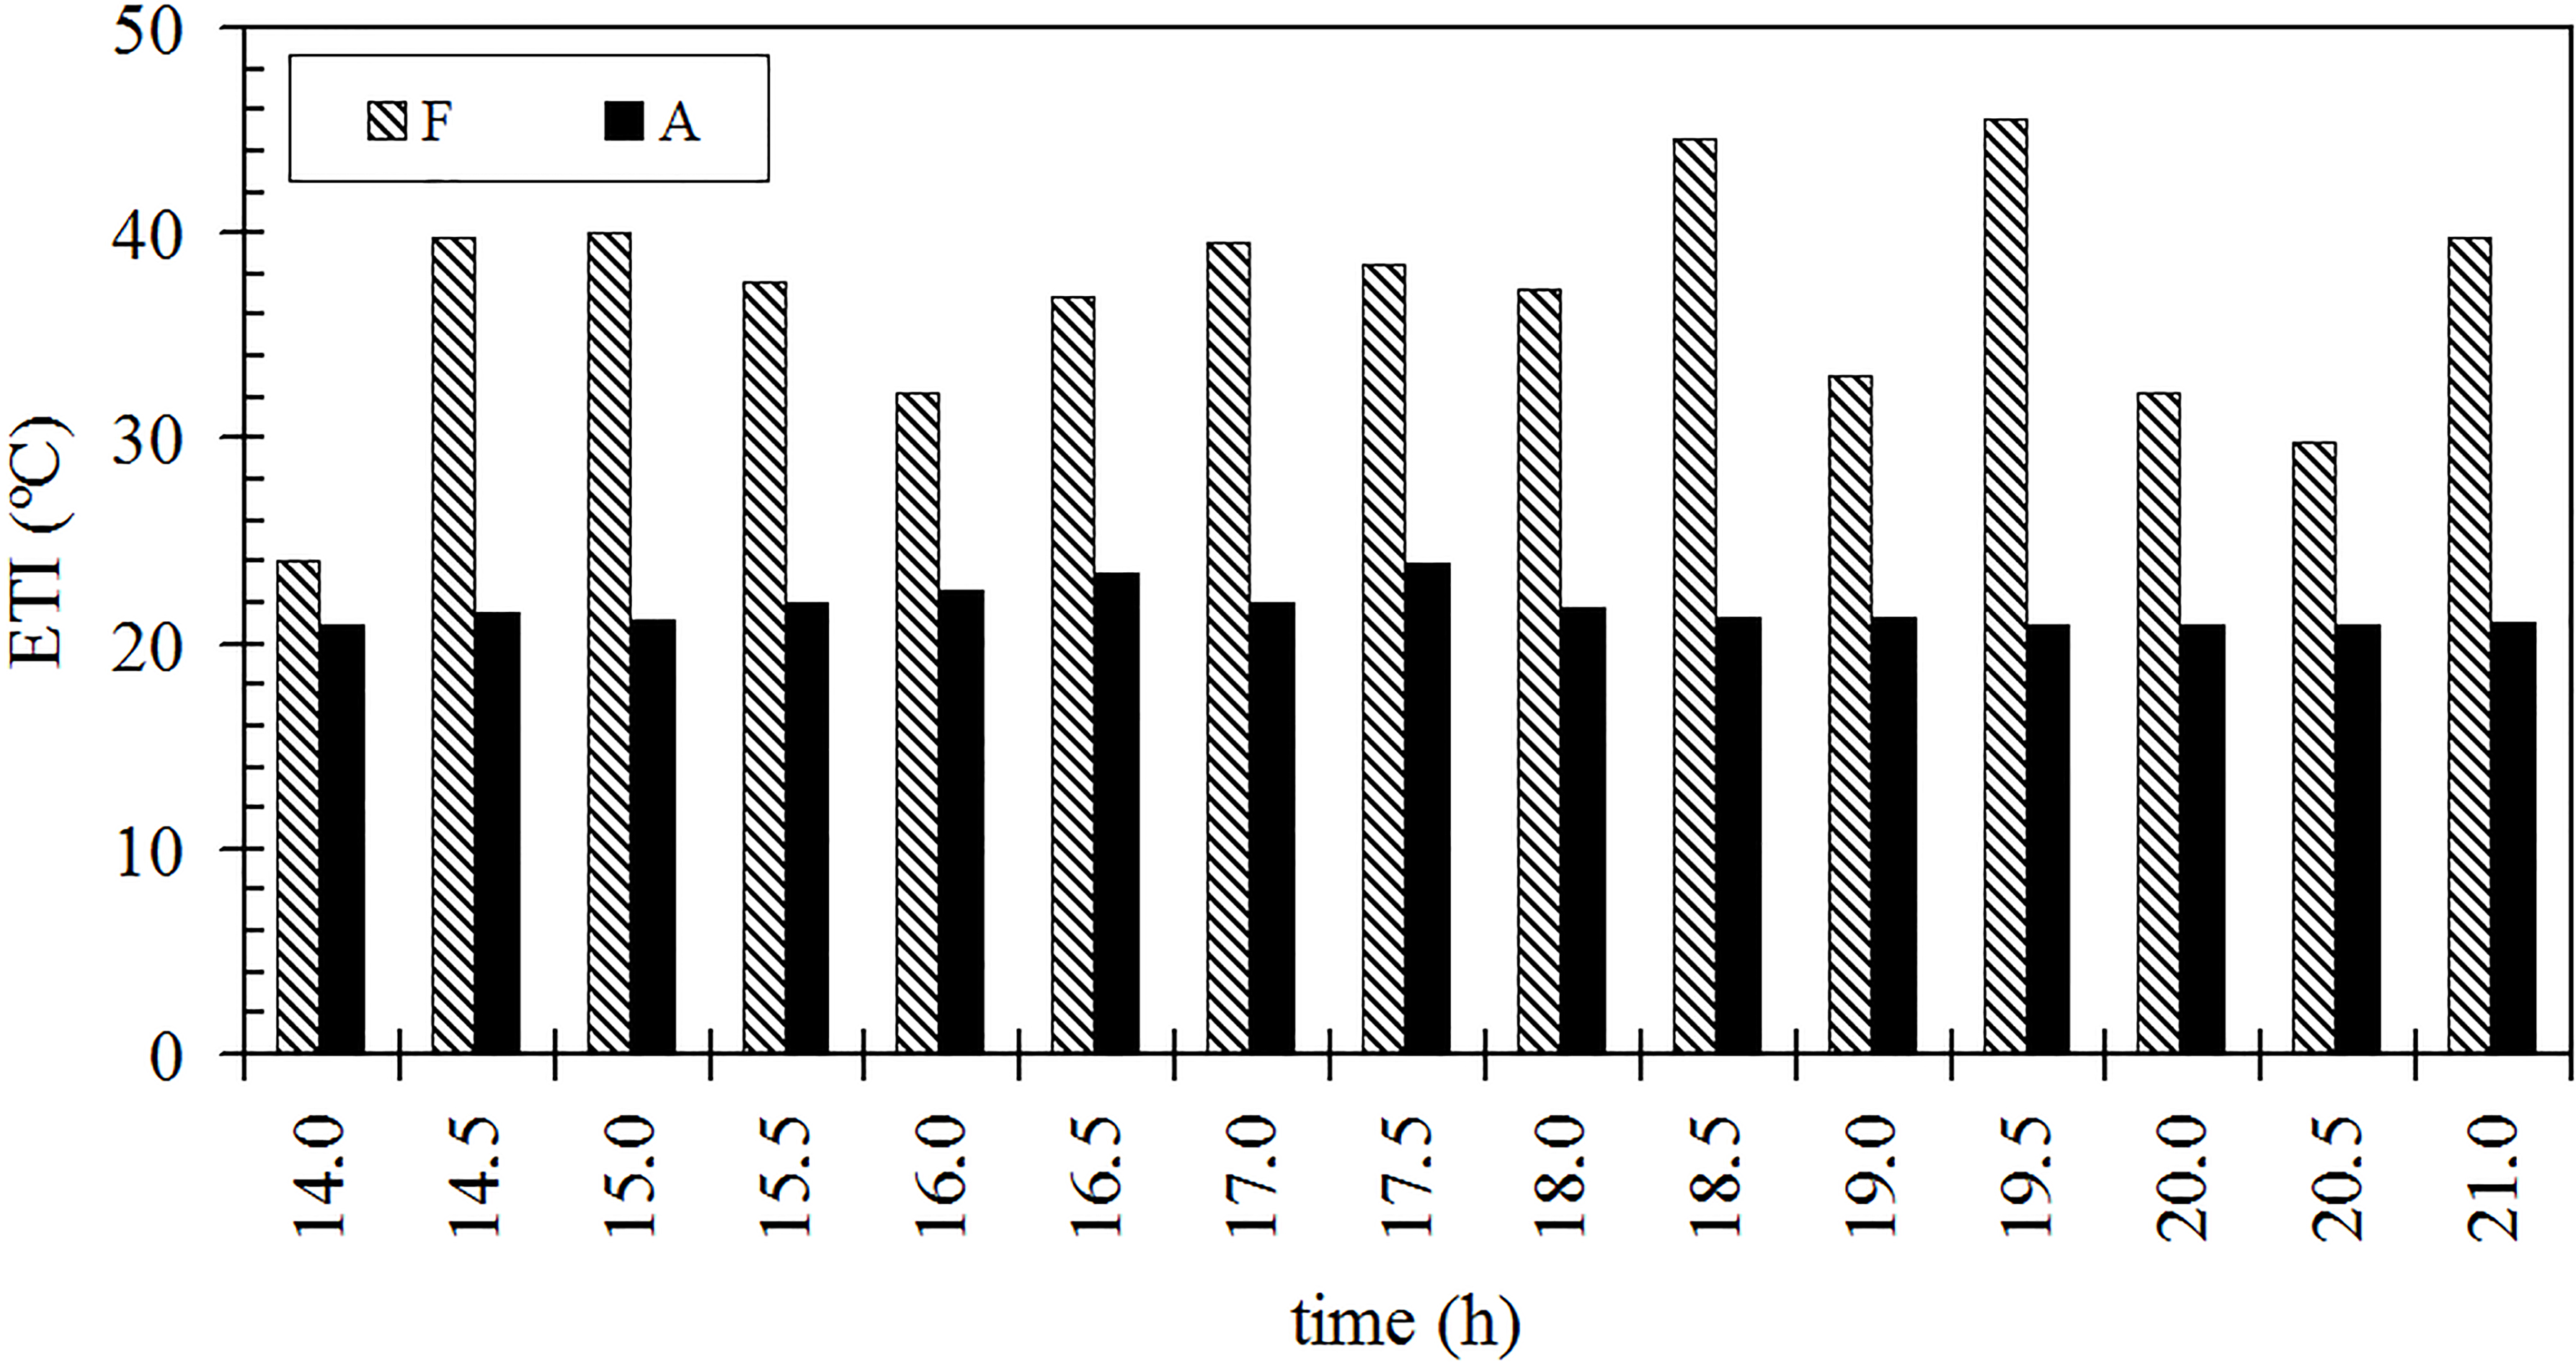
Figure 6.
EsConTer index comparing workplaces A and F.
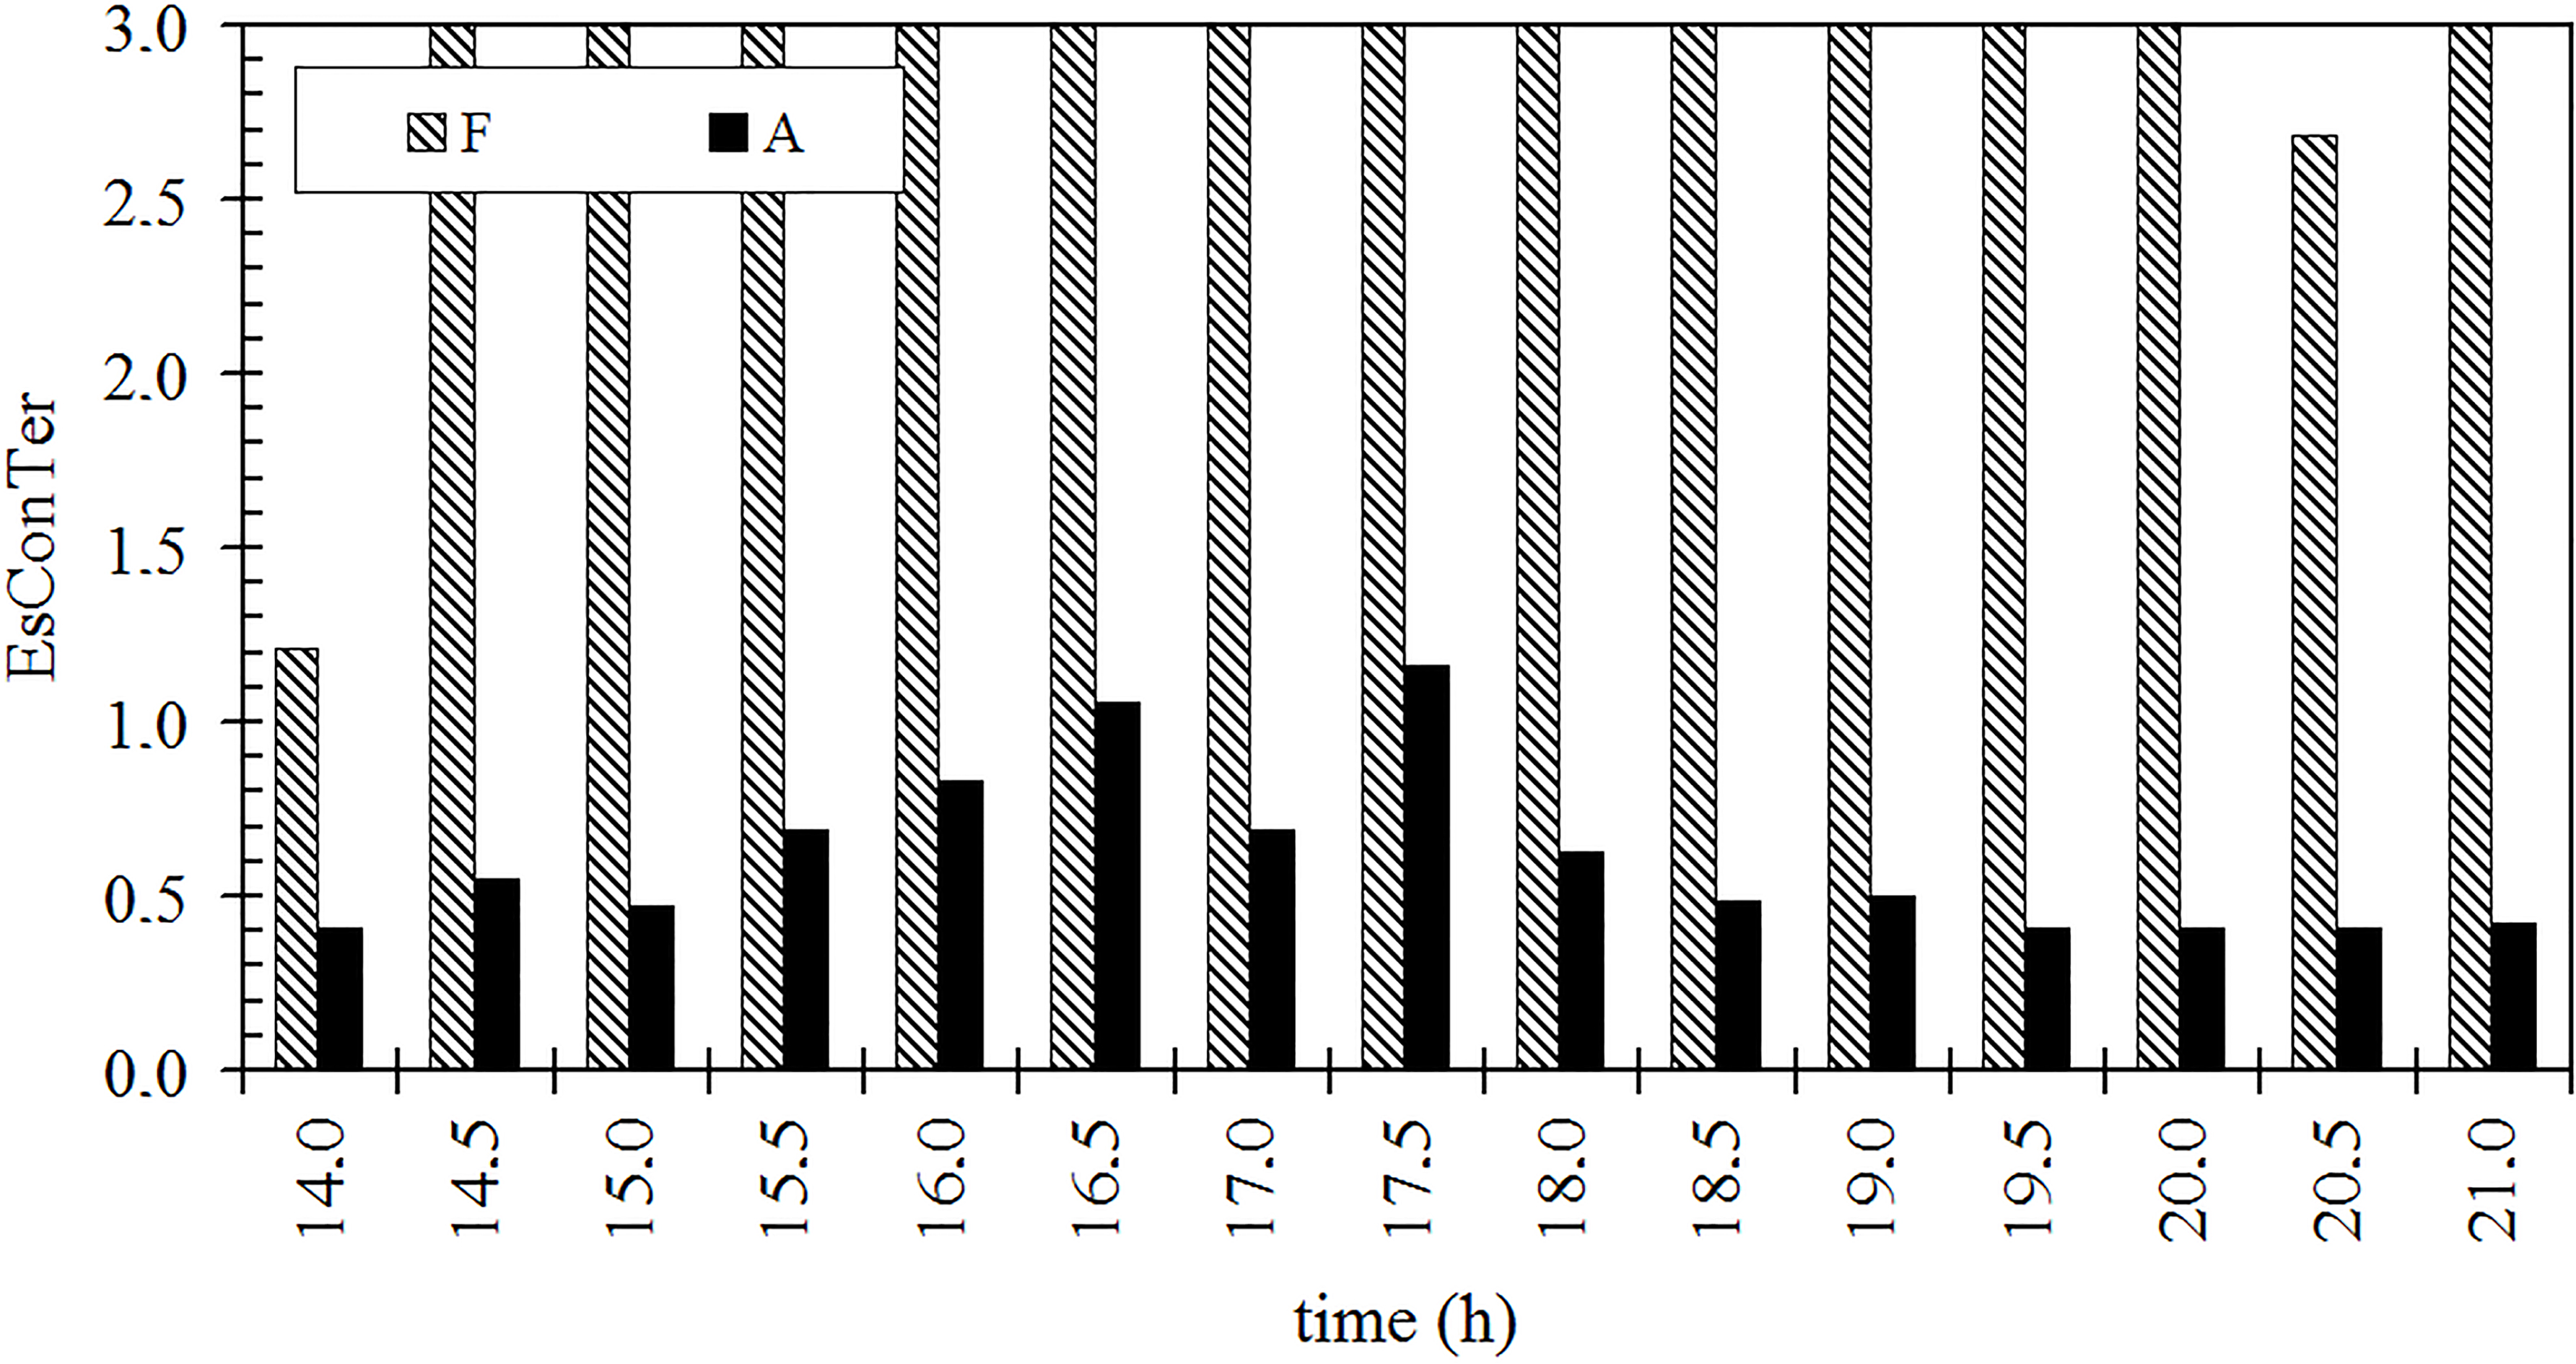
Workstations A and F represent contiguous workplaces of manual welding with different ventilation systems. As such, a more detailed analysis using the ETI, the EsConTer index and WMO diagram, was made comparing workstations A and F (see Figs 5–7).
![WMO diagram [17] adapted by [18] comparing workplaces A and F.](https://content.iospress.com:443/media/oer/2017/13-S1/oer-13-S1-oer254/oer-13-oer254-g007.jpg)
A brief analysis of Figs 5–7 shows that workplace F presents thermal stress, which requires a change in ventilation system. The results obtained for workplace A show that the ventilation system is appropriate, providing a comfortable environment. This conclusion is easily interpreted by the EsConTer index because it has the advantage of monitoring the diurnal solar cycle.
Figure 8.
ETI index applied in Area 2.
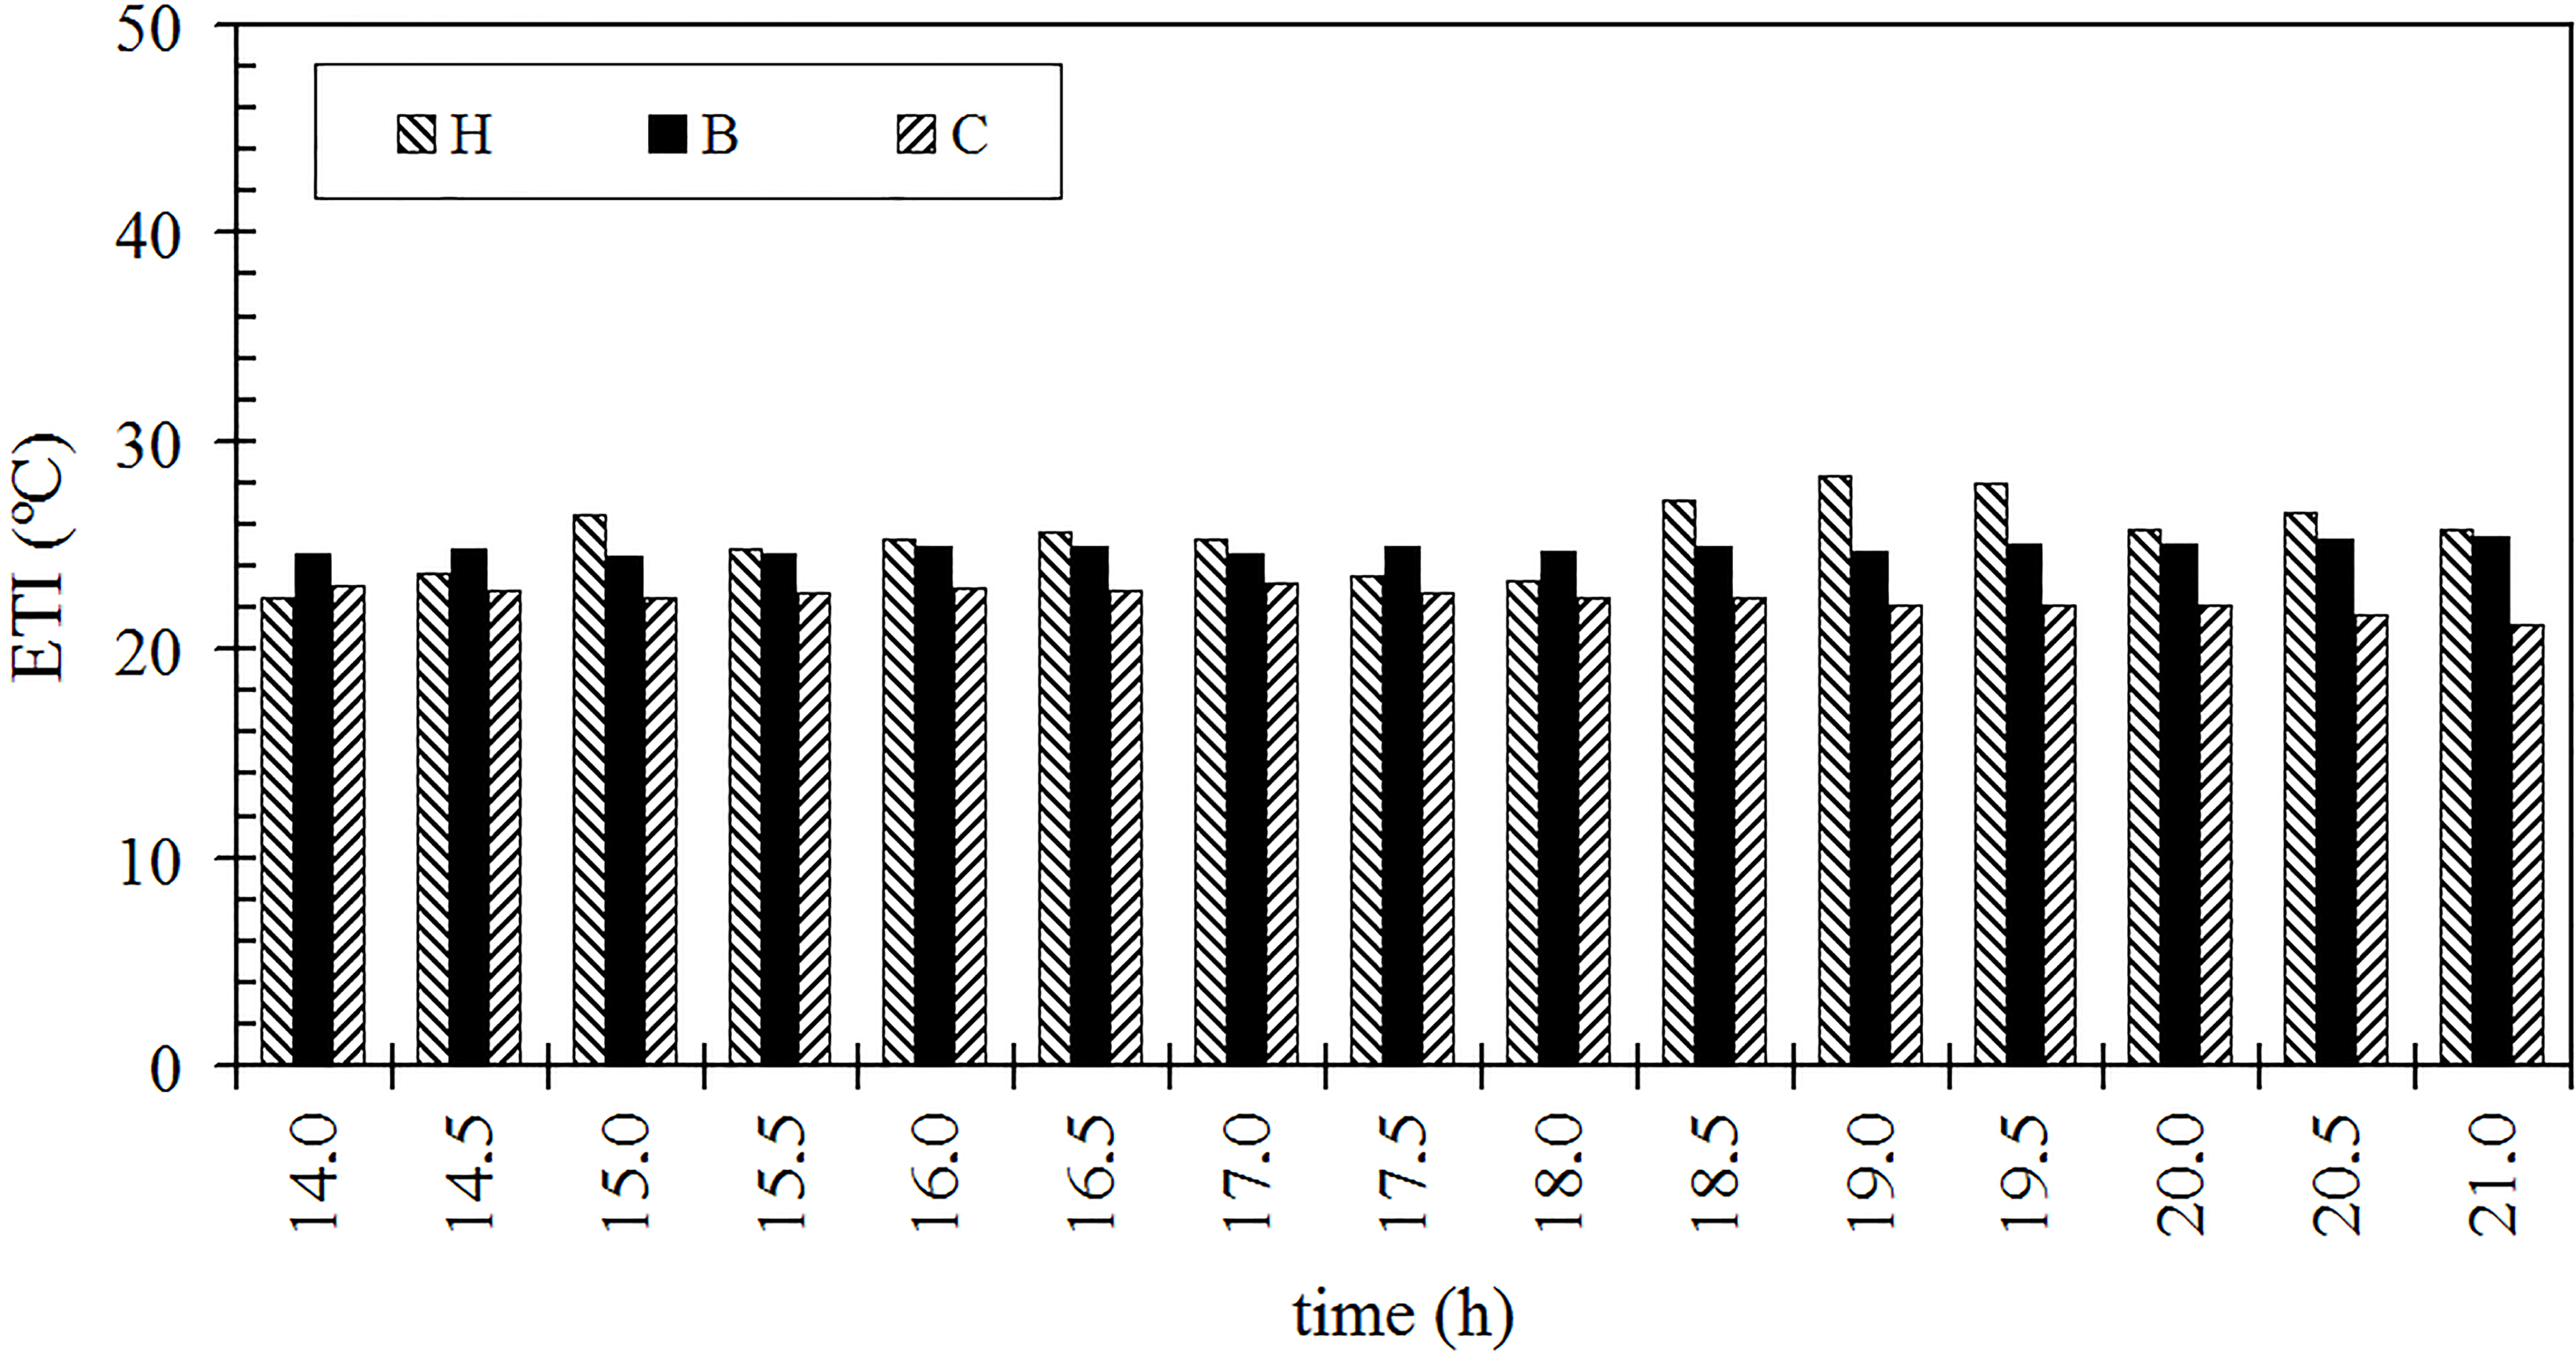
For the workstations located in area 2 (H, B and C), Fig. 8 shows the results obtained with the ETI. The evolution of this index shows a very similar situation for each workplace.
Figure 9.
EsConTer index applied in Area 2.
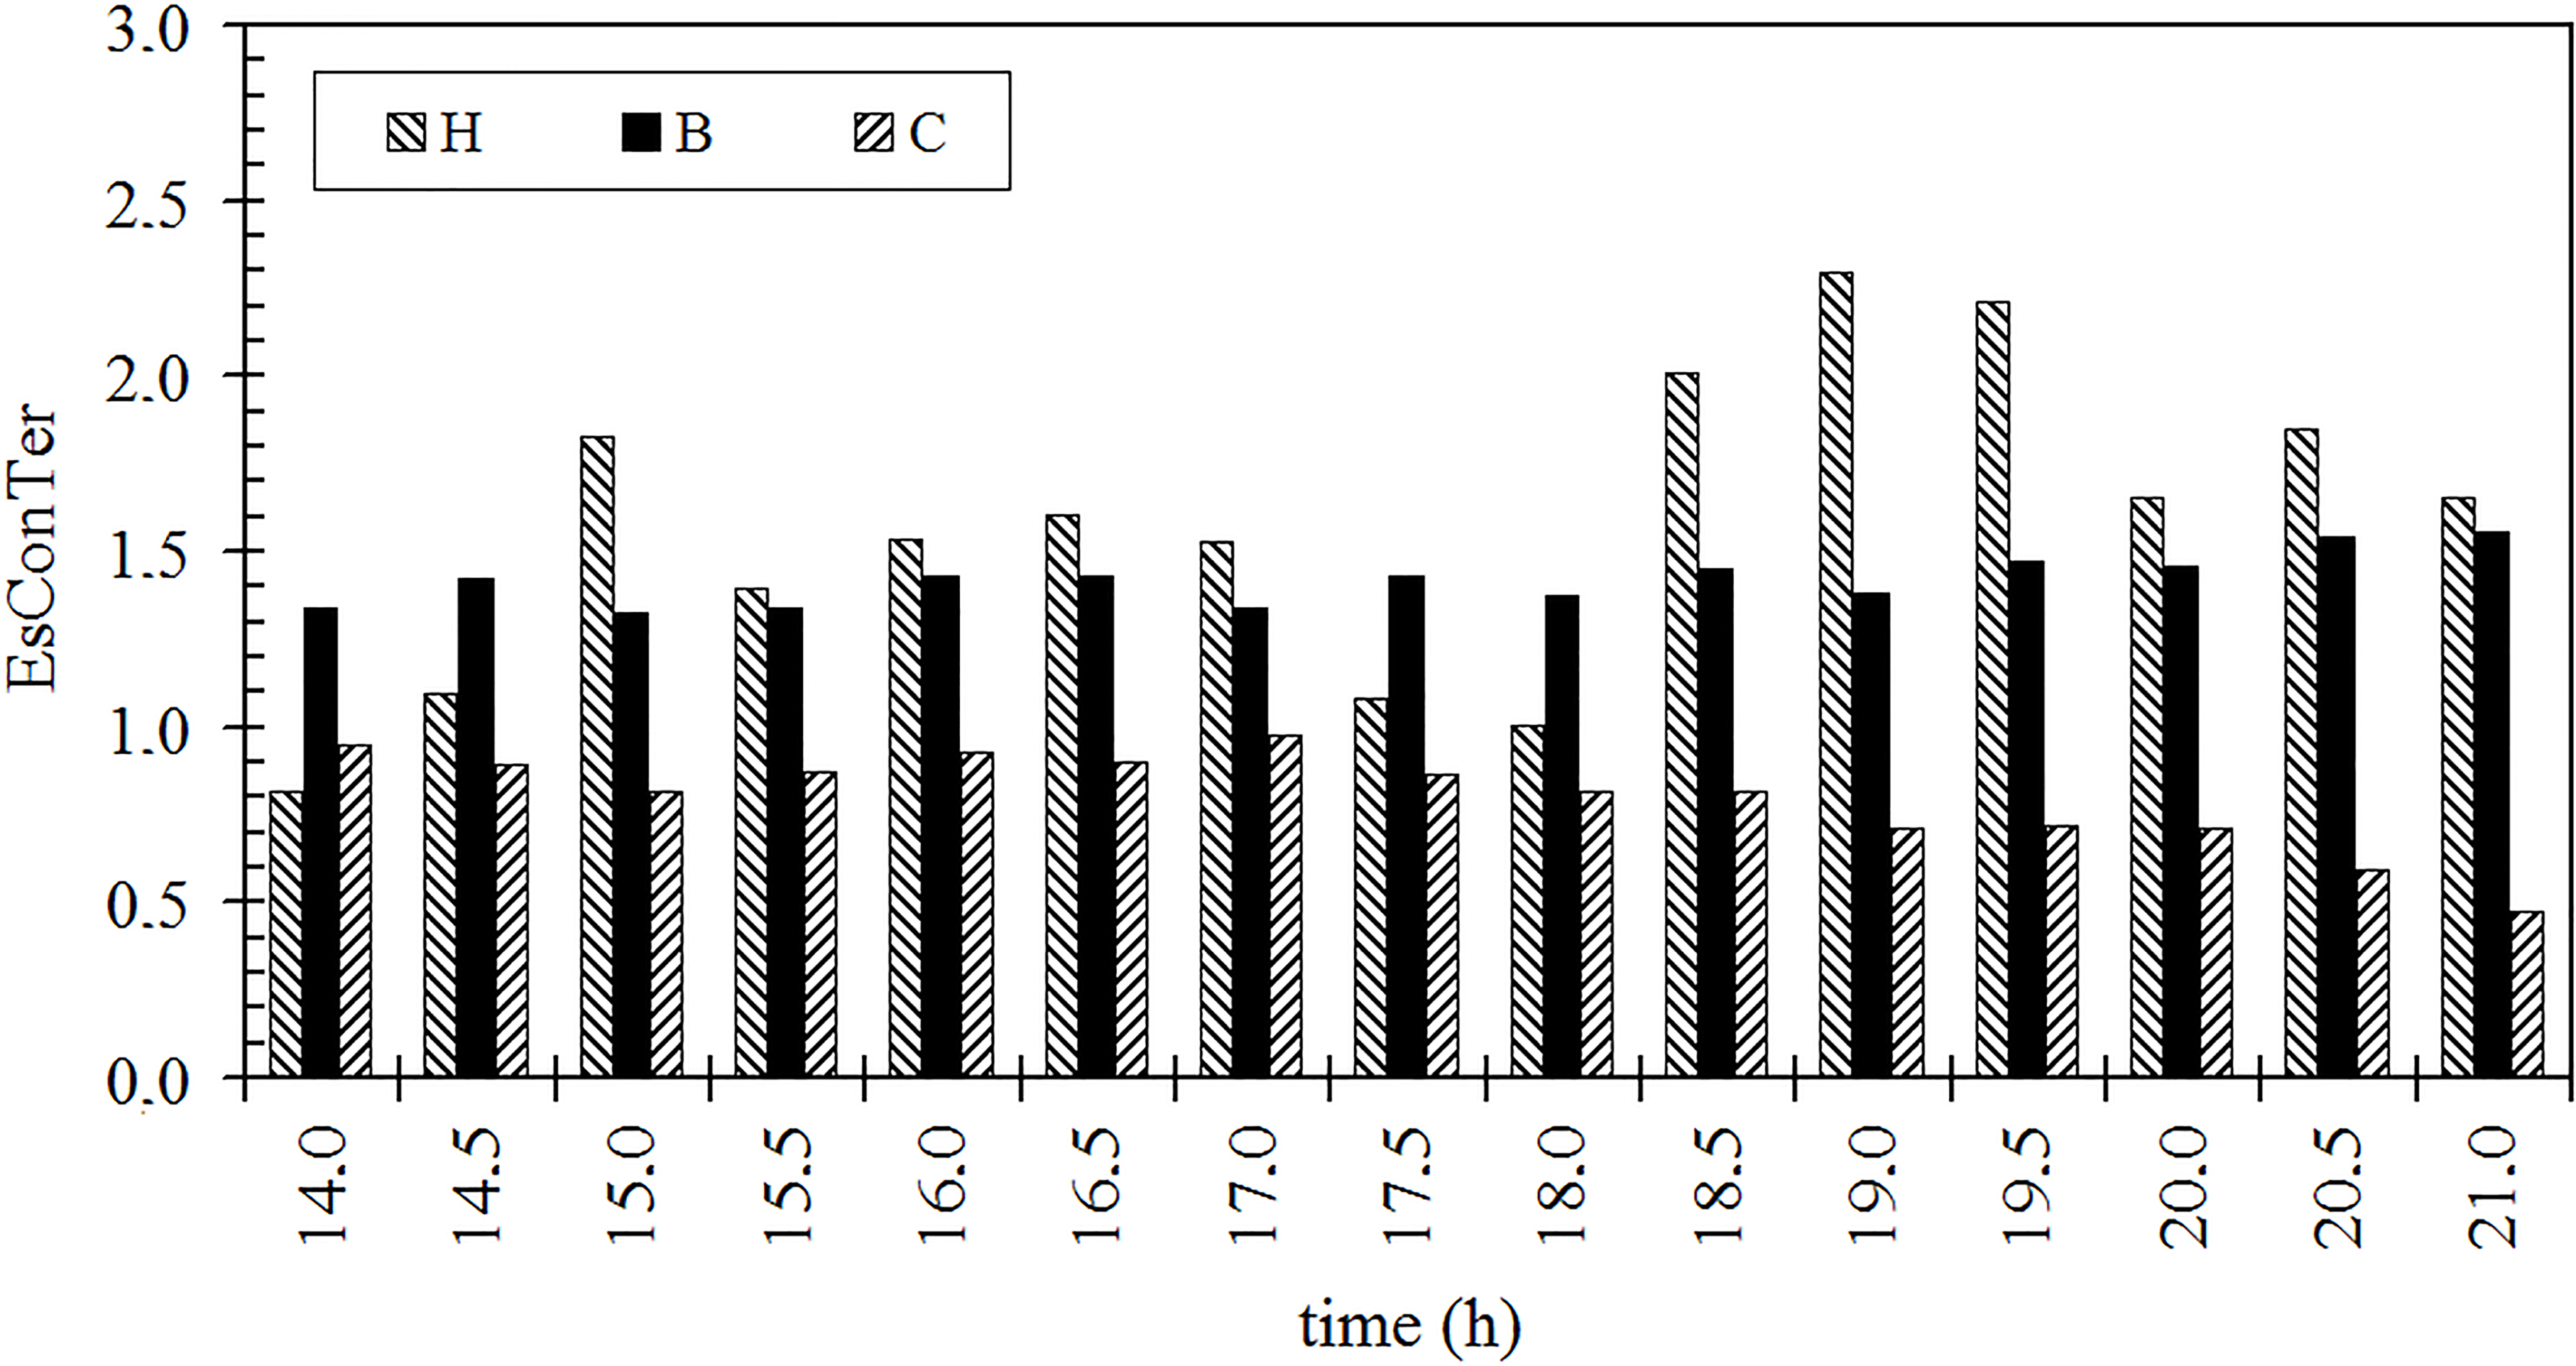
Figure 9 shows the results obtained with the EsConTer index, and once again these corroborate the results of ETI, and show it to be sensitive to the diurnal solar cycle.
As expected, workplace H reveals thermal discomfort, as it is a manual welding station with an inadequate ventilation system.
![WMO diagram [17] adapted by [18] applied in Area 2.](https://content.iospress.com:443/media/oer/2017/13-S1/oer-13-S1-oer254/oer-13-oer254-g010.jpg)
Figure 10 shows the results obtained on applying the WMO diagram. A large number of cases are in the comfortable zone. However, it is possible to observe some points outside the comfort zone, namely workplace H, requiring the attention of the Health and Safety Department.
3.2Results of subjective evaluation of thermal comfort
The subjective aspects usually associated with the state of mind of the individual when inserted in a working environment were evaluated through a questionnaire applied to sixteen occupants that work in the eight workplaces studied in the previous section (see Fig. 1). Regarding the summer season, the results obtained in this survey show that nearly all subjects who work in this section in both shifts consider that the workplace has excessively high temperatures, is very uncomfortable and that they are therefore dissatisfied with the working conditions (see Fig. 11).
Figure 11.
Occupants’ perceptions about comfort, temperature and satisfaction in the workplace. Legend: (By order of representation): (1
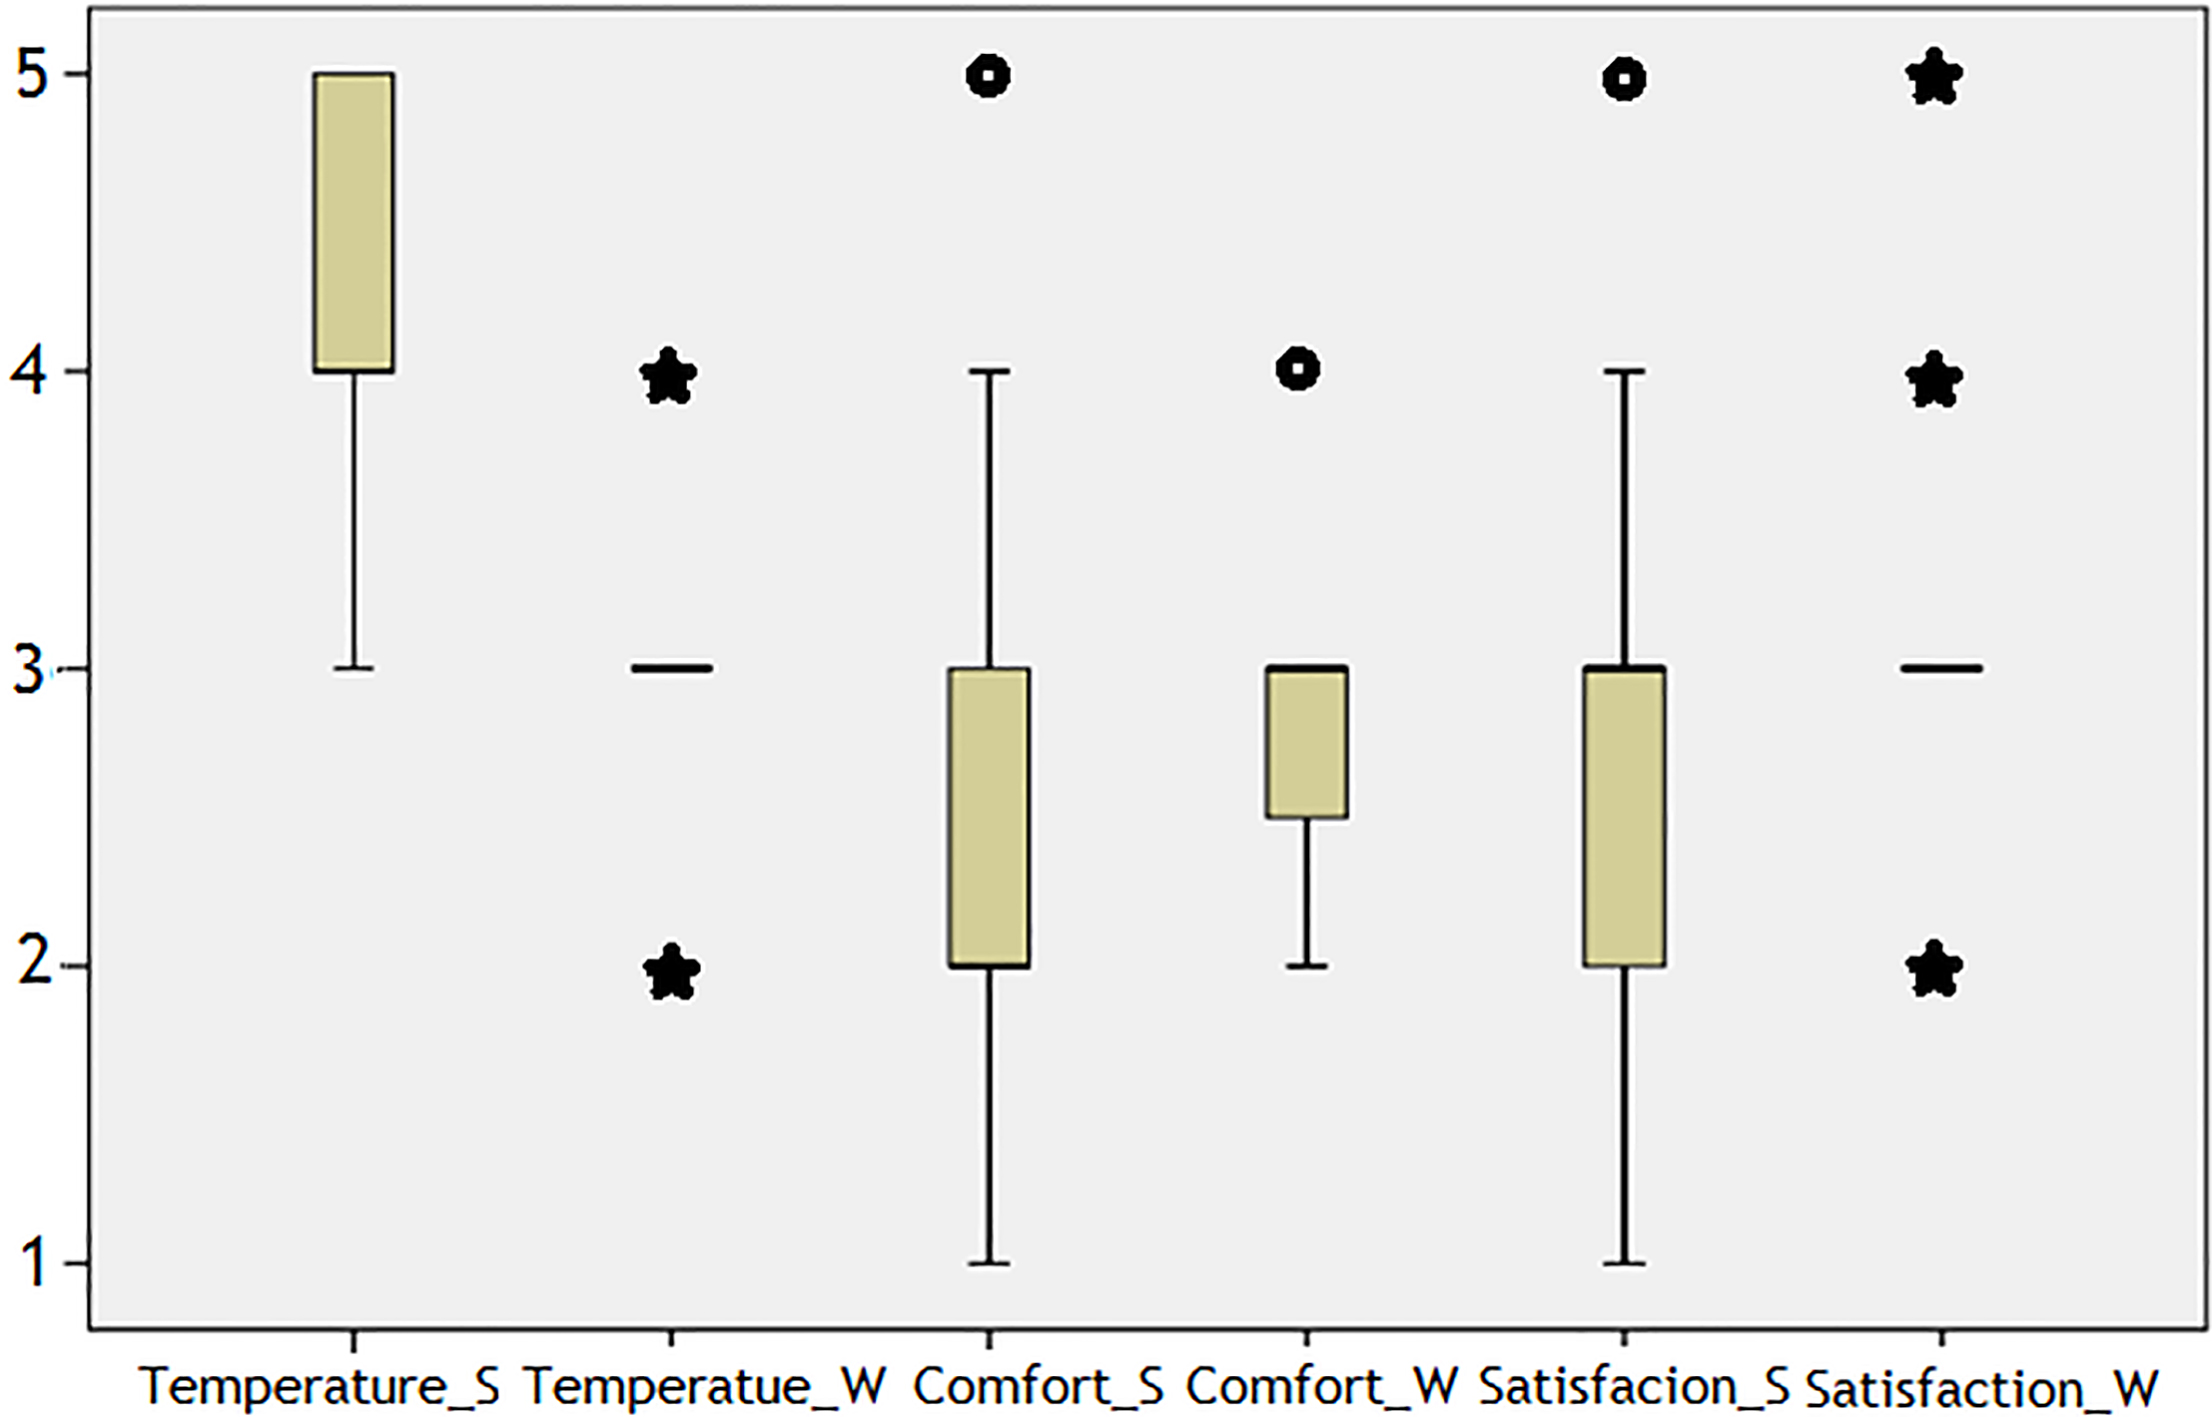
The results obtained based on a 5-point evaluation scale (Likert), showed how the air temperature influences the occupants of the workplace. Particularly in the summer, the median values of ‘4’ and third quartile of results in ‘5’ reveal a very unfavourable situation. In winter, the responses are more favourable, with a median value of ‘3’. The results clearly reveal that the individuals surveyed consider that the air temperature is very high in the workplace.
Regarding the sensation of thermal comfort in the workplace, the results obtained in the summer season reveal that 50% of respondents evaluated it using values lower than ‘2’ in scale, which indicates that the workplace occupants felt uncomfortable. In the winter, the values were slightly better.
The results revealed low satisfaction for occupants’ in the workplace, especially in summer. In the winter season, although some answers were considered outliers, the greater concentration of responses fell under the value ‘3’ on the Likert scale, occupying a neutral position between ‘neither satisfied nor dissatisfied’.
These results confirm that during winter, the outdoor temperature has a prominent influence on thermal adaptability. It is noted that the perception of satisfaction and comfort increase during the winter while the temperature decreases, which is in agreement with the influence of the diurnal cycle of solar radiation.
In the statistical analysis, in order to identify some correlation among variables, Spearman’s correlation coefficient was used. There was a statistically significant correlation among some variables studied. Particularly in the summer period, the following was observed: (i) a positive correlation between ‘Comfort’ and ‘Satisfaction’ (Spearman’s coefficient (
Nevertheless, the results also show that the acclimatization of the operator influences some answers. For example, the occupant of workplace F who works the morning shift (critical workplace), considers the station very hot and very comfortable and is satisfied with the thermal conditions. This contradiction can also be explained by the fact that workers are afraid of being identified. Therefore although the questionnaire is anonymous, the workplace and the section are identified.
4.Conclusions
The obtained results allowed the expected thermal sensation to be known for the different workplaces studied. This was done via the application of user-friendly thermal indexes – ETI, EsConTer index and WMO diagram – and supported by real data collected using inexpensive measuring tools. The findings revealed a high risk of heat stress for some workstations, namely workstations F and H, which required the intervention of the Health and Safety Department.
Regarding the different indexes applied, the WMO diagram proved to be an excellent tool for evaluating thermal comfort since it considers intervention strategies to improve the workplace. The EsConTer index also proved to be an excellent tool, since it is consistent with the seventh ASHRAE scale, which precludes the consultation of tables with limit values.
Regarding the subjective study, this showed that the air temperature influences the thermal sensation of the worker in the workplace. As expected, summer weather provokes heat stress in some workers, which clearly affects thermal sensation and worker satisfaction. Concerning comfort in the workplaces studied, the results of the subjective evaluation confirmed that workplace F needs immediate intervention, requiring the installation of a new ventilation system. Similar conclusions can be applied to workstation H. However, and considering the survey results, it should be noted that the worker in station F evaluated the workplace as very warm and very comfortable, and was satisfied with the thermal conditions. This contradiction in the information provided by the worker, perhaps motivated by the fear of being identified, was recognized by the management of Health and Safety. Another reason which might justify this response may be the reporting employee’s personal adaptation to the weather. However, the acclimatization of the operator is not sufficient for productivity gains, since the workplaces should provide conditions for the majority of the workers and not just for workers who are both physical robust and acclimated.
Conflict of interest
None to report.
References
[1] | Bluyssen, P. M., Aries, M., & van Dommelen, P. ((2011) ). Comfort of workers in office buildings: The European HOPE project. Build. Environ, 46: (1), 280-288. |
[2] | Lan, L., Wargocki, P., & Lian, Z. ((2011) ). Quantitative measurement of productivity loss due to thermal discomfort. Energy Build, 43: (5), 1057-1062. |
[3] | Huizenga, C., Abbaszadeh, S., Zagreus, L., & Arens, E. ((2006) ). Air Quality and Thermal Comfort in Office Buildings? Results of a Large Indoor Environmental Quality Survey. In Proceedings of Healthy Buildings, 393-397. |
[4] | ASHRAE 55 ((2010) ). Thermal Environmental Conditions For Human Occupancy. Atlanta, Georgia: American Society of Heating, Refrigerating and Air-Conditioning Engineers. |
[5] | ISO 7730, ((2006) ). Ergonomics of thermal environment - Analytical determination and interpretation of thermal comfort using calculation of PMV and PPD indeces and local thermal comfort criteria, in International Standards Organization. |
[6] | Teixeira, L., Talaia, M., & Morgado, M. ((2014) ). Evaluation of indoor thermal environment of a manufacturing industry. In Occupational Safety and Hygiene II – Selected Extended and Revised Contributions from the International Symposium Occupational Safety and Hygiene, 553-558. |
[7] | Bröde, P., Błazejczyk, K., Fiala, D., Havenith, G., Holmér, I., Jendritzky, G., Kuklane, K., & Kampmann, B. ((2013) ). The Universal Thermal Climate Index UTCI compared to ergonomics standards for assessing the thermal environment. Ind. Health, 51: , 16-24. |
[8] | Morgado, M., Talaia, M., & Teixeira, L. ((2017) ). A new simplified model for evaluating thermal environment and thermal sensation: An approach to avoid occupational disorders. Int. J. Ind. Ergon, 60: , 3-13. |
[9] | Nematchoua, M. K., Tchinda, R., & Orosa, J. A. ((2014) ). Thermal comfort and energy consumption in modern versus traditional buildings in Cameroon: A questionnaire-based statistical study. Appl. Energy, 114: , 687-699. |
[10] | Djongyang, N., Tchinda, R., & Njomo, D. ((2010) ). Thermal comfort: A review paper. Renew. Sustain. Energy Rev, 14: (9), 2626-2640. |
[11] | Cox, C. ((2005) ). Health optimisation protocol for energy-efficient buildings. Delft, The Netherlands: TNO. |
[12] | Yao, R., Li, B., & Liu, J. ((2009) ). A theoretical adaptive model of thermal comfort – Adaptive Predicted Mean Vote (aPMV). Build. Environ., 44: (10), 2089-2096. |
[13] | Akimoto, T., Tanabe, S., Yanai, T., & Sasaki, M. ((2010) ). Thermal comfort and productivity – Evaluation of workplace environment in a task conditioned office. Build. Environ., 45: (1), 45-50. |
[14] | Emmanuel, R. ((2005) ). Thermal comfort implications of urbanization in a warm-humid city: the Colombo Metropolitan Region (CMR), Sri Lanka. Build. Environ., 40: , 1591-1601. |
[15] | Arezes, P. M., Neves, M. M., Teixeira, S. F., Leão, C. P., & Cunha, J. L. ((2013) ). Testing thermal comfort of trekking boots: an objective and subjective evaluation. Appl. Ergon., 44: (4), 557-65. |
[16] | Thom, E. C. (1959). The Discomfort index. In Weatherwise, Boston, 57-60. |
[17] | W.M.O. ((1987) ). World Climate Programme Applications, Climate and Human Health. World Meteorological Organization. |
[18] | Talaia M., & Rodrigues, F. ((2006) ). Heat Stress Indicators in an Industry. Section Thermal Comfort. In Proceedings of Abstracts HB 2006 – Healthy Buildings. |


