
Omega-3 supplementation increases omega-3 fatty acids in lipid compartments that can be taken up by the brain independent of APOE genotype status: A secondary analysis from a randomised controlled trial1
Abstract
BACKGROUND:
Omega-3 fatty acid (OM3) intake is associated with a lower risk of developing Alzheimer’s disease, but individuals carrying the ɛ4 allele of apolipoprotein E (APOE4) might not benefit from this prevention strategy. Indeed, they might have lower OM3 into plasma free fatty acid (FFA) and lysophosphatidylcholine (LPC) compartments, the two forms the brain can take-in.
OBJECTIVE:
To evaluate the docosahexaenoic acid (DHA) and eicosapentaenoic acid (EPA) concentrations in the FFA and LPC pre- and post-OM3 supplementation in APOE4 carriers and non-carriers.
DESIGN:
Plasma samples from 25 APOE4 carriers and non-carriers before and six months after receiving 2.5 g/d DHA+EPA daily were analyzed. DHA and EPA concentrations in the LPC, and FFA were compared by supplementation and genotype. A secondary analysis investigated the interaction between body mass index (BMI) and APOE genotype status.
RESULTS:
There was no genotype x supplement interaction nor a genotype effect on LPC and FFA. However, there was a supplement effect where OM3 increased in all lipid compartment by < 1-fold to 4-fold. Individuals with a low BMI had higher OM3 increase concentrations in the LPC than those with a high BMI.
CONCLUSIONS:
APOE4 carriers and non-carriers can both benefit from taking an OM3 supplement. However, individuals with a high BMI have lower OM3 increases than those with a lower BMI.
1Introduction
Alzheimer’s disease (AD) is a neurodegenerative disease that represents 60 to 70% of the 50 million dementia cases worldwide [1]. The main genetic risk factor for late-onset AD is carrying the ɛ4 allele of the apolipoprotein E gene (APOE4) [2]. However, not all individuals who carry the APOE4 allele develop AD, suggesting that some environmental factors influence the risk. One environmental factor to reduce the risk of developing AD is regular consumption of fish containing the omega-3 fatty acids docosahexaenoic acid (DHA) and eicosapentaenoic acid (EPA) [3–5]. However, carrying the APOE4 allele might change this relationship since in non-carriers, consumption of fatty fish at least two times per week reduced the risk of developing dementia by 28% and reduced the risk of developing AD by 41%, but this protective effect was not present in APOE4 carriers [6]. This result might be the consequence of a modified metabolism of omega-3 fatty acids in APOE4 carriers compared to non-carriers. Our team previously reported that the relative percentages of DHA and EPA at baseline were 60% and 67% higher in APOE4 carriers than in non-carriers. After the participants took 3 g/d EPA+DHA for six weeks, the relative percent of EPA in FFAs and DHA in TGs did not increase as much in APOE4 carriers compared to non-carriers [7]. In another study, APOE4 carriers and non-carriers were given uniformly labeled carbon 13 DHA and their metabolism over 28 days was evaluated. In APOE4 carriers, the mean plasma-labeled DHA concentration was 31% lower, and cumulative β-oxidation was higher than that in non-carriers [8].
To cross the blood brain barrier, plasma fatty acids need to be in the non-esterified form (FFA) bound to albumin or esterified in lysophosphatidylcholine (LPC) as detailed in [9, 10]. Considering that DHA does not increase in some plasma lipid pool after an omega-3 fatty acid supplementation in APOE4 carriers, we hypothesized that in APOE4 carriers, omega-3 fatty acids increase will be less in LPC and FFA compared to non-carriers after an omega-3 fatty acid supplementation for six months. The aim of this study was to quantify DHA and EPA in plasma FFAs and LPCs of APOE4 carriers and non-carriers before and after six months of omega-3 supplementation. The secondary objective was to compare the plasma ΔDHA and ΔEPA concentrations (Δ=post –pre) based on APOE4 status and BMI (high and low BMI) in the different plasma lipid compartments since we previously reported a BMI by genotype interaction [11].
2Subjects and methods
The present research is a secondary analysis of a randomized controlled clinical study that was performed earlier [12]. In the main clinical study, healthy male and female participants between the ages of 20 and 80 years were included. Participants were excluded from the study based on the following criteria: a diabetes or cancer diagnosis within the past six months; uncontrolled hypothyroidism or hyperthyroidism; smoking; alcoholism; autoimmune disorders, for example, rheumatoid arthritis and multiple sclerosis; uncorrected visual impairments; French not being their native language; cognitive disorders; brain injuries; mental health disorders that can impact cognitive functions; intake of omega-3 fatty acid supplements within six months prior to recruitment; regular weekly consumption of more than two portions of fatty fish; and intense physical training. During the recruitment process, blood samples of the participants were screened to ensure their blood triglycerides (TGs) did not exceed 1.7 mmol/L, HDL cholesterol was at least 1.3 mmol/L, glucose was less than 6 mmol/L, TSH was less than 3.5 mUI/L, C-reactive protein was less than 10 mg/L, and the white blood cell count was between 4000 and 11000μL.
Eligible participants were randomized into the placebo or omega-3 fatty acid group. Participants were randomly assigned to the n-3 PUFA group or the placebo group using a computerized, web-based, random number table with stratification by sex and age (20–39; 40–59; 60–80 years old) in a 1 : 1 ratio. All research personnel were blinded treatment assignment to intervention. Participants in the placebo group were given corn/soybean oil supplements, while those in the other group were given 0.7 g of DHA and 1.8 g of EPA to take every day for six months. Blood samples were taken before the participants started consuming the supplements and then once a month for six months. Blood samples were centrifuged to collect the plasma, which was aliquoted and stored in a –80 °C freezer. Since there was no rationale to analyze samples from the placebo group, in the present secondary study, plasma samples from only the omega-3 fatty acid group were investigated since this is a metabolic study evaluating whether EPA and DHA are incorporated within plasma FFAs and LPCs. Twenty-five APOE4 carriers and 25 non-carriers supplemented with omega-3 fatty acids and with plasma samples at baseline and 6 months under the supplementation were matched based on sex, age±5 years and BMI±5.3 kg/m2. Their plasma samples taken before the participants started taking the supplements (pre-supplementation) and after they took the supplements for six months (post-supplementation) were analyzed. The Research Ethics Board of the CIUSSSE-CHUS provided approval of this trial. All participants provided written informed consent.
APOE4 genotyping: The APOE genotype of each participant was analyzed using the RNomics Platform (Centre de Recherche du CHUS, Sherbrooke, Canada). First, DNA was extracted from 200μL of thawed whole blood using a QIAmp DNA extraction kit (Qiagen, Hilden, Germany) and then genotyped with predesigned TaqMan SNP genotyping assays (Applied Biosystems, Foster City, United States) for the SNP ID rs429358 and rs7412 assays. Using PCR, DNA fragments with the APOE gene were amplified using the Stratagene Mx3005P multiplex quantitative system (Agilent Technologies, La Jolla, United States). The samples underwent forty cycles of PCR amplification. Each cycle consisted of heating the double-stranded DNA for 30 seconds at 95 °C and 1 minute at 60 °C for the primer/probe mix to anneal to the target DNA area and amplify that target DNA region. Then, the different APOE alleles were determined for each participant. Participants who had one or two copies of the APOE4 allele were considered APOE4 carriers, and those who did not carry any APOE4 allele were considered non-carriers.
Plasma lipid separation and analysis: Plasma total lipids were first extracted from 500μL of thawed plasma samples using the Folch et al. method [13]. Internal standards were added as described in the appendix.
Once the total lipids were extracted from the plasma, they were reconstituted in 50μL of chloroform before being plated on a thin layer chromatograph (250μm thick with F-254 indicator, SiliCycle, Quebec City, Canada) to separate the plasma lipid compartments. CE, TG, FFA and total phospholipids were separated using the developing migration solvent petroleum ether:diethyl ether:acetic acid:methanol (170 : 30 : 5:2 v/v) [14]. After migration, the plates were sprayed with 0.02% 2,7-dichlorofluorescein (Acros Organic, Fisher Scientific) dissolved in methanol to visualize the lipids under UV light. Lipids in the CE, TG and FFA compartments were extracted from the silica using hexane:methanol:saturated NaCl in distilled water (2 : 2:5 v/v). After centrifugation, the lipids were collected and evaporated for the following steps. CE was saponified with KOH-MeOH at 90 °C for one hour. Following this step, CE with TG and FFA were methylated with BF3-MeOH as previously described [15].
To allow the separation of LPC from the other phospholipids, total phospholipids were extracted from the silica with chloroform:methanol:water (5 : 5:1 v/v). The extracted lipids were then plated on a second pre-heated TLC plate and migration of phospholipids were performed under a chloroform:methanol:acetic acid:water (100 : 75 : 9:4 v/v). Each phospholipid class (LPC, PE and PC) was extracted from the silica as described above for phospholipid extraction. LPC, PC, and PE were methylated with BF3-MeOH at 90 °C for 30 minutes.
Fatty acid methyl esters were analyzed and quantified using gas chromatography as described previously [16]. Briefly, 1μL of FAME was injected in splitless mode at 250 °C. The capillary column used was a 50 m BPX-70 (SGE, Melbourne, Australia). Peaks were identified based on their retention times and the calibration curves of each identified peak. OpenLAB CDS (ChemStation Edition for GC Systems, Agilent Technologies) software was used to visualize the chromatographs and to process the data. The concentrations were assessed with calibration curves, and the internal standard added to the samples.
2.1Statistical analysis
The sample size used in the current supplementary study was 25 APOE4 carriers and 25 non-carriers, and it was based on the number of APOE4 carriers available in the omega-3 fatty acid cohort from the main clinical study. To confirm that there would be adequate statistical power, the sample size was calculated using the mean Δ (post –pre) DHA concentration in FFAs and PL from data published by Chouinard-Watkins and colleagues [11] with an alpha set at 0.05 and statistical power set at 90%. The sample size calculated for DHA in FFA was six APOE4 carriers and six non-carriers, and DHA in PL was seven APOE4 carriers and seven non-carriers. All statistical tests were performed using GraphPad Prism 9. P values < 0.05 were considered statistically significant.
Prior to all statistical analyses, the normal distribution of data was assessed by the Shapiro–Wilk test. Baseline anthropometric measurements between APOE4 carriers and non-carriers were compared using an unpaired parametric Student’s t-test if the data were normally distributed or an unpaired nonparametric Mann–Whitney test if they were not normally distributed (age, sex, BMI, glucose, total cholesterol, triglycerides, and LDL cholesterol concentrations were not normally distributed). In the primary analysis of DHA and EPA concentrations in LPCs and FFAs, the interaction between the genotype and supplement, and the supplement or the genotype effect alone were tested using a nonparametric t-test since the data were not normally distributed. An unpaired nonparametric t-test (Mann–Whitney test) was performed to compare the genotype groups. A paired nonparametric t-test (Wilcoxen test) was performed to compare pre- and post-supplementation. In the secondary analyses, the same statistics described above were performed for TG, as the data for DHA and EPA were not normally distributed. However, for CE, DHA and EPA were normally distributed; therefore, a 2-way ANOVA was performed. Moreover, we tested ΔDHA and ΔEPA (Δ=post –pre) in LPC, FFA, TG, and CE between the genotypes and the BMI groups. For this purpose, two BMI groups were generated based on the median BMI. Individuals with a BMI < 25.2 kg/m2 were classified in the low BMI group, whereas those with a BMI > 25.2 kg/2 were classified in the high BMI group. The statistical test used was either 2-way ANOVA (for CE) or unpaired nonparametric t-test (LPC, FFA and TG) to compare both the genotype and BMI groups. All DHA and EPA data in the different lipid compartments are presented as the mean±SEM. Additionally, correlation tests were performed between the baseline age of the participants and the DHA or EPA plasma concentrations pre- or post-supplementation or their Δ concentrations within each genotype group.
3Results
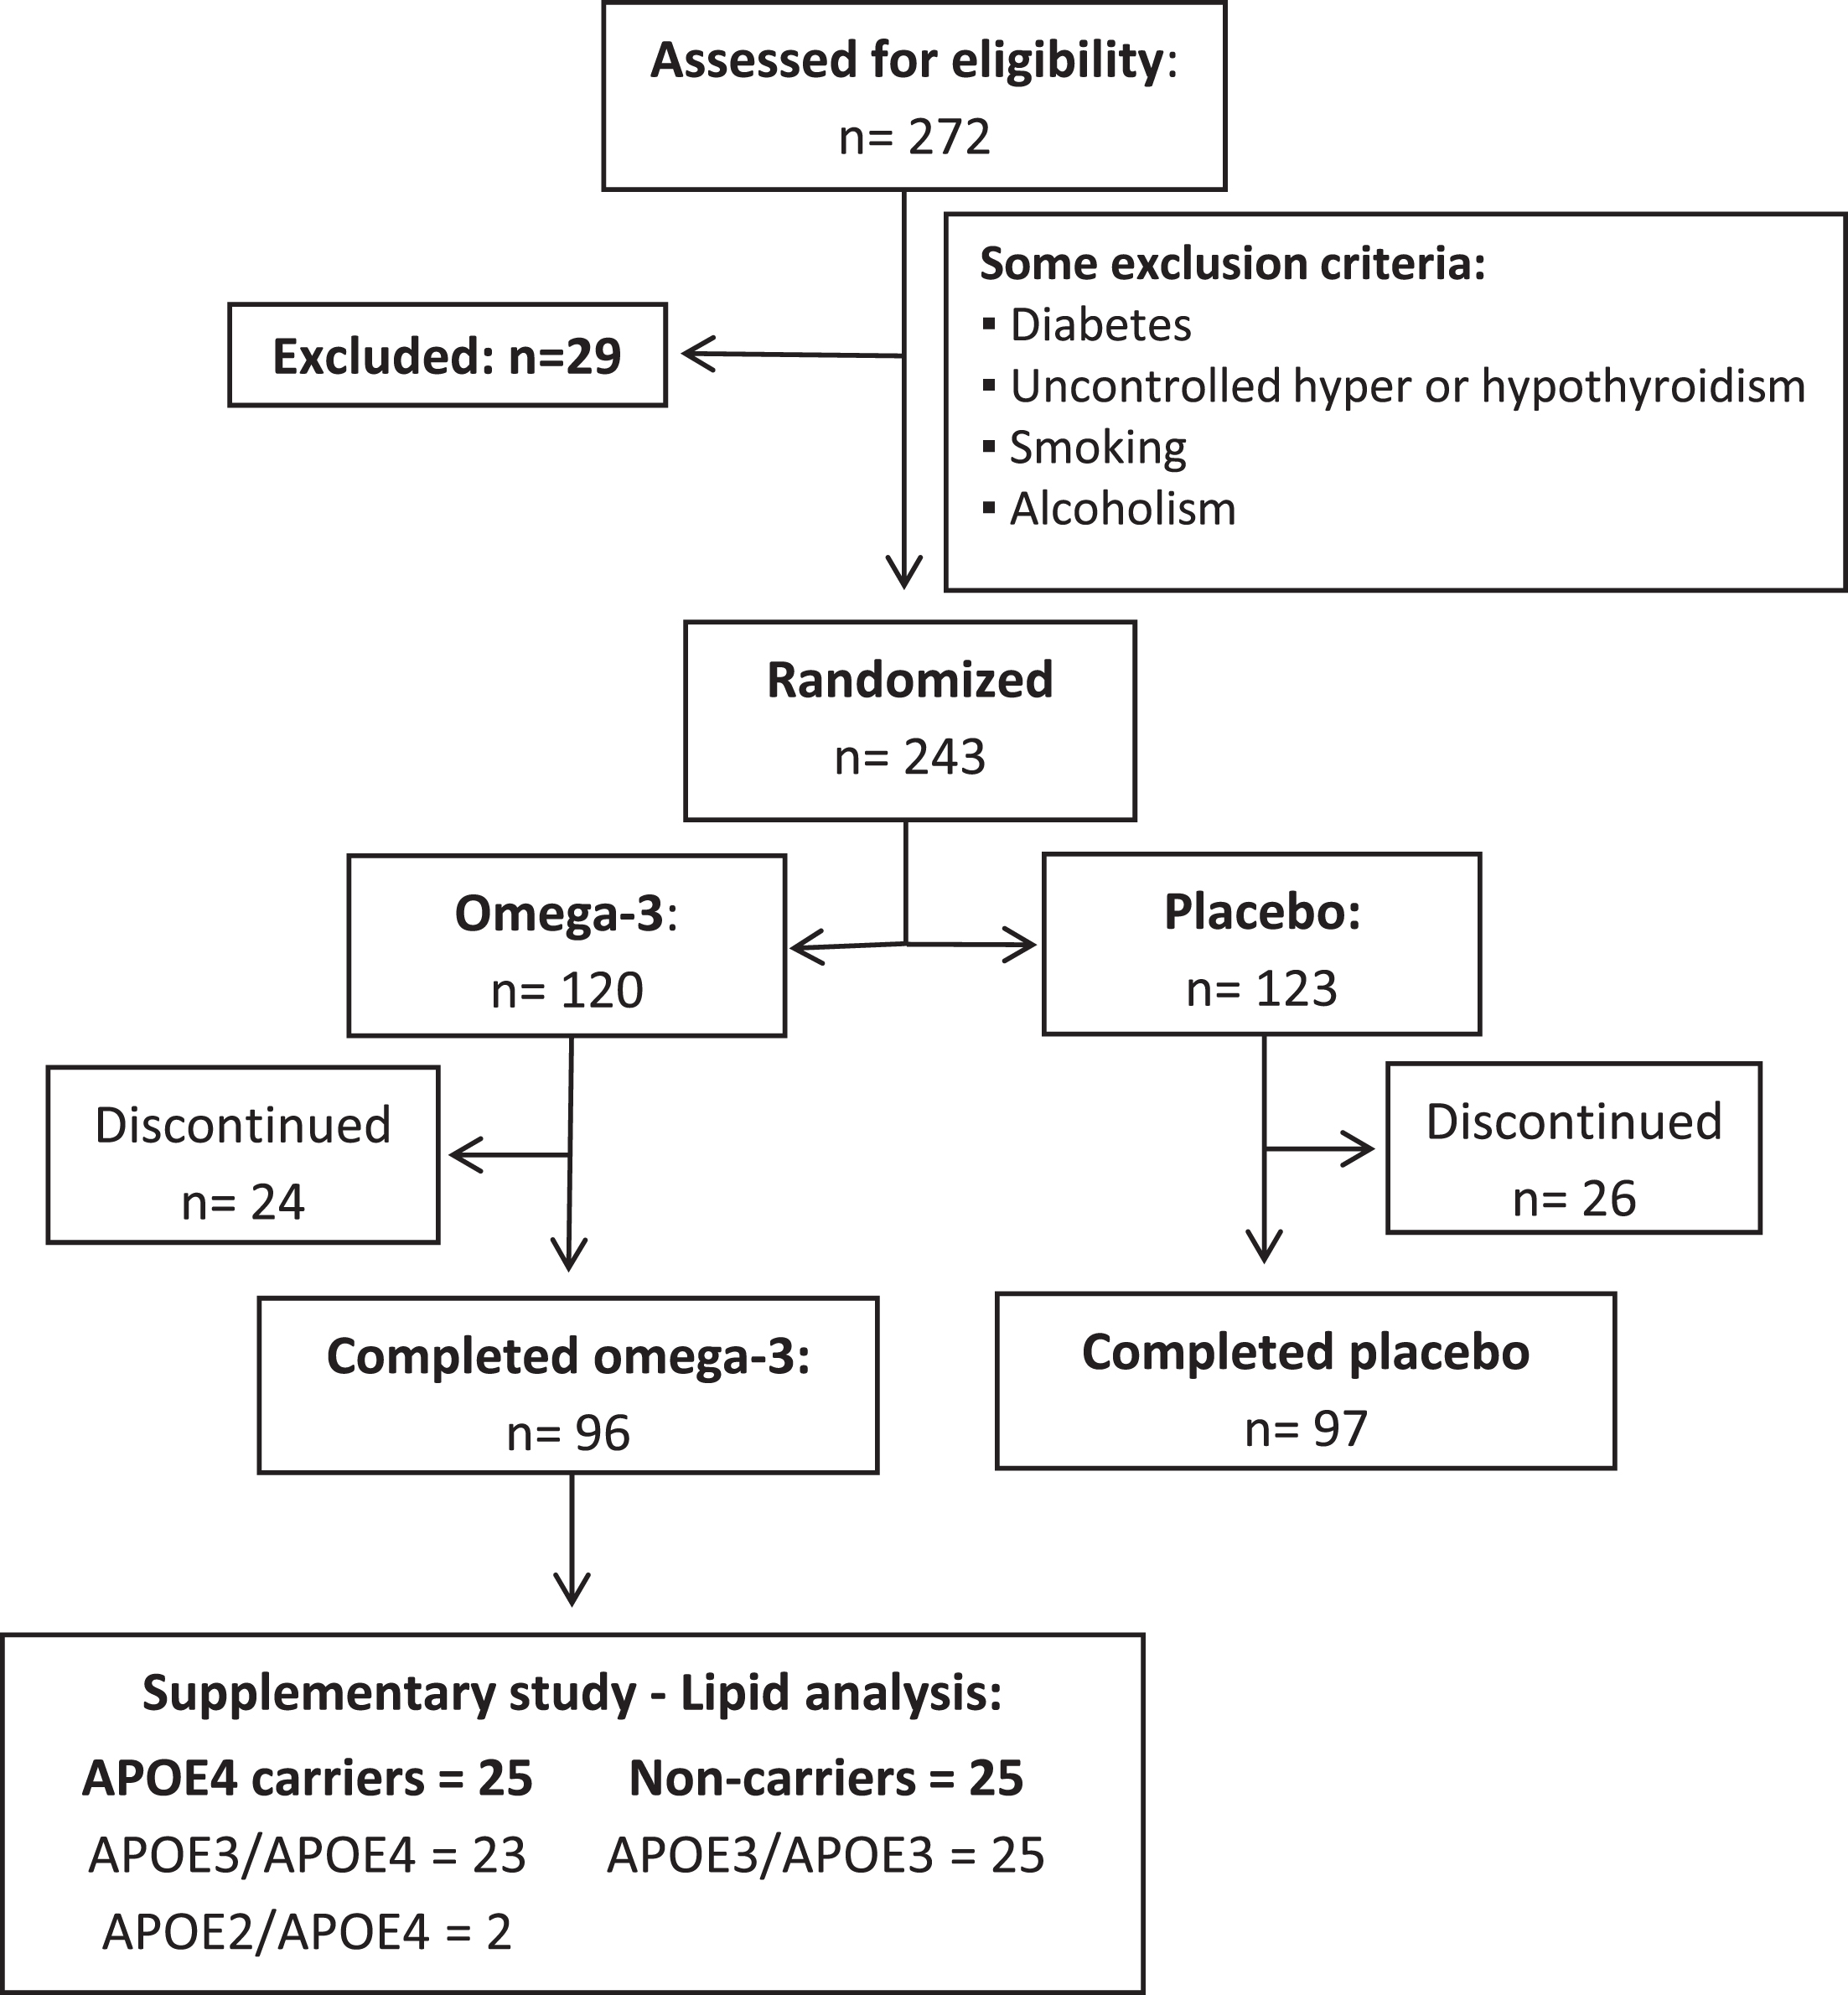
In the main randomized controlled clinical study, recruitment extended from August 2012 to September 2016 and 272 participants were recruited from Sherbrooke and its surroundings (Fig. 1). Twenty-nine participants did not meet the inclusion criteria, were excluded from the study, or were no longer interested in participating. The remaining participants (n = 243) were randomized either to the placebo group (n = 123) or the omega-3 fatty acid group (n = 120). Before the completion of the study, 26 participants from the placebo group discontinued, leaving 97 participants who completed the placebo group. From the omega-3 fatty acid group, 24 participants discontinued the study, leaving 96 participants who completed the study as previously described [12]. In the current study, 25 APOE4 carriers and non-carriers who were in the omega-3 fatty acid supplement group were matched. Within the carrier group, there were 23 with the APOE3:APOE4 genotype, 2 with the APOE2:APOE4 genotype and 0 with the APOE4/APOE4 genotype. The non-carriers were all APOE3/APOE3. There was not enough statistical power to separate the different carriers of APOE4 into specific APOE4 genotype groups, so they were all included as APOE4 carriers. However, all the statistics were run with and without APOE2:APOE4 carriers and none of the results were changed when removing the two APOE2:APOE4 carriers from the dataset.
Fig. 1
Flowchart of participant recruitment and selection. APOE2 –Epsilon 2 allele of the apolipoprotein E gene; APOE3 –Epsilon 3 allele of the apolipoprotein E gene; APOE4 –Epsilon 4 allele of the apolipoprotein E gene.
Baseline anthropometric measurements were compared between APOE4 carriers and matched non-carriers (Table 1). When comparing APOE4 carriers and non-carriers, there was no significant difference in the number of females and males, age, BMI, weight, height, concentration of blood glucose, TG, total cholesterol, high-density lipoprotein cholesterol, low-density lipoprotein cholesterol, and vitamin B12.
Table 1
Baseline characteristics of APOE4 carriers and non-carriers
| APOE4+ | APOE4- | p value | |
| N | 25 | 25 | |
| % of females | 68% | 68% | >0.9999 |
| Age (years) | 50±3.4 | 51±3.2 | 0.8285 |
| BMI (kg/m2) | 25.92±0.96 | 25.78±0.80 | 0.9120 |
| Weight (kg) | 70.56±2.82 | 70.47±2.47 | 0.9814 |
| Height (cm) | 164.91±1.50 | 165.27±1.86 | 0.8810 |
| Glucose (mmol/L) | 4.40±0.10 | 4.56±0.11 | 0.3699 |
| TG (mmol/L) | 0.99±0.11 | 0.96±0.10 | 0.8739 |
| Total cholesterol (mmol/L) | 5.54±0.21 | 5.02±0.21 | 0.1871 |
| HDL –cholesterol (mmol/L) | 1.67±0.09 | 1.64±0.09 | 0.8483 |
| LDL –cholesterol (mmol/L) | 3.23±0.16 | 2.94±0.19 | 0.1110 |
Data presented as the mean±SEM. TG – Triglyceride; HDL – High-density lipoprotein; LDL – low-density lipoprotein; BMI – Body mass index.
Primary outcome: There was a diet effect for LPC where the DHA and EPA concentrations were 1 times and > 3 times higher post- vs. pre-supplementation (p < 0.0001, Figs. 2 and 3). In FFA, the DHA concentration was 67% higher and the EPA concentration was 2.6 times higher post-supplementation compared to pre-supplementation (p = 0.0002 and p < 0.0001, respectively). There was no genotype x supplement interaction or a genotype effect for LPC and FFA. There was a genotype trend for ARA concentration in LPC (Supplementary Figure 1).
Fig. 2
DHA concentrations in APOE4 carriers (black) and non-carriers (white) in different plasma lipid compartments were compared pre- and post-supplementation. LPC: There was a diet effect (p < 0.0001), where the DHA concentration was higher post-supplementation than pre-supplementation. FFA: There was a diet effect (p = 0.0002), where the DHA concentration was higher post-supplementation than pre-supplementation. TG: There was a diet effect (p < 0.0001) where the DHA concentration was higher post-supplementation than pre-supplementation. CE: There was a diet effect (p < 0.0001) where the DHA concentration was higher post-supplementation than pre-supplementation. There was a genotype trend where the DHA concentration was higher in APOE4 carriers than in non-carriers. There was no significant genotype effect or genotype by diet interaction in these lipid compartments. Data are presented as the mean±SEM. The Mann–Whitney test was used to compare the DHA medians between APOE4 carriers and non-carriers. The Wilcoxon test was used to compare the DHA medians pre- and post-supplementation. APOE4 –Epsilon 4 allele of the apolipoprotein E gene; CE –Cholesteryl ester; DHA –Docosahexaenoic acid; FFA –Free fatty acid; LPC –Lysophosphatidylcholine; TG –Triglyceride.
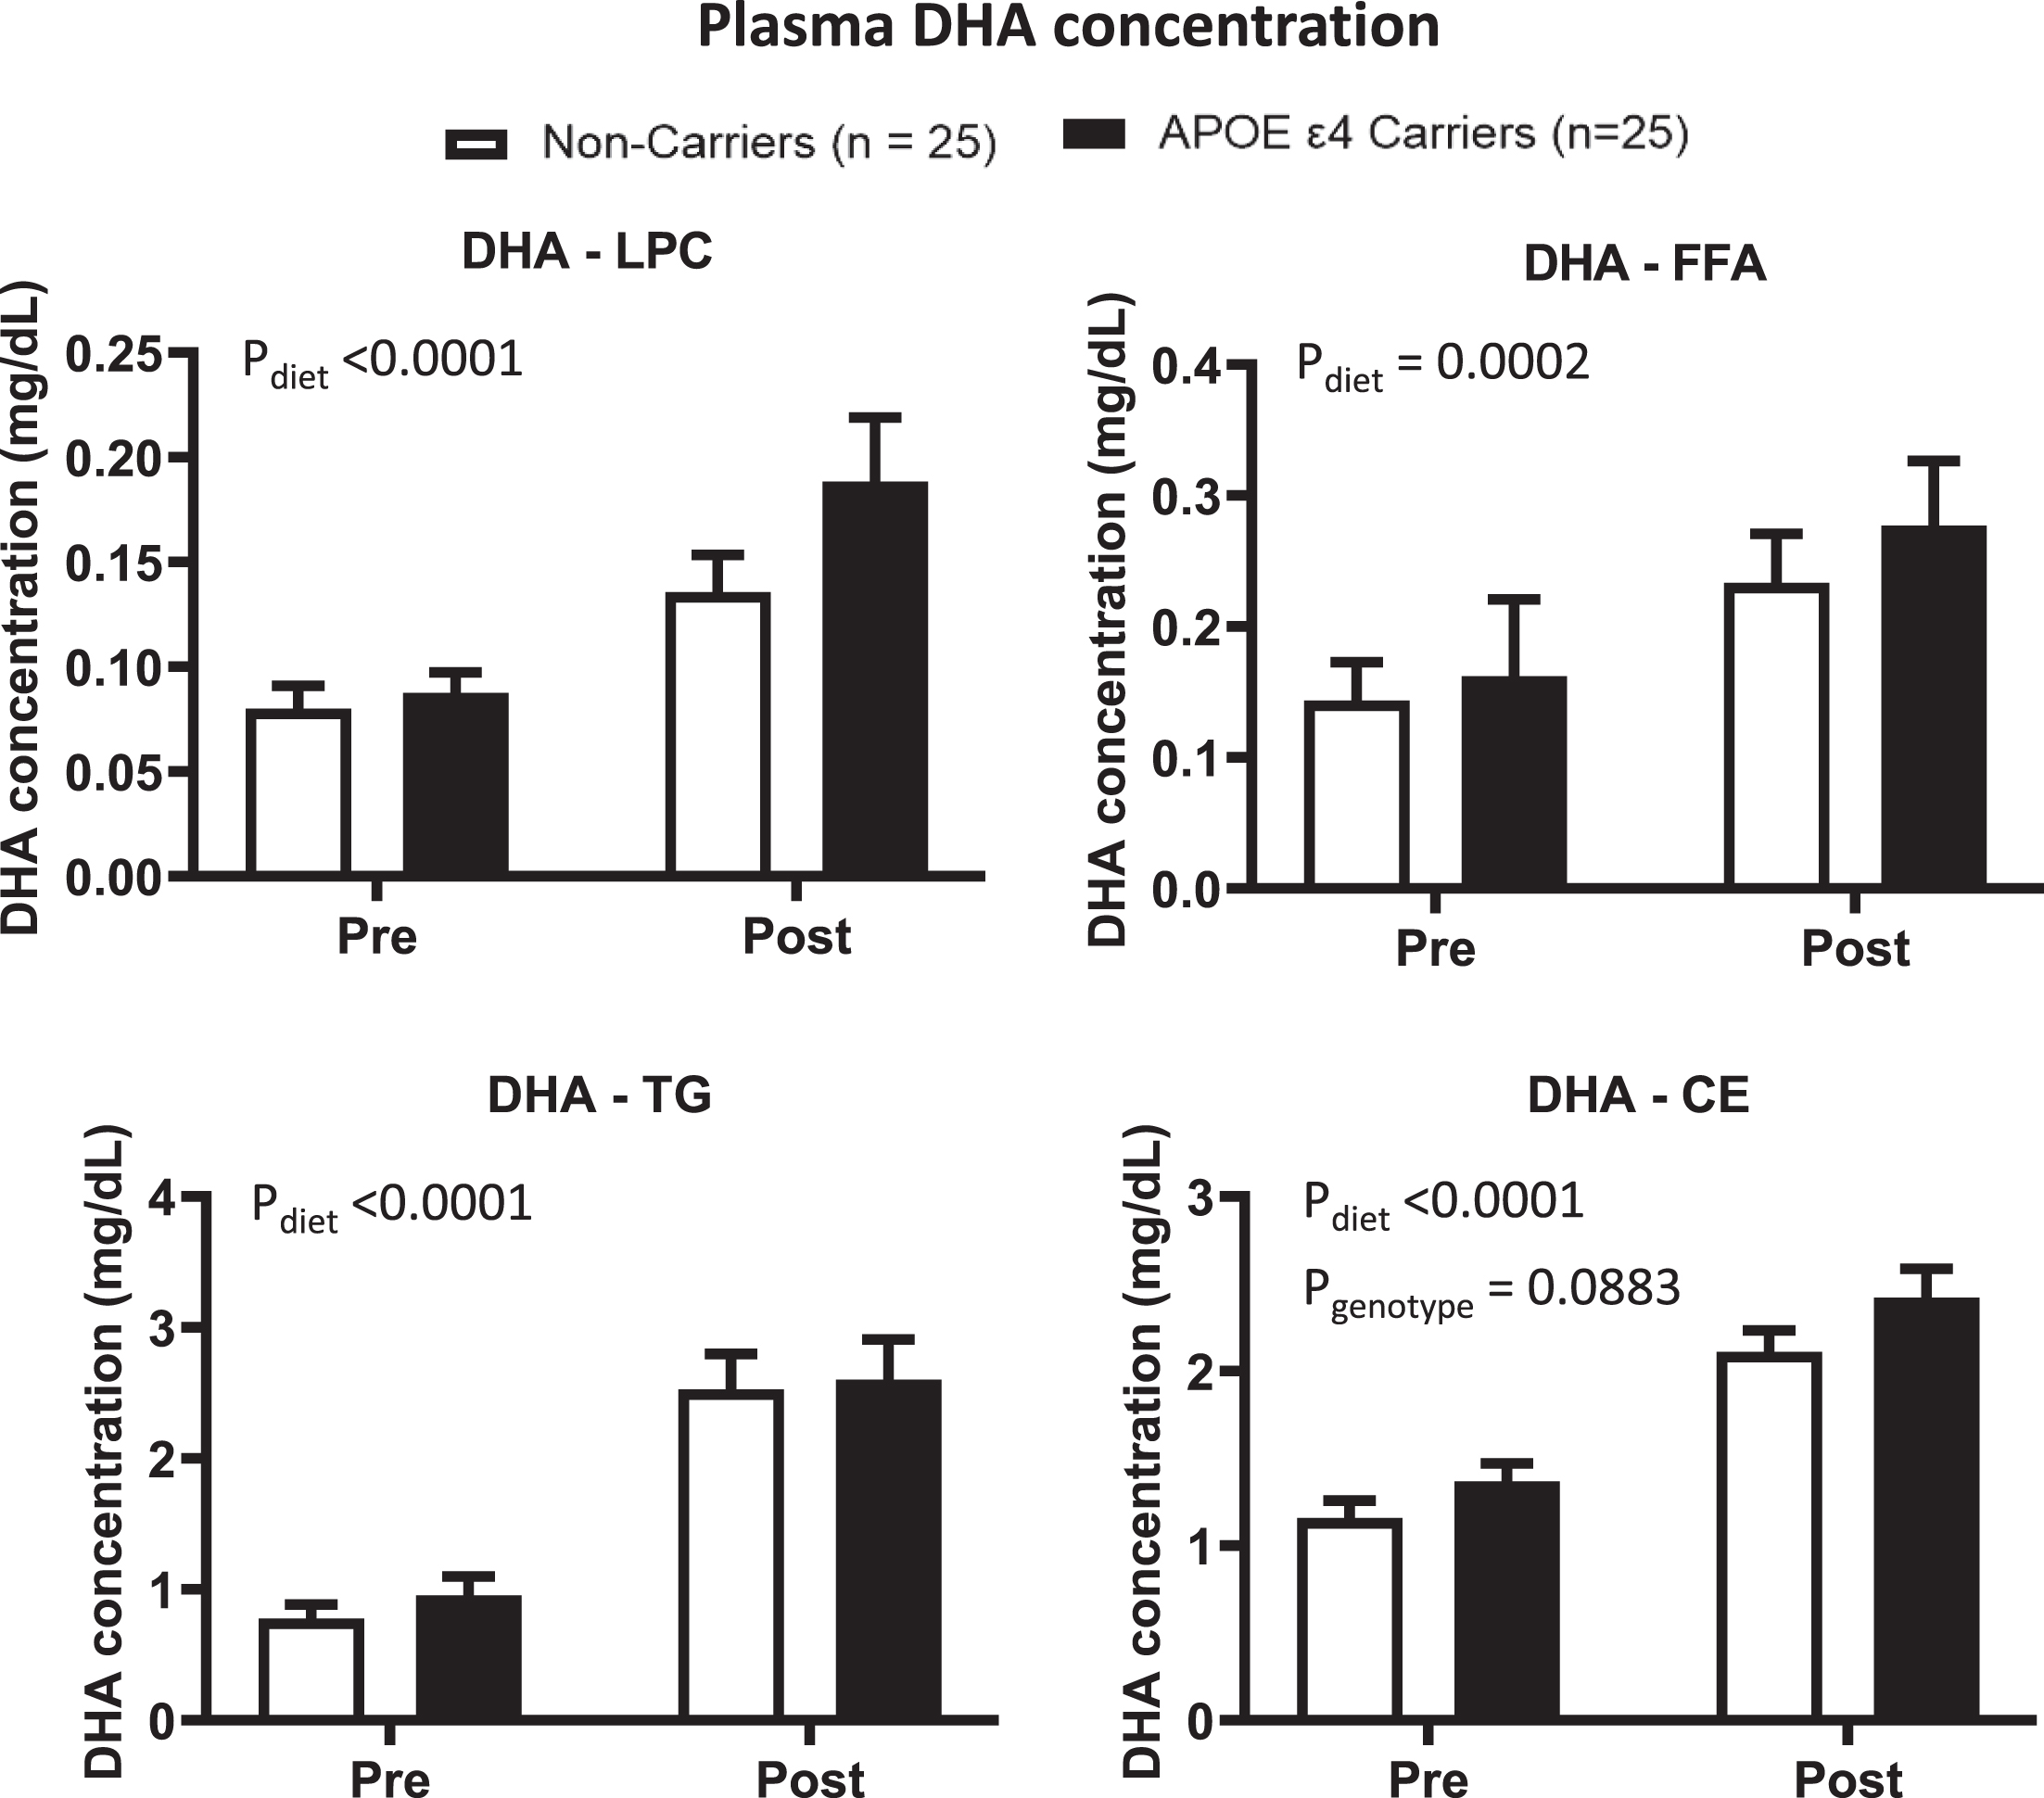
Fig. 3
In APOE4 carriers (black) and non-carriers (white), EPA concentrations in different plasma lipid compartments were compared pre- and post-supplementation. LPC: There was a diet effect (p < 0.0001) where the EPA concentration was higher post-supplementation than pre-supplementation. FFA: There was a diet effect (p < 0.0001) where the EPA concentration was higher post-supplementation than pre-supplementation. TG: There was a diet effect (p < 0.0001) where the EPA concentration was higher post-supplementation than pre-supplementation. CE: There was a diet effect (p < 0.0001) where the EPA concentration was higher post-supplementation than pre-supplementation. There was no genotype effect or genotype by diet supplementation in these lipid compartments. Data are presented as the mean±SEM. The Mann–Whitney test was used to compare the EPA medians between APOE4 carriers and non-carriers. The Wilcoxon test was used to compare the EPA medians pre- and post-supplementation. APOE4 –Epsilon 4 allele of the apolipoprotein E gene; CE –Cholesteryl ester; EPA –Eicosapentaenoic acid; FFA –Free fatty acid; LPC –Lysophosphatidylcholine; TG –Triglyceride.
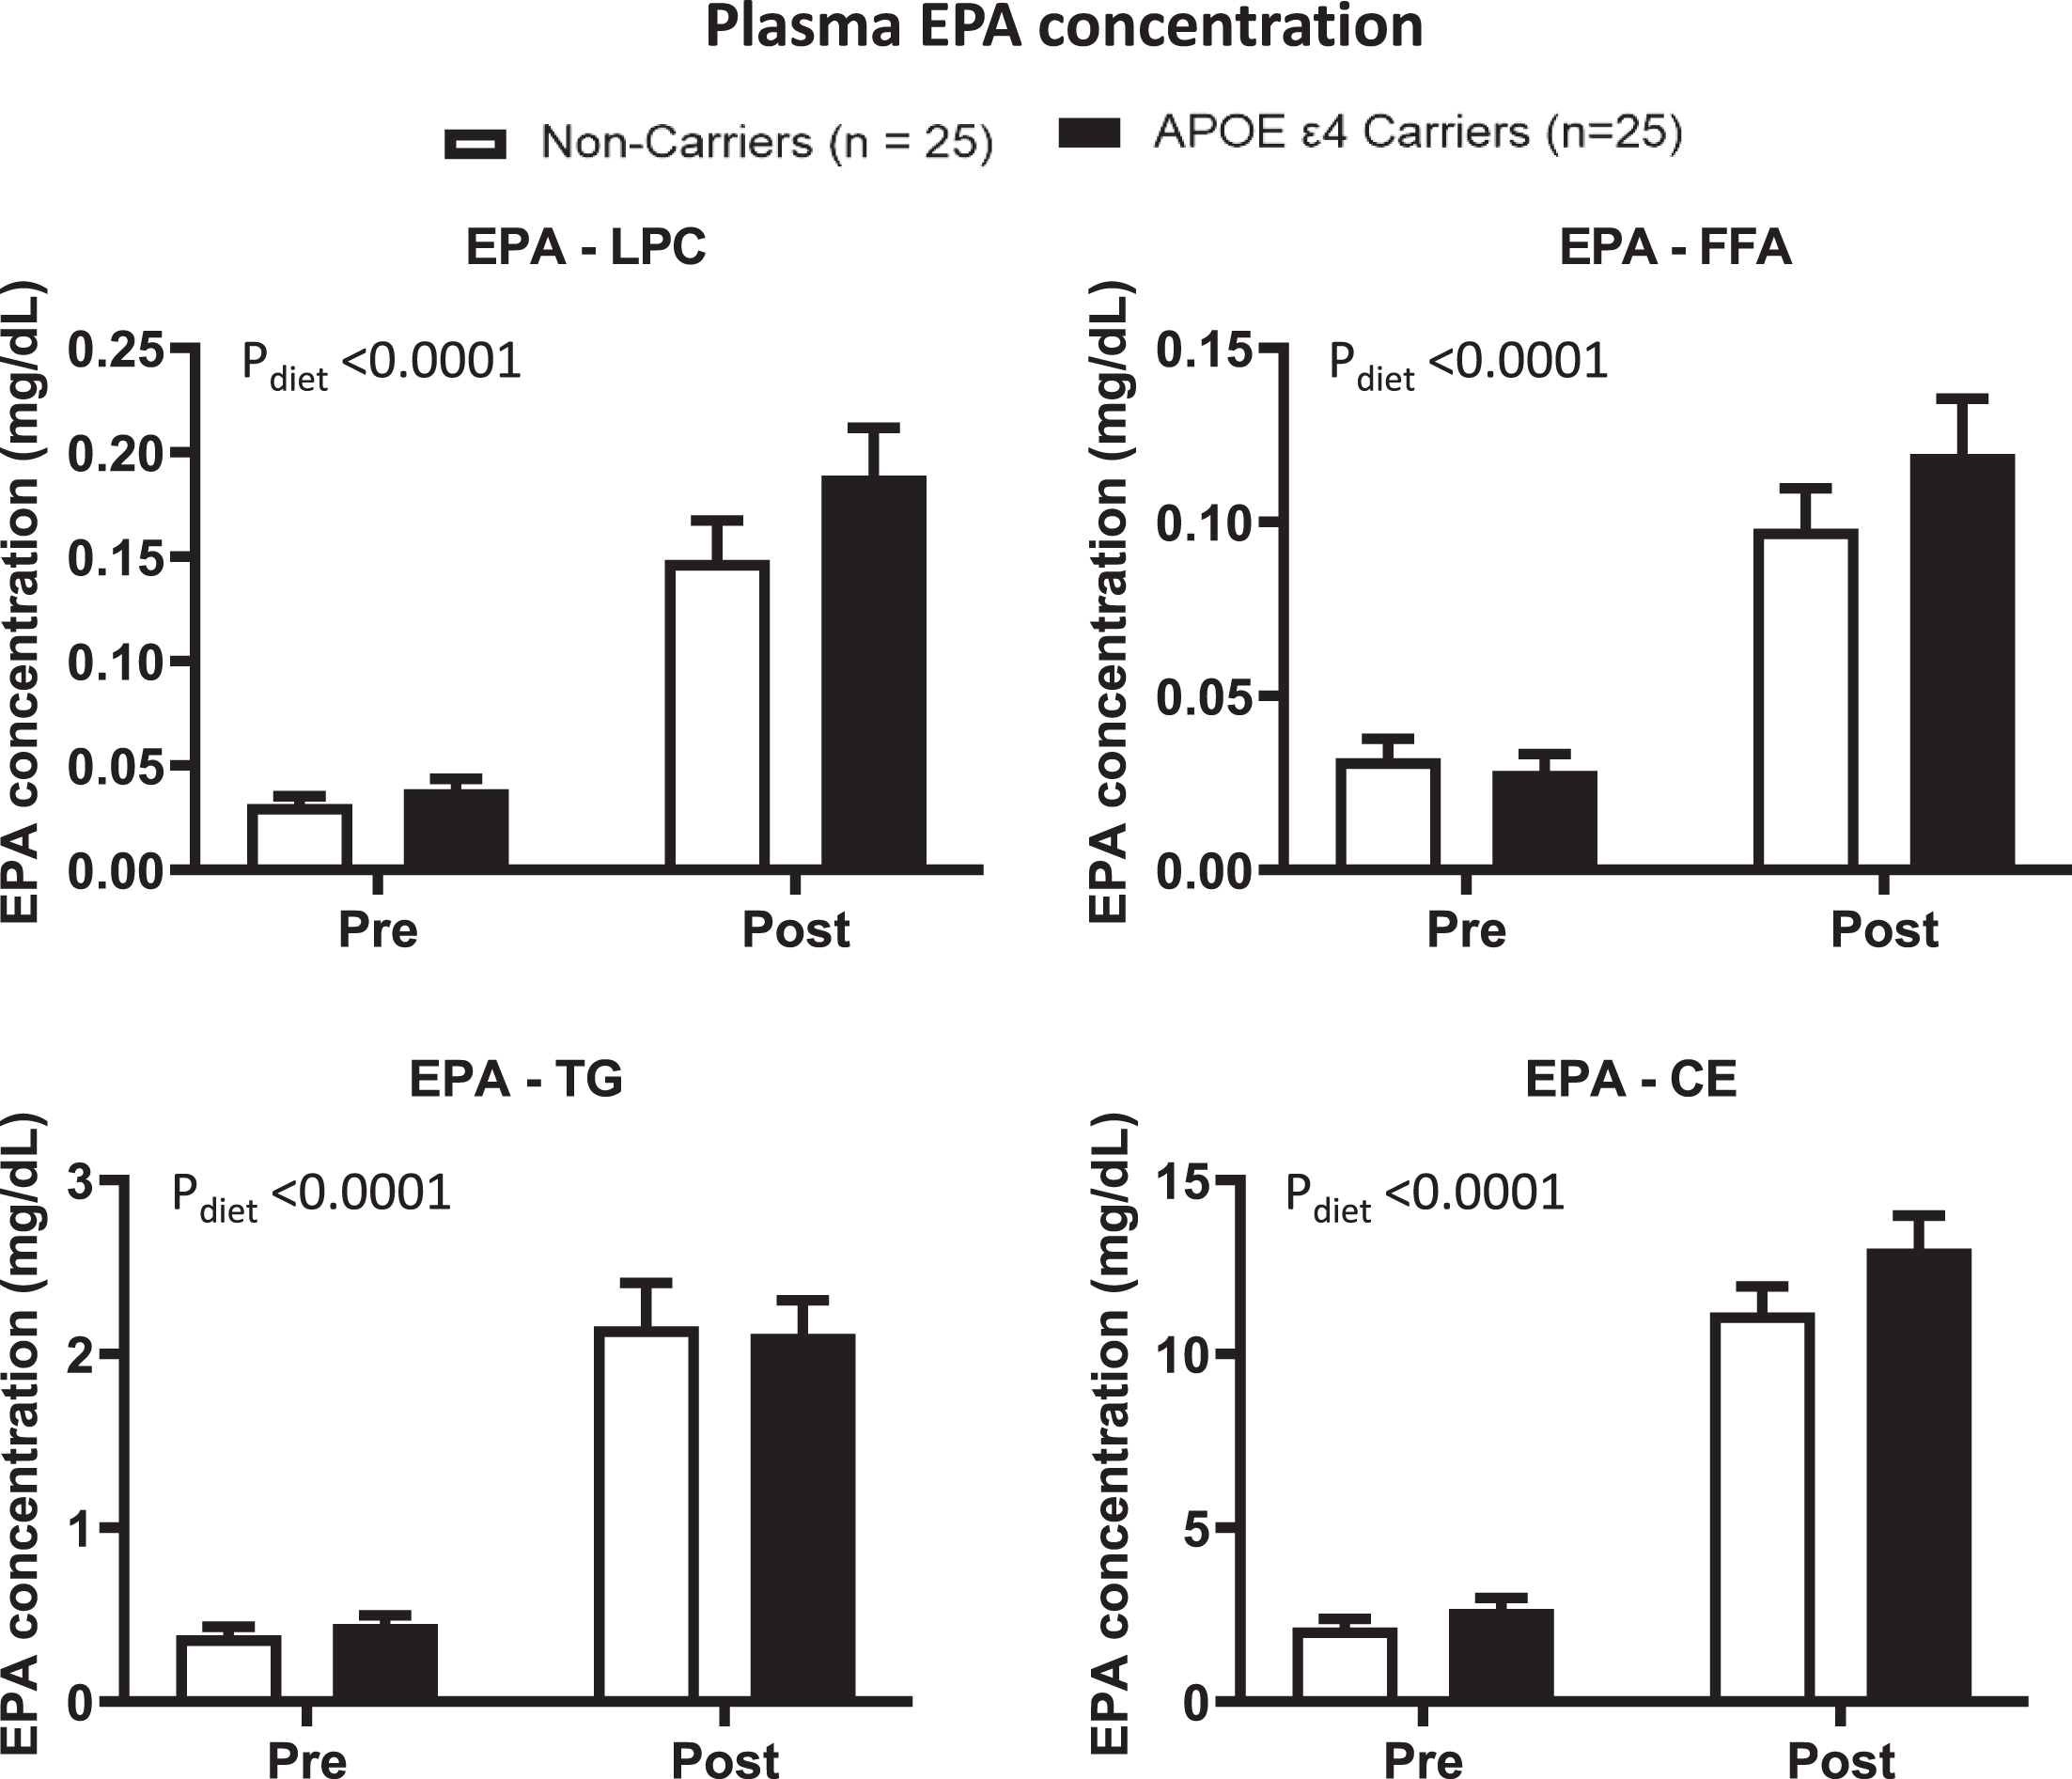
Secondary outcome: DHA and EPA concentrations in TG increased by 2- and 4-fold, respectively, post- vs. pre-supplementation (p < 0.0001, Figs. 2 and 3). In CE, the DHA concentration was 0.8 times higher, and the EPA concentration was 4 times higher compared to pre-supplementation (p > 0.0001). There was no significant genotype x diet interaction or genotype effect for DHA and EPA in these lipid compartments. However, there was a genotype trend toward a higher DHA in CE in APOE4 carriers than in non-carriers (p = 0.0883). There was a genotype effect for ARA concentration in CE, where APOE4 carriers had higher concentrations than non-carriers (Supplementary Figure 1).
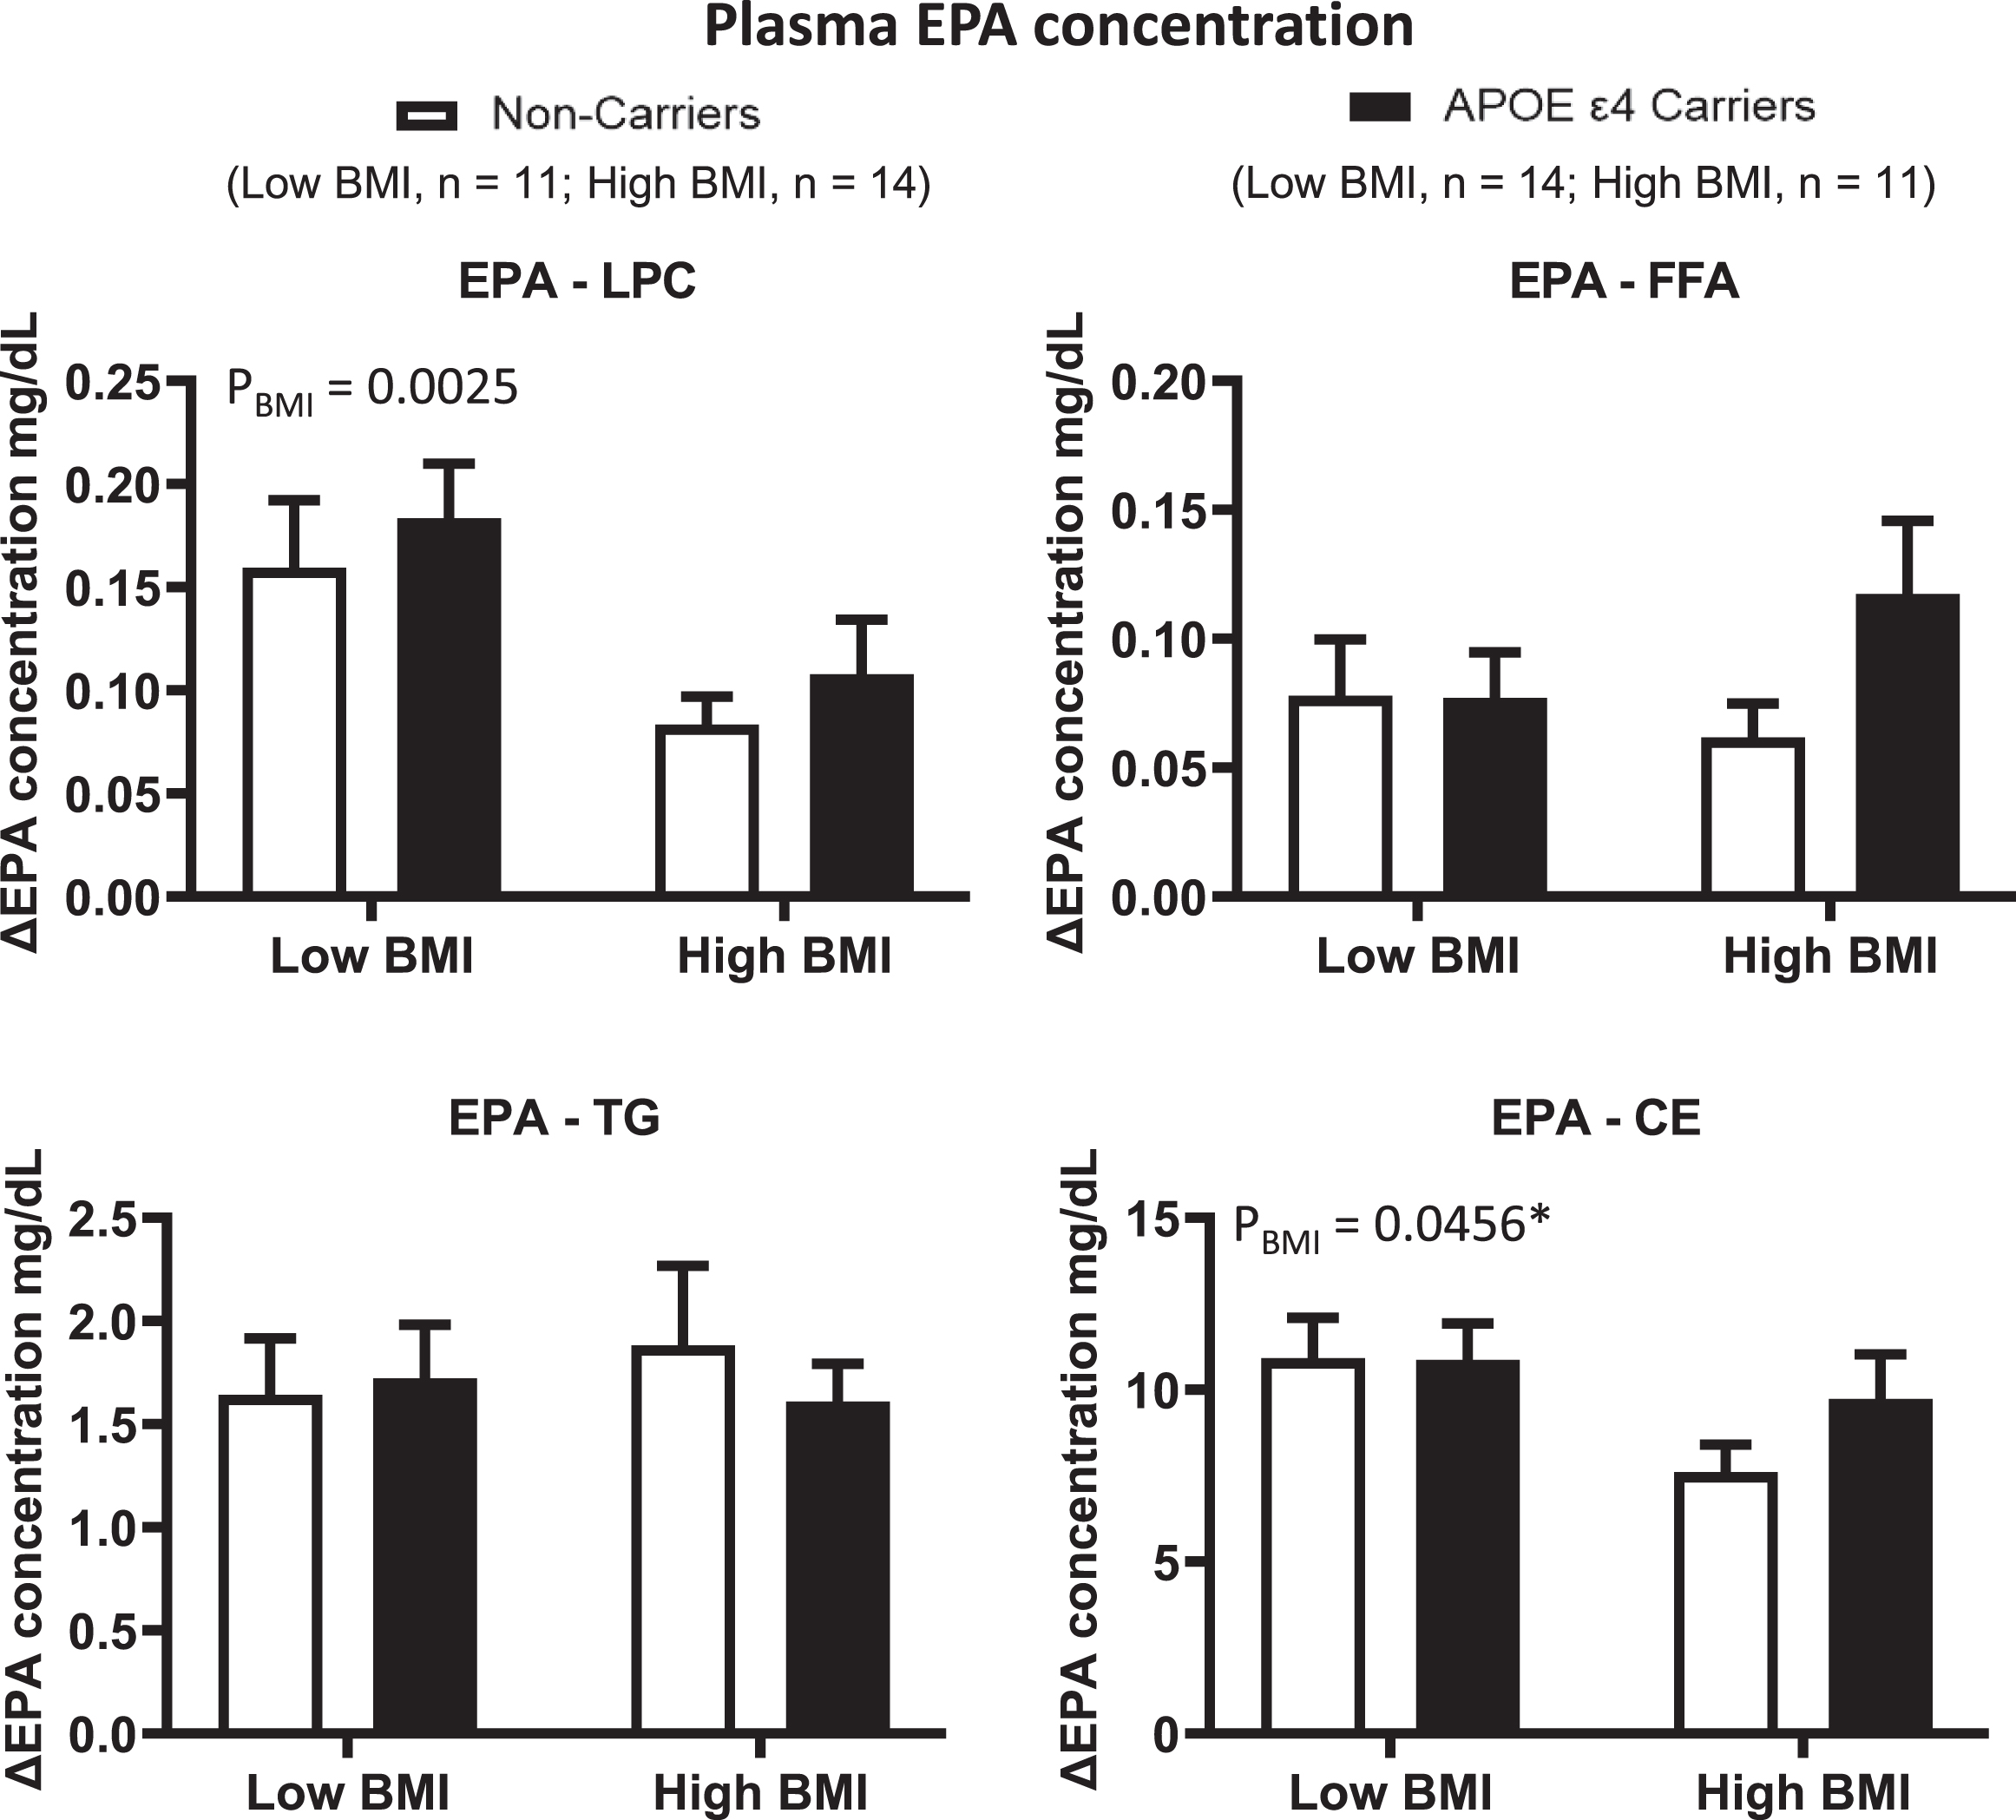
Since a previous study from our group suggested a BMI x genotype interaction in the response to omega-3 fatty acid supplementation, we then separated our two APOE4 genotype groups according to the median BMI. There was no BMI x genotype interaction of ΔDHA and ΔEPA in the LPC, FFA and TG plasma compartments (Figs. 4 and 5). There was, however, a BMI effect for ΔDHA and ΔEPA in LPC where the low BMI group had, respectively, 168% and 79% higher increases than the high BMI group (p = 0.0211 and p = 0.0025, respectively). There was no BMI or genotype effect for ΔDHA and ΔEPA in the FFA and TG plasma compartments. In CE, there was a BMI by genotype interaction trend for ΔDHA (p = 0.0585), where non-carriers from the low BMI group had an 83% greater increase than non-carriers from the high BMI group. In the APOE4 carriers, the increase in the low BMI group was 14% lower than that in the high BMI group. There was also a BMI effect for ΔEPA in CE, where the low BMI group had a 26% greater increase than the high BMI group (p = 0.0456). There was no genotype or BMI effect for the ΔARA concentration in the LPC, FFA, TG or CE plasma lipid compartments (Supplementary Figure 2).
Fig. 4
ΔDHA concentrations were compared in different plasma lipid compartments based on APOE4 genotype and BMI. Low BMI: n = 11 non-carriers; n = 14 APOE4 carriers. High BMI: n = 14 non-carriers; n = 11 APOE4 carriers. LPC: There was a BMI effect where ΔDHA was lower in the high BMI group than in the low BMI group. FFA: There is no BMI nor genotype effect for ΔDHA. TG: There is no BMI nor genotype effect for ΔDHA. CE: There is no BMI or genotype effect; however, there is a trend for BMI by genotype interaction. Data are presented as the mean±SEM. The Mann–Whitney test was used to compare the ΔDHA medians between genotypes and BMI groups. APOE4 –Epsilon 4 allele of the apolipoprotein E gene; BMI –Body mass index; CE –Cholesteryl ester; DHA –Docosahexaenoic acid; FFA –Free fatty acid; LPC –Lysophosphatidylcholine; TG –Triglyceride.
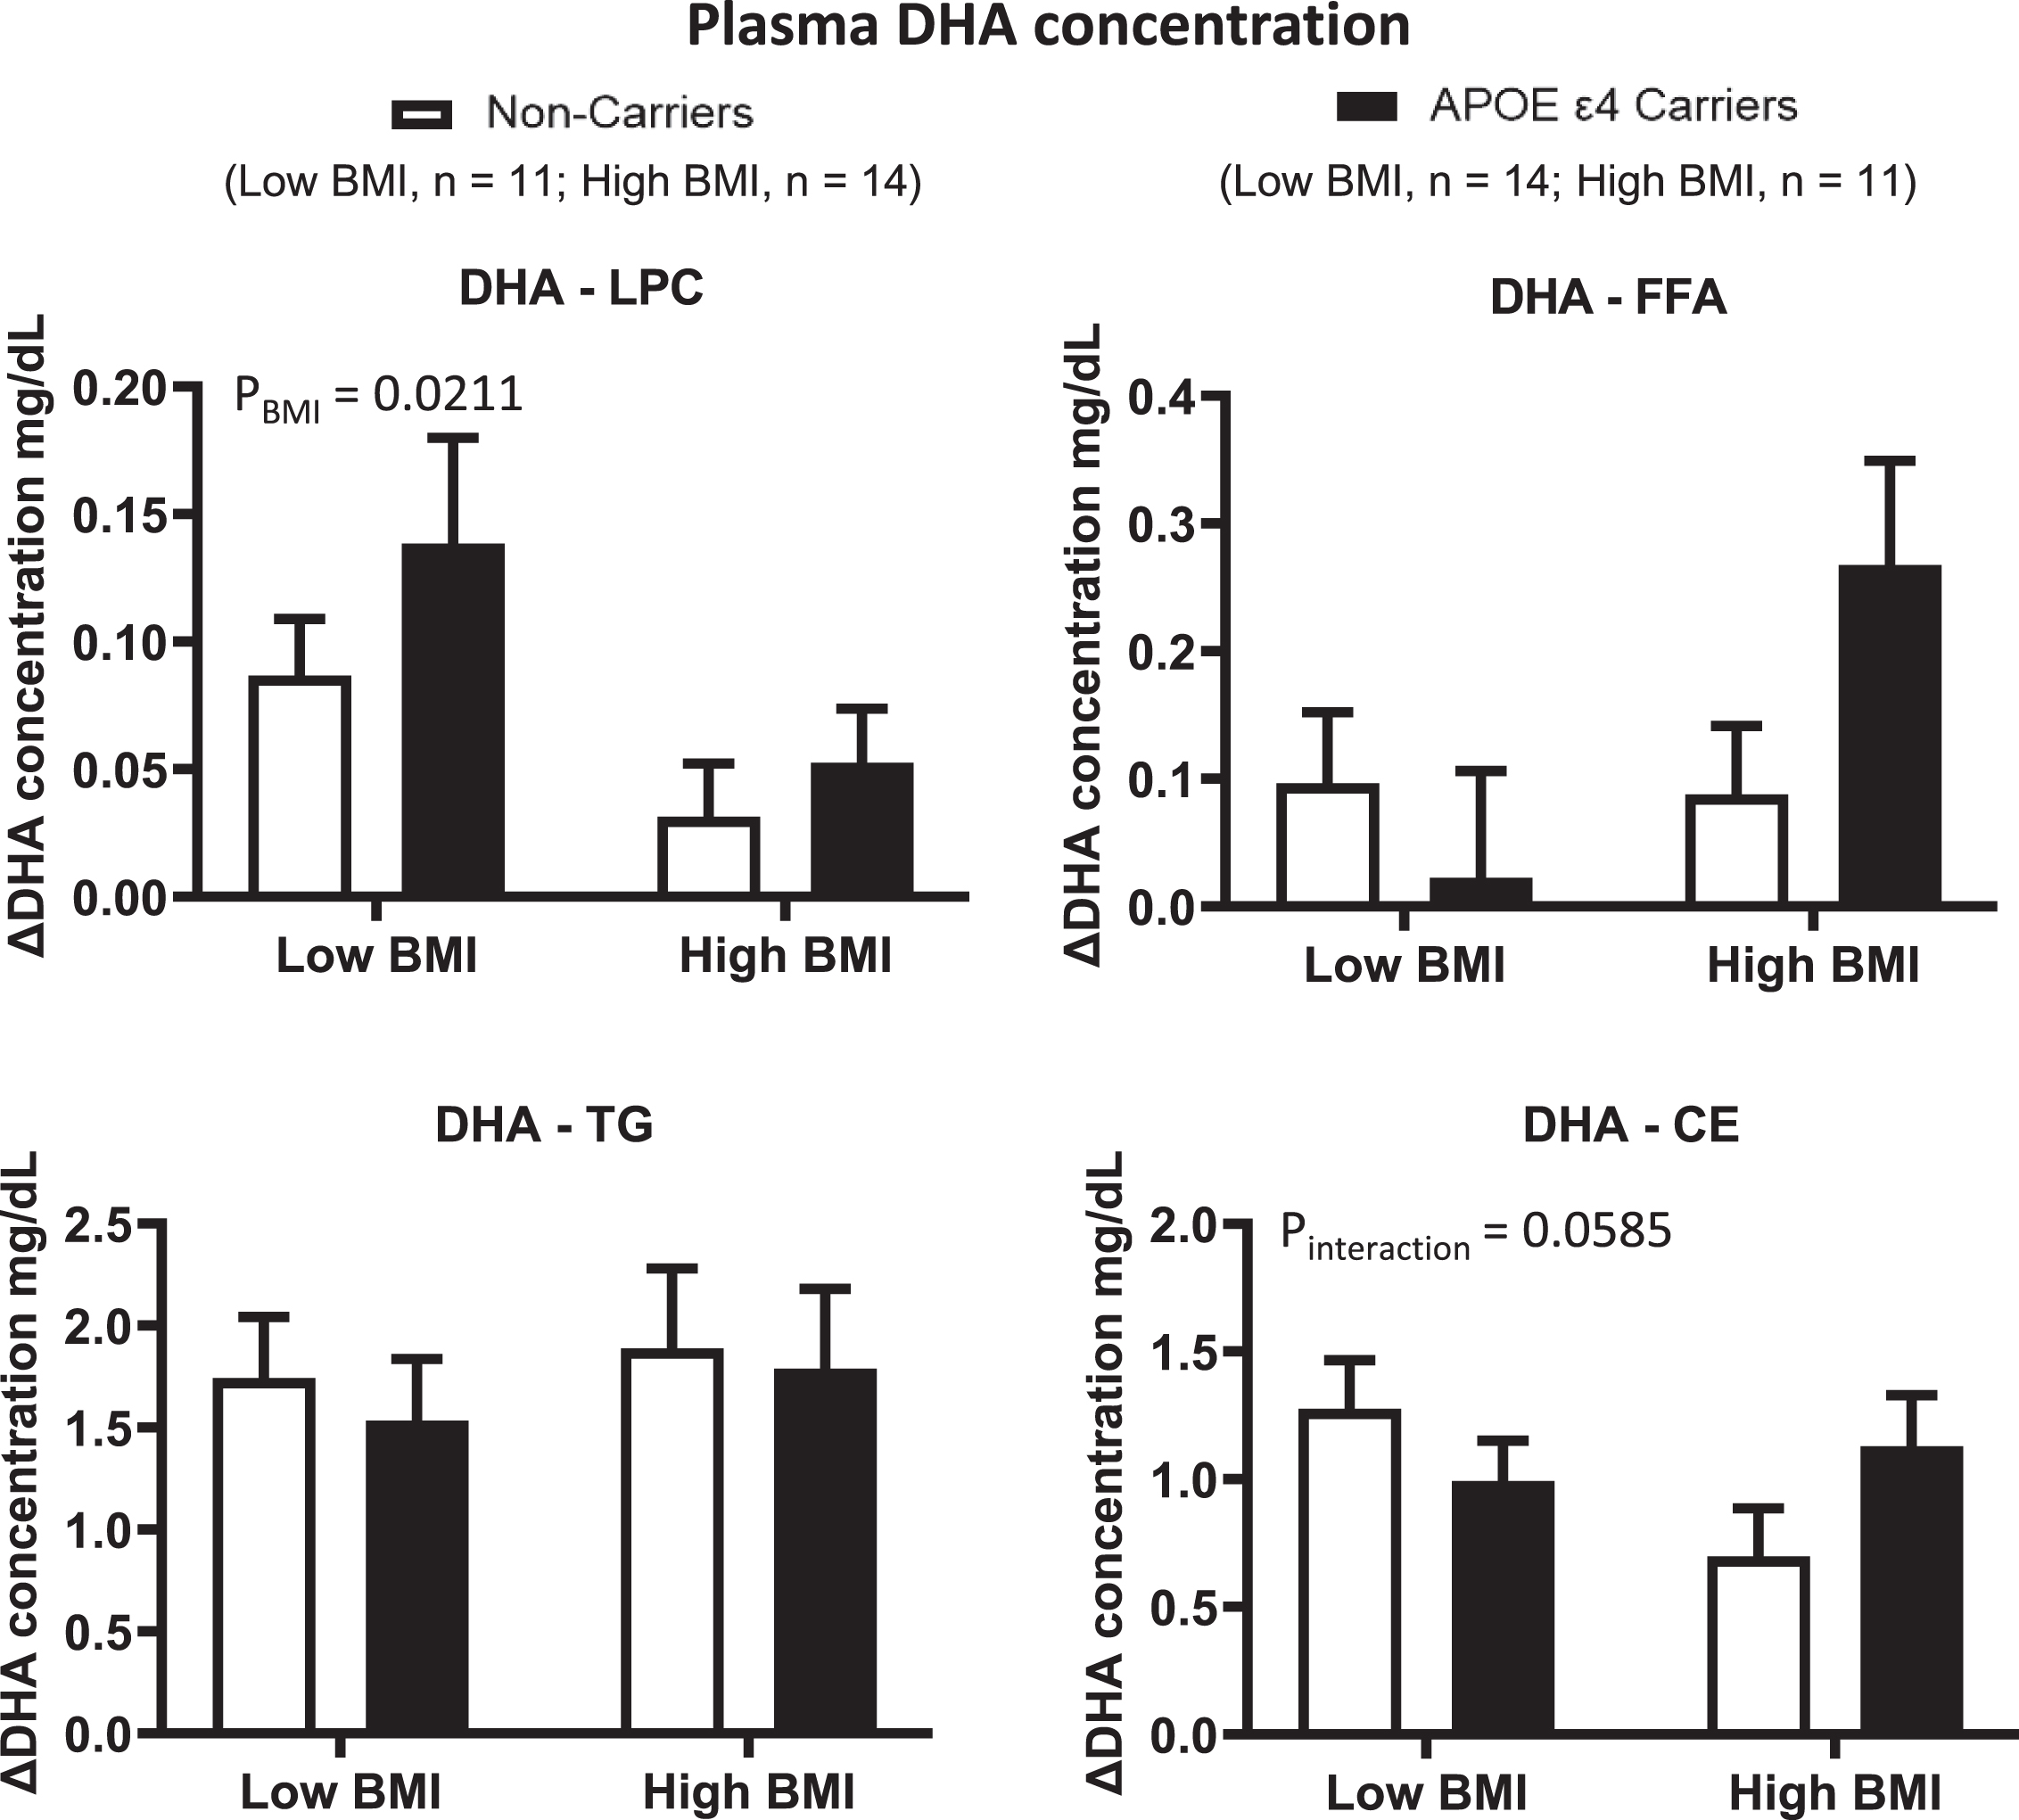
Fig. 5
ΔEPA concentrations were compared in different plasma lipid compartments based on the APOE4 genotype and BMI. Low BMI: n = 11 non-carriers; n = 14 APOE4 carriers. High BMI: n = 14 non-carriers; n = 11 APOE4 carriers. LPC: There was a BMI effect where ΔEPA was lower in the high BMI group than in the low BMI group. FFA: There is no BMI nor genotype effect. TG: There is no genotype nor BMI effect. CE: There was a BMI effect where ΔEPA was lower in the high BMI group than in the low BMI group. There is no genotype effect. Data are presented as the mean±SEM. The Mann–Whitney test was used to compare ΔEPA medians in TG. 2-way ANOVA was used to compare ΔEPA means in CE. APOE4 –Epsilon 4 allele of the apolipoprotein E gene; BMI –Body mass index; CE –Cholesteryl ester; EPA –Eicosapentaenoic acid; FFA –Free fatty acid; LPC –Lysophosphatidylcholine; TG –Triglyceride.
4Discussion
Our hypothesis stipulated that in APOE4 carriers, omega-3 fatty acids are less packaged in LPC and FFA compared to non-carriers after an omega-3 fatty acid supplementation for six months. We showed that this hypothesis is rejected. Plasma DHA and EPA concentrations were similar in LPC and FFA between APOE4 carriers and non-carriers pre- and post-supplementation with omega-3 fatty acids. Additionally, the DHA and EPA concentrations did increase in both APOE4 carriers and non-carriers in these lipid compartments post-supplementation compared to pre-supplementation. Therefore, technically, more DHA and EPA were available to reach the brain by being packaged in the appropriate compartments. To our knowledge, this is the first study to report the concentrations of DHA and EPA in the plasma LPC compartment pre- and post-supplementation.
Previous studies reported DHA and EPA concentrations in PC but not in the LPC plasma compartment [17]. The difference between a PC and an LPC is one extra fatty acid attached to the glycerol backbone of PC [18, 19]. PC is the main phospholipid found in the plasma, and LPC is present in lower quantities [20]. The absence of a genotype by diet interaction in the LPC and FFA plasma compartment was surprising to us since our group previously reported a gene-by-diet interaction of EPA in plasma FFA and DHA in plasma TG [7]. The difference between the two studies is mainly the number of carriers (n = 25 here and n = 8 in [7]), supplementation length (six months here vs. 6 weeks in [7]), age (50 y old here vs. 38 y old in the other study) and lower glucose and plasma TG levels in this study [7].
In this study, we reported the fatty acid profile in the LPC since this is the most efficient form to cross the BBB, whereas it is thought that PC requires the hydrolysis of one fatty acid to be converted into LPC to cross the BBB using the MFSD2A transporter [21]. On the other hand, FFA is quantitively the most important plasma pool of fatty acids readily available to cross the BBB [9]. We previously evaluated how much free DHA crosses the BBB using in situ cerebral perfusion, and we showed lower brain DHA rates of entry in 4-month-old mice knock-in for the human APOE4 genotype compared to APOE2 and APOE3 mice [22]. However, a study by Yassine et al. [23] examined the incorporation rate of [1–11C]-DHA in different regions of the brain using positron emission tomography in healthy young adults (n = 22; average age 35 years). They reported that in APOE4 carriers, the average incorporation rate of radiolabeled DHA in the global gray matter was 16% higher than that in non-carriers. Additionally, the incorporation rate was higher in many brain regions in these young APOE4 carriers, and the rates were not modified by age (even though only four participants were above the age of 50 years) [23]. Hence, one could question whether these findings seen in young APOE4 carriers might differ as they get older since we previously reported that plasma EPA and DHA kinetics in older adults are modified [24]. However, here, we investigated whether age was correlated with the plasma DHA and EPA increase in LPC and FFA after supplementation, and there was no correlation (data not shown). This is perhaps because the age range of participants in this study was small (±3 years). This result is important since it suggests that APOE4 carriers aged less than 50 years old, and perhaps older too, could increase their DHA and EPA after an omega-3 fatty acid supplement to the same level as non-carriers in the plasma compartments that the brain can take-in. Whether this increase EPA and DHA plasma pool reaching the brain can benefit cognition in APOE4 since plasma omega-3 are associated with better general cognition and lower risk of developing Alzheimer’s disease and all-cause dementia [25].
The LPC results of this study can somehow be compared to the results of Donadio et al.; however, they looked at total PL in a general population. They gave a similar omega-3 supplement dose (1.47 g of DHA and 1.88 g EPA) for six months, as in our study. They reported that the relative % of DHA and % of EPA in plasma PL were 213% higher post-supplementation than pre-supplementation [26]. In another study investigating a general population the association between oily fish (a good source of DHA and EPA) intake and the concentration of DHA and EPA was evaluated [27]. The DHA concentration was 37–280% higher in PC, FFA, CE and TG among those who consumed more than two portions of oily fish per week than among those who did not consume oily fish. With respect to the EPA concentration, those who consumed more than two portions of oily fish had 40–178% higher EPA in PC and TG and CE compared to those who did not consume oily fish [27]. These results were comparable to ours since we reported a similar range of increase after supplementation. Based on these results, it seems that omega-3 plasma levels in FFA and PL can increase in APOE4 carriers when they are supplemented with an omega-3 supplements.
One interesting result we obtained was the effect of BMI on the response to omega-3 fatty acid supplementation (Figs. 3 and 4). In the current study, there was a BMI effect for ΔDHA and ΔEPA in LPC and ΔEPA in CE, where a higher BMI was associated with a lower increase in these fatty acids post-supplementation than the lower BMI group. Another study from our group compared ΔDHA and ΔEPA concentrations in FFAs, total phospholipids, neutral lipids (TG and CE) and total lipids between two BMI groups and the APOE4 genotype [11]. The only compartment we evaluated in that study similar to the current study is the FFA compartment, where they reported that there was no BMI or genotype effect [11]. In the study of Chouinard-Watkins, the diet was different from that provided in the current study. For instance, they provided a high saturated fat diet+3.5 g/d EPA+DHA for eight weeks, whereas in the current study, participants were instructed to follow their usual diet while receiving 3.2 g/d EPA+DHA for six months. Taking omega-3 supplements with a high-fat diet significantly improves the absorption of DHA [28]; therefore, the results between studies are not totally comparable. Lipid metabolism in individuals with a high and low BMI is different. Individuals with a higher BMI store more TG around their organs [27]. This ectopic fat accumulation can generate lipotoxicity that may impair insulin secretion from beta-cells of the pancreas [29, 30]. An excess of FFAs can also impair beta-cells through apoptosis [29]. In the current study, diabetes was an exclusion criterion. Nevertheless, individuals with a BMI > 25.2 kg/m2 had a higher fasting glucose and total TG concentrations than individuals with a BMI < 25.2 kg/m2 (data not shown).
This study has strengths and limitations. One strength is that the samples were collected while the participants were enrolled in a randomized controlled trial and the participants were blinded to their treatment while in the study. We were able to match APOE4 carriers by sex, age and BMI to produce an equal number of APOE4 carriers and non-carriers with similar anthropometric characteristics. Another strength is that we used a very robust method to analyze and separate the plasma lipid compartments since thin layer chromatography is considered the gold standard in the field. The principal advantage of using thin layer chromatography is that it has a low cost compared to high-performance liquid chromatography, although it is labor intense. Additionally, this technique is simple and has good resolution, sensitivity and reproducibility. We also quantified fatty acids in the plasma instead of the classical relative % such that here, we report the actual levels of EPA and DHA pre- and post-supplementation. One limitation of this study is that we did not have enough statistical power to compare men and women. This study was also conducted in a Caucasian population; hence, generalization of our results to other ethnicities is limited. Another limitation was the sample size in the BMI x diet x genotype analysis. Sample size was calculated from data of a previous study [11] and it was sufficiently powered a priori to test this interaction. However, some of our results seem to be more dispersed than those from the previous study [11] and the expected increase in DHA was lower in this study compared to the previous performed by [11]. Therefore, this specific result should be taken with caution and requires further validation with another larger cohort.
5Conclusion
Our results suggest that APOE4 carriers can increase their omega-3 fatty acid levels in the plasma compartment efficient at crossing the BBB. Based on our secondary results, individuals with a BMI higher than 25.2 kg/m2 had a lower DHA and EPA increase is some blood lipid compartment compared to those with a BMI less than 25.2 kg/m2.
Acknowledgments
Pauline Léveillé held a post-doctoral fellowship from the Fonds de la Recherche du Québec - Santé (FRQ-S); Mélanie Plourde holds a salary award from the Canadian Institutes of Health Research and FRQ-S, as well as a chair on lipid metabolism during aging funded by the Medical Research Center of Université de Sherbrooke. The authors thank Annick Vachon, Christine Brodeur-Dubreuil, and Audrey Perreault for their valuable assistance. PL and RCW recruited the participants and were highly involved in the day-to-day trial; JB and AV performed the lipid analysis at the Research Center on Aging. JB and MP planned the statistical analysis. JB performed the statistical analysis. JB, MAH, AV, PL, RCW, PP, and MP interpreted the data. JB wrote the first draft, and all authors contributed to the writing of the manuscript thereafter. All authors have read and approved thismanuscript.
Funding
This work was supported by the Canadian Institutes of Health Research between 2012 and 2017 (Grant number: MOP119454).
Data availability
Data described in the manuscript, code book, and analytic code will be made available upon request, pending application and approval by the corresponding author.
Conflict of interest
MP has received funding from Neptune Wellness Solutions to conduct clinical trials unrelated to the current project. No other financial disclosures are reported. All of the remaining authors do not have any disclosures.
Supplementary material
[1] The supplementary material is available in the electronic version of this article: https://dx.doi.org/10.3233/NHA-220169.
References
[1] | Organization WH Dementia 2020 Available from: https://www.who.int/news-room/fact-sheets/detail/dementia |
[2] | Corder EH , Saunders AM , Risch NJ , Strittmatter WJ , Schmechel DE , Gaskell PC Jr et al. Protective effect of apolipoprotein E type 2 allele for late onset Alzheimer disease. Nat Genet. (1994) ;7: (2):180–4. |
[3] | Morris MC , Evans DA , Bienias JL , Tangney CC , Bennett DA , Wilson RS et al. Consumption of fish and n-3 fatty acids and risk of incident Alzheimer disease. Arch Neurol. (2003) ;60: (7):940–6. |
[4] | Kalmijn S , Launer LJ , Ott A , Witteman JC , Hofman A , Breteler MM Dietary fat intake and the risk of incident dementia in the Rotterdam Study. Ann Neurol. (1997) ;42: (5):776–82. |
[5] | Barberger-Gateau P , Letenneur L , Deschamps V , Peres K , Dartigues JF , Renaud S Fish, meat, and risk of dementia: cohort study. Bmj. (2002) ;325: (7370):932–3. |
[6] | Huang TL , Zandi PP , Tucker KL , Fitzpatrick AL , Kuller LH , Fried LP et al. Benefits of fatty fish on dementia risk are stronger for those without APOE epsilon4. Neurology. (2005) ;65: (9):1409–14. |
[7] | Plourde M , Vohl MC , Vandal M , Couture P , Lemieux S , Cunnane SC Plasma n-3 fatty acid response to an n-3 fatty acid supplement is modulated by apoE epsilon4 but not by the common PPAR-alpha L162V polymorphism in men. Br J Nutr. (2009) ;102: (8):1121–4. |
[8] | Chouinard-Watkins R , Rioux-Perreault C , Fortier M , Tremblay-Mercier J , Zhang Y , Lawrence P et al. Disturbance in uniformly 13C-labelled DHA metabolism in elderly human subjects carrying the apoE epsilon4 allele. Br J Nutr. (2013) ;110: (10):1751–9. |
[9] | Bazinet RP , Laye S Polyunsaturated fatty acids and their metabolites in brain function and disease. Nat Rev Neurosci. (2014) ;15: (12):771–85. |
[10] | Lacombe RJS , Chouinard-Watkins R , Bazinet RP Brain docosahexaenoic acid uptake and metabolism. Mol Aspects Med. 2018. |
[11] | Chouinard-Watkins R , Conway V , Minihane AM , Jackson KG , Lovegrove JA , Plourde M Interactive impact of BMI and APOE genotype on the plasma long chain polyunsaturated fatty acid response to a fish oil supplement in healthy participants Am J Clin Nutr. (2015) ;102: :505–13. |
[12] | Maltais M , Lorrain D , Leveille P , Viens I , Vachon A , Houeto A et al. Long-chain Omega-3 fatty acids supplementation and cognitive performance throughout adulthood: A 6-month randomized controlled trial. Prostaglandins Leukot Essent Fatty Acids. (2022) ;178: :102415. |
[13] | Folch J , Lees M , Sloanestanley GH A simple method for the isolation and the purification of total lipids from animal tissues. J Biol Chem. (1957) ;226: :497–509. |
[14] | Cunnane SC , Schneider JA , Tangney C , Tremblay-Mercier J , Fortier M , Bennett DA et al. Plasma and brain fatty acid profiles in mild cognitive impairment and Alzheimer’s disease. J Alzheimers Dis. (2012) ;29: (3):691–7. |
[15] | Plourde M , Tremblay-Mercier J , Fortier M , Pifferi F , Cunnane SC Eicosapentaenoic acid decreases postprandial beta-hydroxybutyrate and free fatty acid responses in healthy young and elderly. Nutrition. (2009) ;25: (3):289–94. |
[16] | Chevalier L , Vachon A , Plourde M Pharmacokinetics of Supplemental Omega-3 Fatty Acids Esterified in Monoglycerides, Ethyl Esters, or Triglycerides in Adults in a Randomized Crossover Trial. J Nutr. (2021) ;151: (5):1111–8. |
[17] | Fisk HL , Irvine M , Miles EA , Lietz G , Mathers JC , Packard CJ et al. Association of oily fish intake, sex, age, BMI and APOE genotype with plasma long-chain n-3 fatty acid composition. Br J Nutr. (2018) ;120: (1):23–32. |
[18] | Law SH , Chan ML , Marathe GK , Parveen F , Chen CH , Ke LY An Updated Review of Lysophosphatidylcholine Metabolism in Human Diseases. Int J Mol Sci. (2019) ;20: (5). |
[19] | ND R Phospholipid synthesis in mammalian cells. Biochemistry of Lipids, Lipoproteins and Membranes. Sixth edition ed: Elsevier; 2016. p. 209–36. |
[20] | Dashti M , Kulik W , Hoek F , Veerman EC , Peppelenbosch MP , Rezaee F A phospholipidomic analysis of all defined human plasma lipoproteins. Sci Re. (2011) ;1: :139. |
[21] | Nguyen LN , Ma D , Shui G , Wong P , Cazenave-Gassiot A , Zhang X et al. Mfsd2a is a transporter for the essential omega-3 fatty acid docosahexaenoic acid. Nature. (2014) ;509: (7501):503–6. |
[22] | Vandal M , Alata W , Tremblay C , Rioux-Perreault C , Salem N Jr , Calon F et al. Reduction in DHA transport to the brain of mice expressing human APOE4 compared to APOE2. J Neurochem. (2014) ;129: (3):516–26. |
[23] | Yassine HN , Croteau E , Rawat V , Hibbeln JR , Rapoport SI , Cunnane SC et al. DHA brain uptake and APOE4 status: a PET study with [1-(11)C]-DHA. Alzheimers Res Ther. (2017) ;9: (1):23. |
[24] | Chappus-McCendie H , Chevalier L , Roberge C , Plourde M Omega-3 PUFA metabolism and brain modifications during aging. Prog Neuropsychopharmacol Biol Psychiatry. (2019) ;94: :109662. |
[25] | van der Lee SJ , Teunissen CE , Pool R , Shipley MJ , Teumer A , Chouraki V et al. Circulating metabolites and general cognitive ability and dementia: Evidence from 11 cohort studies. Alzheimers Dement. (2018) ;14: (6):707–22. |
[26] | Donadio JV , Bergstralh EJ , Bibus DM , Grande JP Is body size a biomarker for optimizing dosing of omega-3 polyunsaturated fatty acids in the treatment of patients with IgA nephropathy? Clin J Am Soc Nephrol. (2006) ;1: (5):933–9. |
[27] | Snel M , Jonker JT , Schoones J , Lamb H , de Roos A , Pijl H et al. Ectopic fat and insulin resistance: pathophysiology and effect of diet and lifestyle interventions. Int J Endocrinol. (2012) ;2012: :983814. |
[28] | Lawson LD , Hughes BG Absorption of eicosapentaenoic acid and docosahexaenoic acid from fish oil triacylglycerols or fish oil ethyl esters co-ingested with a high-fat meal. Biochem Biophys Res Commun. (1988) ;156: (2):960–3. |
[29] | Schaffer JE Lipotoxicity: when tissues overeat. Curr Opin Lipidol. (2003) ;14: (3):281–7. |
[30] | Rasouli N , Molavi B , Elbein SC , Kern PA Ectopic fat accumulation and metabolic syndrome. Diabetes Obes Metab. (2007) ;9: (1):1–10. |

