
A comprehensive analysis of physical activity, nutrition, body composition and functional fitness of women over 60 years old
Abstract
BACKGROUND:
A healthy lifestyle provides a number of benefits, few comprehensive studies have assessed functional fitness and its association with physical activity, nutrition and body composition in older people.
OBJECTIVE:
The aim of the study was to evaluate the association between functional fitness, physical activity, nutrition and body composition of women aged above 60 years.
METHODS:
A group of 168 women was divided into two subgroups (‘active’ and ‘inactive’) based on their participation in organized exercise. Physical activity was measured with ActiGraph GT3-BT, nutrition was evaluated with the 4-day record intake, body composition was assessed with a bioelectrical impedance analyzer, functional fitness was measured using the Senior Fitness Test.
RESULTS:
A significant relationship was found between the functional fitness index, age and body fat in the ‘active’ group. In the ‘inactive’ group, a relationship was found between the length of moderate-to-vigorous physical activity (MVPA) per day, Healthy Diet Indicator, body fat and functional fitness index.
CONCLUSION:
Fat mass is of significant importance in maintaining functional fitness in women over 60 years of age, regardless of undertaking organized physical activity
1Introduction
A healthy lifestyle provides a number of benefits, but few comprehensive studies have assessed functional fitness and its association with physical activity, nutrition and body composition in older people. Research shows that physical activity has a positive effect on the body composition of older people, resulting in improved functional fitness [1, 2]. Koster et al. [3] indicated that preventing weight gain in old age and promoting physical activity can be an effective strategy for preventing the loss of mobility and reducing the possibility of disability later in life. Indeed, studies have confirmed that physical activity has a positive effect on body mass index, lower limb strength and dynamic balance [4].
Other studies have examined the influence of proper diet and physical activity on muscle mass loss. A systematic literature review [5] suggests that a combination of appropriate physical activity supplementation can prevent the onset of sarcopenia; the authors emphasize, however, that the evidence on this issue remains unclear. Even so, Kim et al. [6] report that older women who exercise regularly and eat healthy have a lower risk of decline in muscle mass.
Miller et al. [7] analyzed the impact of exercise and diet on functional fitness and body composition in older people with obesity. They showed that physical training enhances the efficiency of the cardiovascular system, increases muscular endurance, and improves various body composition parameters in older people who are trying to lose weight by limiting energy consumption. Training caused greater fat lost and maintained more muscle mass than a simple reduction in energy consumption alone. In addition, reduction of energy consumption without training has a neutral or negative effect on the capacity of the cardiovascular system, and muscle strength and generates a greater loss of muscle mass. Therefore, to lose weight effectively, it is necessary to combine physical activity with a proper diet.
Sarti et al. [8] assessed body composition, physical activity, nutrition and functional fitness in women over the age of 65 years old. Ageing was accompanied by a deterioration of functional fitness, even when the diet, nutritional status and physical activity were adequate. No change in body weight was caused by a decrease in both physical activity and energy intake. A study of the relationship between energy consumption, energy intake, nutritional status, functional fitness and body composition among older women [9] identified a significant relationship between functional fitness and the consumption of protein and fat. Higher protein intake resulted in higher energy consumption, which meant higher physical activity.
There is a pressing need to prevent the loss of independence among seniors, who are more prone to age-related diseases due to poor nutrition and a more sedentary lifestyle; this requires more comprehensive analyses of the factors that may affect such independence. Routine screening of nutrition and functional fitness among vulnerable older adults is key for identifying those in need of assessment and intervention. Strategies aimed at encouraging greater physical activity may also help slow the loss of free fat mass and preserve physical performance [10]. Therefore, the aim of the present study was to evaluate the association between functional fitness, physical activity, nutrition and body composition among women aged over 60 years.
2Methods
The design of the study was nonequivalent pretest-posttest control group design.
2.1Participants
Convenience sampling was used to select participants for the study. The inclusion criteria were adopted: female, 60 years or older (an older person is defined by the United Nations as a person who is over 60 years of age), independent in activities of daily living, no mobility limitation impacting daily activities (self-reported). Women with health contraindications against physical activity were excluded from the study.
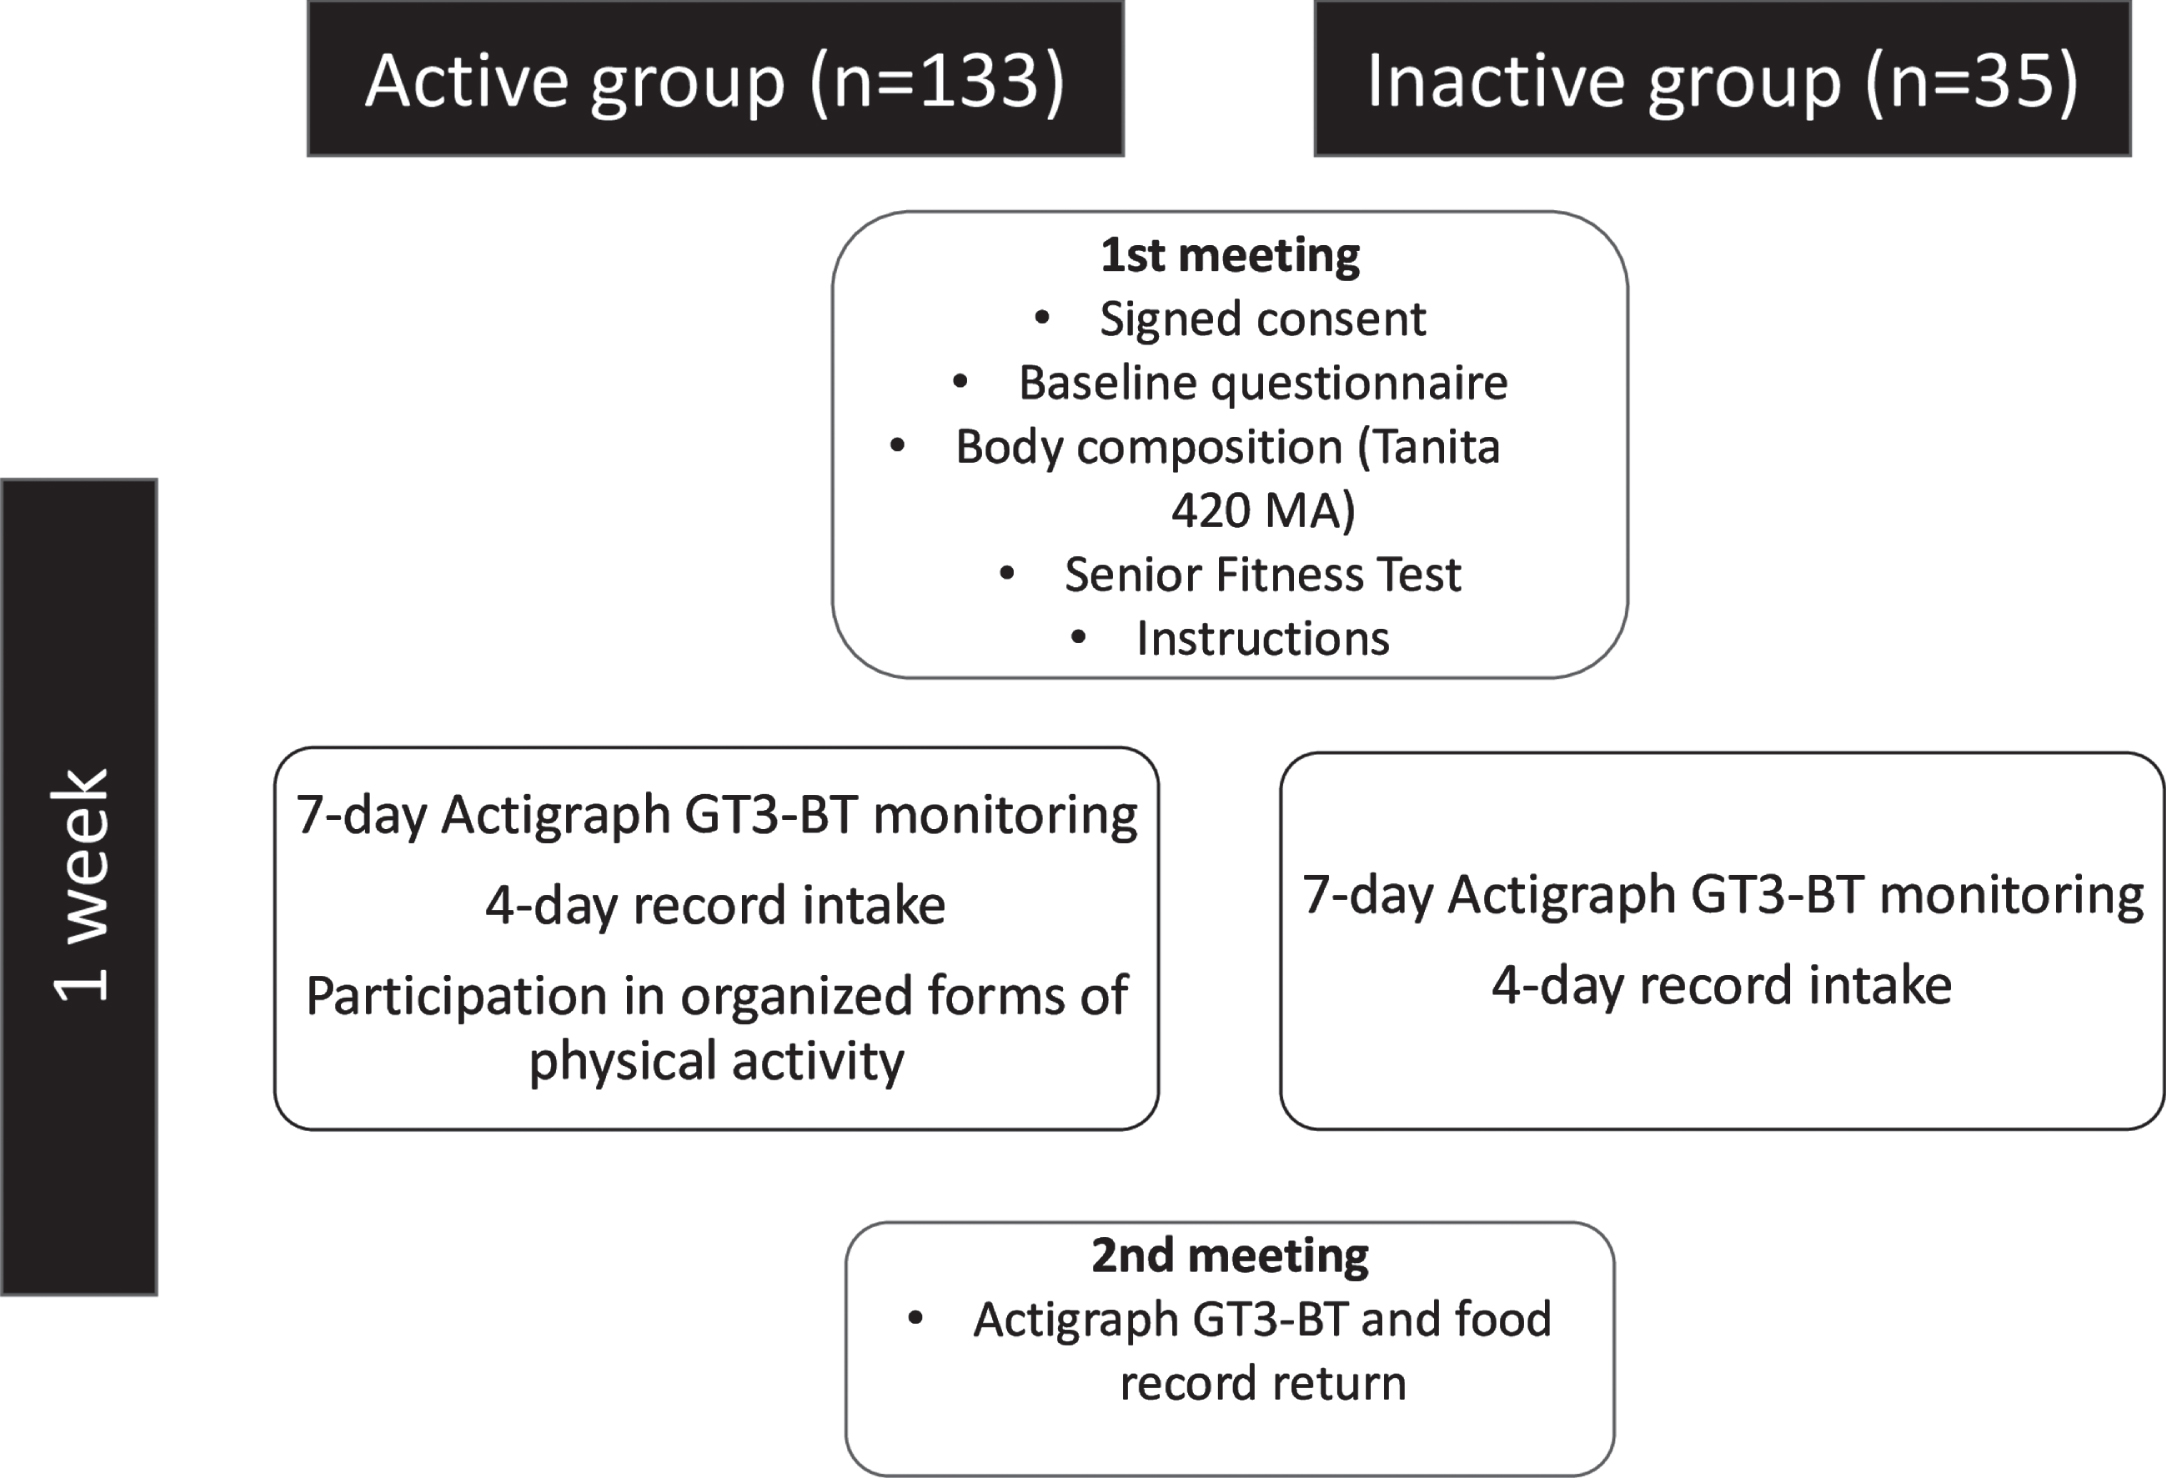
In total, 168 women took part. The participants were divided into two groups, ‘active’ and ‘inactive’, based on their participation in organized exercise. Women in the ‘active’ group (n = 133) took part in organized exercise at least once a week, while those in the ‘inactive’ group (n = 35) did not exercise in organized way. The mean age in the ‘active’ group was 68.4±5.9 years, body mass 68.9±10.1 kg, height 160.2±6.2 cm and body mass index (BMI) 26.8±3.7 kg/m2. In the ‘inactive’ group, the mean age was 71±8.4 years, body mass 71.7±11.1 kg, height 159.6±6.2 cm and BMI 28.3±4.9 kg/m2.
The study was conducted in Warsaw in 18 centers organizing activities for seniors. The project was accepted by the University Ethics Committee (SKE 01-19/2013). All the participants signed consent to take part in the study.
2.2Outcome measures
2.2.1Physical activity
Physical activity was measured with an ActiGraph GT3-BT (ActiGraph, LLC; Pensacola, Florida) worn on the right side of the waist, for seven consecutive days. Passive time was set at below 100 signals/minute [11], low intensity 100–2019, moderate intensity 2020–5998 and high intensity > 5999 signals/minute [12]. The participants were asked not to change their daily routine. Women were also asked to take the device off during activities in the water and during night time. The device had to be worn by the participants for at least 10 hours per day. Parameters included in the analysis were sedentary time and moderate-to-vigorous physical activity (MVPA).
2.2.2Nutrition
Nutrition was evaluated with a four-day record intake (two days from weekdays, Saturday and Sunday). A Healthy Diet Indicator (HDI) [13] value was calculated for every participant; this score is used to assess nutrition based on nine criteria, with one point being awarded for each: energy from saturated fatty acids <10%; energy from polyunsaturated fatty acid 3–7%; energy from protein 10–15%; energy from complex carbohydrates 50–70%; energy from mono and oligosaccharides <10%; fiber 27–40 g; fruits and vegetables > 400 g; legumes, nuts, grains > 30 g; cholesterol <300 mg.
2.2.3Body composition
Body composition was determined using a Tanita BC 420 MA (Tanita Co., Japan) analyzer. The measurement was performed after a light meal in the morning. Participants were asked to stand barefoot on the analyzer, and remain stationary with hands not touching the thighs.
2.2.4Functional Fitness
Functional fitness was evaluated using the Senior Fitness Test (SFT). All the tests were conducted according to the manual [14]. The 2-minute step test was used to evaluate aerobic capacity. The result of each test was standardized (Z-score) to the results of the ‘active’ group. The Z-score indicates the number of standard deviations by which a specific value differs from the sample mean (Z-score = [observed –sample mean]/sample SD). The sum of the six Z-scores was used to compute an overall continuous measure of a physical function –functional fitness index.
2.2.5Procedure
The flow chart of the study design is presented on Fig. 1. The initial screening was conducted either in person or by senior center staff. Eligible volunteers were then scheduled for an in-person session in the senior center on Mondays. The researcher explained the purpose and overall procedure of the study to the participants. After providing their signed informed consent, the participants completed a baseline questionnaire that included information on their general characteristics (age, height), and their body composition was measured with the Tanita BC 420 MA analyzer. Next, functional fitness level was assessed using SFT. The participants were then trained on how to use the ActiGraph GT3-BT and given written instructions and contact information for researcher in case they needed any assistance. They were instructed to wear the device for one week. During this week, they were also asked to record their four-day food intake (two days from weekdays, Saturday and Sunday). At the end of the seven-day home monitoring period (on Mondays), they returned the ActiGraph GT3-BT to the senior center.
Fig. 1
Flowchart of the study.
2.2.6Statistical analysis
The data were analyzed using STATA 13. Spearman’s correlation coefficient was calculated between individual tests, as was the composite Z-score and selected parameters determining physical activity, nutrition and body composition. In order to determine the share of physical activity, as well as diet and body composition, in functional fitness in both the ‘active’ and ‘inactive’ groups, multiple regression (R2) was performed. In addition, the percentage share of individual elements in the total variance of functional fitness was calculated. In all calculations, p≤0.05 was considered statistically significant.
3Results
The correlation between each functional test, composite Z-score and selected parameters of physical activity, nutrition and body composition in the ‘active’ group is presented in Table 1. The data indicates that more time spent in MVPA, a lower percentage of fat mass and a higher percentage of muscle mass positively correlated with lower body strength, flexibility, agility and composite Z-score. Lower BMI level was associated with better results in flexibility, balance and agility tests, as well as overall composite Z-score.
Table 1
Spearman’s Correlation Coefficient Between Functional Fitness and Selected Parameters of Physical Activity, Diet and Body Composition in ‘Active’ Group (n = 133)
| 30 s chair stands | 30 s arm curl | 2 min step test | Chair Sit-and-reach | Back scratch | 8 ft up and go | Composite Z-score | |
| Sendentary time/week (min) | 0.050 | –0.014 | 0.010 | 0.008 | 0.014 | –0.007 | 0.018 |
| MVPA/week (min) | 0.218* | 0.153 | 0.145 | 0.175* | 0.294* | –0.349* | 0.252* |
| Energy consumption (kcal) | –0.015 | 0.014 | –0.089 | 0.039 | 0.083 | –0.023 | 0.024 |
| HDI | 0.105 | 0.080 | 0.057 | 0.148 | 0.145 | –0.123 | 0.129 |
| BMI (kg/m2) | –0.153 | –0.016 | –0.131 | –0.296* | –0.529* | 0.174* | –0.279* |
| Fat mass (%) | –0.246* | –0.088 | –0.167 | –0.301* | –0.433* | 0.218* | –0.358* |
| Muscle mass (%) | 0.249* | 0.091 | 0.170 | 0.303* | 0.435* | –0.222* | 0.362* |
*p≤0.05; MVPA –moderate to vigorous physical activity; HDI –Healthy Diet Indicator; BMI –Body Mass Index.
The correlation between each functional test, composite Z-score and selected parameters of physical activity, nutrition and body composition in the ‘inactive’ group is presented in Table 2. In this group more time spent sedentary was negatively correlated with lower body strength, while more time spent on MVPA correlated positively with upper body strength, flexibility and agility.
Table 2
Spearman’s Correlation Coefficient Between Functional Fitness and Selected Parameters of Physical Activity, Diet and Body Composition in ‘Inactive’ Group (n = 35)
| 30 s chair stands | 30 s arm curl | 2 min step test | Chair Sit-and-reach | Back scratch | 8 ft up and go | Composite Z-score | |
| Sendentary time/week (min) | –0.364* | –0.220 | 0.054 | –0.015 | 0.227 | –0.183 | –0.195 |
| MVPA/week (min) | 0.273 | 0.341* | 0.268 | 0.016 | 0.493* | –0.469* | 0.266 |
| Energy consumption (kcal) | 0.158 | 0.156 | 0.229 | 0.130 | 0.140 | –0.124 | 0.231 |
| HDI | –0.094 | –0.060 | –0.186 | –0.285 | –0.129 | 0.044 | –0.209 |
| BMI (kg/m2) | –0.029 | –0.100 | 0.174 | –0.305 | –0.218 | 0.113 | –0.107 |
| Fat mass (%) | –0.164 | –0.053 | 0.142 | –0.168 | –0.039 | 0.016 | –0.019 |
| Muscle mass (%) | 0.121 | 0.058 | –0.072 | 0.226 | 0.259 | –0.177 | 0.159 |
*p≤0.05; MVPA –moderate to vigorous physical activity; HDI –Healthy Diet Indicator; BMI –Body Mass Index.
A comprehensive analysis of physical activity, diet, body composition and functional fitness is provided in Table 3. The results showed a significant relationship between the functional fitness index, age and body fat in the ‘active’ group. In the ‘inactive’ group, this relationship occurred between the time of MVPA per day, Healthy Diet Indicator, body fat and functional fitness index.
Table 3
The Share of Individual Parameters in the Variation of the Functional Fitness Index (Composite Z-Score)
| ‘Active’ group R2 = 0,311 | ‘Inactive’ group R2 = 0,470 | |||||
| Regression v | p | Regression coefficient | p | |||
| Age (years) | 13% | –0.04 | 0.00*** | 3% | –0.01 | 0.51 |
| Sedentary time/week (min) | 0% | –0.00 | 0.33 | 1% | –0.00 | 0.33 |
| MVPA/day (min) | 5% | 0.00 | 0.05 | 28% | 0.02 | 0.00** |
| Energy consumption (kcal) | 0% | –0.00 | 0.73 | 3% | 0.00 | 0.47 |
| HDI | 2% | 0.07 | 0.13 | 7% | 0.28 | 0.04* |
| BMI (kg/m2) | 1% | –0.01 | 0.79 | 3% | –0.04 | 0.22 |
| Fat mass (%) | 10% | –0.04 | 0.02* | 3% | –0.06 | 0.03* |
*p ≤ 0.05; **p ≤ 0.01; ***p ≤ 0.001; MVPA – moderate to vigorous physical activity; HDI – Healthy Diet Indicator; BMI – Body Mass Index.
4Discussion
Our findings indicated a relationship between MVPA per day and upper limb strength, flexibility and agility, as well as functional fitness index in older women. This relationship occurred regardless of undertaking organized physical activity. Santos et al. [15], using the same measurement tools, also found a relationship between MVPA per day and functional fitness index.
In the ‘active’ group, women with a lower BMI, lower body fat and higher muscle mass achieved better results in tests assessing flexibility and agility, as well as functional fitness indicator. In addition, lower levels of body fat and higher muscle mass were associated with better scores in the lower limb strength test. These results confirm that physical activity affects body composition, which in turn is important for functional fitness. Chang et al. [16] found aging-related body composition changes to have a significant impact on the risk of disability, and Falsarella et al. [17] reported that women with lower muscle mass and a higher BMI value achieved worse result in the ‘stand up and go’ test. Tyrovolas et al. [18] confirmed the importance of maintaining muscle mass and controlling obesity in preventing disability among older populations.
Our findings did not reveal any correlation between sedentary time, nutrition and functional fitness among women in the ‘active’ group. While Santos et al. [15] indicated a relationship between sedentary time and functional fitness, their study included both women and men, with a higher mean age and a larger sample than our present study. Similarly, while Singh et al. [19] noted a relationship between nutrition and functional fitness, their research was carried out on people diagnosed with malnutrition, with BMI below 22 kg/m2; in contrast the average BMI in the ‘active’ group in the present study was above 28 kg/m2.
In the ‘inactive’ group, a higher amount of sedentary time was found to significantly affect the result of the test assessing lower limb strength. In addition, women in the group who spent more time on MVPA showed greater upper limb strength, greater upper body flexibility and a higher level of agility. Rosenberg et al. [20] reported the same relationship between objectively measured MVPA, time spent passively and functional fitness among seniors. Most recent studies suggest that besides reducing sedentary behavior levels, there is a need to regularly interrupt prolonged sedentary time to improve physical function in older adults [21].
Relatively little research has been performed on the influence of parameters related to physical activity, nutrition and body composition on the functional fitness of women over 60 years of age. The comprehensive analysis performed in the present study found that age and body fat content has a statistically significant impact on the functional fitness of ‘active’ women. In addition, these two parameters had the greatest influence on the variability of the functional fitness index, respectively 13% and 10%. Indeed, in this group, higher age and body fat content were associated with a lower level of functional fitness. These findings are in accordance with Sarti et al. [8], who reported a decrease in functional efficiency with age even with a proper diet, nutritional status and physical activity. The LifeAge study conducted on European older adults [22] showed that age, diet, PA, and obesity can increase the risk of low muscle strength, low muscle mass or low functional performance.
Our comprehensive analysis in the ‘inactive’ group found that length of MVPA per day, Healthy Diet Indicator score and body fat level had a significant effect on the functional fitness of the studied women. Thus, for seniors who do not undertake organized physical activity, daily activity, proper nutrition and body composition are key factors in maintaining functional fitness. Among these factors, MVPA per day had a significant influence of the total variability of the functional fitness index (28%). Although the ‘inactive’ group spent significantly less time on this type of activity compared to the ‘active’ group, the time they devoted to this activity had the greatest impact on functional fitness. Therefore, it seems justified to recommend MVPA in this group. Our research showed that this is particularly important for women who do not take part in organized physical activity.
Regardless of organized physical activity, body fat content had a significant impact on the functional fitness of the examined women. However, Sardinha et al. [23] indicated that adiposity assessed by BMI and waist circumference were not associated with physical independence, assessed by the Senior Fitness Test. This may indicate that in this group, body composition measurement should be used for the assessment of adiposity. This was confirmed by Batsis et al. [24], who note that women with a BMI within normal range, but increased body fat, were at increased risk of reduced mobility.
4.1Limitations
An important limitation of the current study was its small sample size. As such, any statistical generalization must be made with caution, due to limited statistical power of the study. Another limitation is that we used purposeful sampling while selecting participants for the study. Nevertheless, despite these limitations, we believe that our findings have great potential value while planning interventions for older women.
5Conclusions
A comprehensive analysis of physical activity, diet and body composition indicated that fat mass has significant importance in maintaining functional fitness in women over 60 years of age, regardless of undertaking organized physical activity. For women who do not engage in organized physical activity, time spent on MVPA is crucial for maintaining functional fitness.
Acknowledgments and Funding
The study was financed by the Ministry of Science and Higher Education (DM- 37).
Conflicts of interest
The authors declare no conflict of interest.
References
[1] | Matta J , et al. Interrelated factors favoring physical performance and activity in older adults from the NuAge cohort study. Exp Gerontol. (2014) ;55: :37–43. |
[2] | Ward-Ritacco CL , et al. Adiposity, physical activity, and muscle quality are independently related to physical function performance in middle-aged postmenopausal women. Menopause. (2014) ;21: (10):1114–21. |
[3] | Koster A , et al. Joint effects of adiposity and physical activity on incident mobility limitation in older adults. J Am Geriatr Soc. (2008) ;56: (4):636–43. |
[4] | Tuna HD , et al. Effect of age and physical activity level on functional fitness in older adults. Eur Rev Aging Phys Act. 2009: (6):99–106. |
[5] | Denison HJ , et al. Prevention and optimal management of sarcopenia: a review of combined exercise and nutrition interventions to improve muscle outcomes in older people. Clin Interv Aging. (2015) ;10: :859–69. |
[6] | Kim J , et al. Association between healthy diet and exercise and greater muscle mass in older adults. J Am Geriatr Soc. (2015) ;63: (5):886–92. |
[7] | Miller CT , et al. The effects of exercise training in addition to energy restriction on functional capacities and body composition in obese adults during weight loss: a systematic review. PLoS One. (2013) ;8: (11):e81692. |
[8] | Sarti S , et al. Dietary intake and physical performance in healthy elderly women: a 3-year follow-up. Exp Gerontol. (2013) ;48: (2):250–4. |
[9] | Sakato Y , et al. Relationships between Nutrition Intake Status, Nutritional Condition and Physical Fitness in Elderly Women. Int J Sport Heal Sci. 2006: (4):544–54. |
[10] | Chatindiara I , et al. Associations between nutrition risk status, body composition and physical performance among community-dwelling older adults. Aust N Z J Public Health. (2019) ;43: (1):56–62. |
[11] | Matthews CE , et al. Best practices for using physical activity monitors in population-based research. Med Sci Sports Exerc. (2012) ;44: (1 Suppl 1):S68–76. |
[12] | Troiano RP , et al. Evolution of accelerometer methods for physical activity research. Br J Sports Med. (2014) ;48: (13):1019–23. |
[13] | Gibson RS . Principles of Nutritional Assessment. 2nd ed. (2005) , New York: Oxfrod University Press. |
[14] | Rikli R , Jones CJ . Senior Fitness Test Manual. 2nd ed. (2012) , USA: Human Kinetics. |
[15] | Santos DA , et al. Sedentary behavior and physical activity are independently related to functional fitness in older adults. Exp Gerontol. (2012) ;47: (12):908–12. |
[16] | Chang CI , et al. The impacts of sarcopenia and obesity on physical performance in the elderly. Obes Res Clin Pract. (2015) ;9: (3):256–65. |
[17] | Falsarella GR , et al. Influence of muscle mass and bone mass on the mobility of elderly women: an observational study. BMC Geriatr. (2014) ;14: :13. |
[18] | Tyrovolas S , et al. The role of muscle mass and body fat on disability among older adults: A cross-national analysis. Exp Gerontol. (2015) ;69: :27–35. |
[19] | Singh DK , et al. Correlation between nutritional status and comprehensive physical performance measures among older adults with undernourishment in residential institutions. Clin Interv Aging. (2014) ;9: :1415–23. |
[20] | Rosenberg DE , et al. Independent Associations Between Sedentary Behaviors and Mental, Cognitive, Physical, and Functional Health Among Older Adults in Retirement Communities. J Gerontol A Biol Sci Med Sci. (2016) ;71: (1):78–83. |
[21] | Wilson JJ , et al. Associations of sedentary behavior bouts with community-dwelling older adults’ physical function. Scand J Med Sci Sports. (2021) ;31: (1):153–62. |
[22] | Marcos-Pardo PJ , et al. Sarcopenia, Diet, Physical Activity and Obesity in European Middle-Aged and Older Adults: The LifeAge Study. Nutrients. (2020) ;13: (1). |
[23] | Sardinha LB , et al. Fitness but not weight status is associated with projected physical independence in older adults. Age (Dordr). (2016) ;38: (3):54. |
[24] | Batsis JA , et al. Normal weight obesity and functional outcomes in older adults. Eur J Intern Med. (2014) ;25: (6):517–22. |


