
Evaluation of serum adropin and irisin levels and its association with anthropometric obesity indices and biochemical parameters in Type 2 diabetic patients
Abstract
BACKGROUND/AIM:
The newly described proteins adropin and irisin are a highly conserved polypeptide that plays essential roles in metabolic and energy homeostasis, insulin resistance, and fat browning. The aim of this study is to evaluate the circulating levels of serum adropin and irisin in type 2 diabetes mellitus (T2DM) patients and also to elucidate possible relationships between serum adropin and irisin levels with anthropometric obesity indices and biochemical parameters.
SUBJECTS AND METHODS:
Single-center prospective observational study included 90 T2DM patients referred to the diabetes outpatient clinic. Height, weight, and waist circumference (WC) were measured. Body mass index (BMI) and waist to height ratio (WHtR) were calculated. Fasting blood glucose, glycosylated hemoglobin, serum lipids, creatinine, urea, and blood urea nitrogen were evaluated. Estimated glomerular filtration rate (GFR) was calculated, serum adropin and irisin were evaluated.
RESULTS:
The results showed a significant positive correlation between adropin and irisin in females but not in males (r = 0.311; P = 0.042). In males’ group, serum adropin levels showed significant negative correlation with serum glucose (–0.423, P = < 0.05), HbA1C (–0.364, P = < 0.05), and GFR (–0.355, P = < 0.05). In contrast, creatinine was showed a significant positive correlation with adropin in males (0.381, P = < 0.05). In females’ group, adropin showed a significant negative correlation with weight (–0.371, P = < 0.05), BMI (–0.349, P = < 0.05), WC (–0.402, P = < 0.01), and WHtR (–0.398, P = < 0.01). Contrary, in males’ group, serum irisin levels showed significant positive correlation with weight (0.338, P = < 0.05), BMI (0.332, P = < 0.05), WC (0.409, P = < 0.01), and WHtR (0.432, P = < 0.01).
CONCLUSION:
This study demonstrated that, in T2DM patients, circulating serum adrpoin correlated negatively with anthropometric obesity indices of obesity in females, while serum irisin was positively correlated with anthropometric obesity indices of obesity in males.
1Introduction
Diabetes Mellitus is the most common of all endocrine disorders, is one of the foremost public health concerns confronting the world today. The global statistics of diabetes mellitus in the year 2017 indicated, about 425 million people had this disease worldwide and will rise to 629 million in 2045 [1]. Type 2 diabetes mellitus (T2DM) makes about 90–95% of all diabetes, the estimated prevalence of T2DM in Jordan is 9.5% in age 20–79 years and expected to be 12.5% in 2045 [2].
Adropin and irisin are newly described proteins that can be an essential component in the pathophysiological pathways of diabetes mellitus, hypertension, chronic kidney disease, and cardiovascular diseases. Adropin is a new peptide hormone identified in 2008 by Kumar et al. [3]. The first report on irisin was published in 2012 by Bostrom [4] both are known as myokines regulate energy homeostasis and metabolic processes.
The role of adropin and irisin was investigated in patients with T2DM, as long-term complications of diabetes include coronary artery disease, diabetic retinopathy and impaired renal functions [5–9].
Various studies on irisin and adropin concentration in T2DM have shown that lower irisin levels have been found in patients with T2DM compared to newly diagnosed or nondiabetic [6, 7, 10, 11]. The level of adropin changes in different physiological and pathophysiological conditions. A decreased concentration of adropin is associated with many diseases such as insulin resistance associated with obesity and T2DM [7, 12].
Given the increase in the prevalence of diabetes, insulin action as a major contributor should be enhanced; adropin has been recognized as a secreted peptide that enhances glucose tolerance, oxidative glucose metabolism, and insulin receptor signaling in skeletal muscles in diet-induced obese mice [13]. Discussion of T2DM in adults should be aligned with the main contributor to T2DM, obesity, where almost 88% of people with T2DM are deemed overweight or obese [14]. An inverse association between adropin levels and body mass index (BMI) has also been reported in human studies [12]. The first evidence indicating a link between adropin, obesity and the risk of metabolic syndrome in humans was presented by Butler et al. [15], who reported that low adropin levels were found in obese patients and weight loss increased its levels.
Irisin, similar to adropin, as a secreted peptide, activates white fat’s conversion to brown-like fat, increases insulin sensitivity, and decreases visceral fat [4]. Likewise, lower irisin concentrations were observed in diabetic patients [10]. In a systematic review, five of the eight studies reported reduced irisin levels in patients with T2DM [16]. A cross-sectional showed that serum irisin levels were significantly reduced in T2DM Egyptian patients than nondiabetic controls [11]. Likewise, circulating irisin was significantly lower in individuals with T2DM than nondiabetic controls [10]. Contrary, many studies found that irisin is elevated in T2DM [17, 18].
Irisin levels can provide new avenues for controlling age-related muscle changes since it’s a potential biomarker for muscle dysfunction that could portend the onset of sarcopenia [19]. Irisin levels were studied in elderly patients with diabetes it was lower than the control group of healthy subjects with the same gender characteristics and age with a difference of±5 years old [20]. On the other hand, serum adropin concentrations are negatively associated with renal function. Adropin may be implicated in the pathogenesis of Diabetic nephropathy development [21].
However, the previously mentioned studies attempt to assess adropin and irisin levels as adipo-myokines and its relation with anthropometric obesity indices and biochemical markers in T2DM patients.
Nevertheless, the relationship between adropin, irisin, and T2DM has not been studied in Jordanian subjects. Therefore, this study aims to evaluate the circulating levels of serum adropin and irisin in T2DM patients and also to elucidate possible relationships between serum adropin and irisin levels with anthropometric obesity indices and biochemical parameters.
2Materials and methods
2.1Study design and data collection
This single-center prospective observational study included 90 T2DM patients referred to the diabetes outpatient clinic, between October 2019 and January 2020. The data were collected from patients by structured questionnaire-interviews. A fasting blood sample was collected to measure glycosylated hemoglobin (HbA1C) and serum lipids and kidney function tests. The exclusion criteria included subjects known to have thyroid gland problems, chronic diseases such as liver cirrhosis, heart problems, and subjects who did not agree to participate in the current study.
All patients were informed about the study’s aims, procedures, and risks and signed informed consent prior to inclusion. The study protocol was carried out following the principles of the Declaration of Helsinki as revised in 2000. Ethical approval for this study was obtained from the Ethical Review Board at Hashemite University (number 5/1/2017/2018).
2.2Anthropometric measurements
Height was read to the nearest 0.5 cm. A digital scale with an accuracy of 100 g was used to measure body weight. Waist circumference (WC) was measured midway between the lower rib margin and the iliac crest with plastic tape to the nearest 1 mm. Body mass index (BMI) (kg/m2), and waist to height ratio (WHtR) were calculated.
2.3Biochemical measurements
Venous blood samples were collected from all subjects after an overnight fast (at least 12 hours). Fasting serum glucose (FPG) was immediately measured using the glucose oxidase technique. Blood was collected in plain tubes, and the blood clotting time was 30 min. Serum was obtained by low speed centrifugation at 700 RCF for 15 minutes at room temp, and samples were immediately separated into aliquot and stored at – 80 °C until the time of assay.
Glycosylated hemoglobin A1c (HbA1c) was measured using cation-exchange column chromatography on an automatic analyzer (Bio-Rad Company, Hercules, California, USA). Serum total cholesterol (TC) and high-density lipoprotein–cholesterol (HDL-C) were measured by an enzymatic colorimetric method using cholesterol oxidase, peroxidase, and the chromogen 4-aminophenazone/phenol Allain et al. [22]. Serum triacylglycerols (TAGs) levels were determined by an enzymatic colorimetric method using lipoprotein lipase glycerokinase, glycerphosphate oxidase, and the chromogen 4-aminophenazone/N-ethyl-N (3-sulphopropyl)-nramisidine (Fossati and Prencipe) [23]. Low-density lipoprotein –cholesterol (LDL–C) was calculated using Friedwald et al. [24]. Creatinine levels in blood serum were measured using Jaffe reaction [25], Photometric Colorimetric Test for kinetic Measurements, a method without deproteinization. The creatinine forms in alkaline solution an orange-red complex with picric acid. The absorbance of this complex is proportional to the creatinine concentration in the sample. The method showed a linear dependence within a concentration of up to 13 mg/d (1.150μmol/L). The study adopted the following reference values: 0.6–1.1 mg/dl (53–97μmol/L) and 0.5–0.9 mg/dl (44–88μmol/L) for men and women, respectively. The quantitative determination of urea in blood serum was carried out using the enzymatic colorimetric method. Urea is hydrolyzed in the presence of water and urease to produce ammonia and carbon dioxide. The ammonium ions react with hypochlorite and salicylate to form a green dye. The absorbance increase at 546 or 578 nm is proportional to the urea concentration in the sample. For reference values, the study adopted 10–50 mg/dl (1.7–8.3 mmol/L); the method showed a linear dependence within a concentration up to 400mg/dl (66.6 mmol/l). Blood urea nitrogen (BUN) was calculated using the (BUN = 0.47* Urea concentration in serum). The estimated glomerular filtration rate (GFR) was calculated based on an equation:
GFR = 175×standardized Scr –1.154×age –0.203×1.212 [if African American]×0.742 [if female].
However, there is no factor to multiply by for males, where GFR is expressed as mL/min/1.73 m2 of body surface area and Scr is expressed in mg/dL [26], which is the most prescribed analyses in medical laboratories to estimate the glomerular filtration rate.
Serum irisin concentrations were measured using the enzyme-linked immunosorbent assay (ELISA) kits (Code No. MBS166617; MyBioSource). This sandwich ELISA Kit is for quantitative detection of human irisin. The plate had been precoated with the human irisin antibody. Irisin present in the sample was added and bound to antibodies coated on the wells. And then, biotinylated human irisin Antibody was added and attached to irisin in the sample. Then Streptavidin-HRP was added and bound to the Biotinylated irisin Antibody. After incubation, unbound Streptavidin-HRP was washed away during a washing step. Substrate solution was then added, and the color was developed in proportion to human irisin. The reaction was determined by the addition of acidic stop solution, and absorbance was measured at 450nm. The sensitivity of the assay was 0.095 ng/mL, and the linear range of the standard was 0.2–60 ng/mL. The intra-and inter-assay coefficients of variation (CV) were < 8% and < 10%, respectively. Serum adropin concentrations were measured by using the enzyme-linked immunosorbent assay (ELISA) kits (Code No. MBS2887307; MyBioSource). This competitive ELISA Kit is for quantitative detection of human adropin. The microtiter plate had been pre-coated with an antibody specific to the target antigen. During the reaction, the sample or standard’s target antigen competed with an affixed amount of biotin-labeled target antigen for sites on a pre-coated antibody specific to the target antigen. Excess conjugate and unbound samples or standards were washed from the plate. Next, Avidin conjugated to Horseradish Peroxidase (HRP)was added to each microplate well and incubated. Then the TMB substrate solution was added to each well. The enzyme-substrate reaction was determined by adding a sulphuric acidic stop solution, and the color change was measured spectrophotometrically at a wavelength of 450nm. The target antigen concentration in the sample was then determined by comparing the O.D. of the samples to the standard curve. The linear range of the standard was 0.078–5 ng/mL. The intra-and inter-assay coefficients of variation (CV) were≤5.6% and≤8.2%, respectively.
2.4Statistical analyses
Analyses were carried out using Statistical Package for Social Sciences (SPSS) software (IBM Corp. Released 2013. IBM SPSS Statistics for Windows, Version 22.0. Armonk, NY: IBM Corp). To test whether the underlying distribution was normal, the Shapiro–Wilk test was used. Continuous variables were described using means and standard deviations, and categorical variables were described using percentages. A Chi-square test was used to compare ratios. Parameter differences between sexes were assessed using an independent samples t-test in cases of normal data distribution and the Mann–Whitney U in cases of non-normal data distribution. Spearman’s rank correlation coefficient was calculated to assess the relationship between serum adropin and irisin and various study variables. A P-value of < 0.05 was considered statistically significant.
3Results
3.1Anthropometric and clinical characteristics the participants
The anthropometric and clinical characteristics of the participants are summarized in Table 1. All subjects are from the same ethnicity (Jordanian). The mean WHtR and BMI were higher in the female group compared to the male group (0.66 vs. 0.63, P = 0.007; 33.5 kg/m2 vs. 32.2 kg/m2, P = 0.008), respectively. While the mean height was higher in the males’ group compared to the females’ group (165.7 cm vs. 158.7 cm, P < 0.001).
Table 1
Anthropometric and clinical characteristics of T2DM patients
| Variable | Males (n = 45) | Females (n = 45) | P-value |
| Age (yrs.) | 60.7±12.5 | 60.9±9.3 | 0.781 |
| Duration of diabetes (yrs.) | 13.4±8.5 | 12.8±6.9 | 0.848 |
| Weight (kg) | 84.9±13.3 | 84.0±13.6 | 0.631 |
| Height (cm) | 165.7±14.7 | 158.7±8.4 | < 0.001 |
| WC (cm) | 104.0±14.4 | 106.0±13.5 | 0.455 |
| WHtR | 0.63±0.11 | 0.66±0.08 | 0.007 |
| BMI (kg/m2) | 32.2±12.6 | 33.5±5.7 | 0.008 |
| Glucose (mg/ dL) | 205.4±107.8 | 201.4±101.8 | 0.947 |
| HbA1c (%) | 8.57±1.56 | 8.94±1.78 | 0.404 |
| TC (mg/dL) | 169.7±53.4 | 191.8±63.0 | 0.076 |
| TG (mg/dL) | 193.1±74.7 | 222.5±94.3 | 0.105 |
| HDL-C (mg/dL) | 50.4±7.9 | 50.3±7.8 | 0.790 |
| LDL-C (mg/dL) | 89.6±49.2 | 108.9±57.6 | 0.163 |
| Atherogenic index log10 (TG/HDL-C) | 0.55±0.18 | 0.60±0.23 | 0.092 |
| Creatinine (mg/dL) | 0.93±0.59 | 0.72±0.19 | 0.043 |
| Urea (mg/dL) | 56.6±17.2 | 53.8±20.3 | 0.583 |
| BUN (mg/dL) | 26.6±8.1 | 25.3±9.5 | 0.583 |
| GFR (mL/min/1.73 m2) | 91.7±28.9 | 87.6±16.4 | 0.195 |
| Adropin (ng/ml) | 3.45±0.47 | 3.50±0.37 | 0.884 |
| Irisin (ng/ml) | 7.88±1.89 | 8.27±2.3 | 0.493 |
Weight, HbA1C, Adropin, eGFR, Urea, BUN, Cholesterol, TG, HDL, and LDL were tested by independent t-test. Values are presented as mean±SD. P-values between genders were statistically analyzed.
Glycemic, lipid profiles, and kidney function tests are listed in Table 1. The levels of glucose, HbA1c, TG, HDL-C, LDL-C, creatinine, urea, and BUN did not show any differences in both genders. The mean TC and atherogenic index showed a slight trend toward significance (P = 0.076, P = 0.092), respectively. Females showed significantly lower levels of serum creatinine compared to males (P = 0.043). Table 1 also displayed the mean levels of serum adropin and irisin in both genders, it showed that there is no significant difference between both genders.
3.2Correlation analysis between serum adropin and irisin levels and anthropometric, and biochemical parameters
Table 2 illustrated the correlation between serum adropin and irisin levels and anthropometric and biochemical parameters in all patients, it showed that serum glucose levels were only negatively associated with adropin levels (p < 0.05).
Table 2
Correlation analysis between serum adropin and irisin levels and anthropometric, and biochemical parameters in T2DM patients (N = 90)
| Adropin | Irisin | |
| Weight (kg) | –0.062 | 0.075 |
| BMI (kg/m2) | –0.043 | 0.088 |
| WC (cm) | –0.183 | 0.127 |
| WHtR | –0.098 | 0.186 |
| Glucose (mg/dl) | –0.303* | –0.186 |
| HbA1c (%) | –0.119 | –0.025 |
| TC (mg/dL) | –0.037 | –0.072 |
| TG (mg/dL) | 0.049 | 0.004 |
| HDL-C (mg/dL) | 0.039 | –0.134 |
| LDL-C (mg/dL) | –0.069 | –0.079 |
| Atherogenic index (log10 (TG/HDL-C) | 0.064 | 0.044 |
| Creatinine (mg/ dL) | 0.089 | –0.090 |
| Urea (mg/ dL) | –0.160 | –0.084 |
| BUN (mg/ dL) | –0.160 | –0.084 |
| GFR (mL/min/1.73 m2) | –0.089 | 0.027 |
Spearman’s rank correlation coefficient. *Correlation is significant at the < 0.05 level (2-tailed).
Table 3. on contrast, demonstrates the correlation between serum adropin and irisin levels and anthropometric and biochemical parameters in all patients based on gender. The association of adropin levels and variable indicators had gender differences existed in participants. In males’ group, serum glucose, HbA1C, and GFR were showed a significantly negative correlation with adropin (P < 0.05). In contrast, creatinine was showed a significant positive correlation with adropin (P < 0.05). In females, adropin showed a significant negative correlation with weight, BMI, WC, and WHtR (P < 0.05).
Table 3
Correlation analysis between plasma adropin and irisin levels and anthropometric, and biochemical parameters in T2DM patients according to gender (N = 90)
| Adropin | Irisin | |||
| Males (n = 45) | Females (n = 45) | Males (n = 45) | Females (n = 45) | |
| Weight (kg) | 0.146 | –0.371* | 0.338* | –0.261 |
| BMI (kg/m2) | 0.204 | –0.349* | 0.332* | –0.198 |
| WC (cm) | 0.036 | –0.402** | 0.409** | –0.185 |
| WHtR | 0.089 | –0.398** | 0.432** | –0.032 |
| Glucose (mg/dl) | –0.423* | –0.100 | –0.019 | –0.373 |
| HbA1c (%) | –0.364* | –0.247 | –0.013 | –0.201 |
| TC (mg/dL) | 0.125 | 0.164 | 0.090 | –0.399 |
| TG (mg/dL) | 0.267 | –0.227 | –0.186 | –0.071 |
| HDL-C (mg/dL) | –0.080 | 0.035 | –0.204 | –0.373 |
| LDL-C (mg/dL) | 0.029 | 0.176 | 0.055 | –0.378 |
| Atherogenic index (log10 (TG/HDL-C) | 0.354 | –0.254 | –0.190 | –0.006 |
| Creatinine (mg/ dL) | 0.381* | –0.237 | 0.050 | –0.273 |
| Urea (mg/ dL) | 0.047 | –0.279 | –0.048 | –0.178 |
| BUN (mg/ dL) | –0.047 | –0.279 | –0.048 | –0.178 |
| GFR (mL/min/1.73 m2) | –0.355* | 0.329 | 0.069 | 0.205 |
Spearman’s rank correlation coefficient. *Correlation is significant at the < 0.05 level (2-tailed). **Correlation is significant at the < 0.01 level (2-tailed).
Contrary, irisin was positively correlated with weight and BMI in males (P < 0.05), also positively correlated with WC and WHtR (P < 0.01). No correlations were found between irisin and adropin levels and serum lipid markers.
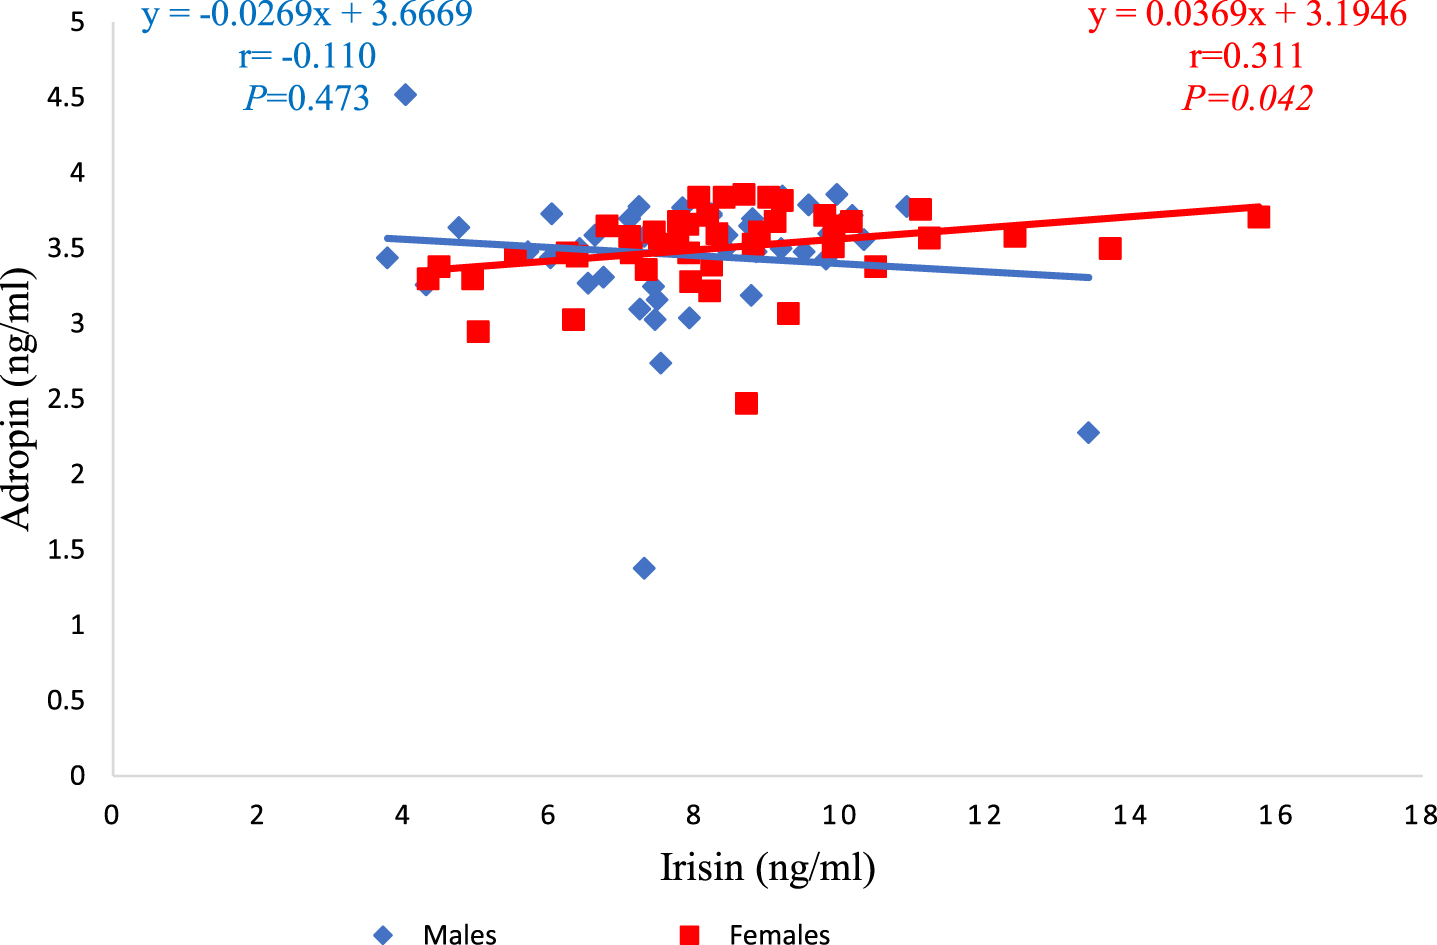
Furthermore, a separate analysis showed that adropin and irisin showed a significant positive correlation in females and not in males (r = 0.311; P = 0.042), as shown in Fig. 1.
Fig. 1
Relationship between serum irisin and adropin levels in both males and females groups.
4Discussion
The current study evaluated serum irisin and adropin levels in T2DM patients and their association with anthropometric obesity indices and biochemical markers. The main functions of adropin include regulating carbohydrate, lipid and protein metabolisms by regulating insulin release [27]. On the other hand, irisin regulates adipose tissue metabolism and glucose homeostasis by converting white to brown adipose tissue [28]. Valuable insight into the assessment of serum adropin and irisin levels in T2DM patients as both have an effect on glucose metabolism. Previous studies, however provide contradictory findings on serum adropin and irisin levels in T2DM patients.
In the current study, the relationship between adropin and anthropometric obesity indices was explored. There was a significant negative correlation between adropin concentration and weight, WC, WHtR, and BMI in female subjects. The results were consistent with findings by Zang et al. who reported that serum adropin level was negatively correlated with BMI [29]. It is worth stating that adropin is closely linked to obesity. Adropin levels in human subjects have been shown to decrease as obesity progresses. [3, 12]. Furthermore, adropin levels appeared to increase after bariatric surgery. Similarly, this study found that the female group’s mean WHtR and BMI were higher than the male group’s, which may explain why there was a negative association between anthropometric obesity indices and adropin in the female group but not in the male group.
Obesity is more prevalent in women than in men. One explanation for the gender gap in obesity may be that variations in reproductive hormone concentrations across women’s lives predispose them to excess weight gain [30]. A change in fat distribution and storage occurred during the menopausal period, particularly in the waist and hips area, which may be due to decreased levels of estrogen and increased levels of circulating androgens, which resulted in weight gain, particularly visceral fat [31]. The characteristics of the female participants in this study, such as age and menopausal status, support the preceding interpretation.
In this study, the glycemic control of the patients was classified as poor (HbA1c > 7%) and a significant negative correlation between adropin and serum glucose was found in all patients. On contrast, the males’ group showed a significant negative correlation between adropin and serum glucose and HbA1c. Our findings were in agreement with previous researches [12, 29, 32]. One possible reason that adropin plays an important role in maintaining metabolic homeostasis, increasing glucose utilization at the expense of fatty acids, improving glucose tolerance, and reducing insulin resistance [33].
Irisin was the other myokine examined in this study, involved in fat metabolism. The association between irisin and anthropometric obesity indices was seen only in the males’ group; weight, BMI, WC, and WHtR showed a significant positive correlation with irisin. The current study results were consistent with Park et al., who reported a positive association between irisin and BMI and WC in subjects with metabolic syndrome [34]. Also, Rana et al. reported that irisin had a positive association with BMI in T2DM patients [17]. Furthermore, Shoukry et al. reported that T2DM patients had positive association between irisin and weight, BMI, and WC [11]. The positive correlation between irisin and BMI, WC, and WHtR in the males’ group could be due to their muscle mass compared to females’ group. In contrast, muscle mass was the key predictor for circulating irisin [11].
Several clinical studies reported a significant decrease serum irisin levels in T2DM patients [35, 36], despite the fact that the current study didn’t assess serum irisin levels in T2DM patients and controls. The only research conducted in Jordan reported a significant decrease in the levels of irisin during Ramadan compared to prior to Ramadan (33.6 vs. 16.3; P = 0.003) in a group of healthy subjects [37].
The previous studies reported levels of adropin and irisin in T2DM patients regardless of gender; the positive or negative correlations were generalized across the subjects. As described above, both are adipo-myokines; they are affected by age, menopausal situation, presence of chronic complications of diabetes, body composition, physical activity, and fat consumption.
Interestingly, a significant positive correlation was found between adropin and irisin in the females’ group, though there was no significant difference between their serum levels based on gender. Gender variation in body composition may be one potential reason
There were several limitations to our current study. Firstly, our sample size was relatively small. This potentially limited the generalization of our recent findings. Secondly, it was highly probable that our observations in T2DM were confounded by variations in disease duration, diabetic complications. Thirdly, it is single-center prospective observational study on T2DM patients and was not compared with healthy subjects.
Further studies are needed to investigate the relationship between serum adropin and irisin in T2DM and normal subjects, taking in consideration the food consumption, the level of physical activity, and the use of oral hypoglycemic medications.
5Conclusion
The significant negative correlation between adropin, anthropometric obesity indices, and glycemic control indices and the significant positive correlation between irisin and anthropometric obesity indices demonstrate a possible role in the control of obesity and blood glucose. New myokines, in particular adropin and irisin, should be under further investigated in several diseases, including T2DM, as possible prognostic markers.
Acknowledgments
We are grateful to all the study subjects for their participation.
Funding information
This work was supported by The Hashemite University, fund number 111/2017.
Conflicts of Interest
The authors declare no conflict of interest.
References
[1] | Cho NH , Shaw JE , Karuranga S , Huang Y , da Rocha Fernandes JD , Ohlrogge AW , et al. IDF Diabetes Atlas: Global estimates of diabetes prevalence for 2017 and projections for 2045. Diabetes Res Clin Pract. (2018) ;138: :271–81. |
[2] | International Diabetes Federation. IDF Diabetes Atlas Brussels, Belgium2017 [cited 2019 February 2]. Available from: https://www.diabetesatlas.org/across-the-globe.html. |
[3] | Kumar KG , Trevaskis JL , Lam DD , Sutton GM , Koza RA , Chouljenko VN , et al. Identification of adropin as a secreted factor linking dietary macronutrient intake with energy homeostasis and lipid metabolism. Cell Metab. (2008) ;8: (6):468–81. |
[4] | Bostrom P , Wu J , Jedrychowski MP , Korde A , Ye L , Lo JC , et al. A PGC1-alpha-dependent myokine that drives brown-fat-like development of white fat and thermogenesis. Nature. (2012) ;481: (7382):463–8. |
[5] | Alzoughool F , Atoum M , Abuawad A , Abdelqader R , Alanagreh L , Hatmal M . Circulating irisin and adiponectin levels are positively associated with atrial fibrillation. Gazz Medica Ital Arch per Le Sci Mediche. (2019) ;178: (11):880–5. |
[6] | Chen S , Zeng K , Liu QC , Guo Z , Zhang S , Chen XR , et al. Adropin deficiency worsens HFD-induced metabolic defects. Cell Death Dis. (2017) ;8: (8):e3008. |
[7] | Hu W , Chen L . Association of Serum Adropin Concentrations with Diabetic Nephropathy. Mediators Inflamm. (2016) ;2016: :6038261. |
[8] | Hu W , Wang R , Li J , Zhang J , Wang W . Association of irisin concentrations with the presence of diabetic nephropathy and retinopathy. Ann Clin Biochem. (2016) ;53: (Pt 1):67–74. |
[9] | Li S , Sun J , Hu W , Liu Y , Lin D , Duan H , et al. The association of serum and vitreous adropin concentrations with diabetic retinopathy. Ann Clin Biochem. (2019) ;56: (2):253–8. |
[10] | Liu JJ , Wong MD , Toy WC , Tan CS , Liu S , Ng XW , et al. Lower circulating irisin is associated with type 2 diabetes mellitus. J Diabetes Complications. (2013) ;27: (4):365–9. |
[11] | Shoukry A , Shalaby SM , El-Arabi Bdeer S , Mahmoud AA , Mousa MM , Khalifa A . Circulating serum irisin levels in obesity and type 2 diabetes mellitus. IUBMB Life. (2016) ;68: (7):544–56. |
[12] | Ganesh Kumar K , Zhang J , Gao S , Rossi J , McGuinness OP , Halem HH , et al. Adropin deficiency is associated with increased adiposity and insulin resistance. Obesity (Silver Spring). (2012) ;20: (7):1394–402. |
[13] | Ghoshal S , Stevens JR , Billon C , Girardet C , Sitaula S , Leon AS , et al. Adropin: An endocrine link between the biological clock and cholesterol homeostasis. Mol Metab. (2018) ;8: :51–64. |
[14] | American Association of Diabetes Educators. Addressing Obesity In Diabetes. 2018. |
[15] | Butler AA , Tam CS , Stanhope KL , Wolfe BM , Ali MR , O’Keeffe M , et al. Low circulating adropin concentrations with obesity and aging correlate with risk factors for metabolic disease and increase after gastric bypass surgery in humans. J Clin Endocrinol Metab. (2012) ;97: (10):3783–91. |
[16] | de Alencar JbP , Luna F M , Coelho M B , de Morais R M , Neto J A , Filho M S , et al. Low Irisin Levels in Patients with Type 2 Diabetes Mellitus without Current Treatment: a Systematic Review. International Archives of Medicine. (2017) ;10: (171). |
[17] | Rana KS , Pararasa C , Afzal I , Nagel DA , Hill EJ , Bailey CJ , et al. Plasma irisin is elevated in type 2 diabetes and is associated with increased E-selectin levels. Cardiovasc Diabetol. (2017) ;16: (1):147. |
[18] | Rodriguesa K , Pietrania N , Boscob A , Ferreirac C , Gomesad K . Circulating irisin is increased in type 2 diabetes mellitus and correlates with fasting glucose levels. Apollo Medicine. (2016) ;13: (3):152–5. |
[19] | Chang JS , Kim TH , Nguyen TT , Park KS , Kim N , Kong ID . Circulating irisin levels as a predictive biomarker for sarcopenia: A cross-sectional community-based study. Geriatr Gerontol Int. (2017) ;17: (11):2266–73. |
[20] | Xuan X , Lin J , Zhang Y , Zhou L , Xu L , Jia J , et al. Serum Irisin Levels and Clinical Implication in Elderly Patients With Type 2 Diabetes Mellitus. J Clin Med Res. (2020) ;12: (9):612–7. |
[21] | Hu W , Chen L . Association of Serum Adropin Concentrations with Diabetic Nephropathy. Mediators of Inflammation. (2016) ;2016: :6038261. |
[22] | Allain CC , Poon LS , Chan CS , Richmond W , Fu PC . Enzymatic determination of total serum cholesterol. Clin Chem. (1974) ;20: (4):470–5. |
[23] | Fossati P , Prencipe L . Serum triglycerides determined colorimetrically with an enzyme that produces hydrogen peroxide. Clin Chem. (1982) ;28: (10):2077–80. |
[24] | Friedewald WT , Levy RI , Fredrickson DS . Estimation of the concentration of low-density lipoprotein cholesterol in plasma, without use of the preparative ultracentrifuge. Clin Chem. (1972) ;18: (6):499–502. |
[25] | Kume T , Saglam B , Ergon C , Sisman AR . Evaluation and comparison of Abbott Jaffe and enzymatic creatinine methods: Could the old method meet the new requirements? J Clin Lab Anal. (2018) ;32: (1). |
[26] | Levey AS , Coresh J , Greene T , Stevens LA , Zhang YL , Hendriksen S , et al. Using standardized serum creatinine values in the modification of diet in renal disease study equation for estimating glomerular filtration rate. Ann Intern Med. (2006) ;145: (4):247–54. |
[27] | Aydin S . Three new players in energy regulation: preptin, adropin and irisin. Peptides. (2014) ;56: :94–110. |
[28] | Arhire LI , Mihalache L , Covasa M . Irisin: A Hope in Understanding and Managing Obesity and Metabolic Syndrome. Front Endocrinol (Lausanne). (2019) ;10: :524. |
[29] | Zang H , Jiang F , Cheng X , Xu H , Hu X . Serum adropin levels are decreased in Chinese type 2 diabetic patients and negatively correlated with body mass index. Endocr J. (2018) ;65: (7):685–91. |
[30] | Lovejoy JC . The influence of sex hormones on obesity across the female life span. J Womens Health. (1998) ;7: (10):1247–56. |
[31] | Lombardo M , Perrone MA , Guseva E , Aulisa G , Padua E , Bellia C , et al. Losing Weight after Menopause with Minimal Aerobic Training and Mediterranean Diet. Nutrients. (2020) ;12: (8). |
[32] | Hosseini A , Shanaki M , Emamgholipour S , Nakhjavani M , Razi F , Golmohammadi T . Elevated Serum Levels of Adropin in Patients with Type 2 Diabetes Mellitus and its Association with Insulin Resistance. J Biol Today’s World. (2016) ;5: (3):44–9. |
[33] | Jasaszwili M , Billert M , Strowski MZ , Nowak KW , Skrzypski M . Adropin as A Fat-Burning Hormone with Multiple Functions-Review of a Decade of Research. Molecules. (2020) ;25: (3). |
[34] | Park KH , Zaichenko L , Brinkoetter M , Thakkar B , Sahin-Efe A , Joung KE , et al. Circulating irisin in relation to insulin resistance and the metabolic syndrome. J Clin Endocrinol Metab. (2013) ;98: (12):4899–907. |
[35] | Zhang C , Ding Z , Lv G , Li J , Zhou P , Zhang J . Lower irisin level in patients with type 2 diabetes mellitus: A case-control study and meta-analysis. J Diabetes. (2016) ;8: (1):56–62. |
[36] | Xiang L , Xiang G , Yue L , Zhang J , Zhao L . Circulating irisin levels are positively associated with endothelium-dependent vasodilation in newly diagnosed type 2 diabetic patients without clinical angiopathy. Atherosclerosis. (2014) ;235: (2):328–33. |
[37] | Alzoughool F , Al Hourani H , Atoum M , Abdelgader R , Alanagreh L . Irisin, leptin and adiponectin levels are reduced significantly during fasting. Mediterranean Journal of Nutrition and Metabolism. (2019) ;12: (4):389–96. |


