
Quercetin supplementation attenuates muscle wasting in cancer-associated cachexia in mice
Abstract
BACKGROUND:
Quercetin is a flavonoid with reported antioxidant, anti-inflammatory and anti-aging effects, and may limit muscle wasting in cancer cachexia.
OBJECTIVE:
To investigate the effect of quercetin on muscle wasting in the murine C26 cancer-cachexia model and assess the feasibility of non-invasive micro-CT analysis of skeletal muscle.
MATERIALS AND METHODS:
Custom CRM(P) diets supplemented with 250 mg/kg quercetin (Q) were obtained. Thirty CD2F1 mice were equally randomized to non-tumor-bearing (NTB), C26 tumor-bearing (TB), TB + Q. All groups started their allocated diet and underwent hindlimb micro-CT. Bodyweight, food intake, and grip-strength were recorded periodically. After 21 days, repeat micro-CT was performed. Gastrocnemius (GCM) and tibialis anterior (TA) muscles were resected. mRNA expression of MuRF1, Atrogin-1, myogenin, and MyoD was determined.
RESULTS:
NTB and TB + Q gained 9.4% and 5.3% bodyweight respectively, TB lost 3.9%. Hind limb skeletal muscle volume remained stable for NTB and TB + Q, whereas TB decreased from 242.0 mm3 to 212.8 mm3. Mean GCM muscle weight was 175.2 mg (NTB), 171.3 mg (TB + Q) versus 125.5 mg (TB). A tendency towards decreased expression of atrogin-1 and MuRF1 was observed in TB + Q.
CONCLUSION:
Dietary quercetin supplementation limits bodyweight loss and muscle wasting in the C26-cancer-associated cachexia model.
1Introduction
Progressive muscle wasting is a characteristic feature of cachexia commonly observed in cancer patients [1]. This multi factorial syndrome cannot be fully reversed by conventional nutritional support and leads to progressive functional impairment [1, 2]. Up to 50 percent of all cancer patients are faced with cachexia during the course of their disease and up to 20 percent of all cancer-associated deaths may be attributed to cachexia [3–5]. The etiology of cancer cachexia is not yet fully understood, however catabolic pro-inflammatory cytokines are suggested to be of key importance. The most frequently described cytokines associated with cachexia include interleukin-6 (IL-6), tumor necrosis factor alpha (TNF-α), interferon gamma (IFN-γ), and interleukin-1-beta (IL-1B) [6–8].
Treatment of cancer cachexia may be directed at reduction of synthesis or blocking the action of the aforementioned pro-inflammatory cytokines. By doing so, it may contribute to improving the patient quality of life and, possibly, even prolong survival [9]. Not just the development of novel pharmaceutical strategies has been suggested to limit the activity of catabolic cytokines in cancer cachexia, but also dietary interventions have been proposed [9]. For instance dietary supplementation with long-chain omega-3 fatty acid eicosapentaenoic acid (EPA) in cachectic patients appeared promising in initial studies [10]. Later studies, however, conclude that there is insufficient evidence to support the clinical application of EPA for the treatment of cancer cachexia [11, 12]. In contrast, the leucine metabolite β-hydroxy-β-methyl-butyrate (HMB) limits muscle wasting in experimental cachexia [13–15] and has been found to attenuate muscle loss in a clinical trial [16, 17]. Additionally, quercetin has recently been described as to limit muscle wasting in vivo [14]. Quercetin is a plant pigment (flavonoid). It is found in many vegetables, herbs, and fruits such as capers, dill, cilantro, red onion, broccoli, berries, and apples [18]. Its antioxidant, anti-inflammatory, and anti-aging effects have previously been described [19–22]. Quercetin supplementation decreases circulating markers of inflammation [23]. In both an APC knockout cachexia model as well as an obesity model quercetin supplementation limited associated loss of muscle mass [14, 24].
In this current study, we sought to investigate the potential of quercetin in the C26 adenocarcinoma cancer cachexia model, a well-established model of cancer cachexia in mice [25], and assess the feasibility of micro-CT analysis as a novel non-invasive and potentially supplemental technique of skeletal muscle measurement.
2Materials & methods
2.1Animal ethics committee approval
All animal experiments were performed with the approval of the Erasmus MC, Rotterdam, the Netherlands Animal Ethics Committee and in accordance to the Dutch National Experiments on Animal Act, and complied with the EU adopted Directive 86/609/EEC (1986).
2.2Animals
Thirty male CD2F1 (BALB/c×DBA/2) F1 mice of 8 weeks (∼25 grams) were obtained from Charles River, Maastricht, the Netherlands. Upon arrival, animals have been housed in individually ventilated cages and maintained at 22°C under a 12 h light-dark cycle with ad libitum access to CRM (P) chow (Special Diet Services, Witham, Essex, UK) and water (n = 3–4 animals per cage). Animals were acclimatized for one week prior to the start of the experiments.
2.3Quercetin
Quercetin was obtained from Sigma-Aldrich, Zwijndrecht, the Netherlands (product code Q4951 SIGMA) and after arrival at our institution immediately shipped through to Special Diet Services for the purpose of manufacturing a custom quercetin supplemented diet.
2.4CRM(P) chow
CRM (P) chow with and without supplemented quercetin was obtained from Special Diet Services, Witham, Essex, UK. Diet composition is detailed in Table 1. A concentration of 250 mg quercetin per kg chow was manufactured for purpose of this study. This concentration corresponds with an expected daily intake of 35 mg per kg of body weight per mouse per day. All mice started with their allocated diets on the first day of the experiment.
Table 1
Rat and mouse breeder and grower diet, pelleted (CRM(P))
| Nutrients | Total | Of which added* | |
| Proximate analysis | |||
| Moisture (l) | % | 10.00 | |
| Crude oil | % | 3.36 | |
| Crude protein | % | 18.35 | |
| Crude fiber | % | 4.23 | |
| Ash | % | 6.27 | |
| Nitrogen free extract | % | 57.39 | |
| Digestibility coefficients | |||
| Digestible crude oil | % | 3.05 | |
| Digestible crude protein | % | 16.44 | |
| Carbohydrates, fiber and non-starch polysaccharides (NSP) | |||
| Total dietary fiber | % | 15.06 | |
| Pectin | % | 1.40 | |
| Hemicellulose | % | 8.85 | |
| Cellulose | % | 3.89 | |
| Lignin | % | 14.0 | |
| Starch | % | 42.37 | |
| Sugar | % | 3.90 | |
| Energy | |||
| Gross energy | Mj/kg | 15.01 | |
| Digestible energy | Mj/kg | 12.27 | |
| Metabolizable energy | Mj/kg | 11.19 | |
| At water fuel energy (AFE) | Mj/kg | 13.93 | |
| AFE from oil | % | 9.08 | |
| AFE from protein | % | 42.37 | |
| AFE from carbohydrate | % | 68.90 | |
| Fatty acids | |||
| Saturated fatty acids | |||
| C12 : 0 Lauric | % | 0.03 | |
| C14 : 0 Myristic | % | 0.14 | |
| C16 : 0 Palmitic | % | 0.33 | |
| C18 : 0 Stearic | % | 0.06 | |
| Monosaturated fatty acids | |||
| C14 : 1 Myristoleic | % | 0.02 | |
| C16 : 1 Palmitoleic | % | 0.10 | |
| C18 : 1 Oleic | % | 0.87 | |
| Polyunsaturated fatty acids | |||
| C18 : 2(ω6) Linoleic | % | 0.96 | |
| C18 : 3(ω3) Linolenic | % | 0.11 | |
| C20 : 4(ω6) Arachidonic | % | 0.11 | |
| C22 : 5(ω3) Clupanodonic | % | ||
| Amino acids | |||
| Arginine | % | 1.19 | |
| Lysine | % | 1.04 | 0.17 |
| Methionine | % | 0.28 | 0.02 |
| Cystine | % | 0.29 | |
| Tryptophan | % | 0.22 | |
| Histidine | % | 0.46 | |
| Threonine | % | 0.69 | |
| Isoleucine | % | 0.77 | |
| Leucine | % | 1.46 | |
| Phenylaniline | % | 0.96 | |
| Valine | % | 0.91 | |
| Tyrosine | % | 0.69 | |
| Taurine | % | ||
| Glycine | % | 1.55 | |
| Aspartic acid | % | 1.00 | |
| Glutamic acid | % | 3.72 | |
| Proline | % | 1.34 | |
| Serine | % | 0.78 | |
| Hydroxyproline | % | ||
| Hydroxylysine | % | ||
| Alanine | % | 0.21 | |
| Macro minerals | |||
| Calcium | % | 0.83 | 0.72 |
| Total phosphorus | % | 0.64 | 0.19 |
| Phytate phosphorus | % | 0.23 | |
| Available phosphorus | % | 0.41 | 0.19 |
| Sodium | % | 0.27 | 0.22 |
| Chloride | % | 0.40 | 0.35 |
| Potassium | % | 0.69 | |
| Magnesium | % | 0.22 | 0.01 |
| Micro minerals | |||
| Iron | mg/kg | 130.65 | 60.21 |
| Copper | mg/kg | 16.42 | 6.90 |
| Manganese | mg/kg | 91.05 | 44.90 |
| Zinc | mg/kg | 86.59 | 52.86 |
| Cobalt | μg/kg | 494.92 | 420.30 |
| Iodine | μg/kg | 390.43 | 310.17 |
| Selenium | μg/kg | 265.49 | 100.34 |
| Fluorine | mg/kg | 9.63 | |
| Vitamins | |||
| β-Carotene | mg/kg | 1.28 | |
| Retinol | μg/kg | 5218.35 | 4500.38 |
| Vitamin A | iu/kg | 17376.38 | 15001.26 |
| Cholecalciferol | μg/kg | 76.94 | 75.00 |
| Vitamin D | iu/kg | 3077.42 | 3000.00 |
| α-Tocopherol | mg/kg | 93.03 | 72.81 |
| Vitamin E | iu/kg | 102.81 | 80.09 |
| Vitamin B1 (Thiamine) | mg/kg | 15.84 | 9.83 |
| Vitamin B2 (Riboflavin) | mg/kg | 13.28 | 11.76 |
| Vitamin B6 (Pyridoxine) | mg/kg | 17.65 | 13.74 |
| Vitamin B12 (Cyanocobalamin) | μg/kg | 78.17 | 75.00 |
| Vitamin C (Ascorbic acid) | mg/kg | 1.80 | |
| Vitamin K (Menadione) | mg/kg | 185.05 | 180.00 |
| Folic acid (Vitamin B9) | mg/kg | 4.30 | 2.94 |
| Nicotinic acid (Vitamin PP) | mg/kg | 78.92 | 27.65 |
| Pantothenic acid (Vitamin B3/5) | mg/kg | 25.24 | 11.56 |
| Choline (Vitamin B4/7) | mg/kg | 899.51 | 75.63 |
| Inositol | mg/kg | 2253.88 | 12.78 |
| Biotin (Vitamin H) | μg/kg | 488.74 | 230.85 |
The control diet used in the current study is the rat and mouse breeder and grower diet, pelleted (CRM(P)), obtained from Special Diet Services (SDS). *Added nutrients from manufactured and mined sources. Ingredients (wheat, wheat feed, barley, de-hulled extracted toasted soya, maize, macro minerals, soya oil, potato protein, hydrolyzed wheat gluten, full fat soya, maize gluten meal, vitamins, micro minerals, amino acids) and the calculated analysis in the table above are retrieved from the SDS CRM(P) product specification sheet [51]. The quercetin supplemented diet was manufactured with the addition of 250 mg quercetin per kg chow to the base diet detailed in this table.
2.5C26 Tumor-bearing mice
Colon-26 (C26) adenocarcinoma cells (kindly provided by Dr. D.O. McCarthy, Ohio State University, Columbus, OH, USA) were maintained in RPMI 1640 (Westburg BV, Leusden, The Netherlands) supplemented with 10% fetal bovine serum (FBS, Sigma-Aldrich, St. Louis, The United States of America), and 1% penicillin/streptomycin (P/S, Fisher Scientific, Waltham, The United States of America) at 37°C in a 5% carbon dioxide environment. On the first day of the experiment, animals allocated to tumor-bearing (TB) groups received a subcutaneous (SC) inoculation in the right flank with 0.5×10⁶ C26 adenocarcinoma cells in 100μL sterile PBS under anesthesia by isoflurane inhalation (5% isoflurane induction). This is a well-established model of cancer cachexia in mice [25].
2.6Assessment of grip-strength
Combined hind- and forelimb grip strength was measured twice per week by placing the animal on a grid attached to a force gauge (BIOSEB, Chaville, France), and steadily pulling the mice by the tail along the sensor axle until grip is released. Maximum strength produced before releasing the grid was registered in triplicate with one minute rest period for each animal. Obtained values were averaged to provide a mean force measurement for each individual animal and subsequently normalized to each animal’s grip-strength respectively on day 0. All measurements were performed blind with respect to treatment.
2.7Skeletal muscle volumetric measurement by micro-CT
In clinical cachexia imaging modalities such as CT are frequently used to determine muscle mass [26, 27]. For rodents micro-CT is available as a non-invasive method for screening anatomical change [28]. High spatial resolution and temporal resolution allow capture of detailed anatomical imaging and monitor disease progression in rodents [28, 29]. The absorbed radiation dose from serial micro-CT imaging is low and likely below the threshold for carcinogenesis [30]. This makes micro-CT analysis an interesting novel approach in the assessment of muscle weight loss in experimental cancer cachexia.
Hind limb imaging was performed in all animals prior to the start of the experiment, and once more directly preceding sacrifice. Under anesthesia by isoflurane inhalation animals were positioned on the left flank, and had their right hindlimb fixed in extended position. Images were obtained using a Quantum FX (Perkin Elmer, Waltham, MA, USA) low-dose micro computed tomography (μCT) scanner which scanned at 90 kV of peak voltage, with 160μA of current, 40 mm field of view, and 4.5-minute scan time. Obtained scans were subsequently analyzed using Analyze 11.0 (Analyze Direct, Inc., Lenexa, KS, USA). This was done by manually delineating the skeletal muscle of the right hindlimb from the tibial surface proximally to the malleoli distally and segmenting the tissue of interest based on HU thresholds (–30 HU to +150 HU for skeletal muscle [26]).
2.8Bodyweight, muscle mass, and tumor size
Bodyweight was recorded daily. Bodyweight was normalized to each animal’s bodyweight on day 0. Tumor size was recorded every other day starting on day 9 after tumor inoculation using digital calipers. Tumor mass was estimated via the formula mass(mg) = tumor volume (mm3) = width2 × length/2 [31]. Animals were sacrificed by cervical dislocation under isoflurane anesthesia on day 21 or upon body weight loss exceeding 20%. Gastrocnemius (GCM), tibialis anterior (TA) and soleus (Sol) muscles of both hind legs and tumor were dissected and weighed. Muscle weight from the left and right hind leg were averaged to provide a mean muscle weight (GCM, TA, and Sol) for each animal. Muscle samples were immediately snap-frozen in liquid nitrogen and stored at –80°C until analysis.
2.9RNA isolation and real-time polymerase chain reaction
Cancer-cachexia associated muscle wasting is known to be most pronounced in fast-twitch type II-containing muscles, such as GCM and TA [32]. Therefore, for gene expression analysis, total RNA was isolated from snap-frozen GCM muscle tissue using Trizol reagent (Invitrogen, Breda, the Netherlands), and subsequently purified by DNase treatment (RQ1 RNase-Free DNase) (Promega Benelux B.V., Leiden, the Netherlands). 1μg of total RNA was reversed transcribed to cDNA using random hexamer primers (Invitrogen, Breda, the Netherlands), and Superscript II RT (Invitrogen, Breda, the Netherlands). Quantitative real-time polymerase chain reaction (RT-PCR) was performed using an iCycler real-time PCR system (Biorad, California, The United States of America) using SYBR Green (Sigma-Aldrich, St. Louis, The United States of America). Used primer sequences can be found in Table 2. GAPDH was used as housekeeping gene for normalization. Relative gene expression fold change was calculated with the comparative delta-delta Ct method (2-ΔΔCt)/(average 2-ΔΔCt(healthy controls)) [33]. Each sample was tested in duplicate.
Table 2
Reverse transcription-polymerase chain reaction primer sequences
| Gene | Forward primer | Reverse primer | Genbank accession number |
| Atrogin1 | 5′-GTTTTCAGCAGGCCAAGAAG | 5′-TTGCCAGAGAACACGCTATG | AF_441120 |
| MyoD | 5′-AAACCCCAATGCGATTTATCAGG | 5′-TAAGCTTCATCTTTTGGGCGTGA | NM_010866 |
| Myogenin | 5′CACTCCCTTACGTCCATCGT | 5′-CAGGACAGCCCCACTTAAAA | NM_031189 |
| Murf1 | 5′-AGGTGTCAGCGAAAAGCAGT | 5′-CCTCCTTTGTCCTCTTGCTG | NM009066 |
| GAPDH | 5′-ATGCATCCTGCACCACCAACT | 5′-CAGTGATGGCATGGACTGTG | NM_008084 |
2.10Statistics
Categorical data are expressed as number (percentage) and continuous variables as mean±SEM (normal distribution, visually assessed and by means of the Shapiro-Wilks test). Body weight and grip-strength were normalized to each animal’s body weight and grip-strength respectively on day 0. Muscle weight from the left and right hind leg were averaged to provide a mean GCM and TA muscle weight for each animal. Multiple group comparisons were done by one-way ANOVA with a Bonferroni’s posthoc test. Spearman-Rho rank correlation coefficient was used for testing bivariate correlations. All analyses were performed using IBM SPSS Statistics for Windows, version 21.0 (IBM Corp., Armonk, NY, USA). A P value <0.05 was considered statistically significant.
3Results
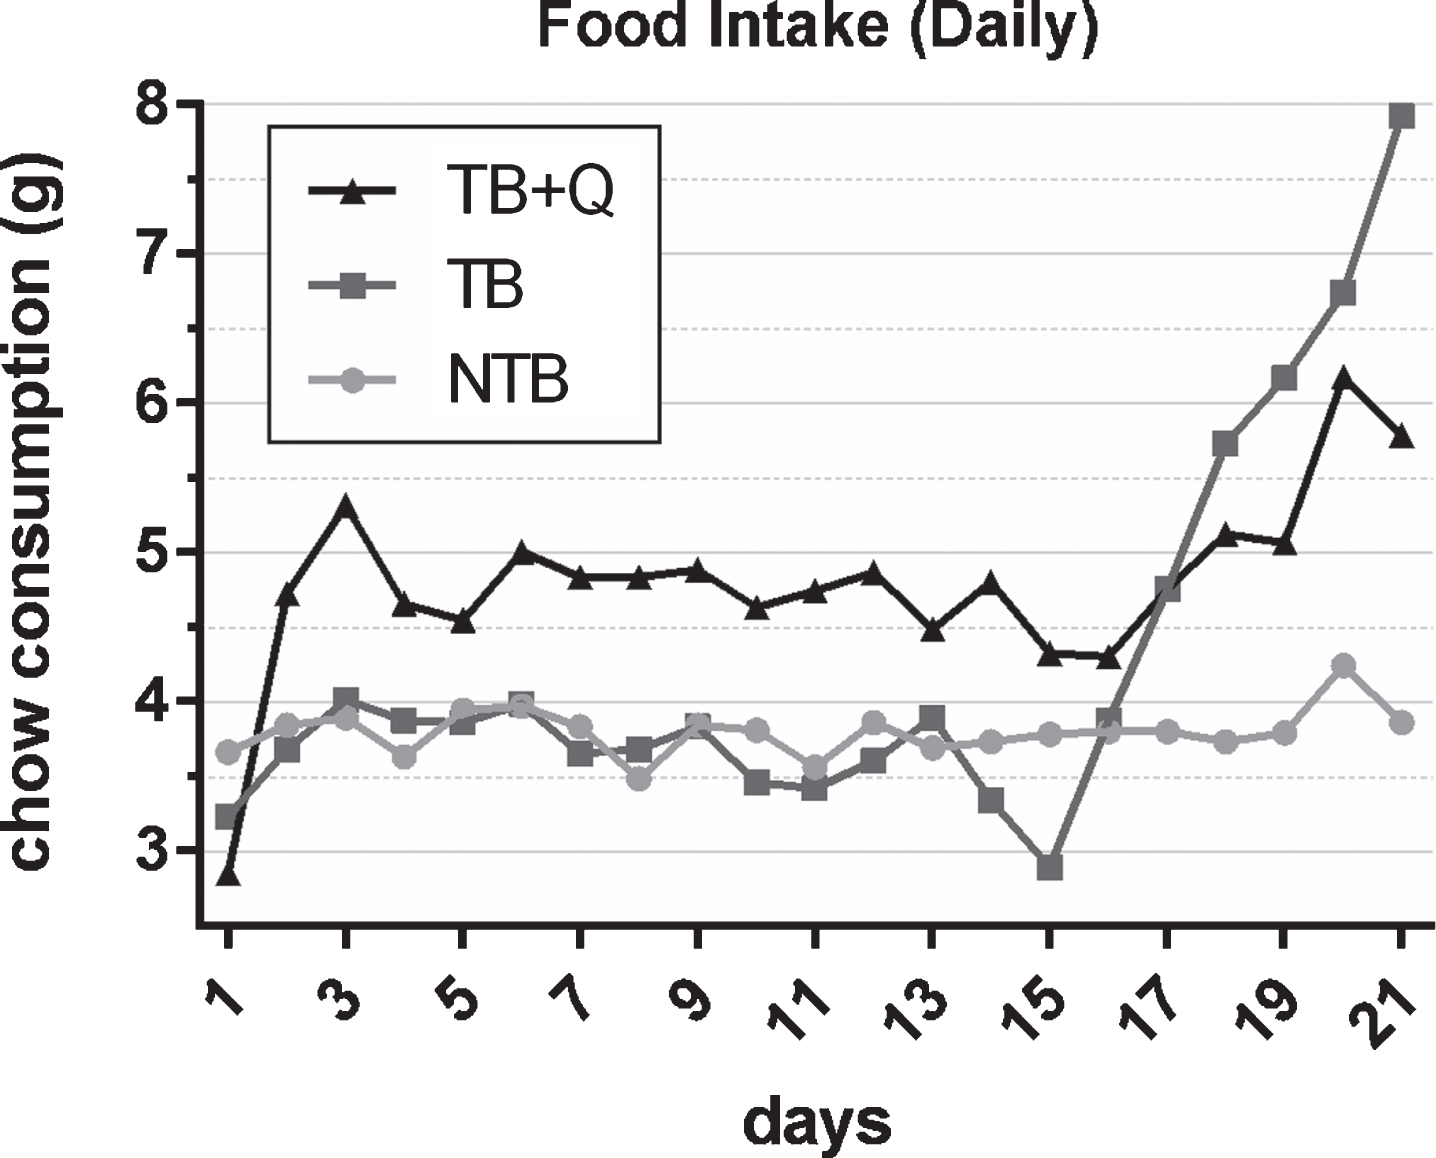
To study the effects of a quercetin supplemented diet, thirty CD2F1 mice were randomly allocated to three groups, i.e. non-tumor bearing (NTB) with access to regular chow, tumor-bearing (TB) with access to regular chow, and tumor-bearing with access to chow supplemented with 250 mg quercetin per kg chow (TB + Q), starting on the first day of the experiment. Simultaneously, mice allocated to tumor-bearing groups were inoculated subcutaneously with 0.5×10⁶ C26 adenocarcinoma cells. Body weight was recorded daily. During the experiment NTB mice gained 9.4 % bodyweight, whereas TB mice lost 3.9% bodyweight (p < 0.0001) (Fig. 1). Tumor-bearing mice showed a decrease in body weight on the first day after changing the diet to quercetin supplemented, likely as a result of the different taste of this diet. Thereafter, however, they gained 5.3% bodyweight, which was significant when compared to tumor-bearing mice on a regular diet (p = 0.0024). Daily food intake was relatively constant for non-tumor-bearing mice throughout the experiment with a mean daily intake of 3.8 g chow per mouse (Fig. 2). For tumor-bearing mice, on a regular diet, comparable food intake was observed during the first two weeks of the experiment. Throughout the last 7 days of the experiment, these mice showed a gradual increase in daily food intake up to a mean of 7.9 g chow per mouse on the last timepoint. Mice on the quercetin diet had an increased intake throughout the experiment, starting rapidly after initiation of this diet, resulting in a mean daily intake of 4.7 g chow per mouse during the first two weeks of the experiment. These tumor-bearing mice on a quercetin diet too were observed to increase their daily food intake during the last 7 days of the experiment, up to a maximum mean of 6.2 g chow per mouse on the 20th day of the experiment.
Fig.1
Daily bodyweight throughout the experiment. Line chart depicting the mean±SEM daily bodyweights per group in non-tumor-bearing male CD2F1 mice (NTB, n = 10), C26 tumor-bearing (TB, n = 10) mice with ad libitum access to regular chow, and C26 TB mice with ad libitum access to quercetin supplemented chow (TB + Q, n = 10). Bodyweight was normalized to each animal’s bodyweight on day 0 and is expressed as the percental difference. Mice in the TB group experienced a significant loss of bodyweight in comparison to both TB + Q and NTB mice.
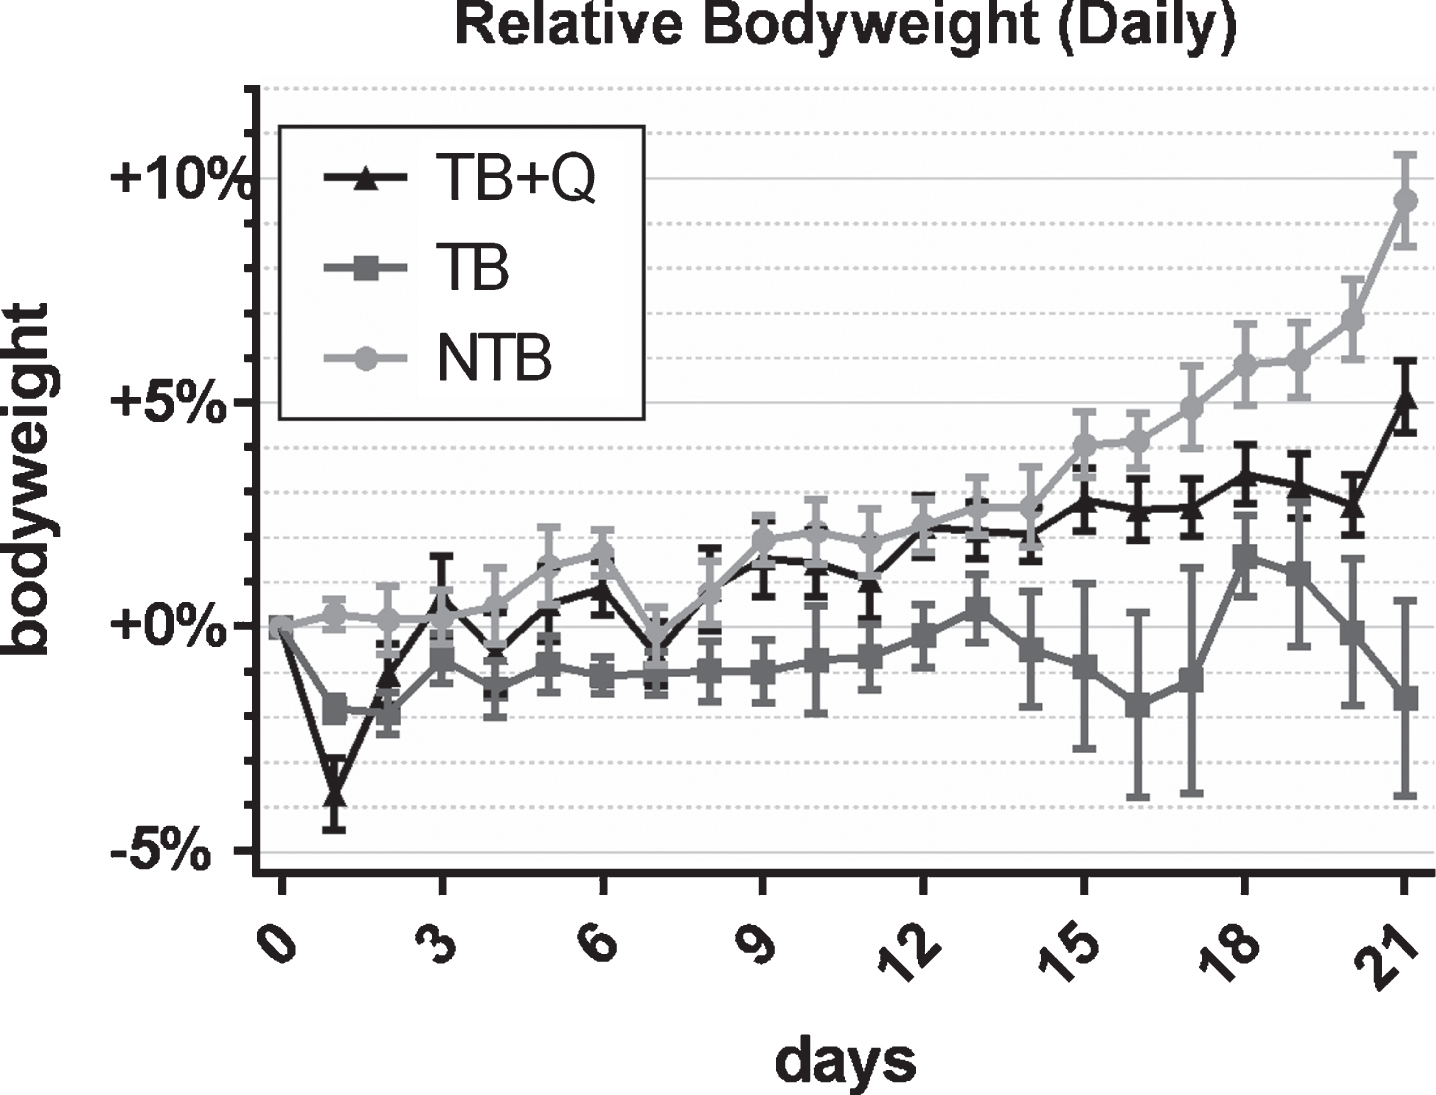
Fig.2
Daily food intake throughout the experiment. Line chart depicting the mean daily food intake over the prior 24 hours per group in non-tumor-bearing male CD2F1 mice (NTB, n = 10), C26 tumor-bearing (TB) mice with ad libitum access to regular chow (C26 TB, n = 10) and mice with ad libitum access to quercetin supplemented chow (TB + Q, n = 10). Food intake was measured per cage and subsequently averaged per mouse. Food intake is expressed in grams (g). Food intake of TB mice was comparable to NTB mice throughout the first two weeks, subsequently, daily chow consumption more than doubled. TB + Q mice had an overall higher chow consumption throughout the first two weeks, subsequently, a minor increase in chow consumption was observed in the final days of the experiment.
3.1Grip-strength assessment
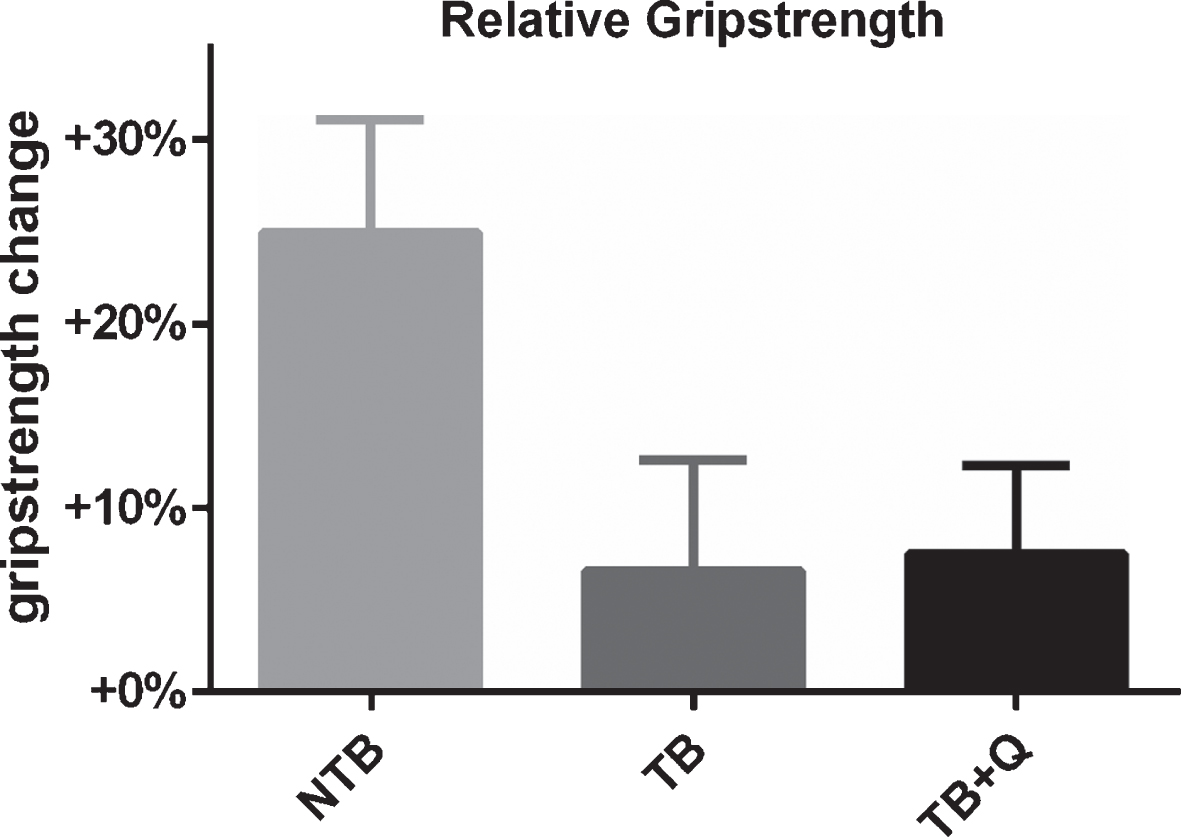
Grip-strength was assessed twice per week. NTB mice showed an increase in grip-strength over the course of the experiment. This increase registered up to 24.7% at the end of the experiment (Fig. 3). TB mice, on the other hand, showed a limited increase of 6.7% at the end of the experiment, this difference did not reach significance (p = 0.06). Tumor-bearing mice on a quercetin supplemented diet had a comparable grip-strength to the tumor-bearing mice on a regular chow diet. These mice too showed a limited increase in grip-strength of 7.6%.
Fig.3
Relative grip-strength at the end of the experiment. Bar graphs depicting the mean±SEM for final grip-strength normalized to starting grip-strength in non-tumor-bearing male CD2F1 mice (NTB, n = 10), C26 tumor-bearing (TB) mice with ad libitum access to regular chow (C26 TB, n = 10) and mice with ad libitum access to quercetin supplemented chow (TB + Q, n = 10). Multiple group comparisons were done by one-way ANOVA with a Bonferroni’s posthoc test. All groups were compared against TB mice. A substantial, non-significant difference in relative grip-strength was observed between TB and NTB mice. TB + Q relative grip-strength was comparable to TB mice.
3.2Micro-CT hindlimb skeletal muscle volumetry
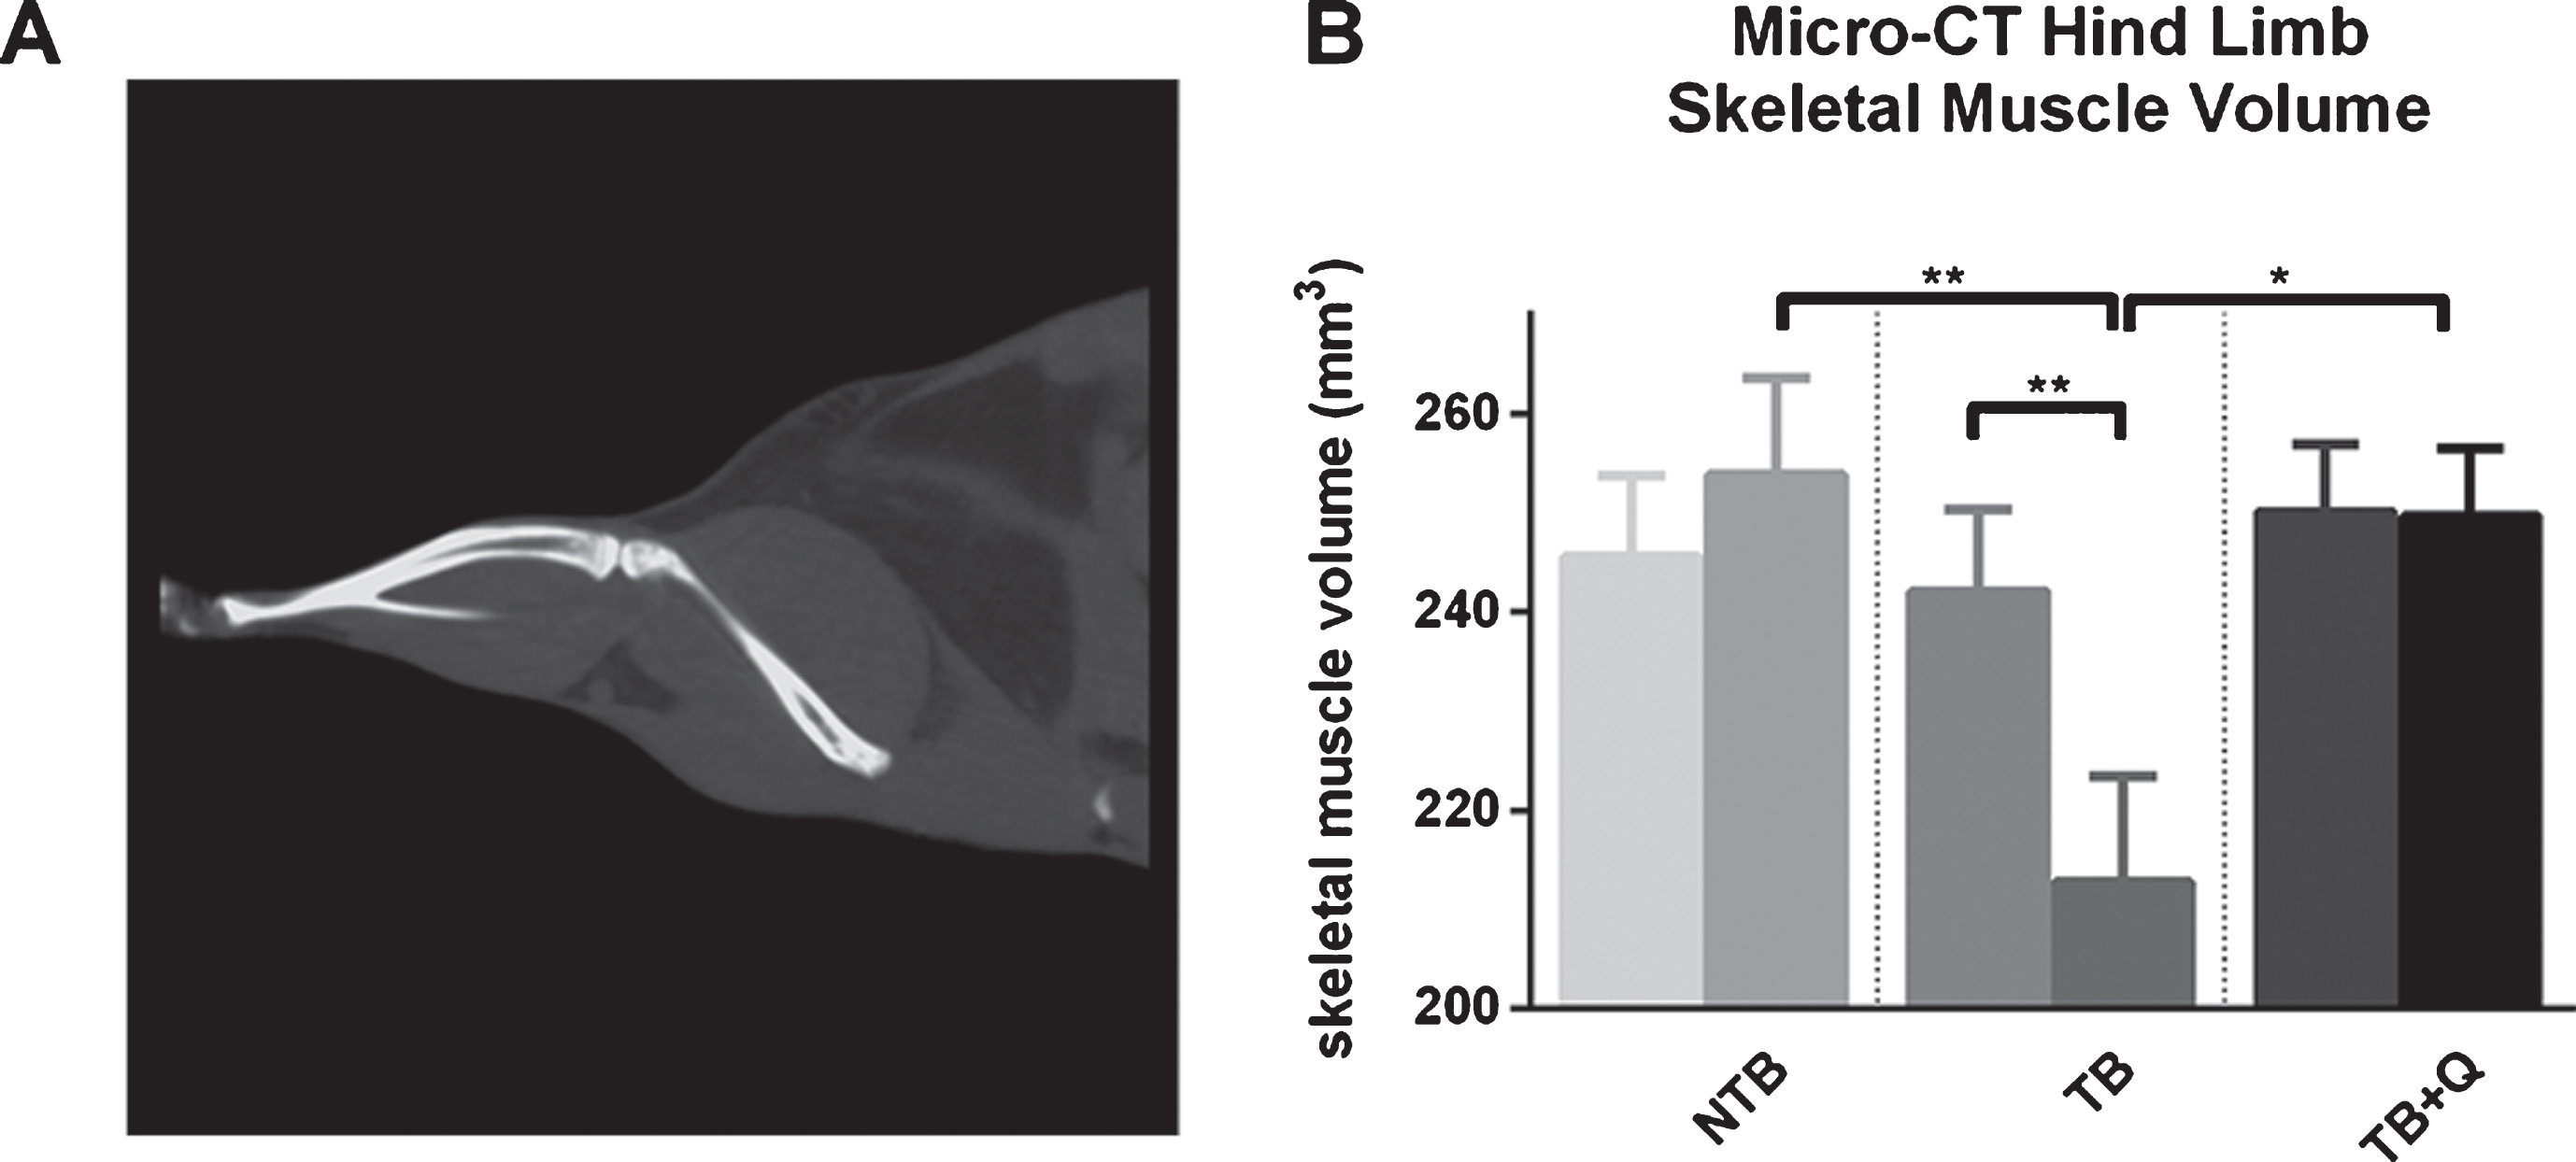
Hind limb skeletal muscle volumetric measurements by micro-CT (Fig. 4A) on day 1 were comparable for all three groups; 245.6 mm3 for NTB mice, 242.0 mm3 for TB mice, and 250.1 mm3 for TB + Q mice (Fig. 4B). No significant change was observed in skeletal muscle volume on day 21 for NTB mice and TB + Q mice; 253.8 mm3 for NTB mice, and 249.6 mm3 for TB + Q mice. Tumor-bearing mice on a regular chow diet experienced a decrease in skeletal muscle volume to 212.8 mm3 on day 21 (p = 0.006). These differences between NTB and TB, as well as TB + Q and TB, were significant with respective p-values of 0.0078 and 0.0172. A high positive correlation is observed between skeletal muscle volume on day 21 and combined right hindlimb muscle weight (GCM, TA, and Sol) at sacrifice (Spearman’s rho = 0.718, p < 0.0001).
Fig.4
Micro-CT hindlimb skeletal muscle mass volumetric. (A) Micro-CT image depicting the hindlimb musculature. (B) Bar graphs depicting the mean±SEM for micro-CT skeletal muscle volume on day 1 and day 21 respectively in non-tumor-bearing male CD2F1 mice (NTB, n = 10), C26 tumor-bearing (TB) animals with ad libitum access to regular chow (C26 TB, n = 10)and mice with ad libitum access to quercetin supplemented chow (TB+Q, n = 10). Multiple group comparisons were done by one-way ANOVA with a Bonferroni’s posthoc test. All groups were compared against TB mice. Comparisons between multiple time-points were done by paired samples t-test. *p < 0.05 **p < 0.01.
3.3Muscle and tumor weight
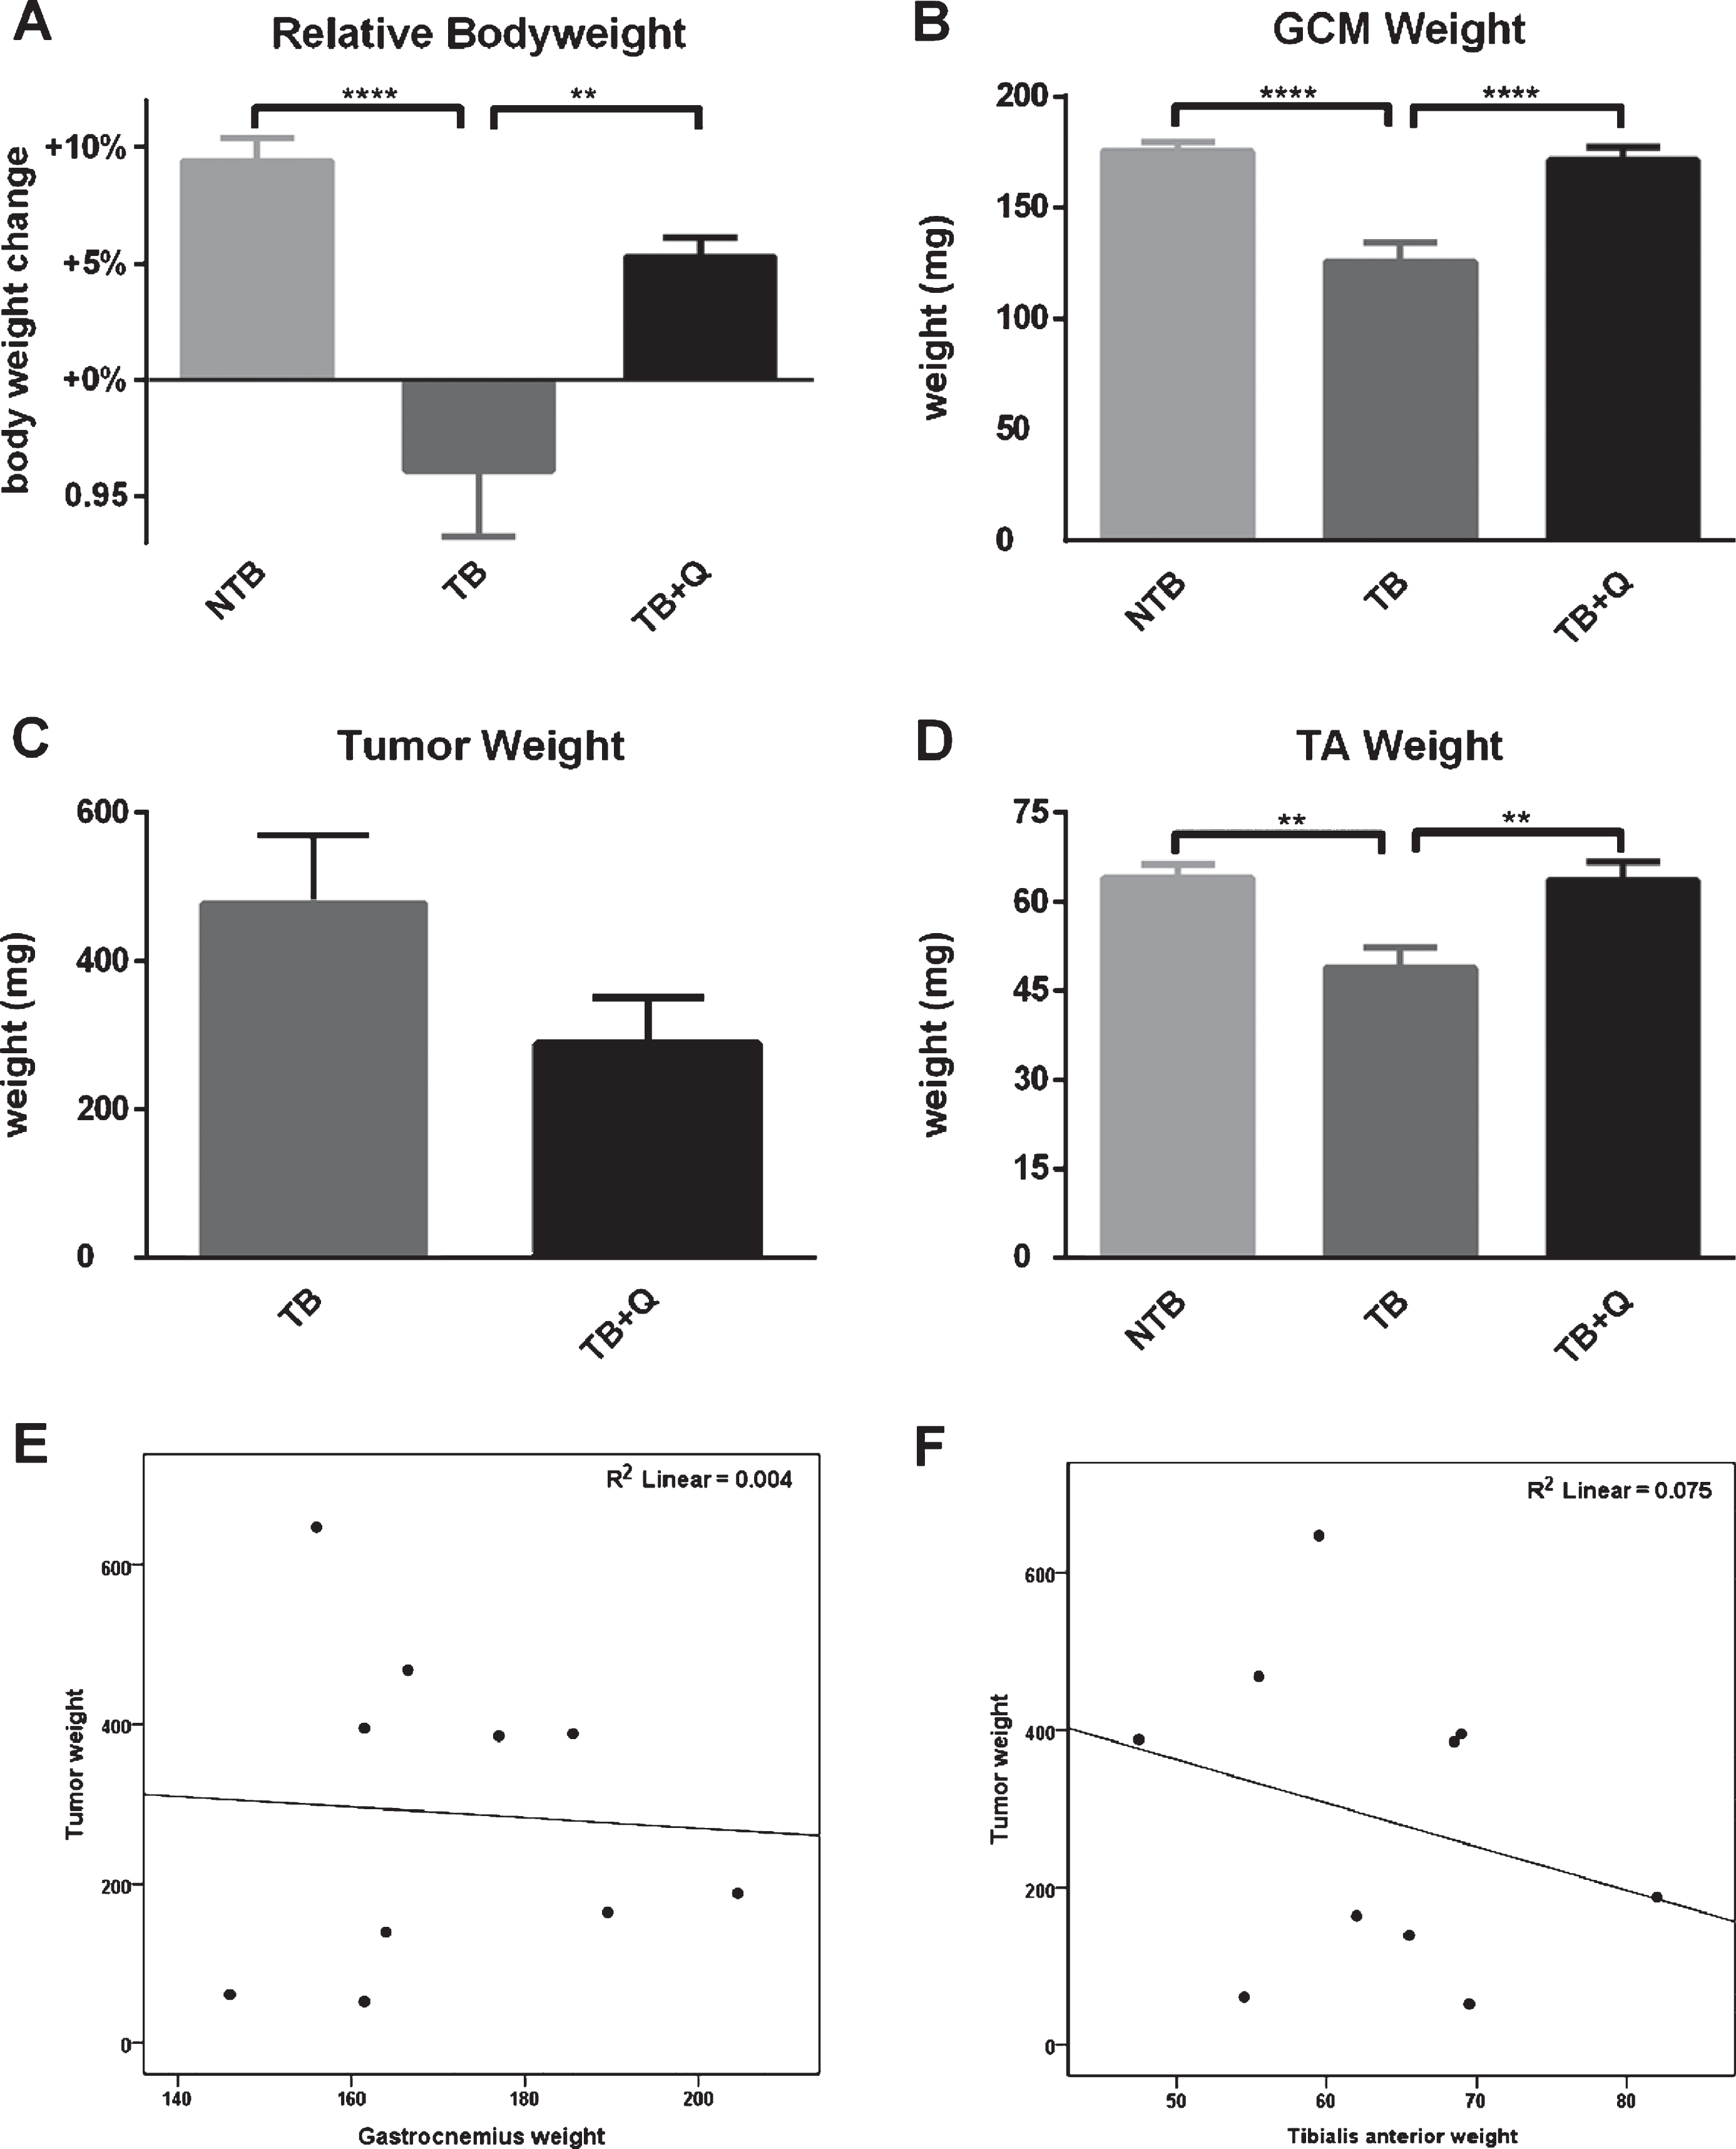
All animals were sacrificed at 21 days following tumor inoculation. The gastrocnemius and tibialis anterior muscles were resected and weighed. Mean gastrocnemius muscle weight in NTB mice was 175.2±12.4 mg versus 125.5±27.3 in TB mice (p < 0.0001, Fig. 5B). Mean gastrocnemius muscle weight in TB + Q mice was 171.3±17.8 mg (p < 0.0001 compared to TB mice). Mean tibialis anterior muscle weight in NTB mice was 64.1±7.1 mg versus 48.9±11.1 in TB mice (p = 0.0024, Fig. 5D). Mean tibialis anterior muscle weight in TB + Q mice was 63.7±9.6 mg (p = 0.0031 compared to TB mice). Tumor mass increased until at day 21 a mean tumor weight of 478.3±288.7 mg was recorded for TB mice and 288.7±196.3 mg for TB + Q mice (p = 0.14) (Fig. 5C). Tumor mass was not correlated with tibialis anterior muscle weight (Spearman’s rho = –0.261, p = 0.47) and gastrocnemius muscle weight (Spearman’s rho = 0.091, p = 0.80) at sacrifice for TB + Q mice (Fig. 5E, 5F).
Fig.5
Bodyweight, muscle weight and tumor mass at sacrifice. Bar graphs depicting the mean±SEM for (A) final bodyweight normalized to starting bodyweight, (B) gastrocnemius muscle weight, (C) tumor weight, and (D) tibialis anterior muscle weight in non-tumor-bearing male CD2F1 mice (NTB, n = 10), C26 tumor-bearing (TB) mice with ad libitum access to regular chow (C26 TB, n = 10) and mice with ad libitum access to quercetin supplemented chow (TB+Q, n = 10). Multiple group comparisons were done by one-way ANOVA with a Bonferroni’s posthoc test. All groups were compared against TB mice. Asterisk brackets are displayed for significant results only. ** p < 0.01 **** p < 0.0001. A possible tumor weight reduction in quercetin treated mice was noted, therefore the relationship between gastrocnemius muscle weight and tumor weight, as well as tibialis anterior muscle weight and tumor weight, were assessed to demonstrate that a possible reduction in tumor burden did not contribute to the attenuation in muscle atrophy. Scatter-dot plots depict no relationship between (E) gastrocnemius muscle mass and tumor mass (Spearman’s rho = 0.091, p = 0.80) and (F) tibialis anterior muscle mass and tumor mass (Spearman’s rho=–0.261, p = 0.47) in quercetin-treated mice. Considering these statistics, the attenuation in muscle atrophy cannot be sufficiently explained by differences in tumor burden.
3.4Gene expression
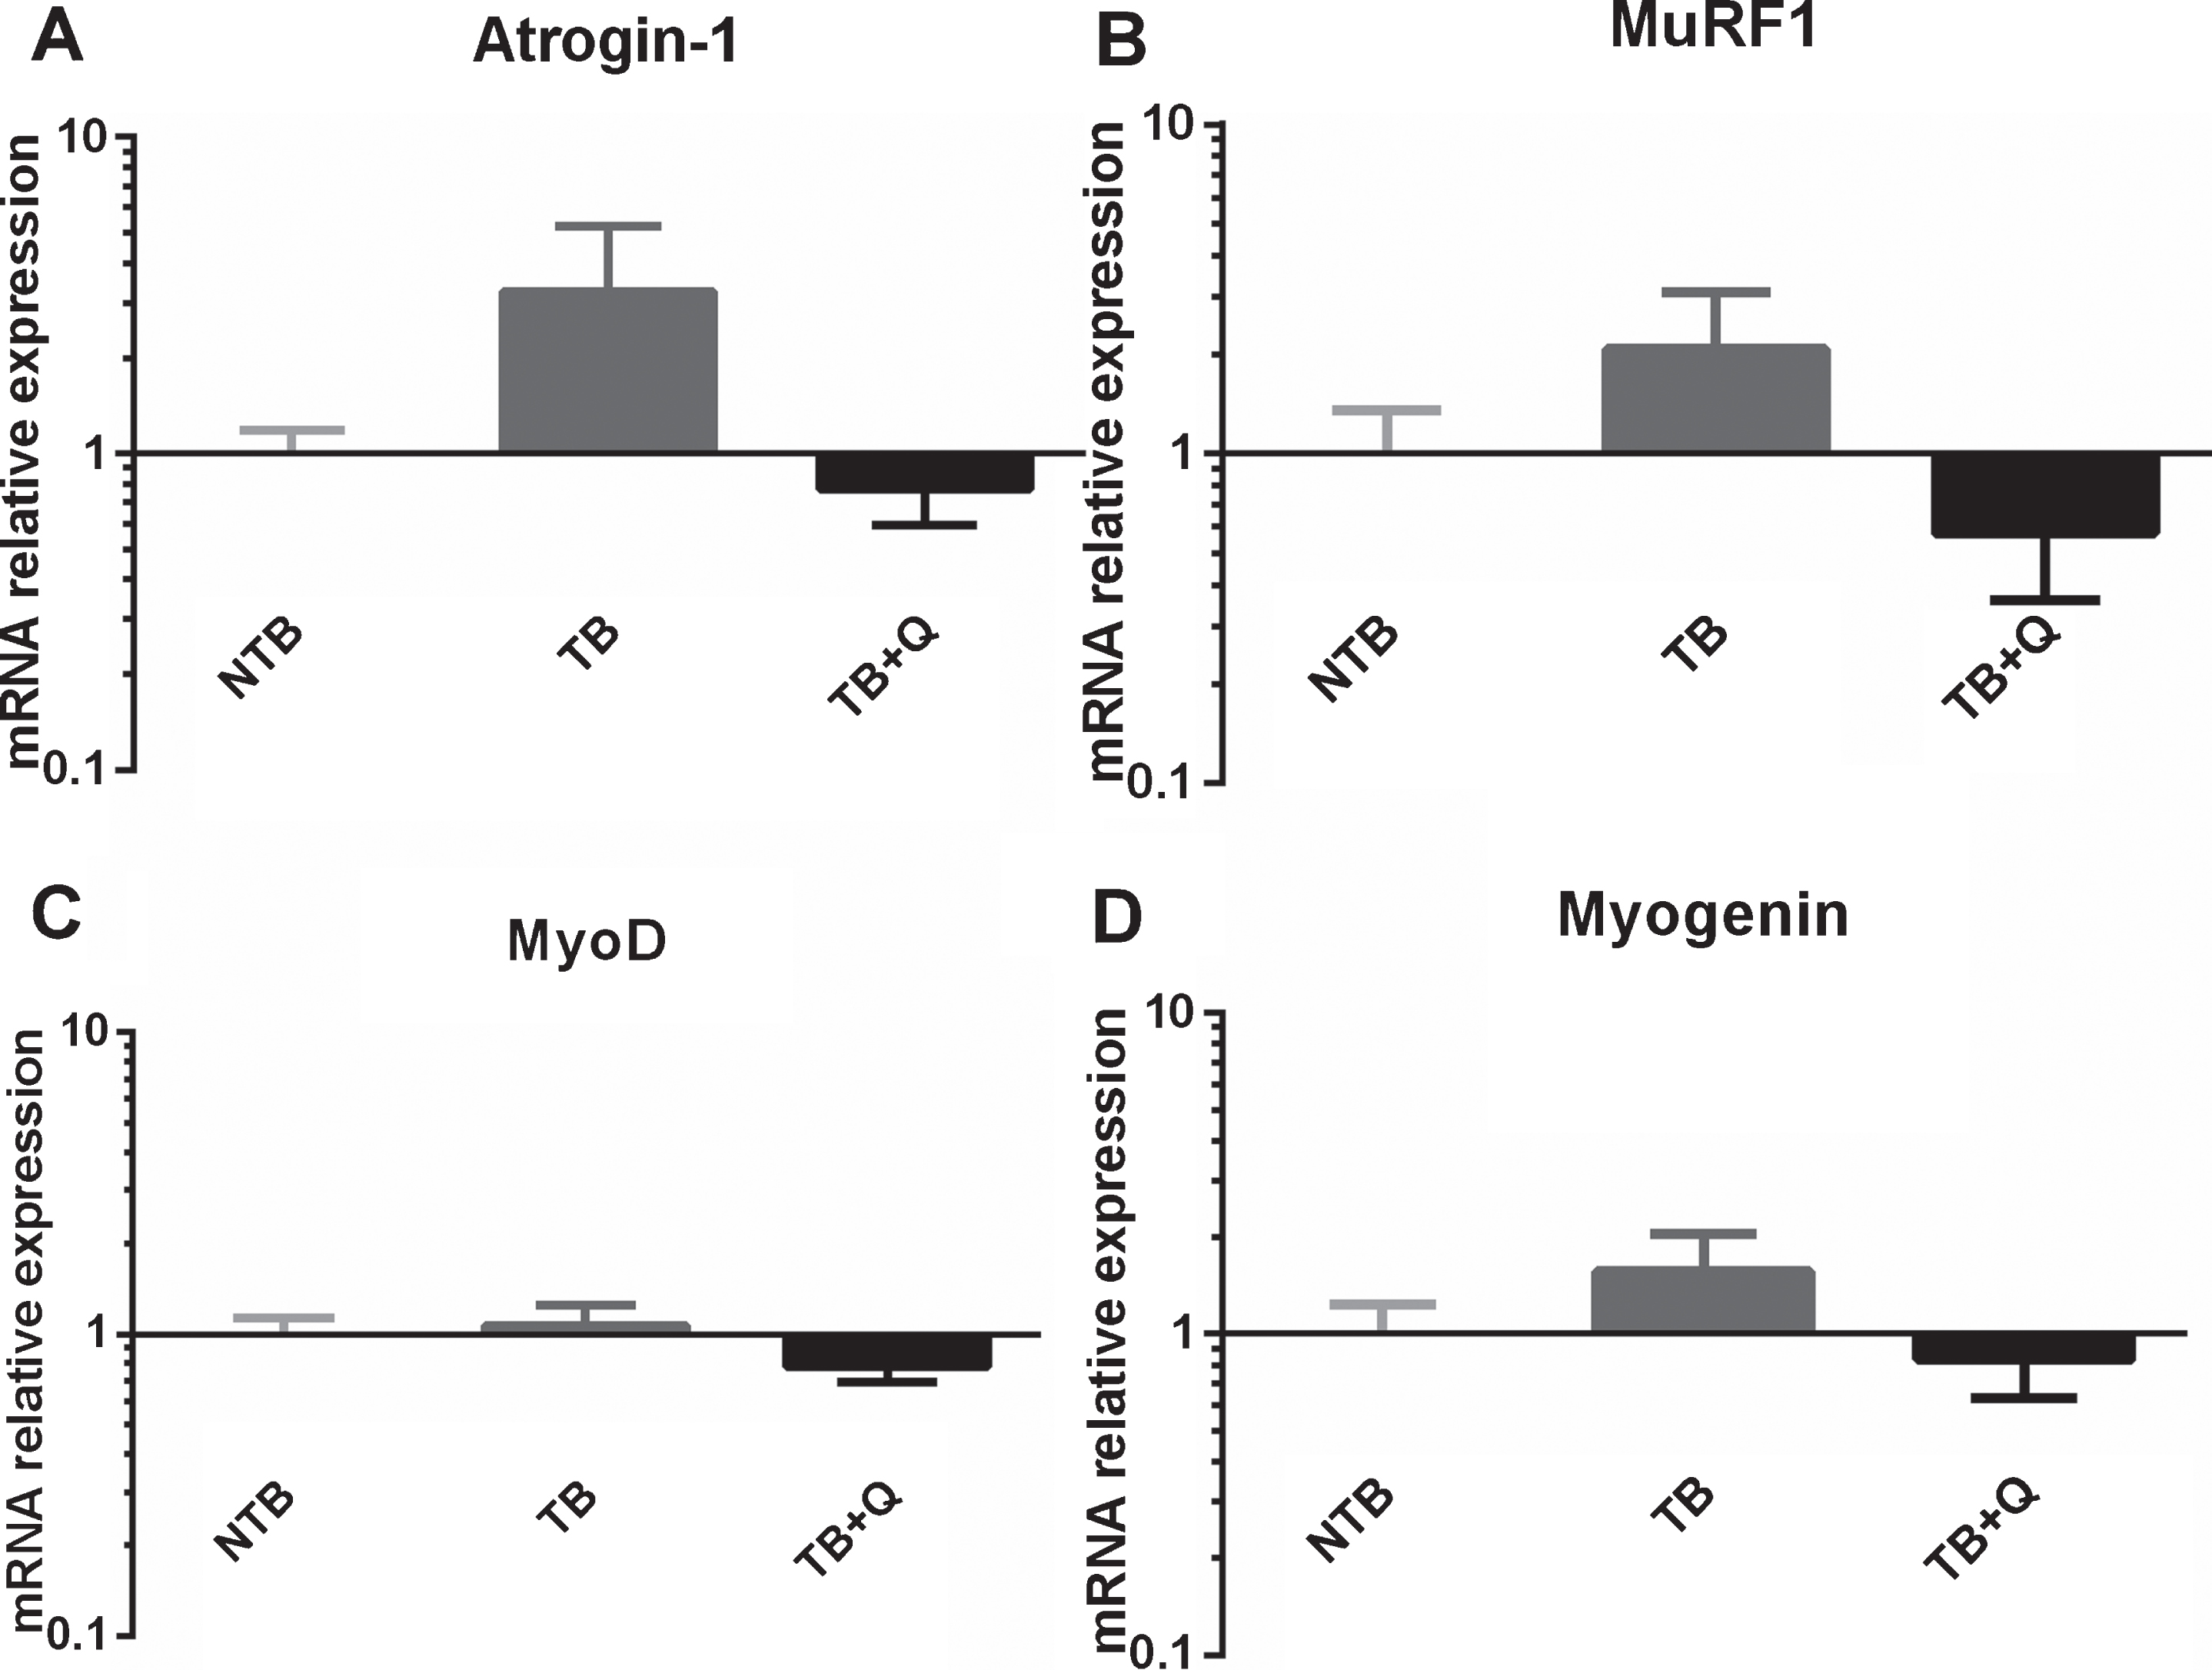
Skeletal muscle E3 ubiquitin ligases and myogenic regulatory factors mRNA expression profiles were determined in gastrocnemius muscle samples. A substantial, non-significant difference in expression of E3 ubiquitin ligase atrogin-1 was observed between TB and TB + Q mice, as well as to a lesser extent in the expression of MuRF1 (Fig. 6A, 6B). Expression of MyoD and Myogenin was comparable between all groups (Fig. 6C, 6D).
Fig.6
mRNA expression levels in cachectic muscle. Bar graphs depicting the mean±SEM mRNA expression levels in gastrocnemius muscle of (A) Atrogin-1, (B) MuRF1, (C) MyoD and (D) Myogenin in non-tumor-bearing male CD2F1 mice (NTB, n = 10), C26 tumor-bearing (TB) mice with ad libitum access to regular chow (C26 TB, n = 10) and mice with ad libitum access to quercetin supplemented chow (TB + Q, n = 10). Multiple group comparisons were done by one-way ANOVA with a Bonferroni’s posthoc test. All groups were compared against TB mice. A substantial but non-significant difference in expression of E3 ubiquitin ligase atrogin-1, and to a lesser extent MuRF1, was observed between TB and TB + Q mice.
4Discussion
Cancer-associated cachexia is a common finding in patients afflicted by multiple types of malignancies [27, 34]. It has detrimental effects on survival as well as the quality of life [27, 34]. Unfortunately, there are no validated treatment modalities to halt or reverse the associated progressive muscle wasting. Our study investigated whether quercetin supplementation could attenuate muscle wasting in the murine C26 cancer-cachexia model. We found this to be true, C26 tumor-bearing mice on a diet supplemented with quercetin showed a preservation of gastrocnemius muscle weight as well as tibialis anterior muscle weight. In this group of mice, bodyweight was also preserved. These findings were accompanied by a tendency towards decreased expression of E3 ubiquitin ligases atrogin-1 and MuRF1 in tumor-bearing mice on a quercetin supplemented diet compared to tumor-bearing mice on a regular chow diet. As this study was not powered to detect differences in mRNA expression we consider it likely this lack of significance is due to a type II error. It has been shown that quercetin reduces the transcription of atrogin-1 and MuRF1 in obesity-induced skeletal muscle inflammation in mice, which has been attributed to diminished activation of ERK, p38 MAPK and NF-κB [24]. Another study also reported NF-κB inactivation along with the upregulation of heme-oxygenase-1 (HO-1) in mice treated with quercetin [35]. Despite preservation of muscle mass and body weight, we did not observe a difference in grip-strength between TB and TB + Q mice. Our findings are inline with the study of Velázquez et al. [14]. They showed quercetin supplementation to help preserve muscle mass and limit bodyweight loss in an ApcMin/+ mice model. Furthermore, a recent study reported similar muscle preservation by quercetin treatment in nude mice with cachexia induction via A459 cells, a human alveolar basal epithelial adenocarcinoma cell line [36]. In contrast, C26 tumor-bearing mice given a cocktail of antioxidants, including quercetin, showed accelerated development of cachexia and even expedited death [37]. In our study food intake was higher in TB + Q mice compared to mice receiving control chow. Velázquez et al. found no difference in chow consumption between the quercetin-treated groups [14]. This difference in food intake is not readily explained. Although food intake of TB mice was comparable to NTB mice throughout the first two weeks, daily chow consumption more than doubled during the final days of the experiment. Despite the increased nutritional intake, a significant loss of body weight was observed. This suggests a hypermetabolic state for these mice, but was not quantified in this study.
Quercetin is a natural, bioactive and readily available flavonoid found in a selection of fruits, vegetables and herbs [18], as well as over the counter dietary supplements. The quercetin dose in the current study equates to a human equivalent dose [38] of 2.85 mg/kg. For an average European or Northern American adult [39], this would equate to 202 mg or 230 mg quercetin respectively. Well within the limits of what has been safely used in prior studies [19, 40, 41], and below the threshold of what is commercially available in over the counter supplements in various western countries. The human equivalent dose of the dosage we used significantly exceeds the estimated 25–50 mg per day consumed per day in a western diet [42]. Quercetin has previously been used in studies, including athletes, military personnel, and elderly persons, to investigate its potential as a performance-enhancing supplement. These studies yielded ambiguous results with regard to lean body mass, basal metabolic rate, total energy expenditure and VO2max [19, 40, 41, 43]. Moreover, quercetin has been investigated for its possible role as a senolytic compound with inconsistent results [44, 45]. Although quercetin has been suggested as a therapeutic candidate in cachexia [46], no studies have been published on quercetin treatment countering muscle wasting in humans [47]. Based on the present study and the aforementioned research by Velázquez et al. [14], quercetin supplementation may aid in limiting muscle wasting in cancer patients. Further research is however warranted to confirm its anti-catabolic effects.
A substantial, non-significant difference in tumor burden was observed between tumor-bearing mice on a regular chow diet and tumor-bearing mice on a quercetin supplemented diet. Anti-cancer effects of quercetin have been previously reported, although available evidence is limited [48–53]. In our study we found a negligible, non-significant correlation between tumor weight and muscle mass. However, we cannot exclude that the anti-tumor effect has impacted on other outcome parameters, e.g. by selective down-regulation of tumor-derived mediators of cachexia.
Using resected hindlimb muscle tissue at the end of the experiment as gold standard we found a highly positive correlation with micro-CT hindlimb skeletal muscle volume measurement. This technique was found to be feasible and relevant in the current study and may allow for quantitative assessment of individual muscles, as well as allowing for tissue composition quantification, i.e. assessment of fatty infiltration of muscle.
Several limitations apply to the present study. The study was powered on an expected reduction in loss of muscle weight. As such, non-significant differences in secondary outcome parameters (e.g. relative mRNA expression levels) may have been subject to type II errors. Furthermore, survival was not included as one of the endpoints due to the strict ethical guidelines associated with the initiation of this study.
In conclusion, dietary quercetin supplementation limits bodyweight loss and prevents muscle wasting in a murine C26-cancer-associated cachexia model. These data add to a body of evidence supporting the use of quercetin to halt muscle wasting in experimental cancer-associated cachexia models and paving the way for clinical research on the efficacy of quercetin in the attenuation of muscle wasting in humans.
Funding
No funding from external organizations was obtained.
Conflict of interest
All authors declare they have no conflict of interest.
Acknowledgments
SL contributed to the research design, performed the research, analysed the data and wrote the paper. SvdE and GA performed the research, aided in analysis of the mRNA expression data and in writing the paper. JNMIJ and RWFdB contributed to the research design and writing the paper.SL, SvdE, GA, JNMI and RWFdB have read and approved the manuscript.This work was supported by the Applied Molecular Imaging Erasmus MC (AMIE) facility by providing the imaging equipment. We would like to thank R. Ridwan for the technical support of the micro-CT. Furthermore, we would like to thank Dr. G.M. van Woerden and prof. dr. Y. Elgersma from the dept. of neuroscience (Erasmus MC University Medical Center) allowing us to make use of the grip-strength meter. And lastly, we would like to thank prof. dr. D.O. McCarthy (Ohio State University, OH, USA) for kindly providing us with the C26 cell-line.
References
[1] | Fearon K , Strasser F , Anker SD , Bosaeus I , Bruera E , Fainsinger RL , Jatoi A , Loprinzi C , MacDonald N , Mantovani G , Davis M , Muscaritoli M , Ottery F , Radbruch L , Ravasco P , Walsh D , Wilcock A , Kaasa S , Baracos VE . Definition and classification of cancer cachexia: an international consensus. Lancet Oncol. (2011) ;12: :489–95. |
[2] | Moses AW , Slater C , Preston T , Barber MD , Fearon KC . Reduced total energy expenditure and physical activity in cachectic patients with pancreatic cancer can be modulated by an energy and protein dense oral supplement enriched with n-3 fatty acids. Br J Cancer. (2004) ;90: :996–1002. |
[3] | Tan BH , Fearon KC . Cachexia: prevalence and impact in medicine. Curr Opin Clin Nutr Metab Care. (2008) ;11: :400–7. |
[4] | Tisdale MJ . Mechanisms of cancer cachexia. Physiol Rev. (2009) ;89: :381–410. |
[5] | Warren S . The immediate causes of death in cancer. The American Journal of the Medical Sciences. (1932) ;184: :610–5. |
[6] | Argiles JM , Busquets S , Lopez-Soriano FJ . The pivotal role of cytokines in muscle wasting during cancer. The international journal of biochemistry & cell biology. (2005) ;37: :2036–46. |
[7] | Argiles JM , Busquets S , Toledo M , Lopez-Soriano FJ . The role of cytokines in cancer cachexia. Curr Opin Support Palliat Care. (2009) ;3: :263–8. |
[8] | Mantovani G , Maccio A , Madeddu C , Mura L , Massa E , Mudu MC , Mulas C , Lusso MR , Gramignano G , Piras MB . Serum values of proinflammatory cytokines are inversely correlated with serum leptin levels in patients with advanced stage cancer at different sites. J Mol Med (Berl). (2001) ;79: :406–14. |
[9] | Argiles JM , Busquets S , Lopez-Soriano FJ . Anti-inflammatory therapies in cancer cachexia. European journal of pharmacology. (2011) ;668: (Suppl 1):S81–6. |
[10] | Wigmore SJ , Barber MD , Ross JA , Tisdale MJ , Fearon KC . Effect of oral eicosapentaenoic acid on weight loss in patients with pancreatic cancer. Nutr Cancer. (2000) ;36: :177–84. |
[11] | Dewey A , Baughan C , Dean T , Higgins B , Johnson I . Eicosapentaenoic acid (EPA, an omega-3 fatty acid from fish oils) for the treatment of cancer cachexia. Cochrane Database Syst Rev. (2007) :CD004597. |
[12] | Ries A , Trottenberg P , Elsner F , Stiel S , Haugen D , Kaasa S , Radbruch L . A systematic review on the role of fish oil for the treatment of cachexia in advanced cancer: an EPCRC cachexia guidelines project. Palliat Med. (2012) ;26: :294–304. |
[13] | Aversa Z , Bonetto A , Costelli P , Minero VG , Penna F , Baccino FM , Lucia S , Rossi Fanelli F , Muscaritoli M . beta-hydroxy-beta-methylbutyrate (HMB) attenuates muscle and body weight loss in experimental cancer cachexia. International Journal of Oncology. (2011) ;38: :713–20. |
[14] | Velazquez KT , Enos RT , Narsale AA , Puppa MJ , Davis JM , Murphy EA , Carson JA . Quercetin supplementation attenuates the progression of cancer cachexia in ApcMin/+mice. The Journal of Nutrition. (2014) ;144: :868–75. |
[15] | Mirza KA , Pereira SL , Voss AC , Tisdale MJ . Comparison of the anticatabolic effects of leucine and Ca-beta-hydroxy-beta-methylbutyrate in experimental models of cancer cachexia. Nutrition. (2014) ;30: :807–13. |
[16] | May PE , Barber A , D’Olimpio JT , Hourihane A , Abumrad NN . Reversal of cancer-related wasting using oral supplementation with a combination of beta-hydroxy-beta-methylbutyrate, arginine, and glutamine. American Journal of Surgery. (2002) ;183: :471–9. |
[17] | Berk L , James J , Schwartz A , Hug E , Mahadevan A , Samuels M , Kachnic L . A randomized, double-blind, placebo-controlled trial of a beta-hydroxyl beta-methyl butyrate, glutamine, and arginine mixture for the treatment of cancer cachexia (RTOG 0122). Supportive care in cancer: official journal of the Multinational Association of Supportive Care in Cancer. (2008) ;16: :1179–88. |
[18] | Bhagwat SH , D.B.; Holden JM. USDA Database for the Flavonoid Content of Selected Foods Release 3. 2011. |
[19] | Askari G , Ghiasvand R , Paknahad Z , Karimian J , Rabiee K , Sharifirad G , Feizi A . The effects of quercetin supplementation on body composition, exercise performance and muscle damage indices in athletes. Int J Prev Med. (2013) ;4: :21–6. |
[20] | Daneshvar P , Hariri M , Ghiasvand R , Askari G , Darvishi L , Mashhadi NS , Khosravi-Boroujeni H . Effect of eight weeks of quercetin supplementation on exercise performance, muscle damage and body muscle in male badminton players. Int J Prev Med. (2013) ;4: :S53–7. |
[21] | Hollinger K , Shanely RA , Quindry JC , Selsby JT . Long-term quercetin dietary enrichment decreases muscle injury in mdx mice. Clin Nutr. (2015) ;34: :515–22. |
[22] | Xu M , Pirtskhalava T , Farr JN , Weigand BM , Palmer AK , Weivoda MM , Inman CL , Ogrodnik MB , Hachfeld CM , Fraser DG , Onken JL , Johnson KO , Verzosa GC , Langhi LGP , Weigl M , Giorgadze N , LeBrasseur NK , Miller JD , Jurk D , Singh RJ , Allison DB , Ejima K , Hubbard GB , Ikeno Y , Cubro H , Garovic VD , Hou X , Weroha SJ , Robbins PD , Niedernhofer LJ , Khosla S , Tchkonia T , Kirkland JL . Senolytics improve physical function and increase lifespan in old age. Nat Med. (2018) ;24: :1246–56. |
[23] | Stewart LK , Soileau JL , Ribnicky D , Wang ZQ , Raskin I , Poulev A , Majewski M , Cefalu WT , Gettys TW . Quercetin transiently increases energy expenditure but persistently decreases circulating markers of inflammation in C57BL/6J mice fed a high-fat diet. Metabolism. (2008) ;57: :S39–46. |
[24] | Le NH , Kim CS , Park T , Park JH , Sung MK , Lee DG , Hong SM , Choe SY , Goto T , Kawada T , Yu R . Quercetin protects against obesity-induced skeletal muscle inflammation and atrophy. Mediators Inflamm. (2014) ;2014: :834294. |
[25] | Tanaka Y , Eda H , Tanaka T , Udagawa T , Ishikawa T , Horii I , Ishitsuka H , Kataoka T , Taguchi T . Experimental cancer cachexia induced by transplantable colon 26 adenocarcinoma in mice. Cancer Res. (1990) ;50: :2290–5. |
[26] | van Vledder MG , Levolger S , Ayez N , Verhoef C , Tran TC , IJzermans JN . Body composition and outcome in patients undergoing resection of colorectal liver metastases. Br J Surg. (2012) ;99: :550–7. |
[27] | Levolger S , van Vugt JL , de Bruin RW , IJzermans JN . Systematic review of sarcopenia in patients operated on for gastrointestinal and hepatopancreatobiliary malignancies. Br J Surg. (2015) ;102: :1448–58. |
[28] | Li HZ , H.; TangZ.; HuG.Micro-computed tomography for small animal imaging: Technological details. Progress in Natural Science. (2008) ;18: :513–21. |
[29] | Schambach SJ , Bag S , Schilling L , Groden C , Brockmann MA . Application of micro-CT in small animal imaging. Methods. (2010) ;50: :2–13. |
[30] | Carlson SK , Classic KL , Bender CE , Russell SJ . Small animal absorbed radiation dose from serial micro-computed tomography imaging. Mol Imaging Biol. (2007) ;9: :78–82. |
[31] | Mukherjee P , Ginardi AR , Tinder TL , Sterner CJ , Gendler SJ . MUC1-specific cytotoxic T lymphocytes eradicate tumors when adoptively transferred in vivo. Clin Cancer Res. (2001) ;7: :848s–55s. |
[32] | Acharyya S , Ladner KJ , Nelsen LL , Damrauer J , Reiser PJ , Swoap S , Guttridge DC . Cancer cachexia is regulated by selective targeting of skeletal muscle gene products. J Clin Invest. (2004) ;114: :370–8. |
[33] | Livak KJ , Schmittgen TD . Analysis of relative gene expression data using real-time quantitative PCR and the 2(-Delta Delta C(T)) Method. Methods. (2001) ;25: :402–8. |
[34] | Baracos VE , Martin L , Korc M , Guttridge DC , Fearon KCH . Cancer-associated cachexia. Nat Rev Dis Primers. (2018) ;4: :17105. |
[35] | Kim Y , Kim CS , Joe Y , Chung HT , Ha TY , Yu R . Quercetin Reduces Tumor Necrosis Factor Alpha-Induced Muscle Atrophy by Upregulation of Heme Oxygenase-1. J Med Food. (2018) ;21: :551–9. |
[36] | Chan ST , Chuang CH , Lin YC , Liao JW , Lii CK , Yeh SL . Quercetin enhances the antitumor effect of trichostatin A and suppresses muscle wasting in tumor-bearing mice. Food Funct. (2018) ;9: :871–9. |
[37] | Assi M , Derbre F , Lefeuvre-Orfila L , Rebillard A . Antioxidant supplementation accelerates cachexia development by promoting tumor growth in C26 tumor-bearing mice. Free Radic Biol Med. (2016) ;91: :204–14. |
[38] | Nair AB , Jacob S . A simple practice guide for dose conversion between animals and human. J Basic Clin Pharm. (2016) ;7: :27–31. |
[39] | Walpole SC , Prieto-Merino D , Edwards P , Cleland J , Stevens G , Roberts I . The weight of nations: an estimation of adult human biomass. BMC Public Health. (2012) ;12: :439. |
[40] | Scholten SD , Sergeev IN . Long-term quercetin supplementation reduces lipid peroxidation but does not improve performance in endurance runners. Open Access J Sports Med. (2013) ;4: :53–61. |
[41] | Nieman DC , Henson DA , Davis JM , Dumke CL , Gross SJ , Jenkins DP , Murphy EA , Carmichael MD , Quindry JC , McAnulty SR , McAnulty LS , Utter AC , Mayer EP . Quercetin ingestion does not alter cytokine changes in athletes competing in the Western States Endurance Run. J Interferon Cytokine Res. (2007) ;27: :1003–11. |
[42] | Formica JV , Regelson W . Review of the biology of Quercetin and related bioflavonoids. Food Chem Toxicol. (1995) ;33: :1061–80. |
[43] | Simioni C , Zauli G , Martelli AM , Vitale M , Sacchetti G , Gonelli A , Neri LM . Oxidative stress: role of physical exercise and antioxidant nutraceuticals in adulthood and aging. Oncotarget. (2018) ;9: :17181–98. |
[44] | Chondrogianni N , Kapeta S , Chinou I , Vassilatou K , Papassideri I , Gonos ES . Anti-ageing and rejuvenating effects of quercetin. Exp Gerontol. (2010) ;45: :763–71. |
[45] | Hwang HV , Tran DT , Rebuffatti MN , Li CS , Knowlton AA . Investigation of quercetin and hyperoside as senolytics in adult human endothelial cells. PLoS One. (2018) ;13: :e0190374. |
[46] | Narsale AA , Carson JA . Role of interleukin-6 in cachexia: therapeutic implications. Curr Opin Support Palliat Care. (2014) ;8: :321–7. |
[47] | Francaux M , Deldicque L . Using polyphenol derivatives to prevent muscle wasting. Curr Opin Clin Nutr Metab Care. (2018) ;21: :159–63. |
[48] | Cragg GM , Newman DJ . Plants as a source of anti-cancer agents. J Ethnopharmacol. (2005) ;100: :72–9. |
[49] | Lee HH , Lee S , Shin YS , Cho M , Kang H , Cho H . Anti-Cancer Effect of Quercetin in Xenograft Models with EBV-Associated Human Gastric Carcinoma. Molecules. (2016) ;21. |
[50] | Sugantha Priya E , Selvakumar K , Bavithra S , Elumalai P , Arunkumar R , Raja Singh P , Brindha Mercy A , Arunakaran J . Anti-cancer activity of quercetin in neuroblastoma: an in vitro approach. Neurol Sci. (2014) ;35: :163–70. |
[51] | Jeong JH , An JY , Kwon YT , Rhee JG , Lee YJ . Effects of low dose quercetin: cancer cell-specific inhibition of cell cycle progression. J Cell Biochem. (2009) ;106: :73–82. |
[52] | Gibellini L , Pinti M , Nasi M , Montagna JP , De Biasi S , Roat E , Bertoncelli L , Cooper EL , Cossarizza A . Quercetin and cancer chemoprevention. Evid Based Complement Alternat Med. (2011) ;2011: :591356. |
[53] | Srivastava S , Somasagara RR , Hegde M , Nishana M , Tadi SK , Srivastava M , Choudhary B , Raghavan SC . Quercetin, a Natural Flavonoid Interacts with DNA, Arrests Cell Cycle and Causes Tumor Regression by Activating Mitochondrial Pathway of Apoptosis. Sci Rep. (2016) ;6: :24049. |


