
Nutritional assessment in patients with Parkinson’s disease: The nutri-park study
Abstract
BACKGROUND:
Several studies have found a link between nutritional status and neurodegenerative diseases, such as Parkinson’s disease (PD).
OBJECTIVE:
The aim of our study was to assess both nutritional status and dietary habits of PD patients with respect to controls and to compare disease progression in relation to dietary habits, such as protein distribution diet (PRD) adherence.
METHODS:
We collected anthropometric measurements, Mini Nutritional Assessment (MNA) score, dietary habits, micro- and macronutrients intakes, body composition by Bioelectrical Impedance Analysis (BIA), muscle strength and gait speed of 66 PD patients and 58 controls (40 healthy controls and 18 subjects with essential tremor). Clinical scales and progression indexes were recorded in PD group.
RESULTS:
No significant differences emerged between PD and controls in anthropometric and BIA measurements; a comparable dietary intake between the two groups was recorded. Sarcopenia and dynapenia were comparable between the two groups. PD resulted more at risk of malnutrition than controls to MNA, only three patients and one control were malnourished. A notable inverse correlation was observed between MNA and PD Questionnaire 8. PD following a PRD showed a slower progression index.
CONCLUSION:
Nutritional status of PD patients is not so different from elderly controls. PRD is recommended for patients with PD.
1Introduction
Parkinson’s disease (PD) is a chronic neurological disorder which results from diminished levels of neurotransmitters in the brain, in particular dopamine, leading to motor symptoms (tremors, rigidity and bradykinesia) and to a wide variety of non-motor symptoms [1].
The pathogenesis of PD is still unclear, but a pivotal role is undoubtedly attributable to a complex interplay among aging, genetics and environmental risk factors [2]. Concerning the latter, the role of diet on the onset and progression of PD represents an emerging issue. Many studies have investigated dietary factors that can increase or decrease the risk of PD [3–6]; different eating patterns composed by various macronutrients and micronutrients may exert their effect through modulation of mitochondrial function and energy metabolism. The relative percentage of macronutrients, such as a high protein intake or a poor intake of certain fatty acids, can alter the production of energy and reactive oxygen species in mitochondria, thus determining a mitochondrial dysfunction in PD [7]. The knowledge related to role of micronutrients in PD, such as vitamins and minerals, is still incomplete and controversial [8].
Nutrition may also influence brain health through the effect on gut microbiota composition, permeability of the intestinal barrier and enteric inflammation which, in turn, promotes neuroinflammation and neurodegeneration [9].
PD patients, particularly those who experience fluctuations of symptoms with their medications, may be sensitive to the amount and the timing of protein intake in their diets. Negative interactions between dietary amino acids and L-dopa have been known for a long time [10]: L-dopa, which is considered the most effective drug for PD, is absorbed from the small intestine by an active transport mechanism for large neutral amino acids: this leads to understand the eventual competition for the absorption of diet amino acids. A protein-redistribution diet (PRD) (Table 1) in patients with PD experiencing motor fluctuations during L-dopa treatment was proved effective when the intervention was proposed in the early stages of PD [11]; long-term effects of PRD on nutritional status in PD is not yet well-known. A low-protein diet did not shown substantial benefits in PD [11].
Table 1
Example of the distribution of total amount of protein/day (1,1 g/kg) for a 70 kg patient following Protein Redistribution Diet
| Meals | Breakfast | Snack | Lunch | Snack | Dinner |
| Proteins (g) | 5,7 | 4,7 | 10,1 | 15,9 | 41,5 |
| Food | A cup of tea/coffee | Fruit 200 g | Pasta/rice 70 g with vegetables | Whole milk yogurt 125 g | Meat 180 g |
| AND | AND | AND | OR | ||
| Bread 50 g/5 melba toast | bread 100 g | Dried fruits (e.g. nuts 50 g) | fish 200 g | ||
| +jam/honey | OR | ||||
| OR | dairy products 100 g | ||||
| cereal 40 g | OR | ||||
| legumes 150 g | |||||
| OR | |||||
| 2 eggs | |||||
| AND vegetables |
Motor PD symptoms (such as tremor and the drug side-effect of dyskinesia) may increase patients’ caloric needs and, at the same time, may cause a caloric intake restriction (linked to the motor difficulties to prepare a meal and to eat independently); additionally non-motor PD symptoms (loss of the sense of smell and/or taste, swallowing problems, delayed stomach emptying, constipation, psychological and cognitive disorders) can lead to unintentional weight loss, sarcopenia and malnutrition [12] which may involve up to 24% of patients [13]. Gastric and intestinal emptying may also depend on macronutrients’ composition of meals, especially fats and high-fiber foods.
The aims of this study were twofold: 1) to assess the nutritional status and dietary habits of PD patients which have not been subjected to a specific nutritional intervention with respect to healthy controls and to patients with essential tremor; 2) to evaluate nutritional status and dietary habits in PD subgroups and in relation to clinical scales and indexes of disease progression.
2Methods
2.1Subjects and design
This cross-sectional study was carried out in the Outpatient Clinic for Parkinson’s Disease of San Paolo Hospital, University of Milan.
We enrolled outpatients over 50 years old consecutively admitted from February 2017 to June 2018 with diagnosis of Clinically Established or Clinically Probable PD [14].
Healthy controls (HC) were recruited in the same period and consisted mainly of patients’ spouses attending to General Neurology Clinic; patients with essential tremor (ET) [15] were also recruited as a part of the control group.
The following exclusion criteria were applied: subjects with pacemakers, deep brain stimulation or other electrical devices (because the potential interference with bioimpedance analysis), subjects suffering from cancer, endocrine disorders in poor therapeutic control (eg hypothyroidism not controlled by levothyroxine) and moderate-severe cognitive impairment (MMSE < 20).
The study protocol was approved by San Paolo Hospital Ethics Committee and informed written consent was obtained from all subjects.
2.2Data collection
All study participants underwent an extensive evaluation following a standardized diagnostic protocol.
Demographic characteristics, medical history, pharmacological treatments and neurological examination were collected by neurologists expert on movement disorders (IC, CG, CC). The following PD clinical scales were collected: motor scales (Unified Parkinson’s Disease Rating Scale [UPDRS] part III and IV, Hoen and Yahr [HY] Scale [16]), a non-motor scale (Non-Motor Symptoms Scale [NMSS][17]) and a quality of life scale (Parkinson’s Disease Questionnaire- 8 [PDQ-8] [18]). PD patients were classified according to their motor subtype (tremor dominant [TD] and non-tremor dominant [NTD]).
Comorbidity was assessed using the modified Cumulative Illness Rating Scale (CIRS) comorbidity total score [19].
2.3Nutritional evaluation
Nutritional evaluation was performed by dieticians (SG, VP). Anthropometric measurements were taken following standard criteria [20]. Height (cm) was measured with an anthropometer and weight (Kg) with a mechanical beam scale; body mass index (BMI) (kg/m2) was calculated. Weight change after illness onset was recorded. Body circumferences (waist, hip, mid arm, calf) were achieved with an inelastic plastic fiber tape measure: the waist was measured midpoint between the lowest rib and the upper border of the iliac crest; the hip at the level of the widest circumference over the great trochanters; the mid arm at the midpoint between the lateral tip of the acromion and the most distal point on the olecranon; the calf was measured at the maximum girth [21]. A quali-quantitative food history was collected to analyse dietary habits, energy, micro- and macronutrients intakes; energy expenditure was estimated by means of basal metabolism calculated by Harris and Benedict formula [22] and of level of physical activity (LPA) [23]. Mini Nutritional Assessment (MNA) [24] was assessed to define nutritional risk; it consists in 18 questions grouped in 4 categories: anthropometric assessment, general assessment, short dietary assessment and subjective assessment. Each answer provides a score contributing to the final score, which ranges from 0 to 30; a total score lower than 24 indicates a risk of malnutrition, lower than 17 the presence of malnutrition.
Body composition (total body water, fat-free mass, fat mass, muscle mass) was assessed by Bioelectrical Impedance Analysis (BIA) [25]. The measurement of muscle strength by dynamometry and of physical performance (gait speed) through 6 m course allowed to define the eventual presence of sarcopenia, which was defined as a reduction of skeletal muscle mass index (skeletal muscle mass/height2) associated to a reduction of strength (dynapenia) and/or physical performance in agreement with the EWGSOP algorithm [26]. We collected the information about a Protein Redistribution Diet (PRD) compliance in PD [27].
2.4Statistical analysis
Descriptive data are expressed as mean, standard deviation (SD), median and range of variability (continuous variables) or as the number of observations and percentage (discrete variables).
The Kolmogorov-Smirnov test was used to test the normality of continuous variables. The comparison of demographic, clinical, nutritional and motor and muscle performance characteristics between subjects with PD and controls, between motor subtypes of PD and between PD subtypes, TD and ET patients were performed for continuous variables using Student’s t test for independent data or the Mann-Whitney test, when appropriate, for discrete variables via the chi-square test or Fisher’s exact test or the Mann-Whitney test, when appropriate. For the independent sample t test, Cohen’s d is determined to estimate effect size, when appropriate.
Within the cases, we performed correlation analyses using the correlation index for Spearman ranks (rs) between nutritional parameters and clinical scales scores.
Values of p < 0.05 (two-tailed test) were considered statistically significant.
The SPSS program version 25.0 (SPSS Inc., Chicago, IL, USA) for Windows (Microsoft, Redmond, WA) was used for statistical analysis.
3Results
The study sample was composed of 124 subjects (72 women, 52 men): 66 PD patients and 58 controls. The control group consists of 40 HC and 18 with ET, grouped into a single group because no statistically significant differences emerged in demographic and in nutritional characteristics.
PD patients had a mean age of onset of 66.1±8.8 years (min 47, max 87).
3.1Comparison of nutritional status and dietary habits between case and controls
Table 2 shows the demographic characteristics of the two groups.
Table 2
Demographic, clinical, and nutritional features of Parkinson’s disease (PD) patients and controls
| PD (n = 66) | Controls (n = 58) | P | |
| Demographic and clinical features | |||
| Sex | |||
| Female | 36 (54.5%) | 36 (62.1%) | 0.399 |
| Male | 30 (45.5%) | 22 (37.9%) | |
| Age (years) | 72.7 (8.7);75 (52–91) | 72.19 (8.7); 74 (54–88) | 0.837 |
| Education (years) | 11.09 (4.49); 13 (2–18) | 10.21 (4.41); 8 (3–18) | 0.279 |
| CIRS (total score) | 0.65 (1.3); 0.38 (0–8) | 0.79 (1.2); 0.54 (0.15–7) | 0.003* |
| Anthropometric measurements | |||
| Weight (kg) | 70.49 (14.49); 69.65 (36.6–109.5) | 69.92 (15.46); 68.95 (42.10–117) | 0.793 |
| BMI (kg/m2) | |||
| Underweight (<18.5) | 3 (4.5%) | 3 (5.2%) | |
| Normal (18.5–24.99) | 28 (42.4%) | 21 (36.2%) | 0.830 |
| Overweight (25–29.99) | 22 (33.3%) | 22 (37.9%) | |
| Obese (≥30) | 13 (19.7%) | 12 (20.7%) | |
| Arm circumference (cm) | 28.99 (3.55); 28 (21–38) | 29.37 (4.48); 28 (22–42) | 0.870 |
| Waist circumference (cm) | 97.74 (13.35); 97.5 (68–135) | 95.19 (11.15); 94 (72–123) | 0.265 |
| Hip circumference (cm) | 100.84 (8.35); 100 (82–122) | 102.36 (7.62); 103 (85–115) | 0.163 |
| Waist-hip circumference ratio | 0.96 (0.09); 0.97 (0.68–1.25) | 0.92 (0.08); 0.93 (0.75–1.10) | 0.029* |
| Calf circumference (cm) | 35.58 (3.23); 35 (28–43) | 35.68 (3.62); 36 (27–46) | 0.660 |
| Nutritional parameters | |||
| MNA (total score) | 23.97 (3.23); 24.50 (11.5–28.5) | 24.79 (2.8); 25 (13.5–29.5) | 0.131 |
| MNA < 24 | 29 (43.9) | 14 (24.1) | 0.032* |
| MNA≥24 | 37 (56.1) | 44 (75.9) | |
| TDEE (kcal/day) | 2043 (359); 2079 (1130–2869) | 2136 (334); 2056 (1641–2996) | 0.284 |
| Energy intake (kcal/day) | 1880 (509); 1793 (829–3320) | 1785 (473); 1750 (777–3250) | 0.362 |
| Proteins (%) | 15 (3); 15 (10–23) | 16 (3);16 (10–25) | 0.048* |
| (g/kg/d) | 1.02 (0.36); 0.95 (0.32–2.35) | 1.04 (0.31); 1.03 (0.31–1.87) | 0.420 |
| Animal proteins (%) | 59 (10); 58 (29–86) | 58 (11); 59 (10–77) | 0.818 |
| Animal/plant proteins | 1.61 (0.63); 1.47 (0.61–3.93) | 1.56 (0.57); 1.45 (0.23–3.47) | 0.730 |
| Carbohydrates (%) | 53 (5); 53 (41–64) | 51 (6); 51 (37–68) | 0.130 |
| Sugars (%) | 20 (6); 20 (8–39) | 18 (5); 17 (9–32) | 0.129 |
| Lipids (%) | 31 (5); 31 (24–43) | 32 (6); 32 (15–47) | 0.485 |
| SFA (%) | 10 (3); 9 (6–19) | 9 (3); 9 (4–18) | 0.841 |
| MUFA (%) | 16 (3); 15 (11–25) | 16 (4);16 (4–26) | 0.417 |
| PUFA (%) | 4 (1); 3 (2–9) | 4 (1); 3 (1–8) | 0.244 |
| Cholesterol (mg/d) | 217 (97); 202 (76–597) | 224 (98); 227 (42–522) | 0.491 |
| Fibers (g/d) | 23.8 (7.2); 23.5 (8.2–42.2) | 22.3 (6.6); 22.5 (7.9–43.2) | 0.148 |
| (g/1000 kcal) | 13 (4.3); 12.4 (5.8–33.6) | 13 (4.2); 12.3 (4–26) | 0.984 |
| Calcium (mg/d) | 781.2 (225.3); 726.4 (405.2–1477.5) | 838 (422.2); 746.4 (308.1–3322.4) | 0.700 |
| Sodium (mg/d) | 1595.4 (646.9); 1431.9 (256.8–3068.7) | 1540.6 (658.3); 1357.2 (596.6–3291.5) | 0.411 |
| Potassium (mg/d) | 3046.4 (783); 3120.7(1041.1–5098.4) | 2902.9 (753); 2862.5 (630.6–4270.1) | 0.298 |
| Phosphorus (mg/die) | 1129.8 (303.3); 1114.5(526.7–2070.1) | 1137.4 (322.5); 1087 (612.8–2012.4) | 0.802 |
| Iron (mg/die) | 17.8 (10.7); 15.2 (4.3–82.3) | 15.3 (6.7); 13.4 (4.3–36.5) | 0.110 |
| Water (ml/die) | 1107.5 (487.8); 1000 (500–3500) | 1188.7 (523);1000 (400–3000) | 0.040* |
| Alcohol (% /total energy) | 2 (4); 0 (0–18) | 3 (5); 0 (0–22) | 0.852 |
| Daily meals | 2.98 (0.12); 3 (2–3) | 2.97 (0.18); 3 (2–3) | 0.486 |
| Daily square meals | 1.89 (0.78); 2 (0–3) | 1.95 (0.86); 2 (0–3) | 0.661 |
| BIA parameters | |||
| Fat mass (%) | 20.89 (8.25); 18.75 (3.90–42.20) | 23.19 (9.3); 22.85 (6.30–41.70) | 0.173 |
| Fat free mass (kg) | 48.88 (10.23); 46.9 (35.2–77.9) | 45.9 (9.74); 43.2 (33.2–73.8) | 0.080 |
| Muscle mass | |||
| (kg) | 45.8 (9.3); 46 (33.3–73.9) | 48.8 (10.19); 48.2(36.6–80.9) | 0.076 |
| (kg/m2) | 17.1 (2.1); 17 (13.8–20.9) | 17.49 (2.07); 16.9(13.2–23.9) | 0.080 |
| SMMI (kg/m2) | 12,56 (1,61); 12,30 (9.27–16.72) | 11,98 (1.60); 12,30 (9.49–15.07) | 0.017* |
| Total water (kg) | 35.71 (7.76); 35.0 (24.7–56.6) | 33.62 (7.36); 31.9 (23.1–54.6) | 0.141 |
| Performance measurement | |||
| Level of physical activity | 1.50 (0.20); 1.51 (1.01–1.90) | 1.59 (0.15); 1.58 (1.22–1.93) | 0.026* |
| Strength at dynamometer (kg) | 26.77 (8.87); 26.15 (12.24–48.90) | 26.11 (9.11); 23.20 (10.70–51) | 0.606 |
| Dynapenia | 21 (31.8%) | 17 (29.3%) | 0.509 |
| Steps at 6 m course (n) | 13.49 (4.49); 13 (7–30) | 11.17 (2.57); 11.00 (7–19) | 0.001* |
| Speed (m/s) | 0.93 (0.34); 0.96 (0.28–1.96) | 1.06 (0.27); 1.04 (0.46–1.84) | 0.035* |
| Stride length (m) | 0.48 (0.13); 0.46 (0.20–0.86) | 0.56 (0.12); 0.54 (0.32–0.86) | 0.001* |
| Sarcopenia | 3 (5.4%) | 1 (1.6%) | 0.248 |
Data are expressed as average (SD); median (min–max) or number of observations (% on total observations). * p < 0.05. CIRS = Cumulative Illness Rating Scale; BMI = Body Mass Index; MNA = Mini Nutritional Assessment; TDEE = Total Daily Energy Expenditure; SFA = saturated fatty acid; MUFA = monounsaturated fatty acid; PUFA = polyunsaturated fatty acid; BIA = Bioelectrical Impedance Analysis; SMMI = Skeletal Muscle Mass Index.
Demographic data (age, sex, and education) did not differ between PD and controls. PD showed a higher comorbidity total score.
No significant differences were found in anthropometric measurements of BMI and circumferences of arm, waist, and hip. A significant higher waist-hip circumference ratio was found in PD patients with respect to controls, with a medium effect size (Cohen’s d = 0.47).
PD resulted more at risk of malnutrition (MNA < 24) assessed with MNA than controls; 3 patients resulted malnourished at MNA (MNA < 17) with respect to only one control.
Energy intake and expenditure showed comparable values between the two groups.
Regarding macro- and micronutrients, PD patients showed a statistically significant lower consumption of water and of protein (in %) with respect to controls, with small effect sizes (Cohen’s d = 0.23 and 0.33 respectively); no other nutritional differences emerged between case and controls.
Most of the subjects of both groups of cases and controls consume on average three meals a day, but only few of them eat full meals, which means composed of carbohydrates, lipids and proteins; daily food intake resulted lower than energy expenditure.
Regarding BIA parameters, no significant differences was found between PD and controls in fat mass, fat free mass, muscle mass and total water content. However, skeletal muscle mass index resulted higher in PD than in controls.
Concerning performance measurements, gait speed of PD patients resulted lower than controls, whereas the number of steps was higher and stride length at 6 m course was shorter in PD patients with respect to controls. No differences in handgrip strength test was revealed between PD and controls.
One patient resulted sarcopenic (1,5%) with respect to 3 controls (5,1%). Twenty-one PD patients (31.8 %) and 17 controls (29.3 %) resulted dynapenic.
3.2Nutritional status and dietary habits in PD subgroups and in relation to clinical scales and indexes of disease progression.
Table 3 illustrates clinical features of PD patients.
Table 3
Clinical features of PD patients
| PD | |
| Clinical subtype | |
| Tremor dominant | 28 (42.4) |
| Akinetic-rigid | 38 (57.6) |
| History of disease | |
| Age of onset | 66 (8.8); 67 (47–87) |
| Years of disease | 6.5 (4.5); 6 (1–19) |
| Progression indexes | |
| HY/years | 0.39 (3.4); 0.28 (0–1.5) |
| UPDRSIII/years | 4.3 (3.9); 3.0 (0.1–21) |
| Motor Scales | |
| UPRDS III | 17 (11.1); 11 (1–52) |
| UPRDS III hypertonia | 3.1 (2.6); 3 (0–11) |
| UPRDS IV dyskinesia | 0.5 (1.1). 0 (0–4) |
| UPRDS IV fluctuations | 0.5 (0.8); 0 (0–4) |
| UPRDS IV dystonia | 0.1 (0.4); 0 (0–1) |
| Non-motor Scale | 64.4 (37.0); 59.5 (1–178) |
| Cognitive assessment | |
| MMSE | 27.4 (3.2); 29 (17–30) |
| Quality of life | |
| PDQ-8 | 8.6 (5.8); 7.5 (0–22) |
| LED | 502.3 (319.6); 475 (0–1230) |
| Nutritional treatment | |
| Protein redistribution diet | 16 (24.2) |
Data are expressed as average (SD); median (min–max) or number of observations (% on total observations). HY = Hoen and Yahr score; UPRDS = Unified Parkinson’s Disease Rating Scale; MMSE = MiniMental State Examination; PDQ = Parkinson’s Disease Questionnaire; LED = Levodopa Equivalent Dose.
No nutritional differences were found between PD motor subtypes (TD vs. NTD).
No significant correlation was found between nutritional parameters (anthropometric measurements, BIA parameters, micro- and macronutrients intakes) and clinical scales scores or progression indexes. A notable inverse correlation (rs = –0.418, p < 0.001) was found between MNA total score and PDQ8.
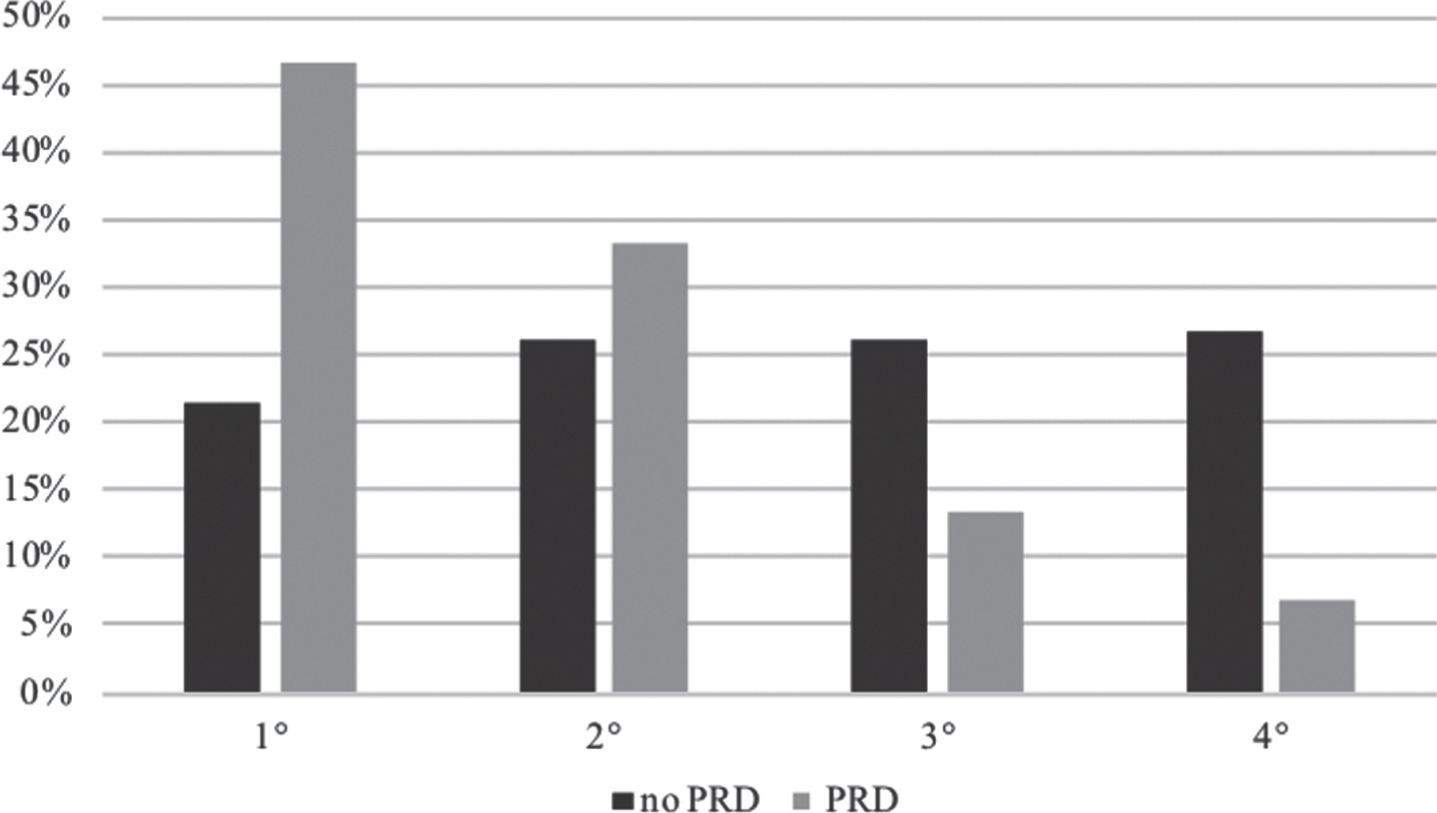
PD following a PRD showed a significant slower progression index (UPDRS III/years) (Table 4). Figure 1 represents the percentage distribution in 4 quartiles of the disease progression index in PD treated with L-Dopa based on their PRD adherence. The first quartile indicates the lowest disease progression index.
Table 4
Clinical features of PD patients in treatment with L-dopa (n = 57), with (n = 15) or without (n = 42) Protein Redistribution Diet (PRD)
| PRD | No PRD | P | |
| Clinical subtype | |||
| Tremor dominant | 22 (78.6) | 6 (21.4) | 0.650 |
| Akinetic-rigid | 28 (73.7) | 10 (26.3) | |
| History of disease | |||
| Years of disease | 7.6 (3.73); 7 (2–15) | 7.05 (4.69); 6 (1–19) | 0.630 |
| Weight change | 0.46 (6.38); 0.3 (–8.60–18.90) | 0.56 (10.5); 2.3 (–29.50–14.60) | 0.410 |
| Weight gain | 7 (46.7) | 19 (45.2) | 0.739 |
| Weight loss | 7 (46.7) | 23 (54.8) | |
| Motor scales | |||
| UPDRS III | 13.47 (9.716); 9 (3–39) | 8.76 (11.98); 17 (1–52) | 0.092 |
| UPDRS IV dyscinesia | 0.6 (1.4); 0 (0–5) | 0.48 (1.04); 0 (0–4) | 0.902 |
| UPDRS IV fluctuations | 0.53 (1.06); 0 (0–4) | 0.62 (0.79); 0 (0–3) | 0.411 |
| UPDRS IV dystonia | 0.27(0.45); 0 (0–1) | 0.14 (0.35); 0 (0–1) | 0.283 |
| Non motor scales | |||
| NMSS | 65.5 (26.2); 62.5 (33–139) | 67.10 (40.55); 58 (13–178) | 0.892 |
| Quality of life scale | |||
| PDQ8 | 8.33 (5.46); 8 (0–17) | 8.71 (5.71); 7(0–21) | 0.920 |
| Progression indexes | |||
| HY/years | 0.20 (0.12); 0.18 (0.11–0.50) | 0.38 (0.36); 0.28 (0–1.53) | 0.262 |
| UPDRS III/years | 2.41(2.96); 1.4 (0.6–12) | 4.38 (4); 3.2 (0.09–21) | 0.023* |
| Falls in last 6 months | 0.27 (0.79); 0 (0–3) | 0.81(1.43); 0 (0–7) | 0.111 |
Data are expressed as average (SD); median (min–max) or number of observations (% on total observations); UPRDS = Unified Parkinson’s Disease Rating Scale; NMSS = Nonmotor Symptoms Scale; PDQ = Parkinson’s Disease Questionnaire; HY = Hoen and Yahr score.
Fig. 1
Percentage distribution in quartiles of the disease progression index in L-dopa treatment of PD following a PRD. The first quartile indicates the lowest index of disease progression.
4Discussion
In this study emerged a similar nutritional status (in terms of anthropometric measurements and BIA parameters) of PD patients with respect to controls with a comparable dietary intake.
No previous study analysed both body composition by BIA and dietary habits in PD with respect to a control group. Moreover, to our knowledge, this is the first study analysing body composition in patients with essential tremor: no differences emerged in the comparison to HC and PD patients.
A recent case-control study compared body composition assessed by BIA in PD patients versus HC [28] reporting substantially similar mass indexes in the two groups, whereas another study demonstrated a significant lower muscle mass in PD patients with respect to controls [29] despite the cohort of patients was younger than our own.
Only one PD patient of our cohort resulted sarcopenic according to the diagnostic criteria for sarcopenia [19]. Previous studies described a prevalence of sarcopenia in PD from 6.6 to 50% [28, 28, 30–33], percentages similar to the prevalence of sarcopenia in the elderly [34]. Our finding is more in line with the low prevalence described by another Italian group [33], suggesting that the variability of prevalence could be link to the country (and even city) in which the studies are carried out in addition to the different diagnostic criteria used to define sarcopenia [31]. Furthermore, our finding of a low prevalence of sarcopenia in PD group may be due to the exclusion of patients with a moderate-severe cognitive impairment.
In our cohort, PD patients showed a higher risk of malnutrition assessed with MNA (MNA = 17–24) with respect to controls, but only three patients resulted really malnourished (MNA < 17) with respect to only one control. The malnutrition rate in PD patients is known for varying from 0 to 25.5% and the risk of malnutrition from 19.66 to 34.3% [35]; this variability could mainly depend on disease severity of recruited patients. In line with previous findings [25], there was a significant correlation between nutritional status assessed by MNA and perception of quality of life (assessed by PDQ-8) in our cohort of PD patients. Most of the subjects of our sample (patients and controls) consume on average three meals a day, but only few of them assume full meals, which means composed of carbohydrates, lipids, and proteins. Dietary caloric intake of PD patients based on their dietary recall is lower than their total daily energy expenditure; moreover, protein intake resulted lower than 1,1 g/kg recommended for the elderly by Italian reference for nutrients and energy intake levels (LARN) [36]. Probably, the presence of different motor and non-motor symptoms in PD (such as depression, alteration of taste and olfaction, swallowing difficulties, constipation etc..) in addition to an advanced age, possible economic difficulties, and a limited knowledge of correct eating habits, can lead patients to consume unbalanced meals. In frail elderly people, such as PD patients, a higher protein intake (1.5 g/kg/day) is recommended in order to maintain functional status and positive contribute to health [37]. Several large cohort studies described a relationship between low protein intake and frailty in elderly [38]. PD patients of our cohort drank less water with respect to controls (even if effect size resulted small); however, water intake resulted far below recommended levels (2 litres per day). These data were previously reported in another study [39]. Drinking water may be reduced in PD patients due to the frequent urinary symptoms (such as urgency, frequency, nocturia and urge incontinence); a reduced hydration may lead to a worsening of both motor symptoms and non-motor symptoms (first and foremost constipation).
Within the group of patients treated with L-Dopa, disease progression was inversely correlated with adherence to the PRD. The low adherence of our cohort of PD to PRD could be explained with the lack of multidisciplinary team for PD which includes dietitians. It is well known that the PRD leads to an improvement of the response to L-Dopa, of motor fluctuations, and is associated with an improvement in the quality of life [40–42].
Therefore, a specific nutritional intervention for PD patients might be targeted to improve their health and to optimize pharmacologic treatment for both motor and nonmotor symptoms, thus contributing to improve their quality of life. A nutritional education should represent a standard of care in neurological follow up visits of PD patients and should involve caregivers too.
Our findings need to be interpreted in the context of the strengths and limitations of the methodology of our study. Major strength consists in careful collection of clinical and nutritional information of cases and controls. The main limit of this study is the small sample size. Moreover, BIA is a simple, rapid, and non-invasive method to measure body composition, but it does not represent the gold standard for measuring fat and fat-free masses. A possible bias linked to memory deficit or to the difficulties in identifying the frequencies and quantities of food may be attributed to food history’s collection. The transversal nature of this study does not allow to establish any temporal relationship between exposure nutritional factors and disease progression, nor even to quantify previous exposures to them; we used surrogate measures of disease progression which should be verified in longitudinal studies.
Clinicians should not forget that a proper nutrition is important for minimizing symptoms of PD and delaying disease progression: reliable information about diet represents an integral part of a neurological visits and a dietary advice by a registered dietician is highly recommended to be in line with a good medical practice. A correct diet is an integral part of PD therapy.
References
[1] | Cova I , Priori A . Diagnostic biomarkers for Parkinson’s disease at a glance: where are we? J Neural Transm Vienna Austria. (2018) ;125: (10):1417–32. |
[2] | Pang SY-Y , Ho PW-L , Liu H-F , Leung C-T , Li L , Chang EES , et al. The interplay of aging, genetics and environmental factors in the pathogenesis of Parkinson’s disease. Transl Neurodegener. (2019) ;8: (1):23. |
[3] | Sääksjärvi K , Knekt P , Lundqvist A , Männistö S , Heliövaara M , Rissanen H , et al. A cohort study on diet and the risk of Parkinson’s disease: the role of food groups and diet quality. Br J Nutr. (2013) ;109: (2):329–37. |
[4] | Mischley LK , Lau RC , Bennett RD . Role of Diet and Nutritional Supplements in Parkinson’s Disease Progression. Oxid Med Cell Longev. (2017) ;2017: :1–9. |
[5] | Hellenbrand W , Boeing H , Robra B-P , Seidler A , Vieregge P , Nischan P , et al. Diet and Parkinson’s disease II: A possible role for the past intake of specific nutrients: Results from a self-administered food-frequency questionnaire in a case-control study. Neurology. (1996) ;47: (3):644–50. |
[6] | Chen H . Dietary Intakes of Fat and Risk of Parkinson’s Disease. Am J Epidemiol. (2003) ;157: (>11):1007–14. |
[7] | Bajracharya R , Youngson NA , Ballard JWO . Dietary Macronutrient Management to Treat Mitochondrial Dysfunction in Parkinson’s Disease. Int J Mol Sci. (2019) ;20: (8):1850. |
[8] | Sherzai AZ , Tagliati M , Park K , Pezeshkian S , Sherzai D . Micronutrients and Risk of Parkinson’s Disease: A Systematic Review. Gerontol Geriatr Med. (2016) ;2: :233372141664428. |
[9] | Uyar GÖ , Yildiran H . A nutritional approach to microbiota in Parkinson’s disease. Biosci Microbiota Food Health. (2019) ;38: (4):115–27. |
[10] | Barichella M , Cereda E , Pezzoli G . Major nutritional issues in the management of Parkinson’s disease. Mov Disord. (2009) ;24: (13):1881–92. |
[11] | Cereda E , Barichella M , Pedrolli C , Pezzoli G . Low-protein and protein-redistribution diets for Parkinson’s disease patients with motor fluctuations: A systematic review. Mov Disord. (2010) ;25: (13):2021–34. |
[12] | Fávaro-Moreira NC , Krausch-Hofmann S , Matthys C , Vereecken C , Vanhauwaert E , Declercq A , et al. Risk Factors for Malnutrition in Older Adults: A Systematic Review of the Literature Based on Longitudinal Data. Adv Nutr. (2016) ;7: (3):507–22. |
[13] | Sheard JM , Ash S , Silburn PA , Kerr GK . Prevalence of malnutrition in Parkinson’s disease: a systematic review: Nutr Rev. (2011) ;69: (9):520–32. |
[14] | Postuma RB , Berg D , Stern M , Poewe W , Olanow CW , Oertel W , et al. MDS clinical diagnostic criteria for Parkinson’s disease. Mov Disord Off J Mov Disord Soc. (2015) ;30: (12):1591–601. |
[15] | Elble RJ . Diagnostic criteria for essential tremor and differential diagnosis. Neurology. (2000) ;54: (11 Suppl 4):S2–6. |
[16] | Movement Disorder Society Task Force on Rating Scales for Parkinson’s Disease. The Unified Parkinson’s Disease Rating Scale (UPDRS): status and recommendations. Mov Disord Off J Mov Disord Soc. (2003) ;18: (7):738–50. |
[17] | Cova I , Di Battista ME , Vanacore N , Papi CP , Alampi G , Rubino A , et al. Validation of the Italian version of the Non Motor Symptoms Scale for Parkinson’s disease. Parkinsonism Relat Disord [Internet]. 2016 Oct [cited 2016 Dec 10]; Available from: http://linkinghub.elsevier.com/retrieve/pii/S1353802016304217 |
[18] | Jenkinson C , Fitzpatrick R . Cross-cultural evaluation of the short form 8-item Parkinson’s Disease Questionnaire (PDQ-8): Results from America, Canada, Japan, Italy and Spain. Parkinsonism Relat Disord. (2007) ;13: (1):22–8. |
[19] | Salvi F , Miller MD , Grilli A , Giorgi R , Towers AL , Morichi V , et al. A manual of guidelines to score the modified cumulative illness rating scale and its validation in acute hospitalized elderly patients. J Am Geriatr Soc. (2008) ;56: :1926–31. |
[20] | Timothy G , Lohman , Alex F . Roche, Reynaldo Martorell. Anthropometric Standardization Reference Manual. Human Kinetics Books. Science. 1988. |
[21] | Al-Gindan YY , Hankey C , Govan L , Gallagher D , Heymsfield SB , Lean MEJ . Derivation and validation of simple equations to predict total muscle mass from simple anthropometric and demographic data. Am J Clin Nutr. (2014) ;100: (4):1041–51. |
[22] | Harris JA , Benedict FG . A Biometric Study of Human Basal Metabolism. Proc Natl Acad Sci U S A. (1918) ;4: (12):370–3. |
[23] | Food and Agriculture Organization of the United Nations, United Nations University, World Health Organization, editors. Human energy requirements: report of a Joint FAO/WHO/UNU Expert Consultation: Rome, 17-24 October 2001. Rome: Food and Agricultural Organization of the United Nations; 2004. pp. 96. (FAO, food and nutrition technical report series). |
[24] | Guigoz Y . The Mini Nutritional Assessment (MNA) review of the literature–What does it tell us? J Nutr Health Aging. (2006) ;10: (6):466–85485-487; discussion. |
[25] | Ward LC , Müller MJ . Bioelectrical Impedance Analysis. Eur J Clin Nutr. (2013) ;67: (S1):S1–S1. |
[26] | Cruz-Jentoft AJ , Baeyens JP , Bauer JM , Boirie Y , Cederholm T , Landi F , et al. Sarcopenia: European consensus on definition and diagnosis: Report of the European Working Group on Sarcopenia in Older People. Age Ageing. (2010) ;39: (4):412–23. |
[27] | Bracco F , Malesani R , Saladini M , Battistin L . Protein redistribution diet and antiparkinsonian response to levodopa. Eur Neurol. (1991) ;31: (2):68–71. |
[28] | Ozer FF , Akın S , Gultekin M , Zararsız GE . Sarcopenia, dynapenia, and body composition in Parkinson’s disease: are they good predictors of disability?: a case-control study. Neurol Sci [Internet]. 2019 Oct 3 [cited 2019 Nov 8]; Available from: http://link.springer.com/10.1007/s10072-019-04073-1 |
[29] | Clinic of Neurology, University of Health Sciences Izmir Bozyaka Training and Research Hospital, Izmir, Turkey, Yilmaz Kusbeci O , Donmez Colakoglu B , Department of Neurology, Dokuz Eylul University School of Medicine, Izmir, Turkey, Inci I, Clinic of Neurology, University of Health Sciences Izmir Bozyaka Training and Research Hospital, Izmir, Turkey, et al. Sarcopenia in Parkinson’s disease patients. Neurol Sci Neurophysiol. (2019) ;36: (1):28–32. |
[30] | Tan AH , Hew YC , Lim S-Y , Ramli NM , Kamaruzzaman SB , Tan MP , et al. Altered body composition, sarcopenia, frailty, and their clinico-biological correlates, in Parkinson’s disease. Parkinsonism Relat Disord. (2018) ;56: :58–64. |
[31] | Vetrano DL , Pisciotta MS , Laudisio A , Lo Monaco MR , Onder G , Brandi V , et al. Sarcopenia in Parkinson Disease: Comparison of Different Criteria and Association With Disease Severity. J Am Med Dir Assoc. (2018) ;19: (6):523–7. |
[32] | Yazar T , Yazar HO , Zayimoğlu E , Çankaya S . Incidence of sarcopenia and dynapenia according to stage in patients with idiopathic Parkinson’s disease. Neurol Sci. (2018) ;39: (8):1415–21. |
[33] | Barichella M , Pinelli G , Iorio L , Cassani E , Valentino A , Pusani C , et al. Sarcopenia and Dynapenia in Patients With Parkinsonism. J Am Med Dir Assoc. (2016) ;17: (7):640–6. |
[34] | Cruz-Jentoft AJ , Landi F , Schneider SM , Zuniga C , Arai H , Boirie Y , et al. Prevalence of and interventions for sarcopenia in ageing adults: a systematic review. Report of the International Sarcopenia Initiative (EWGSOP and IWGS). Age Ageing. (2014) ;43: (6):748–59. |
[35] | Seyed-Mohammad F , Ladan G , Motahhareh S , Dena K , Ali SG , Ahmad D , et al. Prevalence of Malnutrition in Patients with Parkinson’s Disease: A Comparative Study with Healthy Controls using Mini Nutritional Assessment (MNA) Questionnaire. J Park Dis. (2014) ;(3):473–81. |
[36] | Società Italiana di Nutrizione Umana (SINU). LARN Livelli di Assunzione di Riferimento di Nutrienti ed energia IV Revision. 2014. |
[37] | Artaza-Artabe I , Sáez-López P , Sánchez-Hernández N , Fernández-Gutierrez N , Malafarina V . The relationship between nutrition and frailty: Effects of protein intake, nutritional supplementation, vitamin D and exercise on muscle metabolism in the elderly. A systematic review. Maturitas. (2016) ;93: :89–9. |
[38] | Hernández Morante JJ , Gómez Martínez C , Morillas-Ruiz JM . Dietary Factors Associated with Frailty in Old Adults: A Review of Nutritional Interventions to Prevent Frailty Development. Nutrients. (2019) ;11: (1):102. |
[39] | assani E , Barichella M , Ferri V , Pinelli G , Iorio L , Bolliri C , et al. Dietary habits in Parkinson’s disease: Adherence to Mediterranean diet. Parkinsonism Relat Disord. (2017) ;42: :40–6. |
[40] | Barichella M , Cereda E , Pezzoli G . Major nutritional issues in the management of Parkinson’s disease. Mov Disord. (2009) ;24: (13):1881–92. |
[41] | Carter JH , Nutt JG , Woodward WR , Hatcher LF , Trotman TL . Amount and distribution of dietary protein affects clinical response to levodopa in Parkinson’s disease. Neurology. (1989) ;39: (4):552. |
[42] | Duarte J , Moreno C , Coria F , Pérez A , Clavería LE . [Efficacy of the proteic redistribution diet (PRD) in the antiparkinsonian effect of L-dopa]. Neurol Barc Spain. (1993) ;8: (8):248–51. |


