
Diet quality indices and risk of metabolic syndrome among postmenopausal women of Mexican ethnic descent in the Women’s Health Initiative Observational Study
Abstract
BACKGROUND:
The prevalence of metabolic syndrome is higher among minority populations, including individuals of Mexican ethnic descent. Whether alignment to healthy dietary patterns is associated with lower risk of metabolic syndrome in this population is largely unknown.
OBJECTIVE:
To prospectively evaluate the associations between a priori diet quality scores and risk of metabolic syndrome and its components among postmenopausal women of Mexican ethnic descent.
METHODS:
A total of 334 women of Mexican ethnic descent who participated in the Women’s Health Initiative (WHI) observational study without metabolic syndrome or diabetes at baseline (1993–1998) were included. Baseline diets were scored with the Alternate Mediterranean Diet (aMED), the Dietary Approaches to Stop Hypertension (DASH), the Healthy Eating Index (HEI-2010), the Mediterranean Diet Score (MDS), and the traditional Mexican Diet (MexD) score. Multivariable linear and logistic regression models were used to test the associations between baseline diet quality and risk of metabolic syndrome and its individual components at follow-up (2012-2013).
RESULTS:
Approximately 16% of women met the criteria for metabolic syndrome at follow-up. None of the diet quality indices were associated with risk of metabolic syndrome. However, higher vs lower DASH scores were associated with lower waist circumference (85.2 vs 88.0 cm) and glucose concentrations (90.0 vs 95.1 mg/dL), and higher HDL cholesterol (62.6 vs 59.0 mg/dL), while higher vs lower HEI-2010 scores were associated with lower waist circumference (83.9 vs 88.1 cm), triglycerides (103 vs 117 mg/dL) and glucose concentrations (89.5 vs 94.4 mg/dL), and higher HDL cholesterol levels (63.9 vs 58.5 mg/dL).
CONCLUSIONS:
Diet quality was not associated with risk of metabolic syndrome in this population. However, the results suggest that alignment to DASH and HEI-2010 recommendations may be beneficial for reducing some individual components of metabolic syndrome among postmenopausal women of Mexican descent.
1Introduction
Metabolic syndrome is a cluster of metabolic abnormalities (including abdominal obesity, low HDL cholesterol, elevated triglycerides, elevated fasting blood glucose levels, and high blood pressure) which contributes to higher risk of cardiovascular disease (CVD), type 2 diabetes mellitus (T2D), and all-cause mortality [1, 2]. According to data from the 1998–2012 National Health and Examination Survey (NHANES), more than a third of adults in the United States (US) have metabolic syndrome [3, 4], and the rates are even higher among older adults (55% among 60 years old or older) [4]. Notably, the rates of metabolic syndrome are disproportionally higher among Hispanics, including those of Mexican ethnic descent [5–7].
Following dietary patterns that are characterized as both energy-dense and nutrient-poor contributes to higher risk of obesity, CVD, T2D, and metabolic syndrome [8–16]. Conversely, greater alignment to “healthy” dietary patterns, characterized as nutrient-dense and high in fruits, vegetables and whole grains reduces the risk of cardiometabolic disease [17–22].
Diet quality indices are used to score patterns according to dietary recommendations and evaluate associations with cardiometabolic disease. For example, the Alternate Mediterranean Diet (aMED) Index and the Mediterranean Diet Score (MDS) have been previously associated with reduced risk of mortality, CVD, T2D, and cancer in ethnically diverse populations [23–29]. In this regard, the Dietary Approaches to Stop Hypertension (DASH) Index reflects alignment to a dietary pattern shown to lower blood pressure in clinical trials, and to reduce risk of CVD in observational studies,[30] whereas the Healthy Eating Index (HEI) reflects alignment to the Dietary Guidelines for Americans (DGAs). The DGAs help promote healthy dietary patterns to prevent chronic disease and maintain healthy weight [31]. Accumulating evidence exists on the beneficial effects of following “healthy” or “prudent” dietary patterns as scored by these diet quality indices in reducing risk of cardiometabolic disease [8, 9, 11–15, 19, 20, 22, 32–35]. However, many of these studies have been conducted among non-Hispanic Whites [36].
We and others have mostly shown that, among those of Mexican ethnic descent, greater acculturation to commonly consumed US diets is usually associated with energy-dense and nutrient-poor diets and contributes to this group’s disproportionally higher risk of cardiometabolic disease [37–40]. Conversely, greater alignment to a traditional Mexican diet (MexD) high in legumes, complex carbohydrates, fruits, and vegetables, but low in processed foods and added sugars, has been shown to contribute to healthier cardiometabolic profiles in this population [41–43]. Nonetheless, it is unclear whether adhering to a traditional Mexican diet or other “healthy” dietary patterns, as scored by commonly used diet quality indices, contributes to lower risk of metabolic syndrome among older women of Mexican descent. To address this question, we examined the long-term associations between a priori diet quality scores and risk of metabolic syndrome, as well as its individual components, among older postmenopausal women of Mexican descent who participated in the Women’s Health Initiative (WHI) observational study.
2Materials and methods
2.1Study population
The Women’s Health Initiative (WHI) enrolled 161,808 postmenopausal women, ages 50 to 79 years old from one of 40 clinical sites throughout the US between 1993 and 1998 to participate in an observational study or up to three clinical trials [44]. When the clinical trials ended in 2005, 115,407 clinical trial and observational study participants were consented to continue with observational follow-up. Details on the study design and characteristics of the WHI cohort have been described elsewhere (Clinical-Trials.gov identifier: NCT00000611) [44, 45].
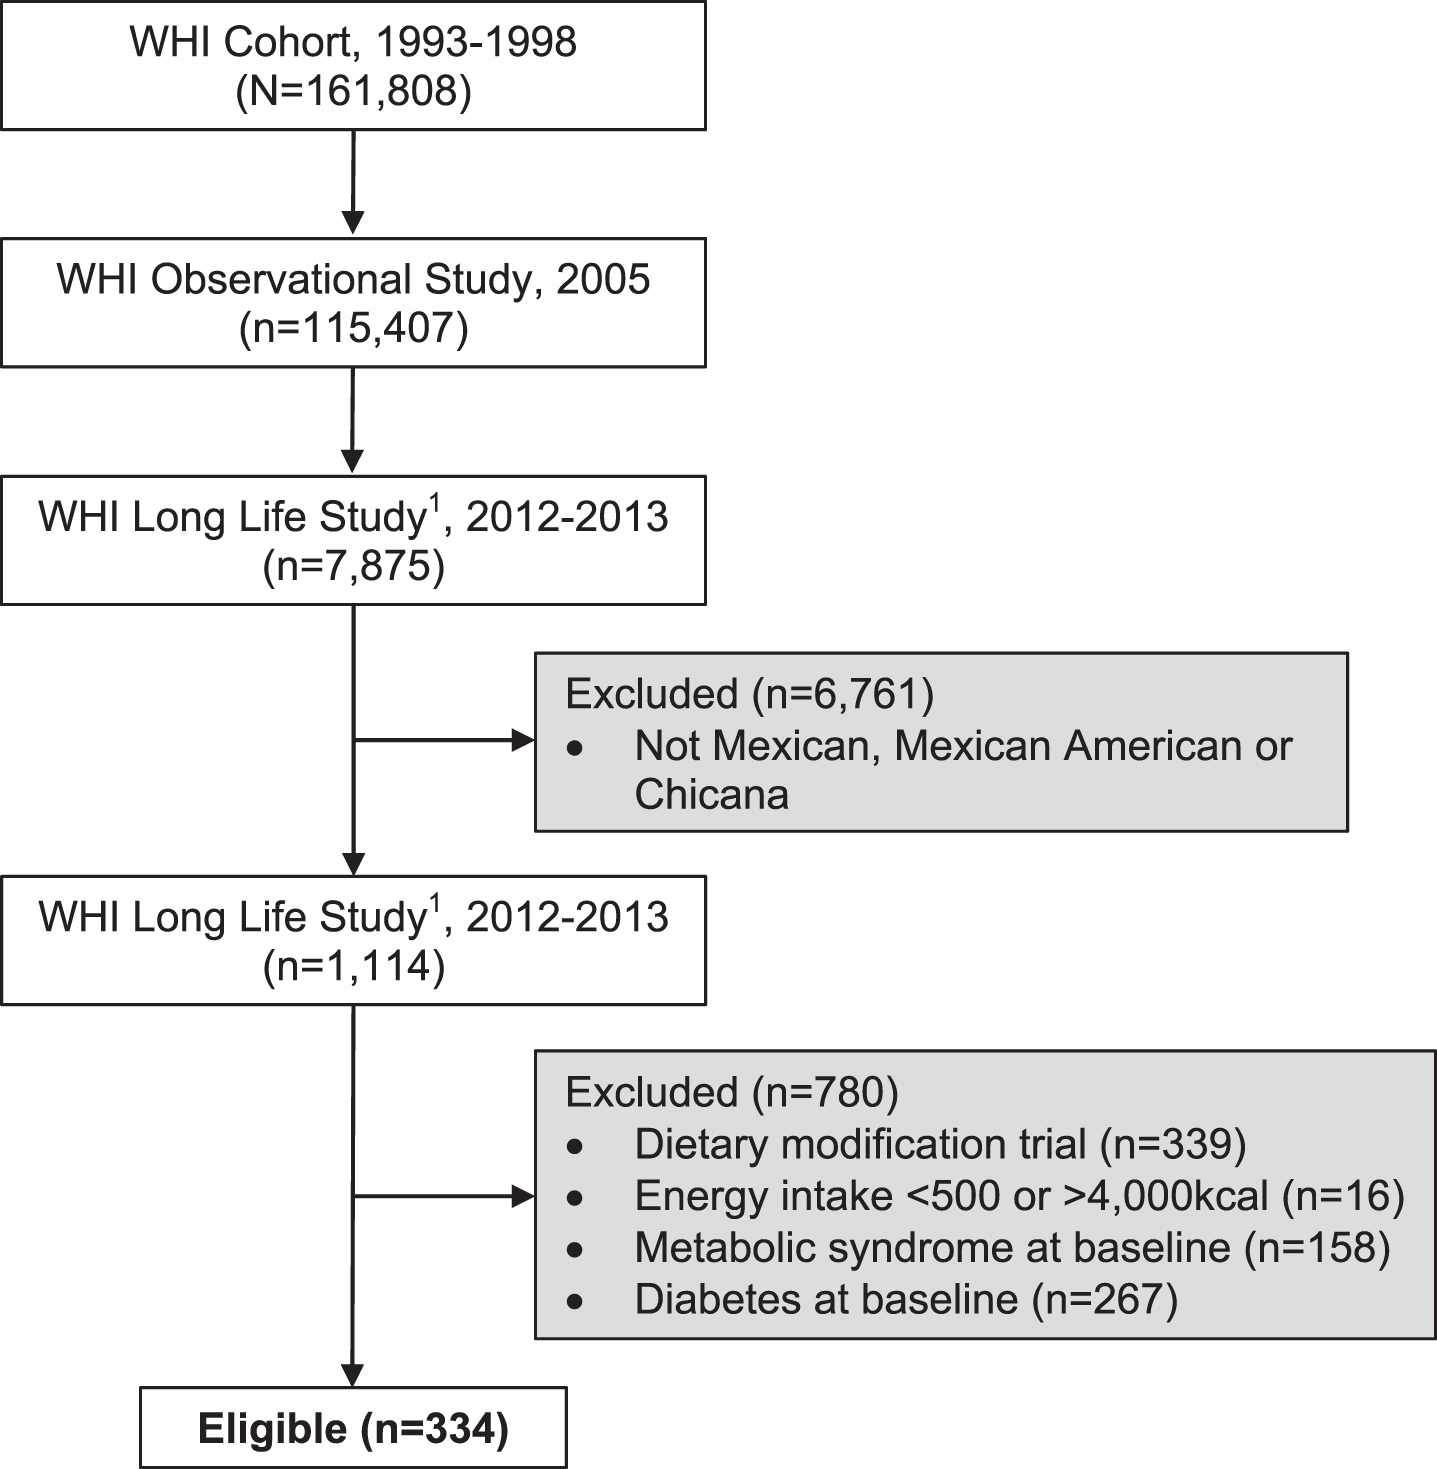
For this analysis, we selected participants who self-identified as being of Mexican descent (Mexican, Mexican American, or Chicano) and whom had available dietary intake data at baseline (1993–1998) and long-term, follow-up clinical data (2012-2013). Follow-up measurements were collected as part of the WHI Long Life Study (LLS), which was an extension sub-study of the WHI to collect health outcomes data among women who had participated in the hormone trials, as well as for participants who were African American or Hispanic. Details on the study design and characteristics of the WHI LLS have been described previously. From a total of 1,114 women who met our inclusion criteria of Mexican descent who had dietary and LLS clinical data, we further excluded women with metabolic syndrome (n = 158) and diabetes at baseline (n = 267), women who participated in the intervention group for the Dietary Modification trial (n = 339), and those with either low or high self-reported energy intakes from the FFQ (<500 or >4,000 kcal) at baseline (n = 16). This resulted in a total of 334 eligible participants who were included in our analysis (Fig. 1). The WHI and the WHI-LLS was approved by the Institutional Review Boards at all participating institutions, and participants provided written informed consents at baseline and again for the WHI-Extensions, including the LLS.
Fig. 1
Flow diagram of 334 eligible women of Mexican descent who participated in the Women Health Initiative (WHI) and were included in the analyses. Eligibiluty criteria included women who had dietary intake data at baseline (1993-1998) and long-term, follow-up clinical data collected as part of the Long Life Study (LLLS) in 2012-2013.
2.1.1Demographics
In the WHI, study participants reported demographic characteristics, including age, race/ethnicity, household income, education and recreational physical activity through standardized questionnaires at study entry [44]. In our analysis, we also included an acculturation proxy measure (language preferred) as a covariate.
2.2Baseline diets “scored” using a priori diet quality indices scoring criteria
Baseline dietary intake data were collected with a self-administered food frequency questionnaire (FFQ) with 122-line items for foods and beverages consumed during the past 3 months and 4 summary questions. The precursor of the WHI FFQ has been assessed for feasibility and reliability in a pre-WHI feasibility study of minority populations. The WHI FFQ was assessed in a WHI sub-study that included a diversity of race and ethnicity, including Hispanic women and those of Mexican ethnic descent [46, 47]. The rationale for selecting these diet quality indices was two-fold: 1) These are the most commonly used diet quality indices to examine the associations between diet quality and cardiometabolic disease in the US population (i.e., aMED, DASH, HEI-2010, MDS) and 2) higher scores for these indices indicate greater adherence to national recommendations for a diet high in fruits, vegetables, and dietary fiber, all of which have been previously associated with reduced risk of cardiometabolic disease [21, 33]. The traditional Mexican diet (MexD) score was included because previous analysis showed greater alignment to a traditional Mexican diet contributed to healthier cardiometabolic profiles among women of Mexican ethnic descent [43]. Diet quality total scores were derived based on self-reported dietary intake as reported on the FFQ at baseline and scored as previously described by others (Supplemental Table 1) [47].
2.3Anthropometrics and biomarkers assessments
At study entry, height, weight, waist and hip circumferences were measured during clinic visits using standardized protocols. Height and weight were used to calculate body mass index (BMI) and waist and hip circumferences to calculate waist-to-hip ratio, respectively. BMI categories were as follows: normal weight, BMI≥18.5–24.9; overweight, BMI ≥25.0–29.9; and obese, BMI≥30.0 kg/m2. As part of the Long Life Study follow-up visits, and using similar procedures as those at baseline, anthropometrics were measured in the home using standardized protocols. At baseline and follow-up visits, blood pressure was measured by certified staff with a mercury sphygmomanometer. Two measures were taken 30 seconds apart and the averaged value was recorded. Cuff bladder size was determined at each visit based on arm circumference [48].
At baseline and follow-up, fasting blood samples were collected and processed locally according to standardized protocols [49–51]. Briefly, at baseline, fasting blood samples were collected and processed locally. At follow-up during the WHI extension study II, the specimen collection procedures were repeated. Specimen were collected and centrifuged locally and shipped overnight to the Advanced Research and Diagnostic Laboratory at the University of Minnesota for processing, followed by shipment to the WHI Biorepository (Fisher BioServices, Rockville, Maryland) for storage until analyses.
We defined presence of metabolic syndrome (yes/no) at baseline and follow-up as defined by the metabolic syndrome classification [52], which requires that three or more of the following five criteria are met: 1) abdominal obesity (elevated waist circumference ≥88 cm for women); 2) elevated triglycerides (TG) ≥150 mg/dL; 3) reduced high-density lipoprotein (HDL) cholesterol (<50 mg/dL for women); 4) elevated blood pressure (systolic≥130 mm Hg, or diastolic≥85 mm Hg, or use of antihypertensive medications); and 5) elevated fasting blood glucose ≥100 mg/dL.
2.4Statistical analyses
Descriptive analyses were used to present baseline characteristics in numbers and percentages or mean±standard deviation, unless otherwise indicated. These included demographics, anthropometrics, acculturation proxy measure, smoking status, alcohol consumption, and physical activity at baseline. Then, we present baseline characteristics by presence of metabolic syndrome at follow-up (yes/no). Diet quality indices were grouped into tertiles and analyzed as categorical variables to examine the long-term associations between baseline diet quality scores and risk of metabolic syndrome and its individual components at follow-up. We first evaluated the long-term associations between baseline diet quality index scores by tertiles and presence of metabolic syndrome and its individual components at follow-up in multivariable linear regression models while adjusting for age, BMI, total energy intake (kcal), education level, acculturation proxy, physical activity, and individual components of metabolic syndrome at baseline, as applicable. Follow-up measures of individual components of metabolic syndrome (waist circumference, blood pressure, triglyceride, HDL cholesterol and fasting glucose levels) were analyzed as continuous variables and the presence of metabolic syndrome as categorical variable (yes or no).
Multivariable logistic regression models were used to calculate odds ratio for risk of metabolic syndrome and its individual components (yes/no) across diet quality score tertiles at follow-up. For this analysis, dichotomous outcome variables were created using the female-appropriate metabolic syndrome criteria for each individual component as follows: 1) waist circumference, ≥88 vs. <88 cm; 2) serum triglyceride, ≥150 vs. <150 mg/dL; 3) high-density lipoprotein (HDL) cholesterol levels, <50 mg/dL vs. ≥50; 4) blood pressure, systolic≥130 mm Hg, or diastolic≥85 mm Hg, or use of antihypertensive medications compared to systolic <130 mm Hg and diastolic <85 mm Hg; and 5) fasting blood glucose ≥100 vs. <100 mg/dL. Odds Ratio (OR) and 95% confidence interval (CI) were calculated for presence of metabolic syndrome (yes/no), abdominal obesity, elevated triglycerides, reduced HDL cholesterol, elevated blood pressure or use of antihypertensive medications, and elevated fasting blood glucose. Each category was compared across diet quality score tertiles (high, moderate, low) using the high tertile of diet quality total score (better quality diets) as reference value (high score tertile compared to moderate and low score tertiles). All logistic models were adjusted for age, BMI, total energy intake (kcal), education level, acculturation (preferred language), physical activity, and baseline values for individual components of the metabolic syndrome, as applicable. All statistical tests were two-sided with α= 0.05. We used SAS version 9.4 (SAS Institute, Cary, NC) for all analyses.
3Results
3.1Baseline characteristics
The mean baseline age was 58 years at baseline (Table 1). More than half of the women were overweight or obese at baseline, married or in a marriage-like relationship, reported having a college degree or annual household incomes of $35,000 or higher, and never having smoked. Most of them preferred English versus Spanish, which is a proxy measure of acculturation to the US lifestyle. On average, total scores for each of the diet quality indices were as follow: 4.2±1.7 (0–9 scores range) for the aMED, 25±4.7 (8–40 scores range) for the DASH, 59±11 (1–100 scores range) for the HEI-2010, 4.9±1.5 for the MDS (0–9 scores range), and 5.9±2 (0–12 scores range) for MexD (Supplemental Table 2).
Table 1
Baseline characteristics of postmenopausal women of Mexican ethnic descent and by presence of metabolic syndrome at follow-up (N = 334)1,2
| Baseline characteristics | Baseline (N = 334) | Presence of metabolic syndrome at follow-up | |
| No, 84% (n = 279) | Yes, 16% (n = 55) | ||
| Age, y | 58.6±6.38 | 58.8±6.45 | 58.0±6.03 |
| BMI, kg/m2 | 26.9±4.81 | 26.5±4.95b | 28.7±3.45a |
| BMI categories, % | |||
| Normal weight: BMI≥18.5–24.9, kg/m2 | 120 (36) | 42% a | 7% b |
| Overweight: BMI≥25.0–29.9, kg/m2 | 155 (47) | 43% | 65% |
| Obese: BMI≥30.0, kg/m2 | 57 (17) | 15% | 28% |
| Waist circumference, cm | 81.3±9.94 | 42% a | 7% b |
| Hip circumference, cm | 102±9.17 | 101±9.10b | 106±8.70a |
| Waist to hip ratio | 0.80±0.06 | 0.79±0.06b | 0.83±0.06a |
| Education level, % | |||
| ≤High school diploma | 97 (29) | 28% | 33% |
| ≥College degree | 236 (71) | 72% | 67% |
| Annual income, % | |||
| < $35,000 | 125 (38) | 38% | 43% |
| $35,000–$74,999 | 131 (40) | 38% | 48% |
| ≥$75,000 | 70 (22) | 24% | 9% |
| Marital status, % | |||
| Single, separated, or widowed | 102 (31) | 30% | 36% |
| Married or marriage-like relationship | 231 (69) | 70% | 64% |
| Preferred language, % | |||
| English | 318 (95) | 96% a | 89% b |
| Spanish | 16 (5) | 4% | 11% |
| Smoking status, % | |||
| Never | 231 (70) | 72% | 60% |
| Former | 86 (26) | 24% | 36% |
| Current | 14 (4) | 4% | 4% |
| Alcohol consumption, g/d | 3.84±8.79 | 4.21±9.39 | 1.97±4.27 |
| Physical activity, (MET)-h/wk | 12.5±14.0 | 13.3±14.5a | 8.88±10.6b |
1Values are presented as means±SDs unless otherwise indicated. 2Regression models were adjusted for age, education and acculturation (language preference). HDL, high-density lipoprotein; MET-h/wk, metabolic equivalent h/wk. a,bLabeled means in a row without a common letter differ in descending order (high to low values), using general linear models with Duncan’s multiple range test; P < 0.05.
3.2Presence of metabolic syndrome at follow-up
After excluding women with metabolic syndrome or diabetes mellitus at baseline (1993–1998), 16% (n = 55) of the study sample examined met the criteria for metabolic syndrome at follow-up (Table 1). As for individual components for metabolic syndrome, 40% met the criteria for elevated waist circumference (≥88 cm), 23% met the criteria for elevated TG (≥150 mg/dL) and fasting blood glucose (≥100 mg/dL), 21% met the criteria for elevated blood pressure (≥130/85 mm Hg), and 20% met the criteria for low HDL cholesterol (<50 mg/dL). There was no difference in education level, annual income or marital status by presence of metabolic syndrome. Women with metabolic syndrome at follow-up were less acculturated to the US, as measured by preferred language. We did not find differences in smoking status or alcohol consumption at baseline across presence of metabolic syndrome at follow-up. Finally, women who did not have metabolic syndrome at follow-up reported significantly higher levels of physical activity at baseline when compared to their counterparts.
3.3Long-term associations between diet quality at baseline and risk of metabolic syndrome at follow-up
We found no statistically significant difference in the presence of metabolic syndrome across diet quality score tertiles (Table 2). We found that women with diets more closely aligned with the DASH dietary pattern had significantly lower levels of fasting blood glucose compared to women in the moderate (P < 0.05) and low score (P < 0.05) tertiles. Waist circumference was significantly lower among women in the highest HEI-2010 score tertile, compared to women with moderate (P < 0.05) and low score (P < 0.05) tertiles. Similarly, serum triglycerides were significantly lower among women with higher HEI-2010 scores compared to women with moderate (P < 0.05) and low score (P < 0.05) tertiles. Conversely, HDL cholesterol levels were significantly higher among women with scores in the highest HEI-2010 score tertile compared to women with moderate (P < 0.05) and low score (P < 0.05) tertiles (P < 0.05). Fasting blood glucose was significantly lower among women with high DASH and HEI-2010 tertile scores compared to women with moderate (P < 0.05) and low score (P < 0.05) tertiles and for both diet quality indices. No differences were found for any of the metabolic syndrome individual components across the aMED, MDS or MexD score tertiles.
Table 2
Multivariate regression models for the associations between diet quality score tertiles and presence of metabolic syndrome and its individual components at follow-up among 334 postmenopausal women of Mexican ethnic descent1,2
| Metabolic syndrome individual components | |||||||
| Diet quality score tertiles | Metabolic syndrome | Waist circumference (cm) | Triglyceride (mg/dL) | HDL cholesterol (mg/dL) | Systolic BP (mm Hg) | Diastolic BP (mm Hg) | Blood glucose (mg/dL) |
| N (%) | Mean±SD | ||||||
| aMED score tertiles | |||||||
| High (5–9) (n = 146) | 22 (40) | 85.2±10.1 | 110±48.6 | 60.8±15.5 | 121±12.8 | 71.6±7.76 | 91.4±13.8 |
| Moderate (4) (n = 72) | 21 (22) | 87.3±10.3 | 120±47.1 | 61.1±14.5 | 123±12.1 | 72.2±7.62 | 93.3±15.0 |
| Low (0–3) (n = 116) | 21 (38) | 86.6±10.7 | 114±47.3 | 59.1±13.2 | 121±10.8 | 70.8±6.46 | 94.3±17.5 |
| DASH score tertiles | |||||||
| High (27–37) (n = 106) | 14 (25) | 85.2±10.3b | 111±50.3 | 62.6±16.6a | 121±13.4 | 71.0±8.00 | 90.0±13.2b |
| Moderate (23–26) (n = 111) | 18 (33) | 85.3±10.1b | 108±43.9 | 59.4±12.7b | 122±12.0 | 72.8±6.93 | 93.7±15.5a |
| Low (13–22) (n = 117) | 23 (42) | 88.0±10.5a | 122±48.4 | 59.0±13.9b | 120±10.5 | 70.6±6.85 | 95.1±16.9a |
| HEI-2010 score tertiles | |||||||
| High (>65–87) (n = 111) | 12 (22) | 83.9±10.4b | 103±45.5b | 63.9±16.2a | 120±13.0 | 70.4±7.54 | 89.5±13.4b |
| Moderate (54–65) (n = 112) | 19 (34) | 86.5±10.5a | 121±47.4a | 58.4±13.5b | 121±11.8 | 72.6±7.49 | 95.6±17.4a |
| Low (30–<54) (n = 111) | 24 (44) | 88.1±9.76a | 117±49.1a | 58.5±13.1b | 122±11.1 | 71.3±6.72 | 94.4±17.8a |
| MeDS score tertiles | |||||||
| High (6–9) (n = 124) | 17 (32) | 85.1±9.73 | 112±49.8 | 60.4±14.9 | 121±12.6 | 71.6±7.89 | 91.4±13.5 |
| Moderate (5) (n = 80) | 15 (27) | 86.2±9.84 | 115±49.4 | 60.8±16.6 | 122±11.1 | 72.0±7.06 | 93.9±16.2 |
| Low (2–4) (n = 130) | 23 (41) | 87.4±11.2 | 116±46.7 | 59.7±12.4 | 121±11.3 | 71.3±6.66 | 94.9±17.7 |
| MexD score tertiles | |||||||
| High (>7–12) (n = 112) | 22 (40) | 85.1±9.44 | 103±45.3 | 60.4±15.9 | 122±12.0 | 71.9±7.89 | 93.1±17.9 |
| Moderate (>5–7) (n = 111) | 15 (27) | 86.5±10.5 | 108±49.7 | 61.8±14.6 | 120±11.9 | 71.5±6.77 | 92.9±15.0 |
| Low (0–5) (n = 111) | 18 (33) | 87.1±11.0 | 121±47.6 | 58.5±12.3 | 121±11.3 | 71.4±6.99 | 94.1±14.8 |
1A high compared to low diet quality scores tertile would reflect lowest versus highest alignment to the dietary pattern. Values are presented as N (%) or means±SD, unless otherwise indicated. 2Multivariate regression models were adjusted for age (y), BMI, total energy intake (kcal/d), education level, acculturation (preferred language), physical activity, and baseline values for each metabolic syndrome individual component. a,bLabeled means in a row without a common letter differ in descending order (high to low values), using general linear models with Duncan’s multiple range test; P < 0.05. aMED, Alternate Mediterranean Diet; BP, blood pressure; DASH, Dietary Approaches to Stop Hypertension; HDL, high-density lipoprotein; HEI-2010, Healthy Eating Index; MDS, Mediterranean Diet Score; Mexican Diet (MexD).
3.4Odds ratios for risk of metabolic syndrome and its components at follow-up
Compared to women in the highest tertile (highest total scores as reference) for aMED, DASH, HEI-2010, MDS or MexD, we found no elevated risk for metabolic syndrome and for most of its individual components among women with moderate or low score tertiles (Table 3). For the MDS, women with moderate versus higher MDS scores had higher abdominal obesity [OR (95% CI): 2.59 (1.25, 5.37)], while there was no significant association when higher MDS scores were compared to the lowest tertile. Similarly for the MexD score, women with moderate versus higher MexD scores had lower probability of low HDL cholesterol [OR (95% CI): 0.36 (0.15, 0.87)], while there was no significant association when higher MexD scores were compared to the lowest tertile.
Table 3
Odds ratio for risk of metabolic syndrome and its individual components across diet quality score tertiles at follow-up among 334 postmenopausal women of Mexican ethnic descent1,2,3
| Metabolic syndrome individual components | ||||||
| Diet quality score tertiles | Metabolic syndrome | Abdominal obesity | Elevated triglyceride | Reduced HDL cholesterol | Elevated blood pressure | Elevated blood glucose |
| Odds ratio (95% CI) | ||||||
| aMED score tertiles | ||||||
| High (5–9) (n = 146) | 1.00 | 1.00 | 1.00 | 1.00 | 1.00 | 1.00 |
| (reference) | (reference) | (reference) | (reference) | (reference) | (reference) | |
| Moderate (4) (n = 72) | 1.12 | 1.30 | 1.10 | 0.91 | 1.44 | 1.40 |
| (0.49, 2.56) | (0.65, 2.59) | (0.50, 2.44) | (0.36, 2.30) | (0.70, 2.98) | (0.66, 2.95) | |
| Low (0–3) (n = 116) | 1.08 | 1.44 | 0.98 | 1.06 | 1.31 | 1.33 |
| (0.51, 2.31) | (0.75, 2.73) | (0.46, 2.09) | (0.46, 2.41) | (0.65, 2.63) | (0.65, 2.69) | |
| DASH score tertiles | ||||||
| High (27–37) (n = 106) | 1.00 | 1.00 | 1.00 | 1.00 | 1.00 | 1.00 |
| (reference) | (reference) | (reference) | (reference) | (reference) | (reference) | |
| Moderate (23–26) (n = 111) | 1.16 | 1.05 | 0.52 | 1.04 | 1.46 | 1.54 |
| (0.52, 2.60) | (0.54, 2.05) | (0.24, 1.14) | (0.43, 2.50) | (0.73, 2.91) | (0.73, 3.27) | |
| Low (13 –22) (n = 117) | 1.34 | 1.77 | 0.95 | 1.27 | 1.25 | 1.80 |
| (0.61, 2.95) | (0.91, 3.45) | (0.45, 2.01) | (0.53, 3.06) | (0.61, 2.58) | (0.86, 3.77) | |
| HEI-2010 score tertiles | ||||||
| High (>65–87) (n = 111) | 1.00 | 1.00 | 1.00 | 1.00 | 1.00 | 1.00 |
| (reference) | (reference) | (reference) | (reference) | (reference) | (reference) | |
| Moderate (54–65) (n = 112) | 1.43 | 1.49 | 1.08 | 1.72 | 1.01 | 1.79 |
| (0.63, 3.28) | (0.77, 2.90) | (0.50, 2.34) | (0.70, 4.23) | (0.48, 2.11) | (0.84, 3.80) | |
| Low (30–<54) (n = 111) | 1.76 | 1.44 | 0.97 | 1.48 | 1.68 | 1.83 |
| (0.78, 3.99) | (0.74, 2.81) | (0.44, 2.14) | (0.60, 3.69) | (0.82, 3.43) | (0.85, 3.91) | |
| MeDS score tertiles | ||||||
| High (6–9) (n = 124) | 1.00 | 1.00 | 1.00 | 1.00 | 1.00 | 1.00 |
| (reference) | (reference) | (reference) | (reference) | (reference) | (reference) | |
| Moderate (5) (n = 80) | 1.87 | 2.59 | 0.90 | 0.94 | 1.26 | 1.46 |
| (0.82, 4.27) | (1.25, 5.37) | (0.39, 2.06) | (0.38, 2.30) | (0.60, 2.66) | (0.66, 3.24) | |
| Low (2–4) (n = 130) | 1.38 | 1.80 | 1.18 | 1.40 | 1.23 | 1.67 |
| (0.64, 2.96) | (0.93, 3.46) | (0.57, 2.44) | (0.61, 3.19) | (0.62, 2.41) | (0.83, 3.34) | |
| MexD score tertiles | ||||||
| High (>7–12) (n = 112) | 1.00 | 1.00 | 1.00 | 1.00 | 1.00 | 1.00 |
| (reference) | (reference) | (reference) | (reference) | (reference) | (reference) | |
| Moderate (>5–7) (n = 111) | 0.53 | 1.49 | 1.21 | 0.36 | 0.53 | 1.41 |
| (0.24, 1.16) | (0.79, 2.81) | (0.56, 2.62) | (0.15, 0.87) | (0.26, 1.07) | (0.71, 2.83) | |
| Low (0–5) (n = 111) | 0.81 | 1.17 | 1.41 | 0.78 | 0.91 | 0.94 |
| (0.39, 1.70) | (0.60, 2.28) | (0.66, 3.01) | (0.34, 1.78) | (0.46, 1.79) | (0.45, 1.97) | |
1A high compared to low diet quality scores tertile would reflect lowest versus highest alignment to the dietary pattern. 2Presence of metabolic syndrome (yes/no) at follow-up as defined by having three or more of the following five criteria met: 1) abdominal obesity (elevated waist circumference (≥88 cm for women); 2) elevated triglyceride (≥150 mg/dL); 3) reduced HDL cholesterol (<50 mg/dL for women); 4) elevated blood pressure (systolic≥130 mm Hg, or diastolic≥85 mm Hg, or use of antihypertensive medications); and 5) elevated fasting blood glucose≥100 mg/dL. 3Logistic regression models were adjusted for age (y), BMI, total energy intake (kcal/d), education level, acculturation (preferred language), physical activity, and baseline values for each metabolic syndrome individual component. aMED, Alternate Mediterranean Diet; DASH, Dietary Approaches to Stop Hypertension; HDL, high-density lipoprotein; HEI-2010, Healthy Eating Index; MDS, Mediterranean Diet Score; Mexican Diet (MexD).
4Discussion
Diet quality assessed by four commonly used diet quality indices and one specific for traditional Mexican diets were not associated with risk of metabolic syndrome in postmenopausal women of Mexican ethnic descent. Nonetheless, being more aligned with the Dietary Guidelines for Americans (DGAs), as measured by HEI-2010 scores, was associated with lower waist circumference, triglyceride and blood glucose levels at follow-up. Higher HEI-2010 scores were also associated with higher HDL cholesterol at follow-up. Similarly, higher DASH scores were associated with lower waist circumference and glucose levels, and higher HDL cholesterol at follow-up.
To our knowledge, this is one of few studies evaluating the long-term associations between diet quality and risk of metabolic syndrome among Hispanics of Mexican ethnic descent in the US, and the first to evaluate these associations focusing on older women of Mexican ethnic descent. Fewer data are available for following dietary recommendations as measured by a priori diet quality indices compared to posteriori cohort-derived dietary patterns and risk of cardiometabolic disease [53]. Although most of the data available on the associations between diet quality and risk of metabolic syndrome comes from cross-sectional studies [36], there is a growing number of prospective studies that have focused on the associations between cohort-derived dietary patterns and risk of metabolic syndrome [54]. Prospective studies that have evaluated the long-term associations between a priori diet quality indices and chronic disease have focused on risk of CVD, T2D, and cancer [14, 24, 55–57].
We previously reported that among older women of Mexican ethnic descent who participated in the Women’s Health Initiative (WHI), greater alignment to a traditional Mexican diet, as measured by a traditional MexD score, was associated with reduced biomarkers of cardiometabolic disease [51]. Further, in a randomized crossover feeding trial among healthy women of Mexican ethnic descent, we found that, compared to a commonly consumed US diet, a traditional Mexican diet also reduced biomarkers of cardiometabolic disease [42].
A cross-sectional study among a larger population of Mexican adults living in Mexico (n = 5,240) reported similar results on higher odds for high fasting blood glucose and low serum HDL cholesterol levels among those adhering to a cohort-derived “Western” dietary pattern low in fruits, vegetables and whole grains [12]. In a large ethnically diverse population of Hispanic/Latino population in the US (n = 12,406), diet quality as measured by the Alternate Healthy Eating Index (AHEI) was associated with lower odds of metabolic syndrome, although the results are from cross-sectional analyses [58]. However, in this analysis, the results showed significant interactions by ethnicity, such that lower odds of metabolic syndrome were reported for Mexican Americans and Central Americans compared to Puerto Ricans, Cubans, Dominicans and South Americans. In non-Mexican populations, clearer associations between diet quality and risk of metabolic syndrome have been reported for those adhering to the Mediterranean diet [18].
Within the WHI, long-term associations between a priori diet quality indices [59] and cohort-derived dietary patterns [57] consistently show a relationship between following a “healthy” or “prudent” dietary pattern and lower risk of chronic disease, T2D, and overall mortality risk. Similarly, in the Multiethnic Cohort Study, which includes a large sample (>166,000) of White, African American, Native Hawaiian, Japanese American, and Latino individuals, the health benefits of adhering to “healthy” dietary patterns as assessed by diet quality indices have been demonstrated in several observational studies. Specifically, alignment with the AHEI, aMED and DASH dietary patterns were associated with reduced risk of T2D and reduced levels of biomarkers of cardiometabolic risk; [24] while other studies have also demonstrated the health benefits of following “healthy” dietary patterns and reduced risk of CVD, cancer, overall mortality and cancer-specific mortality [14, 23, 59]. Nonetheless, most of these studies have focused on non-Hispanic White populations.
Our results from this observational prospective study highlight the potential health benefits of following “healthy” dietary patterns. One good example of this benefit can be seen in results from the WHI Dietary Modification Trial. Women randomized to intervention arm and more closely adherent to the assigned low-fat dietary pattern were found to have overall lower risk of metabolic syndrome over time and reported lower use of hypertension and cholesterol-lowering medications [20]. Moreover, our main findings for alignment to either the HEI-2010 or DASH dietary patterns, which may help maintain lower waist circumference and higher HDL cholesterol levels, are of importance given that recent reports have highlighted waist circumference as the most noticeable component driving the continued increase in rates of obesity in the US, followed by low HDL cholesterol levels [3, 4, 7].
Strengths of our study include the prospective design evaluating the long-term associations between diet quality and risk of metabolic syndrome in a population with the highest prevalence of metabolic syndrome in the US [3]. Second, the WHI is a comprehensive and well characterized cohort with one of the largest cohorts of older women in the US, which provides an excellent resource to continue to identify pockets of the population for targeted behavioral interventions that aim to improve overall health and reduce risk of chronic disease.
Limitations of our study include the relatively small sample size that could have prevented us from finding statistically significant associations between the diet quality indices examined and risk of metabolic syndrome after excluding women with metabolic syndrome and diabetes mellitus at baseline (38% of the sample). Nonetheless, we demonstrated associations between alignment to the HEI-2010 and DASH with individual components of the metabolic syndrome in a fairly acculturated sample of postmenopausal women of Mexican descent. Second, the use of one-time self-reported dietary intake at baseline is a limitation on its own as it is subject to random and systematic errors that may have led to imprecise estimates of long-term dietary exposure. However, the reliability of our validated FFQ has been previously demonstrated, across education levels and race/ethnicity, including Hispanic women and those of Mexican descent [46, 47], and likely assessed typical intake comprehensively. In any case, the validation studies using WHI diet data against biomarkers of nutrient intake [60, 61], that we have published, support the appropriateness of our methods. These analyses have showed that measurement error is most recognized for energy and less is known about the extent of measurement error for diet quality scores as examined here. Despite this, caution should be used when interpreting our attenuated findings as other nutrients or foods that were not included here (e.g., phytochemicals) may have speculative influence on cardiometabolic risk factors.
Another important aspect to consider is that women evaluated here were more acculturated to the US, as measured by language preference (95% preferred English vs. Spanish), and had high levels of education (≥72% had college degree or higher). Larger observational studies among women of Mexican ethnic descent with a more diverse distribution in acculturation and education levels are needed to tease out whether acculturation plays an important role in adhering to national dietary recommendations and the subsequent risk of cardiometabolic disease [40].
In conclusion, our analyses suggest current national dietary recommendations (i.e., HEI-2010 or DASH) to adhere to diets high in fruits, vegetables and whole grains and low in solid fats, refined grains and added sugars, can help reduce levels of specific individual components of metabolic syndrome among women of Mexican ethnic descent. Future studies should focus on targeted interventions among older women of Mexican ethnic descent to help increase alignment to national dietary recommendations and therefore, reduce risk of elements of metabolic syndrome in this population.
Sources of support
The Women’s Health Initiative is funded by the National Heart, Lung, and Blood Institute, NIH, US Department of Health and Human Services through contracts HHSN268201100046C, HHSN268201100001C, HHSN268201100002C, HHSN268201100003C, HHSN268201100004C, and HHSN271201100004C.
Acknowlegments and statements of author’s contributions to manuscript
The members of the WHI Investigators group are: Program
Office: (National Heart, Lung, and Blood Institute, Bethesda, MD) Jacques Rossouw, Shari Ludlam, Dale Burwen, Joan McGowan, Leslie Ford, and Nancy Geller; Clinical Coordinating Center (Fred Hutch, Seattle, WA) Garnet Anderson, Ross Prentice, Andrea LaCroix, and Charles Kooperberg; Investigators and Academic Centers: (Brigham and Women’s Hospital, Harvard Medical School, Boston, MA) JoAnn E Manson; (MedStar Health Research Institute/Howard University, Washington, DC) Barbara V Howard; (Stanford Prevention Research Center, Stanford, CA) Marcia L Stefanick; (The Ohio State University, Columbus, OH) Rebecca Jackson; (University of Arizona, Tucson/Phoenix, AZ) Cynthia A Thomson; (University of Buffalo, Buffalo, NY)
Jean Wactawski-Wende; (University of Florida, Gainesville/Jacksonville, FL) Marian Limacher; (University of Iowa, Iowa City/Davenport, IA) Robert Wallace; (University of Pittsburgh, Pittsburgh, PA) Lewis Kuller; (Wake Forest University School of Medicine, Winston-Salem, NC) Sally Shumaker; Women’s Health Initiative Memory Study: (Wake Forest University School of Medicine, Winston-Salem, NC) Sally Shumaker.
MS-T, LFT, JWL, and MLN designed the research; MS-T analyzed data and wrote the manuscript; ZS contributed to the statistical analysis; MS-T and MLN had primary responsibility for final content. All authors read, critically reviewed, and approved the final manuscript. All authors declare no conflict of interest.
Supplementary material
[1] The supplementary material is available in the electronic version of this article: https://dx.doi.org/10.3233/NHA-190076.
References
[1] | Malik S , Wong ND , Franklin SS , Kamath TV , L’Italien GJ , Pio JR , Williams GR . Impact of the metabolic syndrome on mortality from coronary heart disease, cardiovascular disease, and all causes in United States adults. Circulation. (2004) ;110: (10):1245–50. |
[2] | Osborn MF , Miller CC , Badr A , Zhang J . Metabolic Syndrome Associated with Ischemic Stroke among the Mexican Hispanic Population in the El Paso/US-Mexico Border Region. J Stroke Cerebrovasc. (2014) ;23: (6):1477–84. |
[3] | Moore JX , Chaudhary N , Akinyemiju T . Metabolic Syndrome Prevalence by Race/Ethnicity and Sex in the United States, National Health and Nutrition Examination Survey, 1988-2012. Prev Chronic Dis. 2017;14. |
[4] | Shin D , Kongpakpaisarn K , Bohra C . Trends in the prevalence of metabolic syndrome and its components in the United States 2007-2014. Int J Cardiol. (2018) ;259: :216–9. |
[5] | Aguilar M , Bhuket T , Torres S , Liu B , Wong RJ . Prevalence of the Metabolic Syndrome in the United States, 2003-2012. JAMA. (2015) ;313: (19):1973–4. |
[6] | Mozumdar A , Liguori G . Persistent Increase of Prevalence of Metabolic Syndrome Among US Adults: NHANES III to NHANES 1999-2006. Diabetes Care. (2011) ;34: (1):216–9. |
[7] | Heiss G , Snyder ML , Teng YP , Schneiderman N , Llabre MM , Cowie C , Carnethon M , Kaplan R , Giachello A , Gallo L , Loehr L , Aviles-Santa L . Prevalence of Metabolic Syndrome Among Hispanics/Latinos of Diverse Background: The Hispanic Community Health Study/Study of Latinos. Diabetes Care. (2014) ;37: (8):2391–9. |
[8] | Sweazea KL . Compounding evidence implicating Western diets in the development of metabolic syndrome. Acta Physiol. (2014) ;211: (3):471–3. |
[9] | Suliga E , Koziel D , Ciesla E , Gluszek S . Association between dietary patterns and metabolic syndrome in individuals with normal weight: a cross-sectional study. Nutr J. 2015;14. |
[10] | Barbaresko J , Siegert S , Koch M , Aits I , Lieb W , Nikolaus S , Laudes M , Jacobs G , Nothlings U . Comparison of two exploratory dietary patterns in association with the metabolic syndrome in a Northern German population. Brit J Nutr. (2014) ;112: (8):1364–72. |
[11] | Calton EK , James AP , Pannu PK , Soares MJ . Certain dietary patterns are beneficial for the metabolic syndrome: reviewing the evidence. Nutr Res. (2014) ;34: (7):559–68. |
[12] | Denova-Gutierrez E , Castanon S , Talavera JO , Gallegos-Carrillo K , Flores M , Dosarnantes-Carrasco D , Willett WC , Salmeron J . Dietary Patterns Are Associated with Metabolic Syndrome in an Urban Mexican Population. J Nutr. (2010) ;140: (10):1855–63. |
[13] | Kimokoti RW , Gona P , Zhu L , Newby K , Millen BE , Brown LS , D’Agostino RB , Fung TT . Dietary patterns of women, abdominal obesity, and metabolic syndrome: The Framingham Nutrition Studies. J Womens Health. (2012) ;21: (4):29. |
[14] | Pimenta AM , Toledo E , Rodriguez-Diez MC , Gea A , Lopez-Iracheta R , Shivappa N , Hebert JR , Martinez-Gonzalez MA . Dietary indexes, food patterns and incidence of metabolic syndrome in a Mediterranean cohort: The SUN project. Clin Nutr. (2015) ;34: (3):508–14. |
[15] | Rizzo N , Sabate J . Dietary Patterns and Their Association with the Metabolic Syndrome and Its Component Risk Factors. Ann Nutr Metab. (2013) ;63: :1349. |
[16] | Wagner A , Dallongeville J , Haas B , Ruidavets JB , Amouyel P , Ferrieres J , Simon C , Arveiler D . Sedentary behaviour, physical activity and dietary patterns are independently associated with the metabolic syndrome. Diabetes Metab. (2012) ;38: (5):428–35. |
[17] | Babio N , Bullo M , Salas-Salvado J . Mediterranean diet and metabolic syndrome: the evidence. Public Health Nutr. (2009) ;12: (9a):1607–17. |
[18] | Salas-Salvado J , Guasch-Ferre M , Lee CH , Estruch R , Clish CB , Ros E . Protective Effects of the Mediterranean Diet on Type 2 Diabetes and Metabolic Syndrome. J Nutr. (2016) ;146: (4):920s–7s. |
[19] | Mattei J , Sotres-Alvarez D , Daviglus M , Gallo L , Gellman M , Hooshmand S , Hu F , Tucker K , Willett W , Siega-Riz AM , Van Horn L , Kaplan R . The Alternate Healthy Eating Index is Associated with the Metabolic Syndrome in Latino Adults: Results from the Hispanic Community Health Study/Study of Latinos (HCHS/SOL). Faseb J. 2015;29. |
[20] | Neuhouser ML , Howard B , Lu JM , Tinker LF , Van Horn L , Caan B , Rohan T , Stefanick ML , Thomson CA . A low-fat dietary pattern and risk of metabolic syndrome in postmenopausal women: The Women’s Health Initiative. Metabolism. (2012) ;61: (11):1572–81. |
[21] | Schulze MB , Hu FB . Dietary approaches to prevent the metabolic syndrome - Quality versus quantity of carbohydrates. Diabetes Care. (2004) ;27: (2):613–4. |
[22] | Silva TR , Alves BC , Maturana MA , Spritzer PM . Healthier Dietary Pattern and Lower Risk of Metabolic Syndrome in Physically Active Postmenopausal Women. J Am Coll Nutr. (2013) ;32: (5):287–95. |
[23] | Harmon BE , Boushey CJ , Shvetsov YB , Ettienne R , Reedy J , Wilkens LR , Le Marchand L , Henderson BE , Kolonel LN . Associations of key diet-quality indexes with mortality in the Multiethnic Cohort: the Dietary Patterns Methods Project. Am J Clin Nutr. (2015) ;101: (3):587–97. |
[24] | Jacobs S , Boushey CJ , Franke AA , Shvetsov YB , Monroe KR , Haiman CA , Kolonel LN , Le Marchand L , Maskarinec G . A priori-defined diet quality indices, biomarkers and risk for type 2 diabetes in five ethnic groups: the Multiethnic Cohort. Br J Nutr. (2017) ;118: (4):312–20. |
[25] | Hodge AM , Bassett JK , Dugue PA , Shivappa N , Hebert JR , Milne RL , English DR , Giles GG . Dietary inflammatory index or Mediterranean diet score as risk factors for total and cardiovascular mortality. Nutr Metab Cardiovas. (2018) ;28: (5):461–9. |
[26] | Trichopoulou A , Costacou T , Bamia C , Trichopoulos D . Adherence to a Mediterranean diet and survival in a Greek population. New Engl J Med. (2003) ;348: (26):2599–608. |
[27] | Esposito K , Maiorino MI , Bellastella G , Panagiotakos DB , Giugliano D . Mediterranean diet for type 2 diabetes: cardiometabolic benefits. Endocrine. (2017) ;56: (1):27–32. |
[28] | Kontou N , Psatopouou T , Panagiotakos D , Dimopouos MA , Linos A . The Mediterranean Diet in Cancer Prevention: A Review. J Med Food. (2011) ;14: (10):1065–78. |
[29] | Babio N , Bullo M , Salas-Salvado J . Mediterranean diet and metabolic syndrome: the evidence. Public Health Nutr. (2009) ;12: (9a):1607–17. |
[30] | Fung TT , Chiuve SE , McCullough ML , Rexrode KM , Logroscino G , Hu FB . Adherence to a DASH-Style diet and risk of coronary heart disease and stroke in women. Arch Intern Med. (2008) ;168: (7):713–20. |
[31] | Guenther PM , Casavale KO , Reedy J , Kirkpatrick SI , Hiza HAB , Kuczynski KJ , Kahle LL , Krebs-Smith SM . Update of the Healthy Eating Index: HEI-2010. J Acad Nutr Diet. (2013) ;113: (4):569–80. |
[32] | Perez-Cornago A , Zulet MA , Martinez JA . Association between mood and diet quality in subjects with metabolic syndrome participating in a behavioural weight-loss programme: a cross-sectional assessment. Nutr Neurosci. (2015) ;18: (3):137–44. |
[33] | Nazare JA , Smith J , Borel AL , Almeras N , Tremblay A , Bergeron J , Poirier P , Despres JP . Changes in both global diet quality and physical activity level synergistically reduce visceral adiposity in men with features of metabolic syndrome. J Nutr. (2013) ;143: (7):1074–83. |
[34] | Yosaee S , Esteghamati A , Nazari Nasab M , Khosravi A , Alinavaz M , Hosseini B , Djafarian K . Diet quality in obese/overweight individuals with/without metabolic syndrome compared to normal weight controls. Med J Islam Repub Iran. (2016) ;30: :376. |
[35] | Lavigne-Robichaud M , Moubarac JC , Lantagne-Lopez S , Johnson-Down L , Batal M , Laouan Sidi EA , Lucas M . Diet quality indices in relation to metabolic syndrome in an Indigenous Cree (Eeyouch) population in northern Quebec, Canada. Public Health Nutr. (2018) ;21: (1):172–80. |
[36] | Rodriguez-Monforte M , Sanchez E , Barrio F , Costa B , Flores-Mateo G . Metabolic syndrome and dietary patterns: a systematic review and meta-analysis of observational studies. Eur J Nutr. (2017) ;56: (3):925–47. |
[37] | Batis C , Hernandez-Barrera L , Barquera S , Rivera JA , Popkin BM . Food Acculturation Drives Dietary Differences among Mexicans, Mexican Americans, and Non-Hispanic Whites. J Nutr. (2011) ;141: (10):1898–906. |
[38] | Carrera PM , Gao XA , Tucker KL . A study of dietary patterns in the Mexican-American population and their association with obesity. J Am Diet Assoc. (2007) ;107: (10):1735–42. |
[39] | Duffey KJ , Gordon-Larsen P , Ayala GX , Popkin BM . Birthplace Is Associated with More Adverse Dietary Profiles for US-Born Than for Foreign-Born Latino Adults. J Nutr. (2008) ;138: (12):2428–35. |
[40] | Montez JK , Eschbach K . Country of birth and language are uniquely associated with intakes of fat, fiber, and fruits and vegetables among Mexican-American women in the United States. J Am Diet Assoc. (2008) ;108: (3):473–80. |
[41] | Murtaugh MA , Sweeney C , Giuliano AR , Herrick JS , Hines L , Byers T , Baumgartner KB , Slattery ML . Diet patterns and breast cancer risk in Hispanic and non-Hispanic white women: the Four-Corners Breast Cancer Study. Am J Clin Nutr. (2008) ;87: (4):978–84. |
[42] | Santiago-Torres M , Kratz M , Lampe JW , Tapsoba JD , Breymeyer KL , Levy L , Villasenor A , Wang CY , Song XL , Neuhouser ML . Metabolic responses to a traditional Mexican diet compared with a commonly consumed US diet in women of Mexican descent: a randomized crossover feeding trial. American Journal of Clinical Nutrition. (2016) ;103: (2):366–74. |
[43] | Santiago-Torres M , Tinker LF , Allison MA , Breymeyer KL , Garcia L , Kroenke CH , Lampe JW , Shikany JM , Van Horn L , Neuhouser ML . Development and Use of a Traditional Mexican Diet Score in Relation to Systemic Inflammation and Insulin Resistance among Women of Mexican Descent. J Nutr. (2015) ;145: (12):2732–40. |
[44] | Design of the Women’s Health Initiative clinical trial and observational study. The Women’s Health Initiative Study Group. Control Clin Trials. (1998) ;19: (1):61–109. |
[45] | Langer RD , White E , Lewis CE , Kotchen JM , Hendrix SL , Trevisan M . The Women’s Health Initiative Observational Study: baseline characteristics of participants and reliability of baseline measures. Ann Epidemiol. (2003) ;13: (9 Suppl):S107–21. |
[46] | Kristal AR , Feng ZD , Coates RJ , Oberman A , George V . Associations of race/ethnicity, education, and dietary intervention with the validity and reliability of a food frequency questionnaire - The women’s health trial feasibility study in minority populations. Am J Epidemiol. (1997) ;146: (10):856–69. |
[47] | Patterson RE , Kristal AR , Tinker LF , Carter RA , Bolton MP , Agurs-Collins T . Measurement characteristics of the Women’s Health Initiative food frequency questionnaire. Ann Epidemiol. (1999) ;9: (3):178–87. |
[48] | Hsia J , Margolis KL , Eaton CB , Wenger NK , Allison M , Wu LL , LaCroix AZ , Black HR . Prehypertension and cardiovascular disease risk in the women’s health initiative. Circulation. (2007) ;115: (7):855–60. |
[49] | Song Y , Manson JE , Tinker L , Howard BV , Kuller LH , Nathan L , Rifai N , Liu S . Insulin sensitivity and insulin secretion determined by homeostasis model assessment and risk of diabetes in a multiethnic cohort of women: the Women’s Health Initiative Observational Study. Diabetes Care. (2007) ;30: (7):1747–52. |
[50] | Ma YS , Hebert JR , Li WJ , Bertone-Johnson ER , Olendzki B , Pagoto SL , Tinker L , Rosal MC , Ockene IS , Ockene JK , Griffith JA , Liu SM . Association between dietary fiber and markers of systemic inflammation in the Women’s Health Initiative Observational Study. Nutrition. (2008) ;24: (10):941–9. |
[51] | Santiago-Torres M , Tinker LF , Allison MA , Breymeyer KL , Garcia L , Kroenke CH , Lampe JW , Shikany JM , Van Horn L , Neuhouser ML . Development and Use of a Traditional Mexican Diet Score in Relation to Systemic Inflammation and Insulin Resistance among Women of Mexican Descent. J Nutr. (2015) ;145: (12):2732–40. |
[52] | Grundy SM , Cleeman JI , Daniels SR , Donato KA , Eckel RH , Franklin BA , Gordon DJ , Krauss RM , Savage PJ , Smith SC Jr , Spertus JA , Fernando C . Diagnosis and management of the metabolic syndrome: an American Heart Association/National Heart, Lung, and Blood Institute scientific statement: Executive Summary. Crit Pathw Cardiol. (2005) ;4: (4):198–203. |
[53] | Rodriguez-Monforte M , Sanchez E , Barrio F , Costa B , Flores-Mateo G . Metabolic syndrome and dietary patterns: a systematic review and meta-analysis of observational studies. European Journal of Nutrition. (2017) ;56: (3):925–47. |
[54] | Hosseini Z , Whiting SJ , Vatanparast H . Current evidence on the association of the metabolic syndrome and dietary patterns in a global perspective. Nutr Res Rev. (2016) ;29: (2):152–62. |
[55] | Schwingshackl L , Hoffmann G . Diet Quality as Assessed by the Healthy Eating Index, the Alternate Healthy Eating Index, the Dietary Approaches to Stop Hypertension Score, and Health Outcomes: A Systematic Review and Meta-Analysis of Cohort Studies. J Acad Nutr Diet. (2015) ;115: (5):780–U268. |
[56] | Nicklas TA , O’Neil CE , Fulgoni VL . Diet Quality Is Inversely Related to Cardiovascular Risk Factors in Adults. J Nutr. (2012) ;142: (12):2112–8. |
[57] | Cespedes EM , Hu FB , Tinker L , Rosner B , Redline S , Garcia L , Hingle M , Van Horn L , Howard BV , Levitan EB , Li W , Manson JE , Phillips LS , Rhee JJ , Waring ME , Neuhouser ML . Multiple Healthful Dietary Patterns and Type 2 Diabetes in the Women’s Health Initiative. Am J Epidemiol. (2016) ;183: (7):622–33. |
[58] | Mattei J , Sotres-Alvarez D , Daviglus ML , Gallo LC , Gellman M , Hu FB , Tucker KL , Willett WC , Siega-Riz AM , Van Horn L , Kaplan RC . Diet Quality and Its Association with Cardiometabolic Risk Factors Vary by Hispanic and Latino Ethnic Background in the Hispanic Community Health Study/Study of Latinos. Journal of Nutrition. (2016) ;146: (10):2035–44. |
[59] | George SM , Ballard-Barbash R , Manson JE , Reedy J , Shikany JM , Subar AF , Tinker LF , Vitolins M , Neuhouser ML . Comparing Indices of Diet Quality With Chronic Disease Mortality Risk in Postmenopausal Women in the Women’s Health Initiative Observational Study: Evidence to Inform National Dietary Guidance. Am J Epidemiol. (2014) ;180: (6):616–25. |
[60] | Prentice RL , Mossavar-Rahmani Y , Huang Y , Van Horn L , Beresford SAA , Caan B , Tinker L , Schoeller D , Bingham S , Eaton CB , Thomson C , Johnson KC , Ockene J , Sarto G , Heiss G , Neuhouser ML . Evaluation and Comparison of Food Records, Recalls, and Frequencies for Energy and Protein Assessment by Using Recovery Biomarkers. American Journal of Epidemiology. (2011) ;174: (5):591–603. |
[61] | Prentice RL , Tinker LF , Huang Y , Neuhouser ML . Calibration of Self-Reported Dietary Measures Using Biomarkers: An Approach to Enhancing Nutritional Epidemiology Reliability. Curr Atheroscler Rep. (2013) ;15: (9). |


