
Characterization of the nutrient profile of processed red raspberries for use in nutrition labeling and promoting healthy food choices
Abstract
BACKGROUND:
Red raspberries (Rubus idaeus L.) contain varied nutrients and phytochemicals important for healthy aging. Processing berries extends their shelf-life and culinary applications, although information on nutritional content among processed forms are limited.
OBJECTIVE:
The main objective of the project was to conduct a market basket study to characterize nutrient content and variation in processed red raspberry (RRB) products (i.e., individually quick frozen (IQF), purée, concentrates). Secondary objectives were to provide new data to the USDA nutrient composition database on processed RRB, which is now complete, and to evaluate RRB forms relative to regulatory (US FDA) criteria for food labeling based on Dietary Reference Intake (DRI) recommendations expressed as % Daily Values (DV).
METHODS:
Processed raspberry product samples were obtained in 2017 from retail outlets, processing plants and distributors, in and outside the USA. Samples were analyzed by pre-qualified laboratories using pre-approved AOAC methods and validated HPLC methods.
RESULTS:
Nutrient variance in domestic compared to imported product was observed, but on average IQF and purée with seeds are excellent sources of dietary fiber based on FDA criteria of providing ≥20% DV, IQF and purée are good (10–19% DV) sources of copper, thiamin, riboflavin and folate, and all forms were excellent or good sources of vitamin C and manganese. IQF and puréed red raspberries may also be considered a valuable fruit source of lutein/zeaxanthin.
CONCLUSIONS:
Processed RRB are nutrient rich options for including in a diet for healthy aging.
1Introduction
Consuming a diet rich in fruits and vegetables is associated with a reduced risk of a number ofnon-communicable age- and lifestyle- related diseases, including cardiovascular disease (CVD), type 2 diabetes mellitus (T2DM), Alzheimer’s disease, cancers, among others [1]. The underlying mechanisms continue to be intensely studied; however, physiological effects appear to be through risk factor reduction by maintaining or reestablishing “normal” cellular and tissue function. Both essential and non-essential phytochemical (bioactive) components of fruits and vegetables have a role to play; and accordingly, greater emphasis has been placed on characterization of foods and beverages for their nutrient and phytochemical components.
The USDA National Nutrient Database for Standard Reference (SR) has served as one of the most widely used public resources for nutrient information on ingredients, foods, and beverages [2]. The database has been used globally by the food industry to formulate products, practitioners to develop dietary plans and educate consumers, and scientists to design research trials. SR also served as the source of nutrient data for the Food and Nutrient Database for Dietary Studies that is used for nutrient intake analyses of What We Eat in America, the dietary intake component of the National Health and Nutrition Examination Survey. SR contains about 7800 food items and up to 146 nutrients and food components. The food composition data are derived from USDA contracted analyses, the food industry, and the scientific literature. The last version of SR was released in mid-2018 as SR, Legacy (2018) (https://www.ars.usda.gov/ARSUserFiles/80400525/Data/SR-Legacy/SR-Legacy_Doc.pdf) Recently, SR legacy was released along with other USDA food composition databases as part of USDA FoodData Central.
Red raspberries are increasingly appreciated for their culinary versatility and use in product applications. Increased use may reflect, at least in part, increasing consumer interest in health and wellness and the role red raspberries may play in reducing risk factors associated with developing disease [1]. Red raspberries contain varied essential nutrients and phytochemicals; however different cultivars, processing, storage time, can influence nutrient values. Whole red raspberries for example, differ by variety depending if they are grown and harvested for fresh market or for the frozen market. Overall, cultivars for processing are different than those for fresh [3]. Likewise, processing may influence raspberry nutrient composition. The main forms of processed red raspberries available are individually quick frozen (IQF) (sweetened or unsweetened), juice concentrates (single or concentrated strengths) and purée (seeded or seedless). Fruit grown in different regions of the world and imported to the USA may also impart variance in nutritional content. Prior to this research, nutritional data on fresh red raspberries was available, but data for processed red raspberries in the marketplace was not available. Therefore, the main purpose of this research was to conduct a market basket study to analyze the nutrient content of processed red raspberries common in the marketplace in USA and make the data publicly available in the USDA nutrient database. Secondary objectives were to assess differences in nutrients across product forms (i.e., IQF, purée, concentrate), including the influence of source (domestic vs. import) on select nutrients, such as fiber, vitamin C and lutein/zeaxanthin. To assess nutritional contribution to a healthy diet, nutrients were also analyzed relative to criteria for food labeling in the USA based on Dietary Reference Intake (DRI) recommendations expressed as % Daily Values (DV).
2Methods
2.1Sample collection and preparation
Sample collection and preparation for the present study used methods similar to those utilized by the National Food and Nutrient Analysis Program (NFNAP), an inter-agency analytical program led by Nutrient Data Laboratory, USDA, which was designed in 1997 to develop robust and nationally representative estimates of the mean nutrient content of foods in the food supply and improve the quality of food composition data by expanding the analytical basis of data in the USDA’s National Nutrient Databank [4]. The sampling plan within this program guides national collection of food samples from retail outlets for nutrient analysis. A detailed history and applications of the sampling approach can be reviewed in earlier publications [4–7].
Sampling plan for IQF: The sampling plan was based on the NFNAP protocol, which is a stratified three-stage design using the most current population density data from the US Bureau of the Census and food sales data for retail outlets in selected locations and product market shares, both from ACNielsen, Inc [8]. The sampling plan uses data on population density, retail outlets sales, and specific brands representing market share data so that any county, store, or brand in these three selection levels has a chance of being selected. The greater the proportion to the total, the greater the probability of being selected [8]. In the present study, we were unable to obtain samples for the 2 top national brands from most locations, but private-label brands were sampled from all 12 locations, resulting in 15 retail samples. These were supplemented with 3 samples from processors. Many of these samples were imported from multiple locations around the world, but are consumed in the USA. In the case of raspberries, production in the USA ranges from year to year, but in general is between 30–40% market share and the rest is imported from around the world including Chile, Mexico, Serbia, Poland, Canada, and China. The domestic (USA) and import quantity of red raspberries are presented in Table 1 [9]. Given the different growing regions, there are also different varieties represented, along with different cultivation practices, climates, and processing plans that may influence nutrient content. To account for this additional variance, each nutrient was weighted by the import and domestic market share of each frozen raspberry sample. In most cases, 1-2 samples of the same brand were combined into composites and then analyzed.
Table 1
Domestic and import market share of IQF, purée with seeds, purée seedless and juice concentrate1
| IQF | Purée with Seeds | Purée Seedless | Juice Concentrate | |
| Domestic | 38% | 88% | 100% | 83% |
| Import | 62% | 12% | 0 | 17% |
1Information provided by the National Processed Raspberry Council, Lynden, Washington.
Sampling plan for other processed products (purée, concentrates): purée and juice concentrates are not retail products. Therefore, samples were provided by processors and distributors through the National Processed Raspberry Council (Table 1).
Purchasing, Storage, Analysis: A Nutrient Data Laboratory-directed professional product-purchasing company purchased sample units of each of the major brands and shipped it under optimum conditions [5] to the Food Analysis Laboratory Control Center at Virginia Tech (Blacksburg, VA). The scientists at Virginia Tech processed and prepared the samples for chemical analyses. The composites were then shipped to pre-certified commercial and university laboratories for chemical analyses of nutrients.
2.2Nutrient analysis
Samples were analyzed to develop a full nutrient profile comprising proximates, minerals, vitamins, fatty acids, and amino acids. Analytical methods used for nutrients are available in the SR documentation [10]. In brief, moisture content, protein, total lipid, ash, total dietary fiber of the processed red raspberries were determined according to AOAC methods 964.22, 991.20, 989.05, 945.46, and 991.43, respectively. The carbohydrate content was calculated by difference. The gross energy content was calculated using the Atwater’s conversion factors; 3.36 kcal/g for protein content, 8.37 kcal/g for fat content and 3.75 kcal/g for carbohydrate content. The starch, sugars, organic acids and fatty acids were determined according to AOAC methods 979.10, 982.14, 986.13 and 996.06, respectively. Minerals content analysis was determined according to AOAC by modifying methods 985.01 and 984.27. Thiamine, riboflavin, pantothenic acid, vitamin B6 were determined according to AOAC methods, 942.23, 970.65, 945.74 and 961.15. Niacin and folic acid were determined by modifying AOAC methods 944.13 and 992.15.
Carotenoids, vitamin C and tocopherols/tocotrienals were determined according to validated high pressure liquid chromatography (HPLC) methods [11–14]. Carotenoids content was determined using reversed-phase HPLC coupled with diode-array detector according to Craft et al. [11]. Vitamin C content was extracted with ice-cold 5% metaphosphoric acid containing 1 mM EDTA, reduced L-dehydroascorbic acid to L-ascorbic acid, and determined using reversed-phase HPLC coupled with UV-vis detector according to Nishiyama et al. and Phillips et al. [12, 13]. Tocopherols/tocotrienals content was extracted by 2-propanol and hexane, saponified with 60% potassium hydroxide at 70°C for 30 min, and determined by normal phase HPLC-DAD according to Ye et al. [14].
2.3Quality control
We used standardized NFNAP quality-control program that included analysis of in-house control materials for juices and vegetables, blinded with food samples to monitor the accuracy of the chemical analyses. Details of this procedure are described previously [15].
2.4Data analysis and calculations
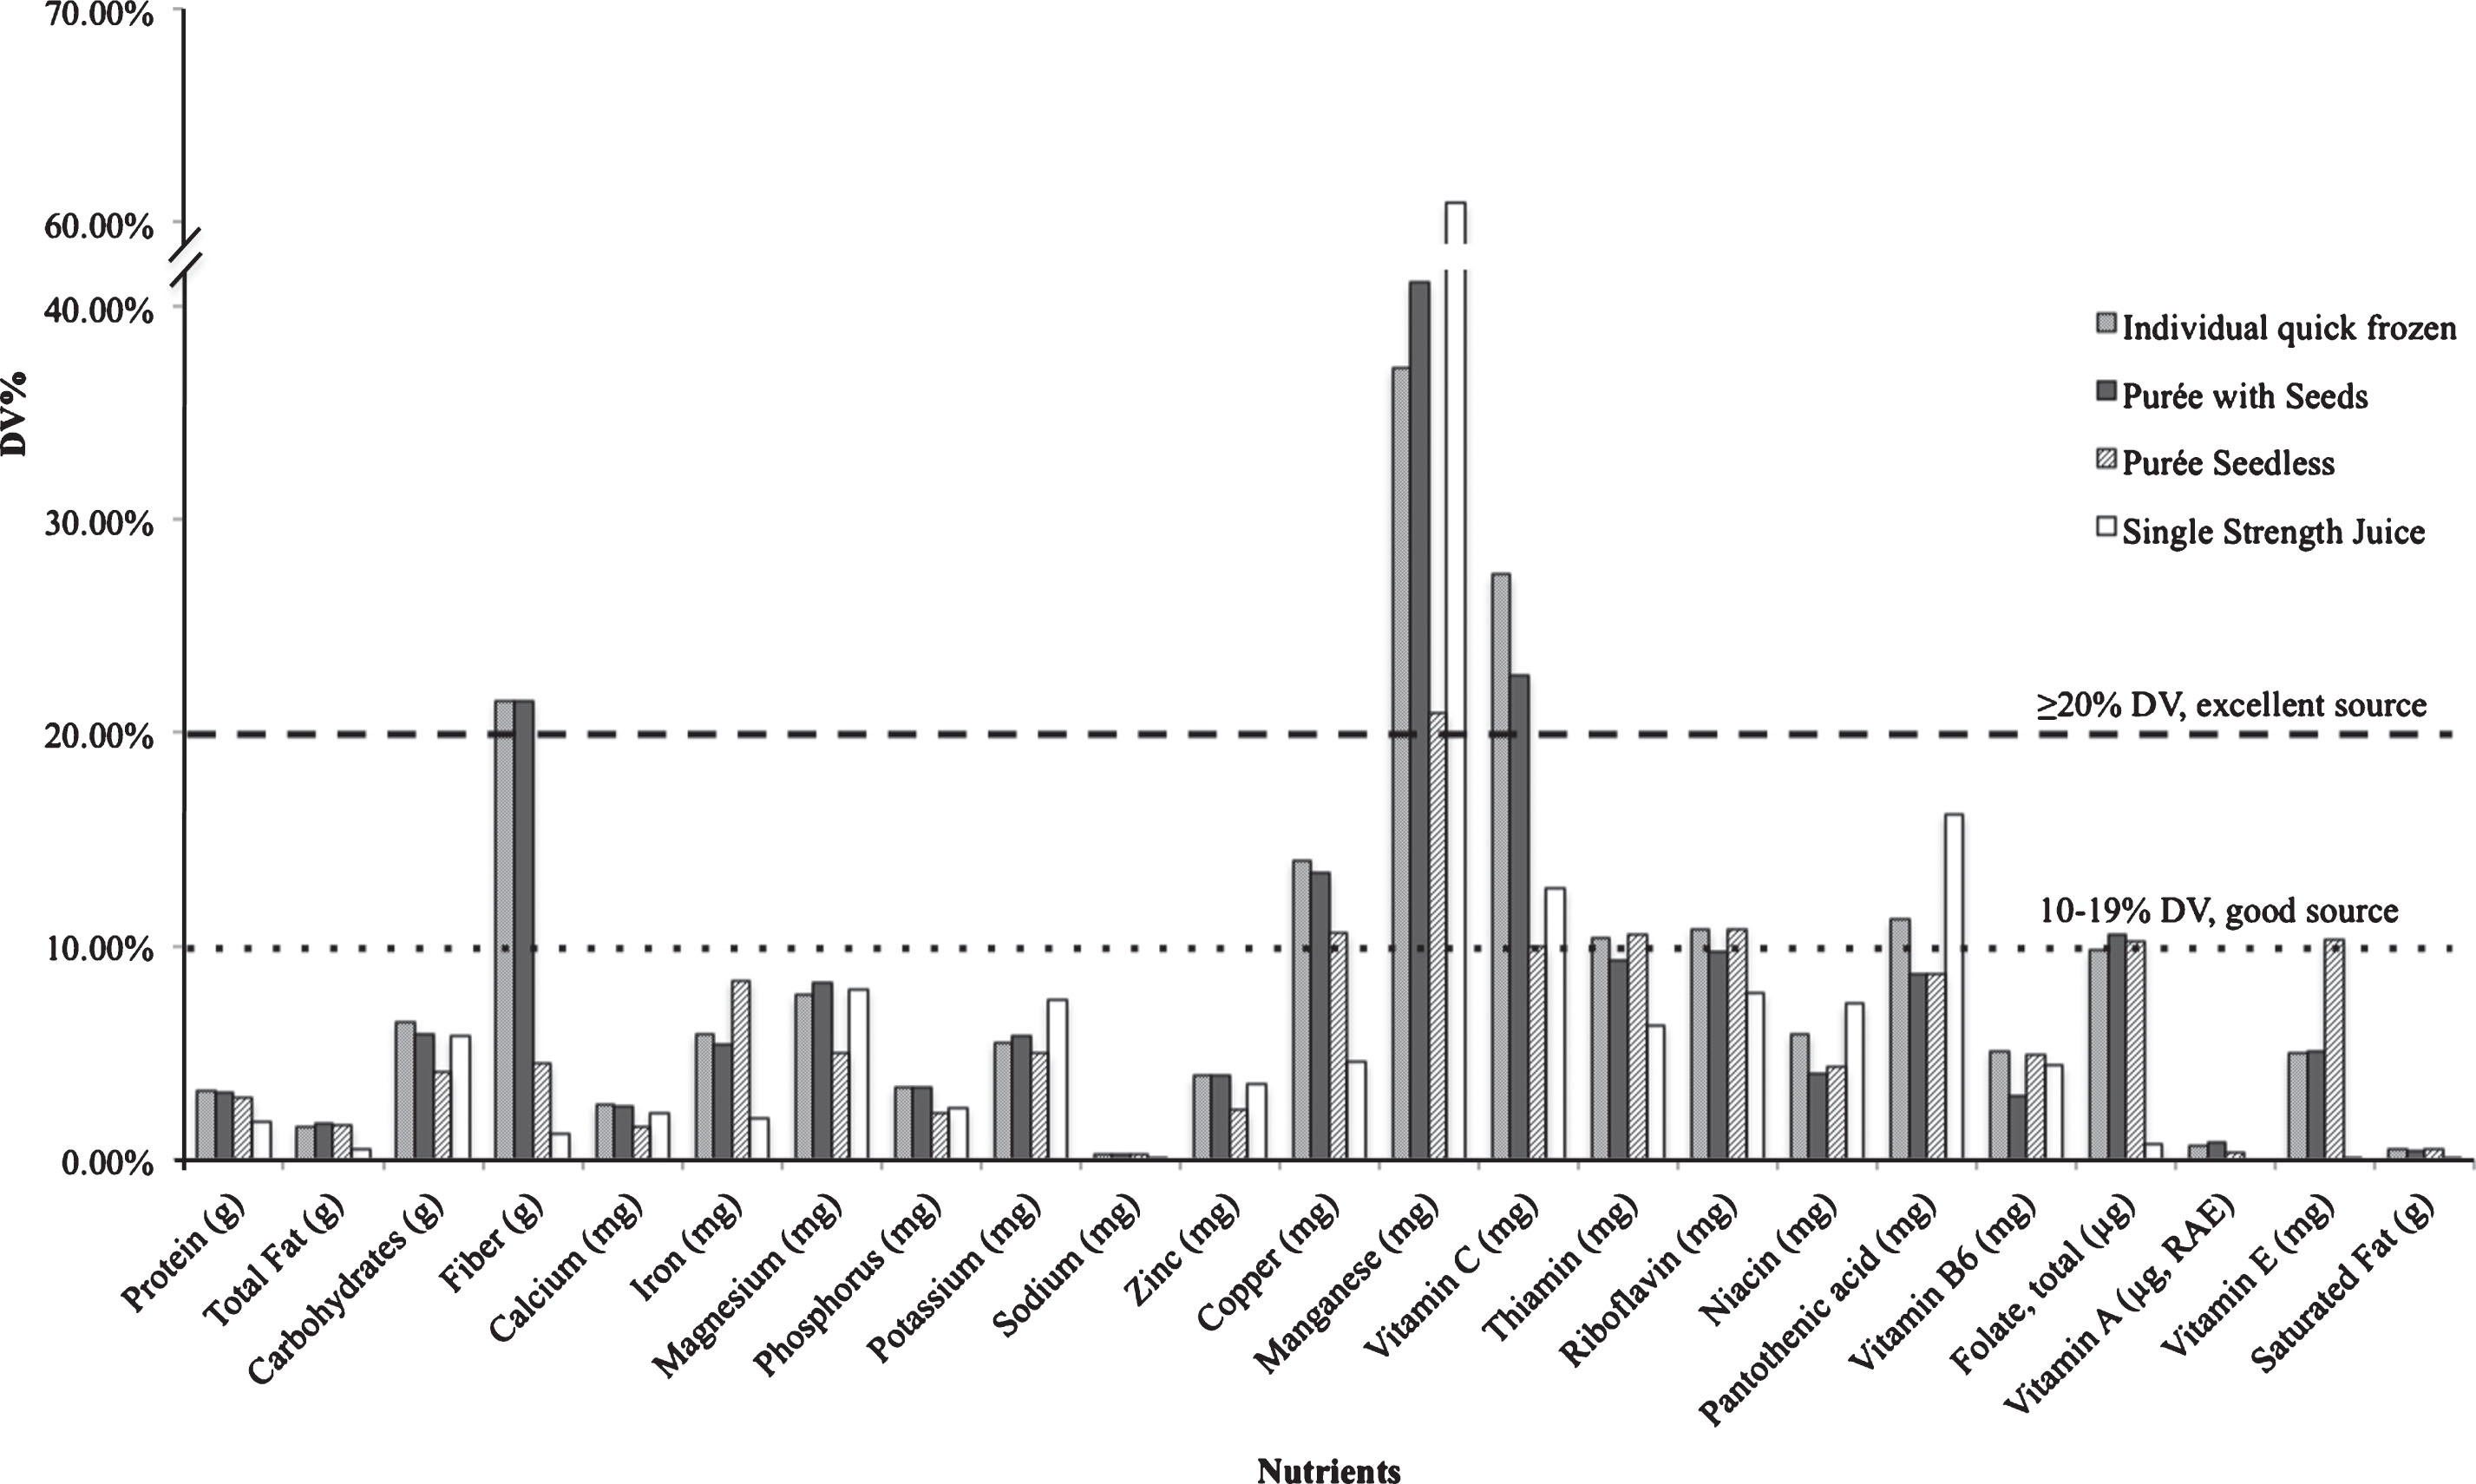
Nutrient content of processed red raspberries was also expressed in percent of Daily Value (DV) [16] (Supplementary Table 1 and Figure 1). The serving size of IQF and purée are 140 g per serving, while the serving size of juice concentrate is the amount to make 240 mL drink [17]. The dilution ratio for red raspberry juice concentrate is 7 parts water to 1 part concentrate based on juice concentrate of 41.2% moisture and 5.7 times concentrated than fresh juice (89.7% moisture). Thus, 17.5 g juice concentrate is equivalent to 100 g fresh juice.
Fig.1
Comparison of nutrient content of IQF, purée with seeds, purée seedless and juice concentrate expressed as percent of Daily Value.
2.5Statistics
Descriptive statistics were used and results presented in tabular format using means, medians, ranges, standard deviations, and percentages as appropriate. Student’s t-tests were performed on select nutrients of interest where appropriate. Statistical significance was based on 2-tailed comparison at the 5% significance level under a null hypothesis of no difference between comparators. Excel and SAS (version 9.4; SAS Institute Inc, Cary, NC) were used for statistical analyses.
3Results
3.1Samples analyzed
Samples were collected and analyzed as described in the methods. The number of samples analyzed per nutrient, per processed red raspberry product, and minimum and maximum values are displayed in Table 2.
Table 2
The nutrient content per 100 g in different forms of processed red raspberries
| Nutrients Content / 100 g | Red Raspberry, Frozen Unsweetened (IQF) | Red Raspberry, Purée (with seeds) | Red Raspberry, Purée (seedless) | Red Raspberry, Juice Concentrate4 | ||||||||||||||||
| Weighted Average1 | N2 | SE3 | Min | Max | Weighted Average | N | SE | Min | Max | Weighted Average | N | SE | Min | Max | Weighted Average | N | SE | Min | Max | |
| Proximate | ||||||||||||||||||||
| Water (g) | 85.0 | 11 | 0.8 | 82.0 | 89.6 | 85.9 | 8 | 1.2 | 82.8 | 91.1 | 89.7 | 4 | 0.6 | 88.2 | 90.8 | 41.2 | 4 | 0.5 | 40.4 | 41.9 |
| Energy (kcal) | 56 | – | – | – | – | 55 | – | – | – | – | 41 | – | – | – | – | 221 | – | – | – | – |
| Protein (g) | 1.1 | 11 | 0.07 | 0.7 | 1.6 | 1.1 | 8 | 0.04 | 0.8 | 1.3 | 1.0 | 4 | 0.1 | 0.8 | 1.4 | 3.0 | 4 | 0.1 | 2.8 | 4.4 |
| Total lipid (fat) (g) | 0.8 | 11 | 0.03 | 0.6 | 1.1 | 1.0 | 8 | 0.05 | 0.8 | 1.1 | 0.9 | 4 | 0.06 | 0.7 | 1.0 | 1.3 | 4 | 0.3 | 0.8 | 3.6 |
| Ash (g) | 0.5 | 11 | 0.02 | 0.4 | 0.6 | 0.5 | 8 | 0.03 | 0.4 | 0.6 | 0.4 | 4 | 0.04 | 0.3 | 0.5 | 1.3 | 4 | 0.04 | 1.2 | 1.4 |
| Carbohydrate, by difference (g) | 12.6 | 11 | – | – | – | 11.5 | 8 | – | – | – | 8.0 | 4 | – | – | – | 53.2 | 4 | – | – | – |
| Fiber, total dietary (g) | 4.3 | 9 | 0.5 | 2 | 5.7 | 4.3 | 2 | – | 1.5 | 4.7 | 0.9 | 2 | – | 0.6 | 1.2 | 1.1 | 3 | 0.2 | 0.8 | 1.5 |
| Sugars, total (g) | 6.5 | 11 | 0.4 | 4.9 | 8.0 | 6.6 | 8 | 0.2 | 3.9 | 7.3 | 6.0 | 4 | 1.0 | 3.2 | 7.9 | 38.2 | 4 | 2.4 | 35.7 | 41.4 |
| Minerals | ||||||||||||||||||||
| Calcium, Ca (mg) | 24 | 11 | 3.3 | 13 | 40 | 23 | 8 | 1.6 | 12 | 29 | 14 | 4 | 0.7 | 13 | 16 | 97 | 4 | 13.4 | 81 | 113 |
| Iron, Fe (mg) | 0.8 | 11 | 0.2 | 0.3 | 2.1 | 0.7 | 8 | 0.09 | 0.4 | 1.1 | 1.1 | 4 | 0.2 | 0.7 | 1.6 | 1.2 | 4 | 0.3 | 0.8 | 1.5 |
| Magnesium, Mg (mg) | 23 | 11 | 2.8 | 15 | 39 | 25 | 8 | 1.4 | 14 | 29 | 15 | 4 | 1.5 | 11 | 18 | 112 | 4 | 5.7 | 102 | 122 |
| Phosphorus, P (mg) | 30 | 11 | 4.1 | 18 | 54 | 30 | 8 | 1.8 | 18 | 38 | 20 | 4 | 0.8 | 19 | 22 | 100 | 4 | 9.7 | 70 | 115 |
| Potassium, K (mg) | 184 | 11 | 7.5 | 141 | 223 | 195 | 8 | 7.1 | 138 | 224 | 169 | 4 | 15.8 | 125 | 195 | 1178 | 4 | 33.5 | 1120 | 1290 |
| Sodium, Na (mg) | 4 | 11 | 0.01 | 4 | 4 | 4 | 8 | 0.01 | 4 | 4 | 4 | 4 | 0.006 | 4 | 4 | 10 | 4 | 1.9 | 7 | 13 |
| Zinc, Zn (mg) | 0.3 | 11 | 0.06 | 0.2 | 0.7 | 0.3 | 8 | 0.02 | 0.2 | 0.4 | 0.2 | 4 | 0.02 | 0.14 | 0.2 | 1.3 | 4 | 0.03 | 1.2 | 1.44 |
| Copper, Cu (mg) | 0.09 | 11 | 0.02 | 0.05 | 0.2 | 0.09 | 8 | 0.007 | 0.04 | 0.1 | 0.07 | 4 | 0.01 | 0.05 | 0.1 | 0.1 | 4 | 0.008 | 0.06 | 0.2 |
| Manganese, Mn (mg) | 0.6 | 11 | 0.1 | 0.3 | 1.8 | 0.7 | 8 | 0.06 | 0.4 | 1.4 | 0.3 | 4 | 0.05 | 0.2 | 0.5 | 4.7 | 4 | 0.6 | 2.7 | 11.3 |
| Vitamins | ||||||||||||||||||||
| Vitamin C, total ascorbic acid (mg) | 18 | 20 | 0.6 | 13.4 | 23.7 | 14.6 | 8 | 0.8 | 10.3 | 32.2 | 6.4 | 4 | 2.3 | 1.2 | 11.7 | 38.1 | 2 | – | 36.7 | 39.4 |
| Thiamin (mg) | 0.09 | 3 | 0.006 | 0.08 | 0.1 | 0.08 | 1 | – | – | – | 0.09 | 1 | – | – | – | 0.3 | 1 | – | – | – |
| Riboflavin (mg) | 0.1 | 3 | 0 | 0.1 | 0.1 | 0.09 | 1 | – | – | – | 0.1 | 1 | – | – | – | 0.3 | 1 | – | – | – |
| Niacin (mg) | 0.7 | 3 | 0.03 | 0.5 | 0.7 | 0.5 | 1 | – | – | – | 0.5 | 1 | – | – | – | 3.9 | 1 | – | – | – |
| Pantothenic acid (mg) | 0.4 | 3 | 0.002 | 0.3 | 0.5 | 0.3 | 1 | – | – | – | 0.31 | 1 | – | – | – | 2.7 | 1 | – | – | – |
| Vitamin B–6 (mg) | 0.06 | 3 | 0.002 | 0.06 | 0.07 | 0.04 | 1 | – | – | – | 0.06 | 1 | – | – | – | 0.3 | 1 | – | – | – |
| Folate, total (μg) | 28 | 3 | 0.8 | 24 | 36 | 30 | 1 | – | – | – | 29 | 1 | – | – | – | 9 | 1 | – | – | – |
| Carotene, beta (μg) | 10 | 6 | 3.0 | 2 | 32 | 19 | 2 | – | 9 | 20 | 8 | 2 | – | 8 | 8 | 0 | 2 | – | – | – |
| Carotene, alpha (μg) | 68 | 6 | 19.7 | 8 | 230 | 79 | 2 | – | 35 | 85 | 30 | 2 | – | 22 | 37 | 0 | 2 | – | – | – |
| Vitamin A, IU | 74 | – | – | – | – | 97 | – | – | – | – | 38 | – | – | – | – | 0 | – | – | – | – |
| Lutein + zeaxanthin (μg) | 240 | 6 | 31.3 | 163 | 320 | 469 | 2 | – | 195 | 506 | 448 | 2 | – | 355 | 540 | 0 | 2 | – | – | – |
| Vitamin E (alpha-tocopherol) (mg) | 0.8 | 3 | 0.05 | 0.3 | 1.6 | 0.8 | 1 | – | – | – | 1.5 | 1 | – | – | – | 0.06 | 2 | – | 0.06 | 0.06 |
1Weighted average was calculated according to the gross domestic and import market share (Table 1). 2Number of data points. 3Standard Error. 4Concentrated product: 17.5 g juice concentrate is equivalent to 100 g fresh juice with 89.7% moisture content.
3.2Proximate analysis
Proximate composition of the 4 forms of processed red raspberries, including dietary fiber, is presented in Table 2. Frozen red raspberry and purée with seeds contained similar proximate content profiles. Generally, removing seeds from purée resulted in lesser amounts of most nutrients than purée with seeds (Table 2). Juice concentrate was about half the moisture content (41.2 g/100 g) of other forms of processed red raspberries (ranging from 82.1 to 91.1 g/100 g) resulting in higher values of most nutrients. Energy content of IQF and purée red raspberries is between 40–56 kcal/100 g fruit. The sampled concentrate was 221 kcal/100 g sample coinciding with the increased brix (sugar) level (Table 2).
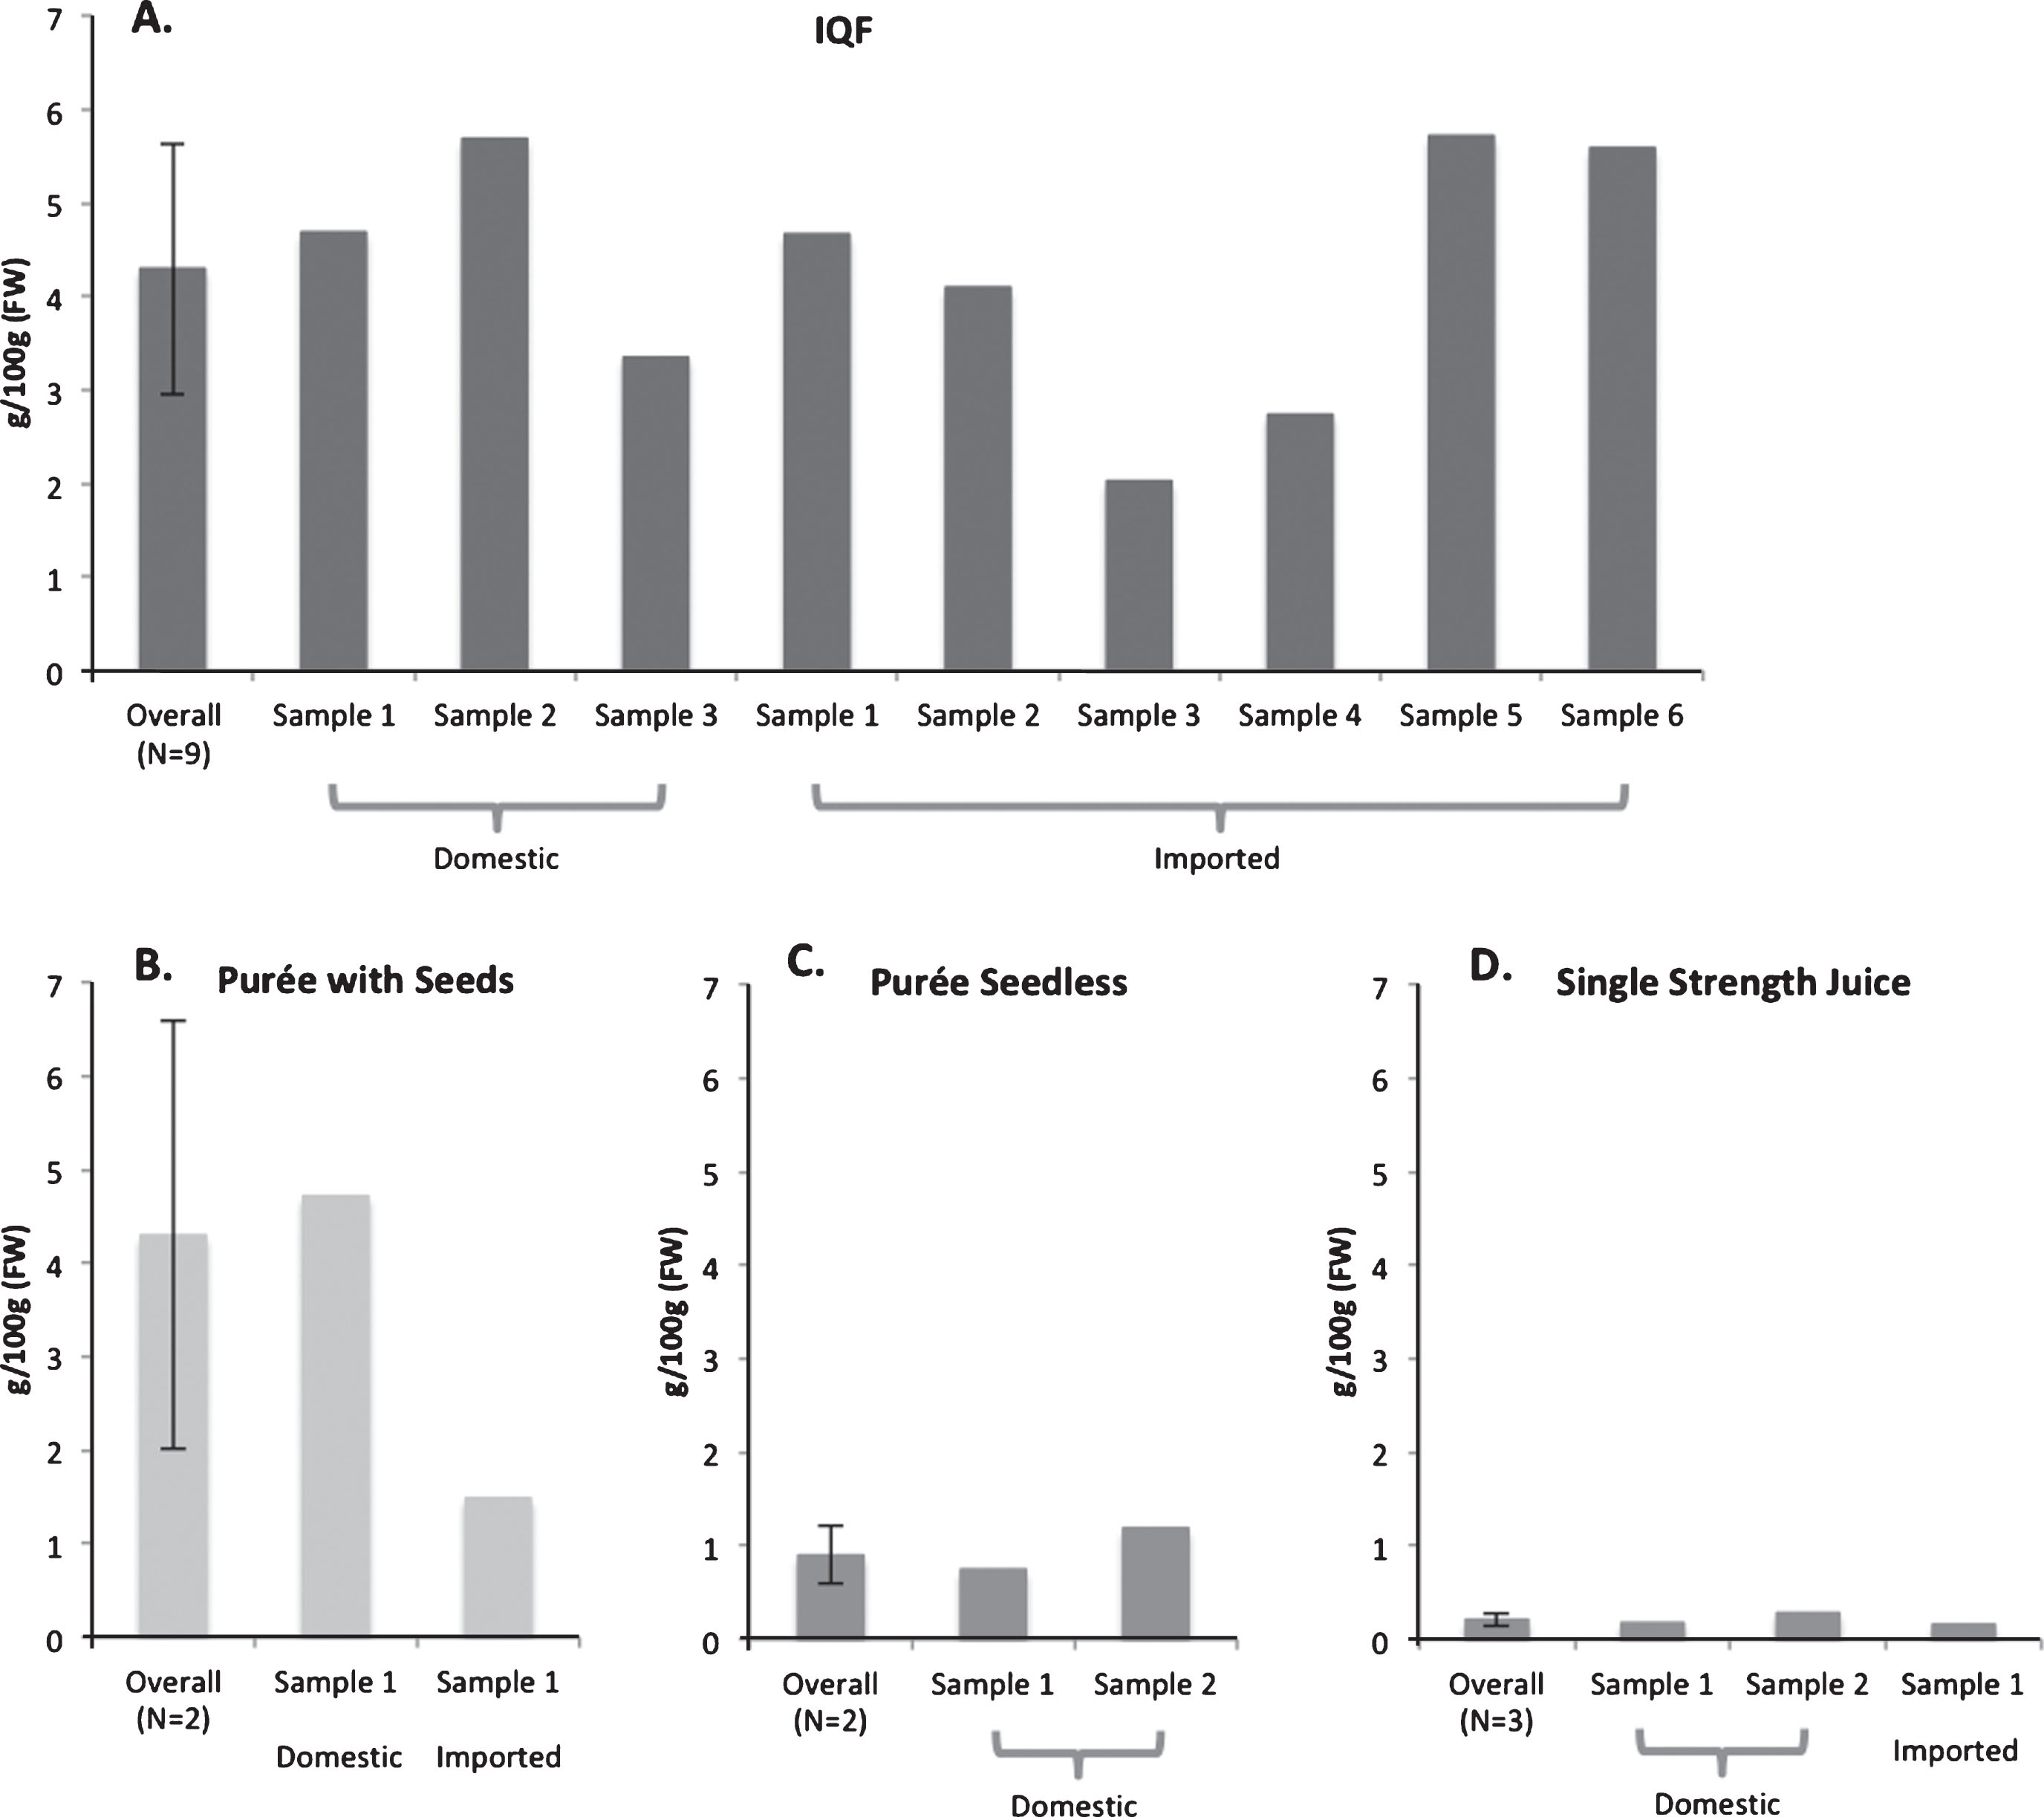
Red raspberries are among the highest (total) fiber containing fruits [1]. Figure 1 and Supplementary Table 1 show the percent DV of fiber for the different processed raspberry forms. Fiber content is greater than 20% DV for IQF and purée with seeds, which is reduced markedly when seeds are removed or raspberries are juiced. There is also relevant variation in fiber content among red raspberries within product forms. As shown in Fig. 2A, of nine samples (3 domestic and 6 imported), fiber content varied from 2.03 to 5.72 g/100 g fruit. Most berries, whether domestic or imported contained greater than 4.0 g fiber /100 g IQF fruit and three contained greater than 5.5 g/100 g IQF fruit. Two imported samples were relatively low in fiber, 2.03 and 2.75 g/100 g IQF. Few purée and concentrate samples were analyzed for total dietary fiber (Fig. 2B-D). Other than one domestic sample of purée with seeds, fiber content was low (<2 g/100 g).
Fig.2
Total dietary fiber: Samples analyzed from domestic and imported fruit prepared as individual quick frozen (IQF) whole fruit (A), purée with seeds (B), purée seedless (C), or single strength juice (D).
3.3Vitamin and Mineral content
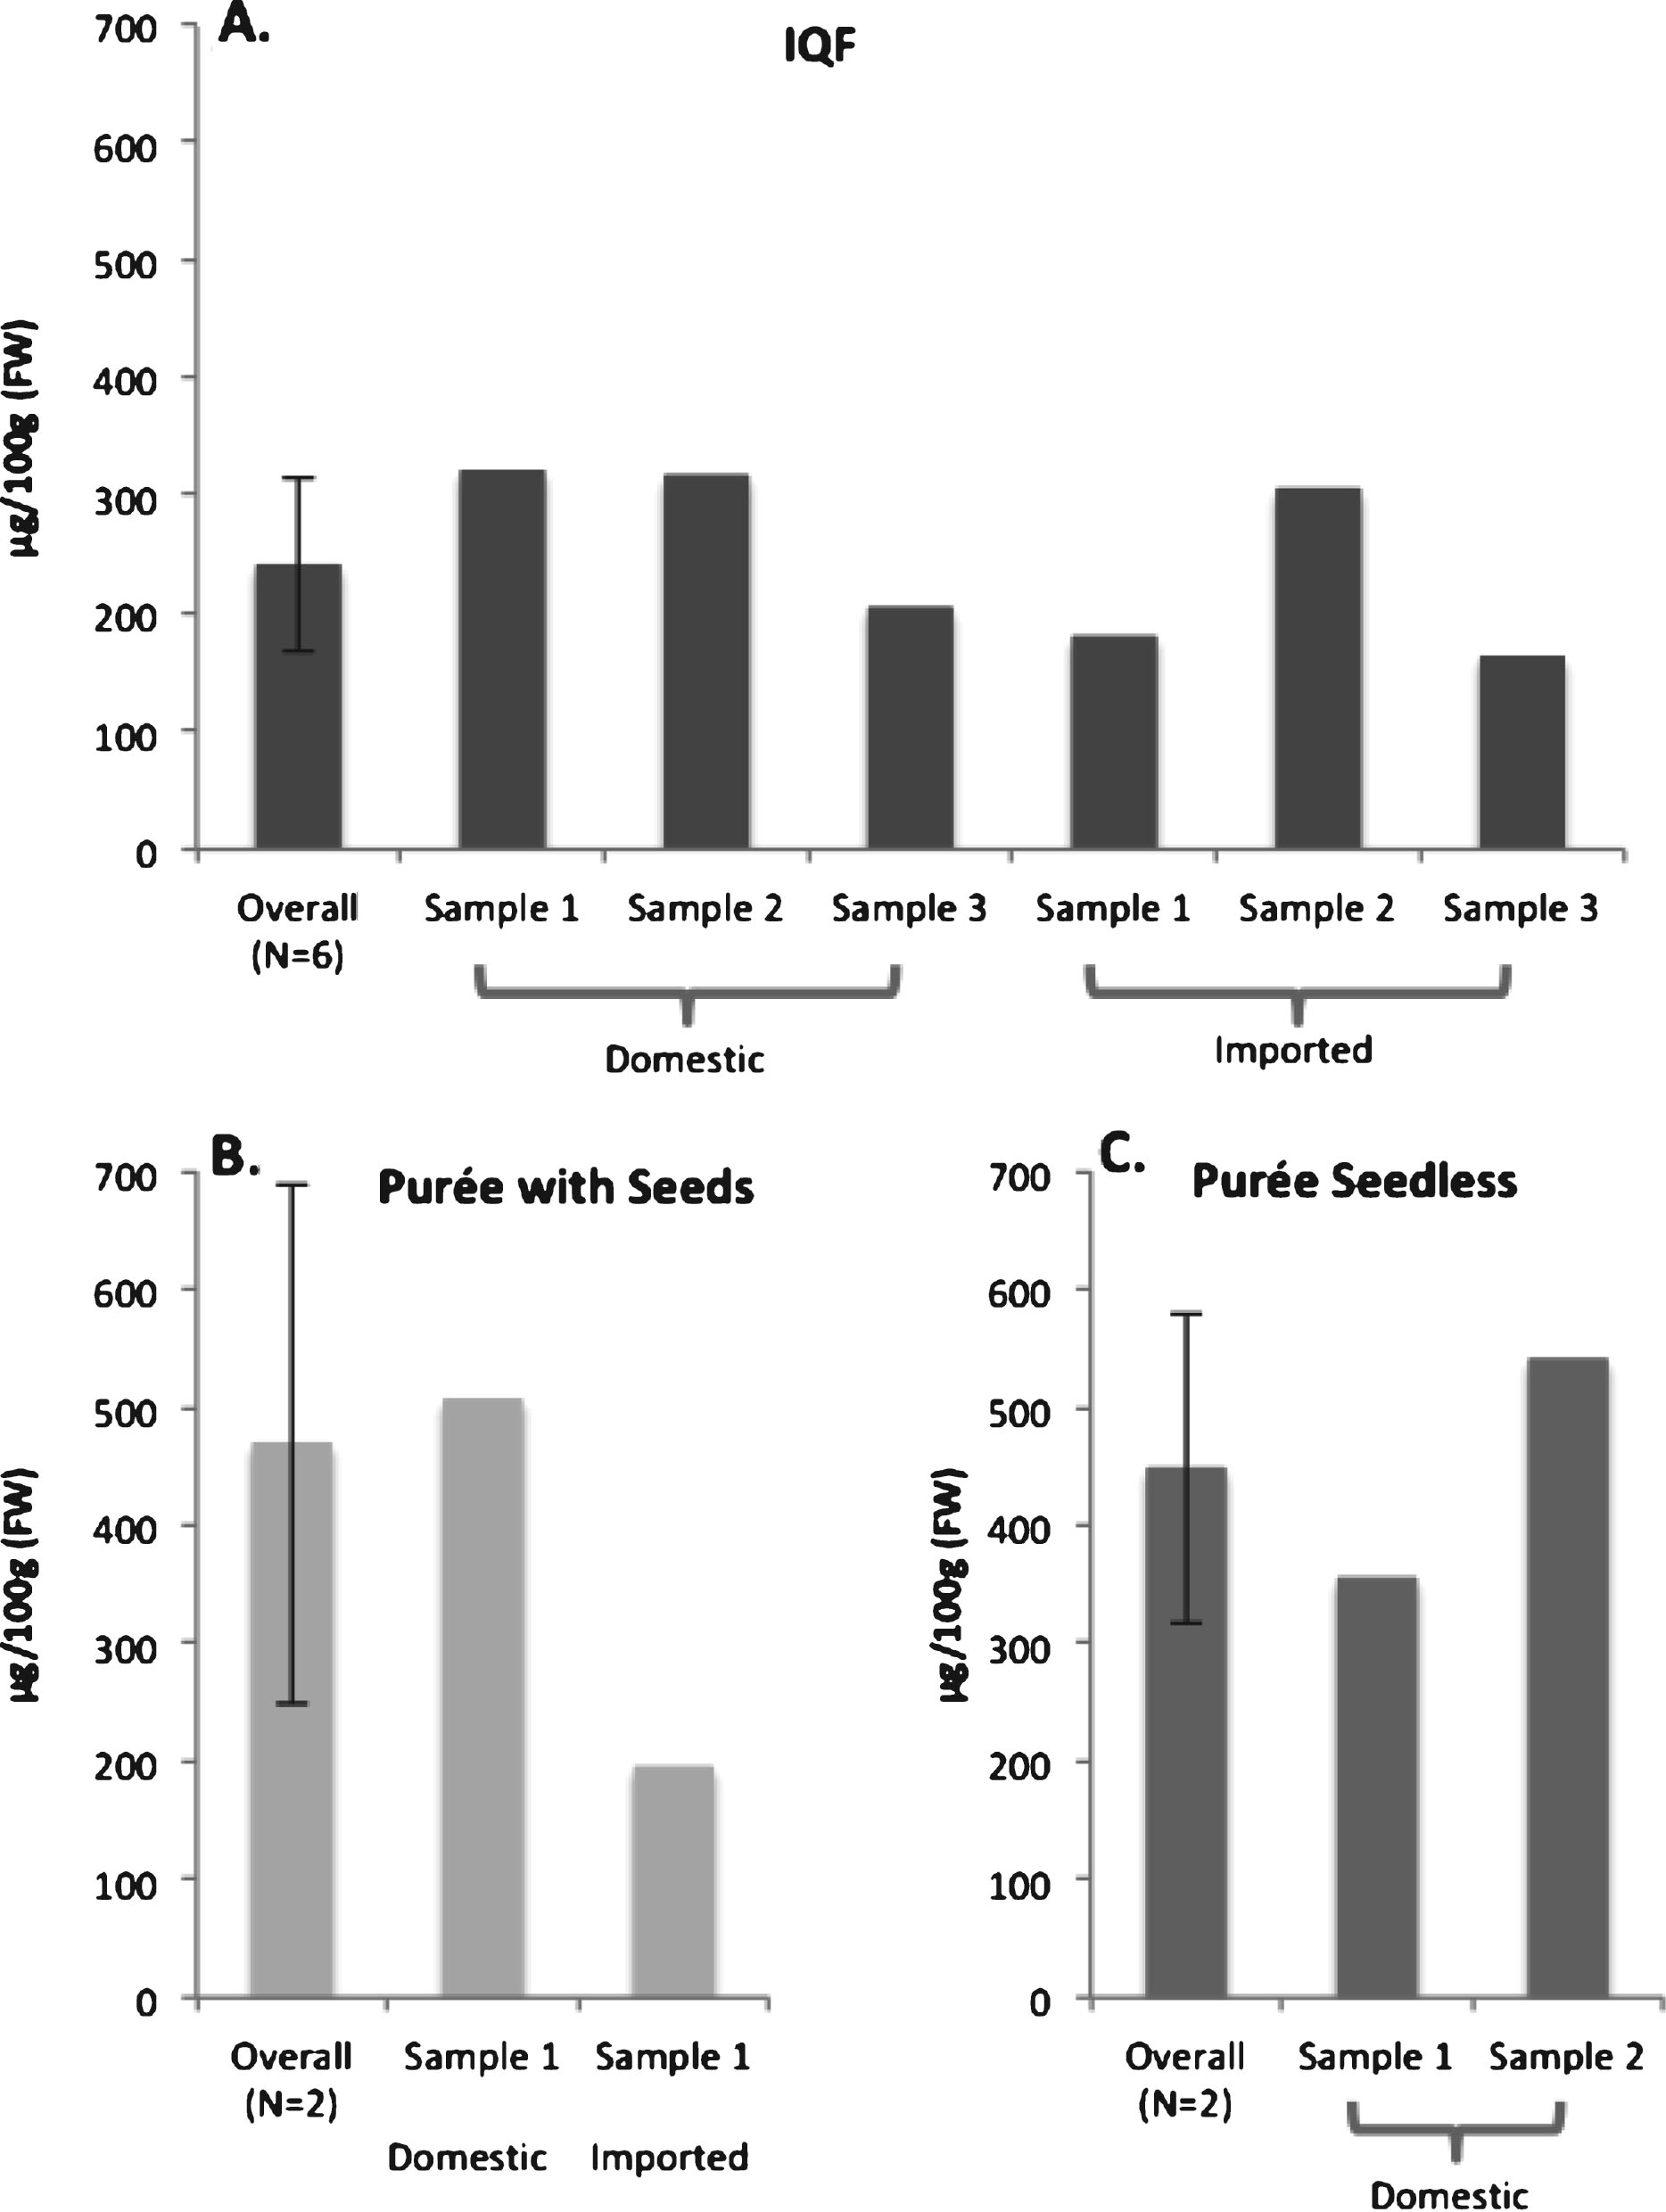
Vitamins and minerals content of processed raspberry forms are shown in Table 2. In general, IQF and purée with seeds contained similar mineral content, whereas the seedless purée had relatively lower mineral content. The carotenoids lutein and zeaxanthin also varied among IQF (240 μ g/100 g), purée with seeds (469 μg/100 g), purée seedless (448 μ g/100 g) and juice concentrate (not detected) (Fig. 4A-C). The B vitamins and folate contents were similar among IQF, purée with seeds and purée seedless. Although juice concentrate presented with high water-soluble vitamin content, its folate content was much lower than the other forms of processed red raspberries. Vitamin C content varied considerably among IQF (17.6 mg/100 g), purée with seeds (14.6 mg/100 g), purée seedless (6.4 mg/100 g) and juice concentrate (38.1 mg/100 g). In addition to variance among products, within product variance was apparent (Fig. 3A). Among four domestic and sixteen imported IQF samples analyzed, the vitamin C content ranged from 13.4 to 23.7 mg/100 g IQF. On average domestic and imported fruit were not different (17.3±3.3 and 18.5±2.7 mg Vitamin C/100 g IQF, respectively, p = 0.5). Twelve purée samples were analyzed, eight of which were with seeds and four without seeds. In general, purée with seeds had higher vitamin C content than purée without seeds (P < 0.05), and imported purée with seeds had significantly higher vitamin C content than domestic (P < 0.05) (Fig. 3B-C). Juice concentrate was higher in vitamin C as the concentrate, but not after correcting to single strength juice (original non-concentrated juice) (Table 2). Other nutrients of interest, such as potassium had similar variance among samples as previously shown, although the juice concentrate prepared to single strength had more potassium than other processed products. Values for IQF and purées were ∼180 mg/100 g fruit equivalent, whereas the juice was 225–250 mg/100 g single strength juice. Among the carotenoids, lutein/zeaxanthin are of recent interest with emerging data suggesting health benefits for visual function. Figure 4A-C shows the values for IQF (range: 163–320 ug/100 g fruit, Fig. 4A) and purée with seeds and seedless, Fig. 3B-C ranging between 195–540 ug/100 g, and no lutein/zeaxanthin detected in juice concentrate. Means are shown in Table 2.
Fig.3
Vitamin C: Samples analyzed from domestic and imported fruit prepared as individual quick frozen (IQF) whole fruit (A), purée with seeds (B), purée seedless (C), or single strength juice (D).
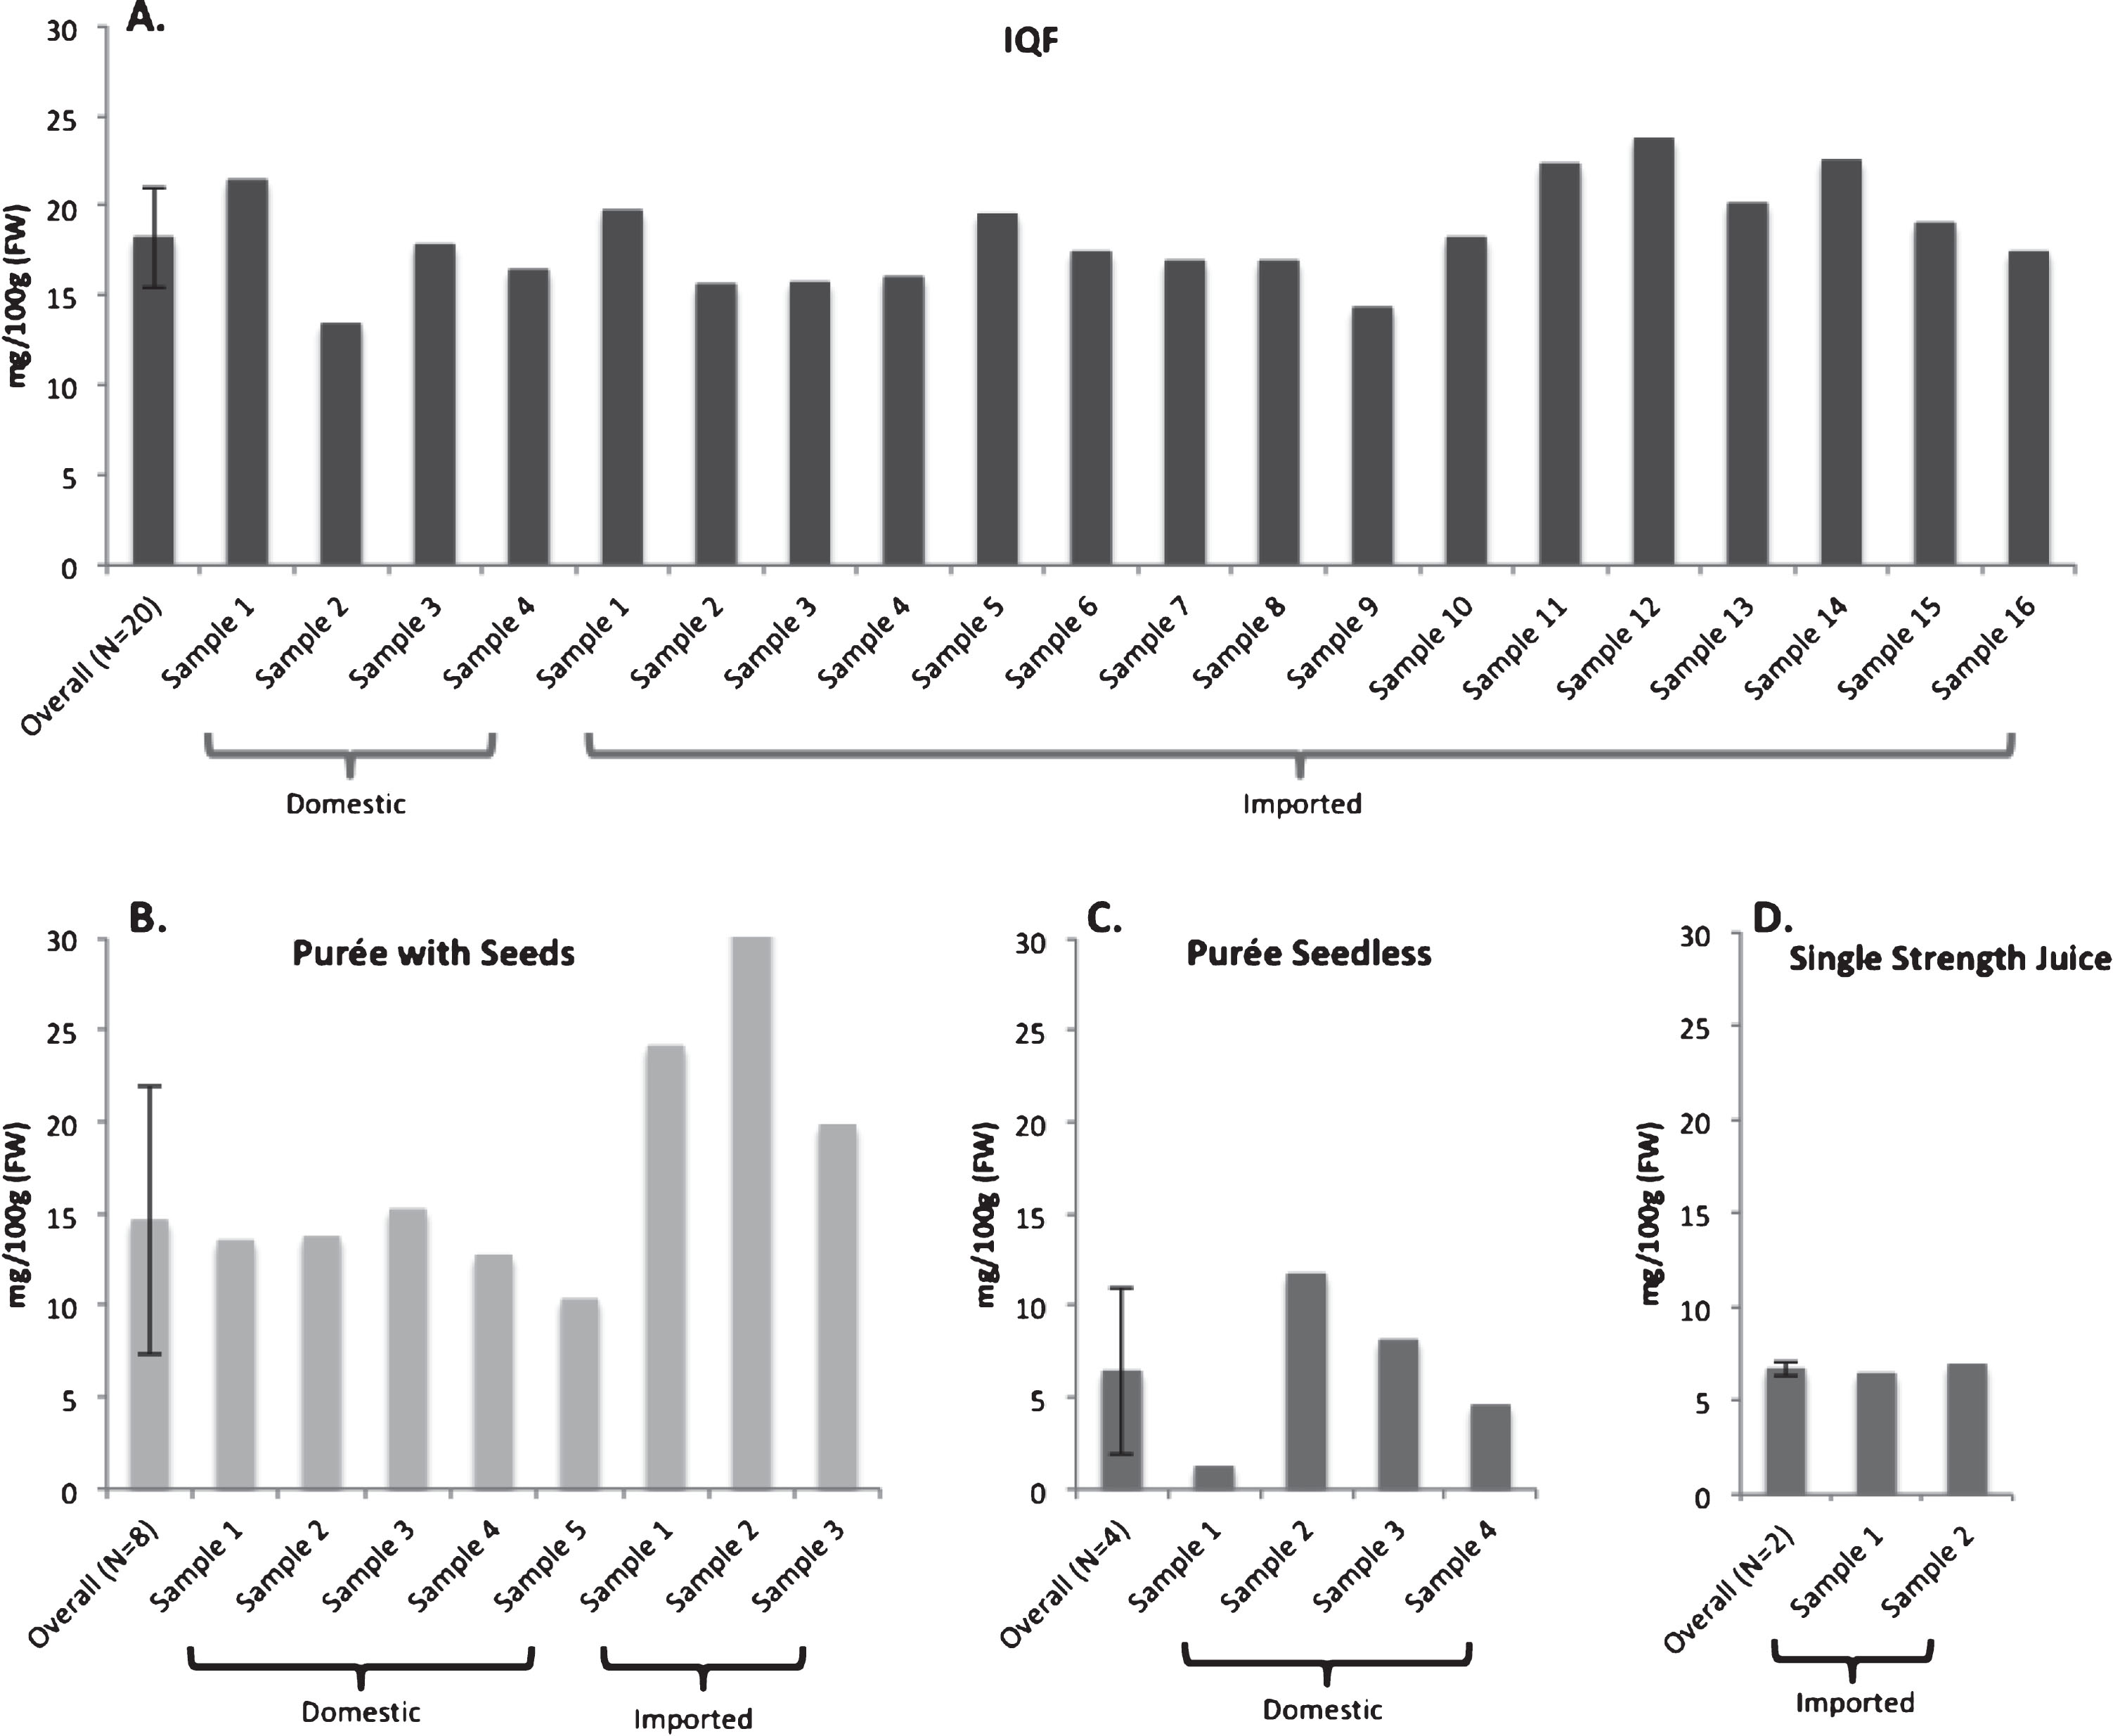
Fig.4
Lutein + zeaxanthin: Samples analyzed from domestic and imported fruit prepared as individual quick frozen (IQF) whole fruit (A), purée with seeds (B), or purée seedless (C). No Lutein + zeaxanthin detected in juice concentrate.
3.4Nutrient content of processed red raspberries expressed as percent of daily value
The nutrient content of each serving of IQF (140 g), purée with seeds (140 g), seedless purée seedless (140 g) and juice concentrate (30 g diluted to 240 ml single strength juice) expressed as percent of DV are shown in Fig. 1 and Supplementary Table 1, considering the reference caloric intake of 2,000 calories for adults and children aged 4 years and older. IQF and purée with seeds are excellent sources (≥20% DV) [18] of dietary fiber, vitamin C and manganese. Seedless purée and juice concentrate are excellent sources of manganese (≥20% DV) and a good source of vitamin C (10–19% DV) [18]. IQF, purée with seeds and seedless purée are also good sources of copper, thiamin, riboflavin, and folate (10–19% DV). IQF and juice concentrate are also good source of pantothenic acid (10–19% DV).
4Discussion
Consumer understanding of the importance of diet to health and healthy aging is growing, which increases the need for maintaining reference databases current with nutrient content information. Processed forms of fruits and vegetables improve their accessibility to consumers, and often provide multiple forms for use in varied culinary applications. However, changes in nutritional value due to processing remains a concern. As red raspberries are mainly distributed as frozen fruit, purées or in concentrated forms, our research aimed to characterize the nutrient content of these processed products and discuss the results relative to variance in nutrients content across the processed forms, difference relative to domestic vs. imported product and finally, in relation to dietary recommendations. The main findings of this research was that IQF and purée with seeds provide≥20% of the DV [18] of dietary fiber, IQF and purée with or without seeds provide 10–19% of DV of copper, thiamin, riboflavin and folate, and all forms provided 10% of the DV or greater [18] vitamin C and manganese. IQF and puréed red raspberries may also be considered a fruit source of lutein/zeaxanthin. Some variance was observed for select nutrients based upon processing form and import/domestic origin. Overall, the data provide nutrient information for the general public, health professionals and the food industry not previously available for processed IQF unsweetened red raspberries, purees, and concentrates.
Processed red raspberries are low in calories and sugar, which are important attributes for consumers when choosing fruit. Less known about processed raspberries is their fiber content. IQF and purée with seeds deliver ∼ 4.3 g fiber/100 g fruit or ∼ 8 g of fiber /100 calories. As a fruit, red raspberries make an important contribution towards meeting dietary fiber recommendations [19], particularly since most commonly consumed fruits contain ∼ half this amount of fiber. Notably, fiber content declines markedly when removing seeds as indicated by significant drops in fiber content in the seedless purée and juice concentrate. This finding is supported by other’s work showing defatted raspberry seeds contained 73.7% total dietary fiber [20]. In addition to processing methods, cultivar differences, growing region, farming practices, and timing of harvest may also play a role in nutrient content, including fiber content. Our analysis showed significant variation in fiber content of IQF samples. IQF is the least processed of the processed raspberry forms. After harvest, most fruit are quick-frozen whole within hours. As shown in Fig. 2, fiber contents of the samples varied over 2.5 fold (2.03 to 5.72 g/100 g fruit). The lowest fiber content was observed in two samples imported from two different countries; however, the highest fiber content measured were in samples from both domestically sourced and imported berries. We do not have specific varietal information, but this likely contributes to the differences observed. Other reasons may be related to seed content, which were not enumerated in the present research. Nonetheless, other than two samples that were less than 3 g/100 g fruit, six of the nine samples were greater than 4 g/100 g (n = 3) or greater than 5.5 g/100 g (n = 3), confirming red raspberries are an excellent source [18] of dietary fiber. Dietary fiber is known for its beneficial effects of reducing risk for developing certain diseases including coronary heart disease, stroke, hypertension, diabetes, obesity and gastrointestinal disorders [21]. However, according to 2013-2014 What We Eat In America [22], adults age 20 years or older, men consumed on average 18.8 g/d and women 15.4 g/d dietary fiber, much less than the recommended 38 g/d for men and 25 g/d for women [23]. The intake of IQF and red raspberry purée with seeds could help to increase dietary fiber intake in the modern low-fiber diet.
Vitamin C is an important nutrient in red raspberries, and is generally sensitive to destruction during processing, shipping and storage. Studies reported that long-term frozen storage caused significant loss of vitamin C [24–27]. The vitamin C contents in the red raspberries frozen and purée with seeds were in accordance with previous studies of frozen stored red raspberries [20, 25]. The lower vitamin C content in the purée seedless might result from de-seeding process of purée. The juice concentrate was also lower, likely due to processing. Variance in Vitamin C did not indicate significant differences between imported and domestic IQF fruit; however, differences in the purée with seeds were observed suggesting domestic purée contained about 50% of the Vitamin C of imported purée with seeds. The reason for the difference is not clear, but may have to do with regional differences in puréeing methods or other proprietary processes associated with puréeing. Vitamin C is an essential dietary nutrient, involved in various metabolic processes beyond its classic known deficiency disease, scurvy, a pathological condition leading to blood vessel fragility and connective tissue damage [28]. Vitamin C is also involved in the biosynthesis of collagen, cholesterol, amino acids and some peptide hormone [28]. According to the 2013-2014 What We Eat In America, Americans also consumed less vitamin C than the recommended 90 mg/d for men and 75 mg/day for women [29]. Thus, processed red raspberries are an excellent option for increasing vitamin C in the diet.
In addition to fiber and vitamin C, processed red raspberries also contain notable amounts of manganese and some B vitamins (thiamin, riboflavin, pantothenic and folate) based on % DV (Fig. 1 and Supplementary Table 1). Manganese plays a vital role in the constitution and activation of certain enzymes related to energy metabolism, digestion, immune function, reproduction, and antioxidant defenses [30]. Manganese containing foods are varied. Legumes, nuts, rice and whole grains contain the highest levels of manganese, while leafy green vegetables, tea, chocolate and some fruits contain moderate levels. Red raspberries are among the richest fruit sources of manganese.
B vitamins are important co-enzymes performing essential roles in cellular function and their deficiency is a leading cause of neurological impairment. Recently, chronic B vitamins deficiency has been related to some neurodegenerative diseases such as Alzheimer’s disease, Parkinson’s disease, and amyotrophic lateral sclerosis [31]. Thus, the regular intake of foods rich in B vitamins, like processed red raspberries, help to maintain essential physiological functions and reduce the risks of several diseases.
Finally, lutein/zeaxanthin content of frozen / IQF and purée red raspberries is worth mentioning. IQF and purée red raspberry products ranged from 163–540 μg lutein/zeaxanthin/100 g fruit product. The mean lutein/zeaxanthin content of IQF was 240 μg/100 g and for the purée it was even higher at 399±158 μg/100 g fruit. Lutein/zeaxanthin are the only carotenoids that accumulate in the human retina and constitute macular pigment owing to its well-studied role in vision; and specifically, improving visual function and reducing age-related macular degeneration [32]. Lutein/zeaxanthin are non-essential bioactive compounds and have been proposed for the review process to establish a DRI [33]. Few fruits contain much lutein and zeaxanthin and processed raspberries appear to be among the highest [34]. As guidance and/or DRIs are developed, processed red raspberries (IQF) or purée will be an important choice for consumers to consider for macular pigment sufficiency.
Processed red raspberries have been studied for their health benefits in models of age-related chronic diseases. The consumption of frozen red raspberries compared to a control lowered postprandial hyperglycemia and inflammation in adults with prediabetes or diabetes [35, 36]. Red raspberry juice intake improved the lipids profile, antioxidant status and reduced the risk of developing atherosclerosis in hamsters consuming an atherogenic diet [37]. Adding raspberry juice and purée to a high-fat diet decreased weight gain in a diet-induced obesity mouse model [38], and consuming a diet supplemented with freeze-dried red raspberry extract improved motor function in an aged rat model [39]. The health-promoting benefits of processed red raspberries could be attributed to their high nutrient quality, low calorie and sugar content, as well as high polyphenol content, especially anthocyanins, which has been quantified previously [40–42].
The research had many strengths in its use of validated NFNAP procedures including study design, sampling protocol, laboratory methods and quality control procedures to produce a comprehensive nutrient analysis of commonly consumed processed raspberry products in the USA food marketplace. Limitations include challenges with sampling processed products used in food service and products that are not standard grocery outlet products to be sampled through standard procedures, such as purée and juice concentrates. In addition, major brands were not available in all grocery outlets. Furthermore, not all samples were analyzed for all nutrients due to cost constraints, hence there were limited observations for some nutrients.
5Conclusion
Processed raspberries deliver high nutrient quality and a comprehensive analysis of these nutrients specific to products purchased and consumed in the USA is now available in the new USDA FoodData Central. Processed IQF and purée red raspberries with seeds meet FDA criteria based on % DV for being excellent sources [18] of dietary fiber, vitamin C, and manganese and some processed forms are good sources of copper, thiamin, riboflavin, pantothenic, folate and vitamin E. Nutrient content varies within the same form of processed red raspberries and among different forms of raspberries. Knowledge of this variance can help food industry when designing foods products for maximum nutrient quality. Overall, processed red raspberries provide consumers and the food industry with cost-effective options to increase their intake of a variety of nutrients of public health concern with few calories. They are also fruits that contain a variety of bioactive compounds including lutein/zeaxanthin and other compounds of interest for their health benefits and roles in reducing risk of modern day chronic diseases.
Conflict of interest
There are no conflicts to declare.
Supplementary material
[1] The supplementary material is available in the electronic version of this article: https://dx.doi.org/10.3233/NHA-190072.
Acknowledgments and Funding
The research was supported by the National Processed Raspberry Council. We thank Dr. Ying Li for thorough and constructive review of paper.
References
1 | Burton-Freeman BM , Sandhu AK , Edirisinghe I . Red Raspberries and Their Bioactive Polyphenols: Cardiometabolic and Neuronal Health Links. Adv Nutr. (2016) ;7: (1):44-65. |
2 | Ahuja JK , Moshfegh AJ , Holden JM , Harris E . USDA food and nutrient databases provide the infrastructure for food and nutrition research, policy, and practice. J Nutr. (2013) ;143: (2):241S-9S. |
3 | Perkins-Veazie P , Fernandez G . Postharvest Handling and Storage of Blackberries and Raspberries. 2013 [updated 2013 Mar 25; cited 2018 Jul 13]. Available from: https://rubus.ces.ncsu.edu/rubus-postharvest-handling-and-storage-of-blackberries-and-raspberies/ |
4 | Pehrsson P , Haytowitz D , Holden J . The USDA’s national food and nutrient analysis program: Update 2002. J Food Compos Anal. (2003) ;16: (3):331-41. |
5 | Trainer D , Pehrsson PR , Haytowitz DB , Holden JM , Phillips KM , Rasor AS , et al. Development of sample handling procedures for foods under USDA’s National Food and Nutrient Analysis Program. J Food Compos Anal. (2010) ;23: (8):843-51. |
6 | Bhagwat SA , Patterson KY , Holden JM . Validation study of the USDA’s Data Quality Evaluation System. J Food Compos Anal. (2009) ;22: (5):366-72. |
7 | Ahuja JK , Pehrsson PR , Haytowitz DB , Wasswa-Kintu S , Nickle M , Showell B , et al. Sodium monitoring in commercially processed and restaurant foods. Am J Clin Nutr. (2015) ;101: (3):622-31. |
8 | Pehrsson P , Perry C , Daniel M . ARS, USDA updates food sampling strategies to keep pace with demographic shifts. Procedia Food Sci. (2013) ;2: :52-59. |
9 | National Processed Raspberry Council, Lyndon, WA. [cited 2018 Jul 13]. Available from: http://www.redrazz.org |
10 | US Department of Agriculture, Agricultural Research Service, Nutrient Data Laboratory. USDA National Nutrient Database for Standard Reference, release 28. 2015 [cited 2018 Jul 13]. Available from: https://www.ars.usda.gov/northeast-area/beltsville-md-bhnrc/beltsville-human-nutrition-research-center/nutrient-data-laboratory/docs/usda-national-nutrient-database-for-standard-reference/ |
11 | Craft NE . Chromatographic techniques for carotenoid separation. In: Wrolstad RE , editor. Current Protocols in Food Analytical Chemistry. New York: John Wiley & Sons Inc.; (2001) . p. F2.3.1-F2.3.12. |
12 | Nishiyama I , Yamashita Y , Yamanaka M , Shimohashi A , Fukuda T , Oota T . Varietal difference in vitamin C content in the fruit of kiwifruit and other actinidia species. J Agric Food Chem, (2004) ;52: (17):5472-5. |
13 | Phillips KM , Wunderlich KM , Holden JM , Exler J , Gebhardt SE , Haytowitz DB , Beecher GR , Doherty RF . Stability of 5-methyltetrahydrofolate in frozen fresh fruits and vegetables. Food Chem. (2005) ;92: (4):587-95. |
14 | Ye L , Landen WO , Eitenmiller RR . Liquid chromatographic analysis of all-trans-retinyl palmitate, beta-carotene, and vitamin E in fortified foods and the extraction of encapsulated and non-encapsulated retinyl palmitate. J Agric Food Chem. (2000) ;48: (9):4003-8. |
15 | Phillips KM , Patterson KY , Rasor AS , Exler J , Haytowitz DB , Holden JM , et al. Quality-control materials in the USDA National Food and Nutrient Analysis Program (NFNAP). Anal Bioanal Chem. (2006) ;384: (6):1341-55. |
16 | US Food & Drug Administration. Code of Federal Regulations Title 21, Part 101 Food Labeling, Section 101.9 Nutrition labeling of food, revised April 2017 [updated 2018 Sep 4; cited 2019 Jun 12] Available from: https://www.accessdata.fda.gov/scripts/cdrh/cfdocs/cfcfr/CFRSearch.cfm?fr=101.9 |
17 | US Food & Drug Administration. Code of Federal Regulations Title 21, Part 101 Food Labeling, Section 101.12 Reference amounts customarily consumed per eating occasion, revised April 2017 [updated 2018 Sep 4; cited 2019 Jun 12] Available from: https://www.accessdata.fda.gov/scripts/cdrh/cfdocs/cfcfr/CFRSearch.cfm?fr=101.12 |
18 | US Food & Drug Administration. Code of Federal Regulations Title 21, Part 101 Food Labeling, Section 101.54 Nutrient content claims for “good source,” “high,” “more,” and “high potency, revised April 2017 [updated 2018 Sep 4; cited 2019 Jun 12] Available from: https://www.accessdata.fda.gov/scripts/cdrh/cfdocs/cfcfr/CFRSearch.cfm?fr=101.54 |
19 | US Department of Agriculture. Dietary Guidelines For Americans 2015-2020. [updated 2018 Sep 5; cited 2019 Jun 12] Available from: https://www.choosemyplate.gov/dietary-guidelines |
20 | Kosmala M , Zduńczyk Z , Juśkiewicz J , Jurgoński A , Karlińska E , Macierzyński J , et al. Chemical composition of defatted strawberry and raspberry seeds and the effect of these dietary ingredients on polyphenol metabolites, intestinal function, and selected serum parameters in rats. J Agric Food Chem. (2015) ;63: (11):2989-96. |
21 | Otles S , Ozgoz S . Health effects of dietary fiber. Acta Sci Pol Technol Aliment. (2014) ;13: (2):191-202. |
22 | US Department of Agriculture, Agricultural Research Service. What we eat in America, NHANES 2015-2016. [updated 2018 Jul 31; cited 2019 Jun 12]. Available from: https://www.ars.usda.gov/northeast-area/beltsville-md-bhnrc/beltsville-human-nutrition-research-center/food-surveys-research-group/docs/wweia-data-tables/ |
23 | National Institutes of Health, Office of Dietary Supplements. Dietary Reference Intakes (DRIs): Recommended Dietary Allowances and Adequate Intakes, Total Water and Macronutrients. 2011 [cited 2018 Jul 13]. Available from: https://www.ncbi.nlm.nih.gov/books/NBK56068/table/summarytables.t4/?report=objectonly |
24 | de Ancos B , González EM , Cano MP . Ellagic acid, vitamin C, and total phenolic contents and radical scavenging capacity affected by freezing and frozen storage in raspberry fruit. J Agric Food Chem. (2000) ;48: (10):4565-70. |
25 | Mullen W , Stewart AJ , Lean ME , Gardner P , Duthie GG , Crozier A . Effect of freezing and storage on the phenolics, ellagitannins, flavonoids, and antioxidant capacity of red raspberries. J Agric Food Chem. (2002) ;50: (18):5197-201. |
26 | Poiana M , Moigradean D , Raba D , Alda L , Popa M . The effect of long-term frozen storage on the nutraceutical compounds, antioxidant properties and color indices of different kinds of berries. J Food Agric Environ. (2010) ;8: (1):54-8. |
27 | Veberic R , Stampar F , Schmitzer V , Cunja V , Zupan A , Koron D , et al. Changes in the contents of anthocyanins and other compounds in blackberry fruits due to freezing and long-term frozen storage. J Agric Food Chem. (2014) ;62: (29):6926-35. |
28 | Grosso G , Bei R , Mistretta A , Marventano S , Calabrese G , Masuelli L , et al. Effects of Vitamin C on health: A review of evidence. Front Biosci. (2013) ;18: :1017-29. |
29 | National Institutes of Health, Office of Dietary Supplements. Dietary Reference Intakes (DRIs): Recommended Dietary Allowances and Adequate Intakes, Vitamins. 2011 [cited 2018 Jul 13]. Available from: https://www.ncbi.nlm.nih.gov/books/NBK56068/table/summarytables.t2/?report=objectonly |
30 | Chen P , Chakraborty S , Mukhopadhyay S , Lee E , Paoliello M , Bowman A , et al. Manganese homeostasis in the nervous system. J Neurochem. (2015) ;134: (4):601-10. |
31 | Sechi G , Sechi E , Fois C , Kumar N . Advances in clinical determinants and neurological manifestations of B vitamin deficiency in adults. Nutr Rev. (2016) ;74: (5):281-300. |
32 | Johnson EJ . Role of lutein and zeaxanthin in visual and cognitive function throughout the lifespan. Nutr Rev. (2014) ;72: (9):605-12. |
33 | Ranard KM , Jeon S , Mohn ES , Griffiths JC , Johnson EJ , Erdman JW . Dietary guidance for lutein: Consideration for intake recommendations is scientifically supported. Eur J Nutr. (2017) ;56: (Suppl 3):37-42. |
34 | Al-Ahmary KM . The carotenoids of some food stuffs in Saudi Arabia. Int J Food Sci Nutr. (2010) ;61: (8):823-8. |
35 | Xiao D , Zhu L , Edirisinghe I , Fareed J , Brailovsky Y , Burton-Freeman B . Attenuation of postmeal metabolic indices with red raspberries in individuals at risk for diabetes: A randomized controlled trial. Obesity. (2019) ;27: (4):542-50. |
36 | Schell J , Betts NM , Lyons TJ , Basu A . Raspberries improve postprandial glucose and acute and chronic inflammation in adults with type 2 diabetes. Annals of Nutrition and Metabolism. (2019) ;74: (2):165-74. |
37 | Suh JH , Romain C , González-Barrio R , Cristol JP , Teissèdre PL , Crozier A , Rouanet JM . Raspberry juice consumption, oxidative stress and reduction of atherosclerosis risk factors in hypercholesterolemic golden Syrian hamsters. Food Funct. (2011) ;2: :400-405. |
38 | Luo T , Miranda-Garcia O , Adamson A , Sasaki G , Shay NF . Development of obesity is reduced in high-fat fed mice fed whole raspberries, raspberry juice concentrate, and a combination of the raspberry phytochemicals ellagic acid and raspberry ketone. J Berry Res. (2016) ;6: :213-223. |
39 | Galli RL , Carey AN , Luskin KA , Bielinski DF . Red raspberries can improve motor function in aged rats. J Berry Res. (2016) ;6: :97-103. |
40 | Wu X , Sun J , Ahuja J , Haytowitz DB , Chen P , Burton-Freeman B , Pehrsson PR . Anthocyanins in processed red raspberries on the US market. J Berry Res. (2019) ;Pre-press:1-11. |
41 | Mullen W , Lean ME , Crozier A . Rapid characterization of anthocyanins in red raspberry fruit by high-performance liquid chromatography coupled to single quadrupole mass spectrometry. J Chromatogr A. (2002) ;966: :63–70. |
42 | Zhang X , Sandhu A , Edirisinghe I , Burton-Freeman B . An exploratory study of red raspberry (Rubus idaeus L.) (poly)phenols/metabolites in human biological samples. Food Funct. (2018) ;9: (2):806-18. |


